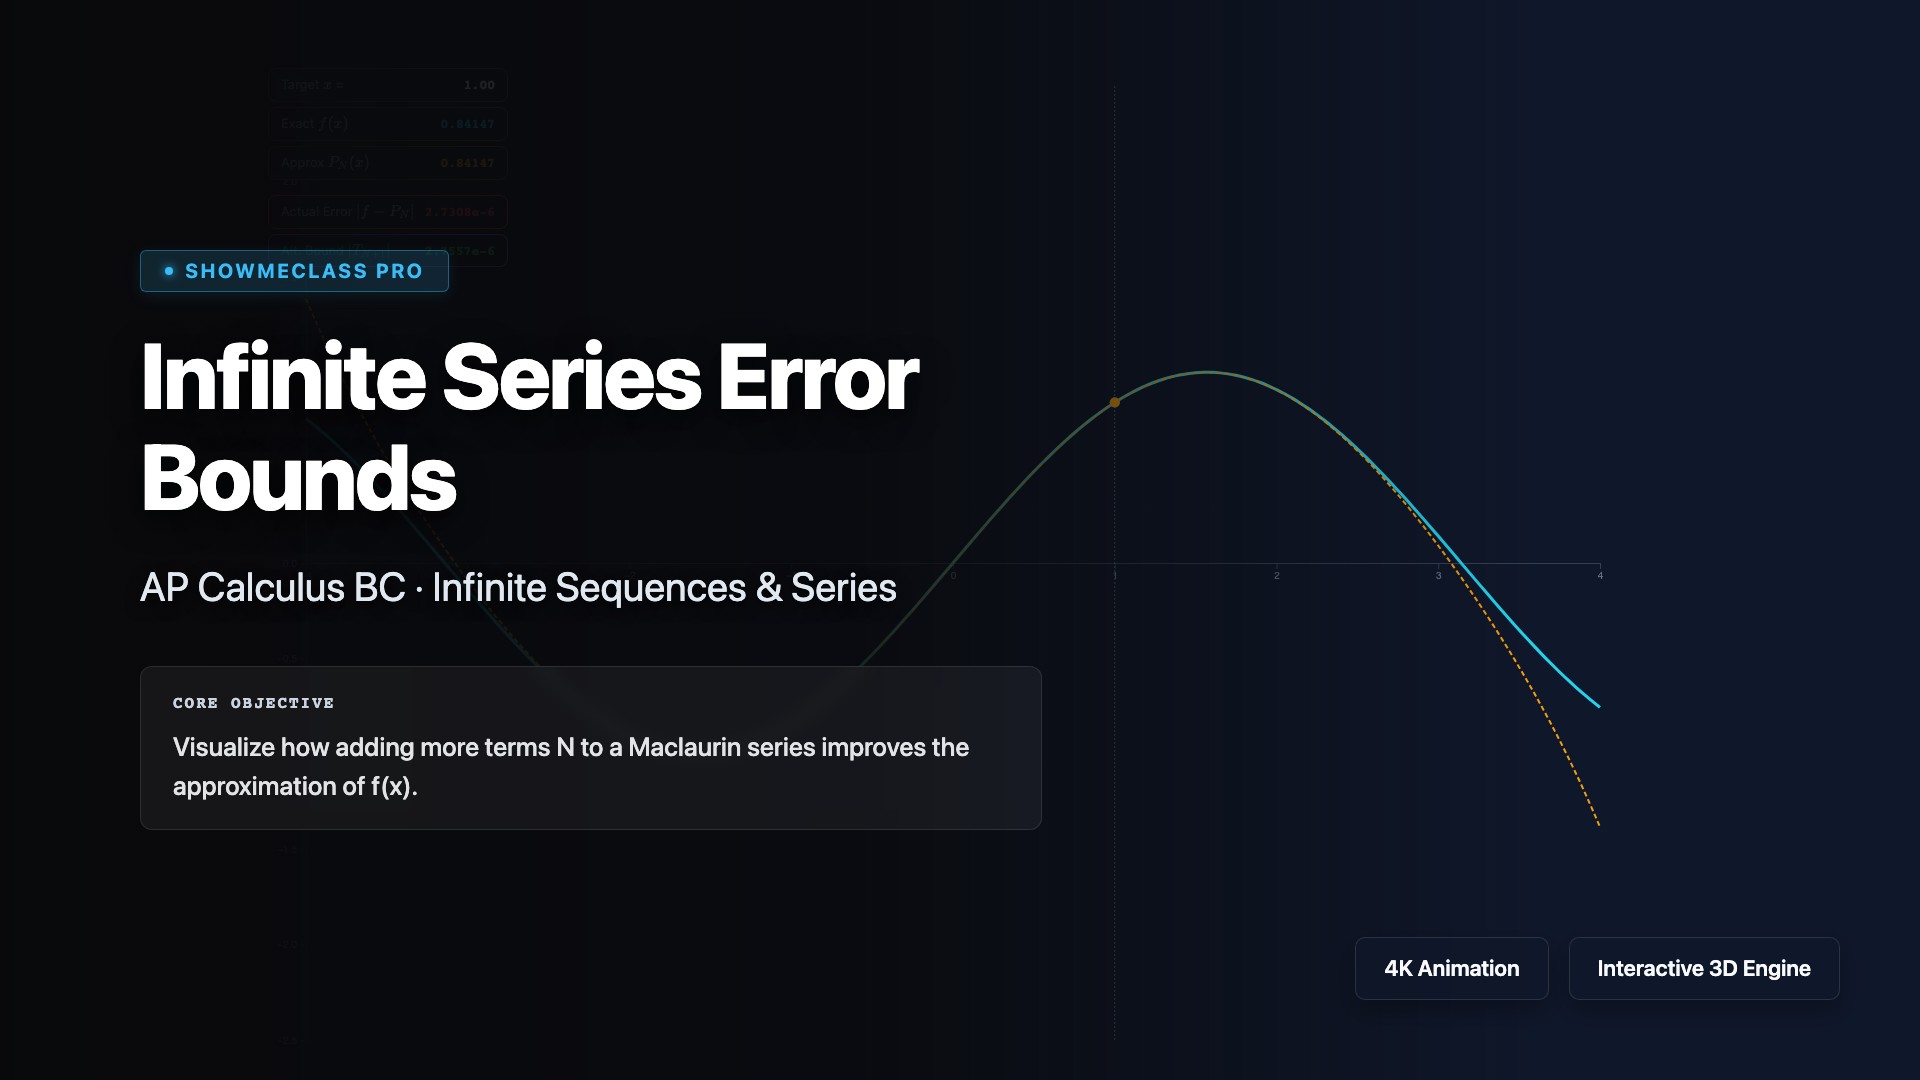
Infinite Series Error Bounds
Estimate the error when approximating infinite series with partial sums using error bound theorems. For alternating series, the error is bounded by the absolute value of the first omitted term. For Taylor series, use the Lagrange error bound |Rₙ(x)| ≤ M|x-a|^(n+1)/(n+1)! where M is the maximum of |f^(n+1)| on the interval. Practice determining how many terms are needed to achieve a desired accuracy.
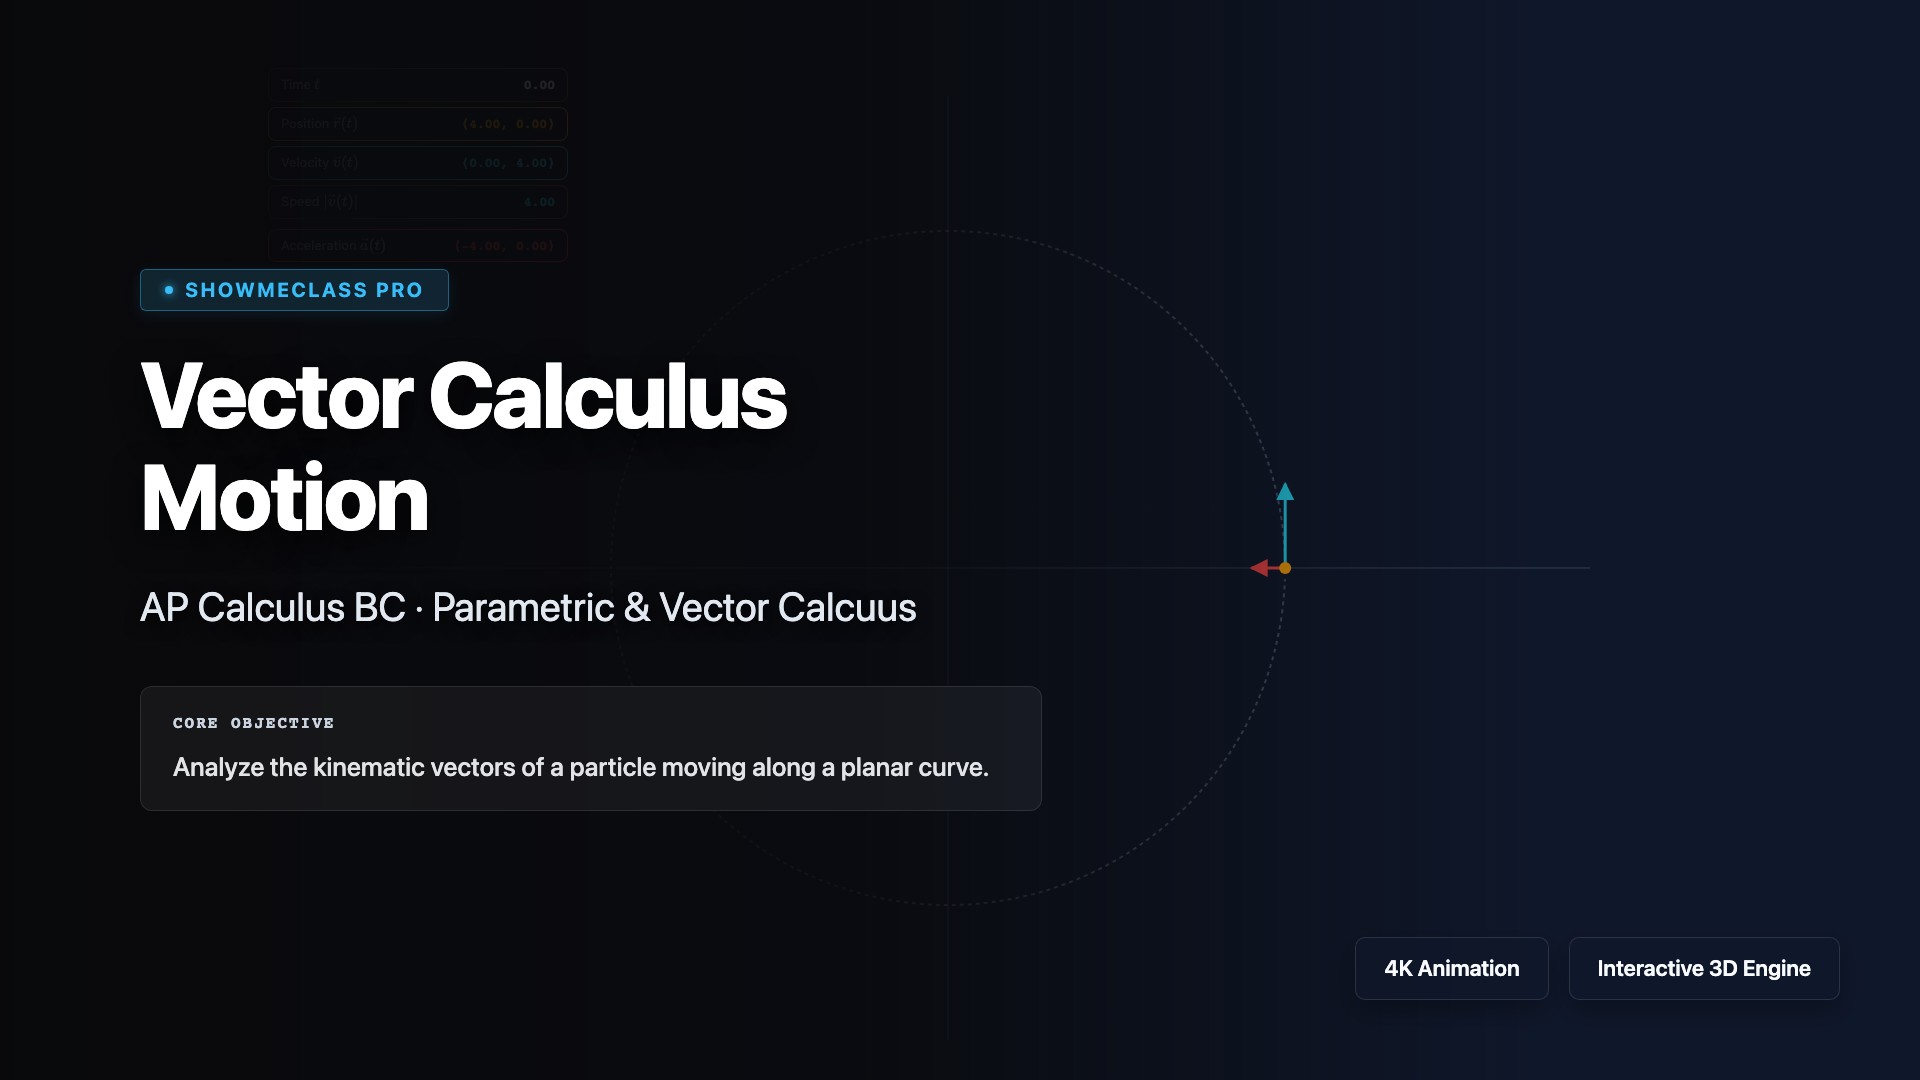
Vector Calculus Motion
Analyze motion in two dimensions using vector-valued functions for position r(t) = ⟨x(t), y(t)⟩. Calculate velocity vectors v(t) = r'(t), acceleration vectors a(t) = v'(t), and speed |v(t)| = √[(dx/dt)² + (dy/dt)²]. Visualize how velocity is tangent to the path, acceleration points toward concavity, and understand applications in projectile motion, planetary orbits, and particle kinematics.
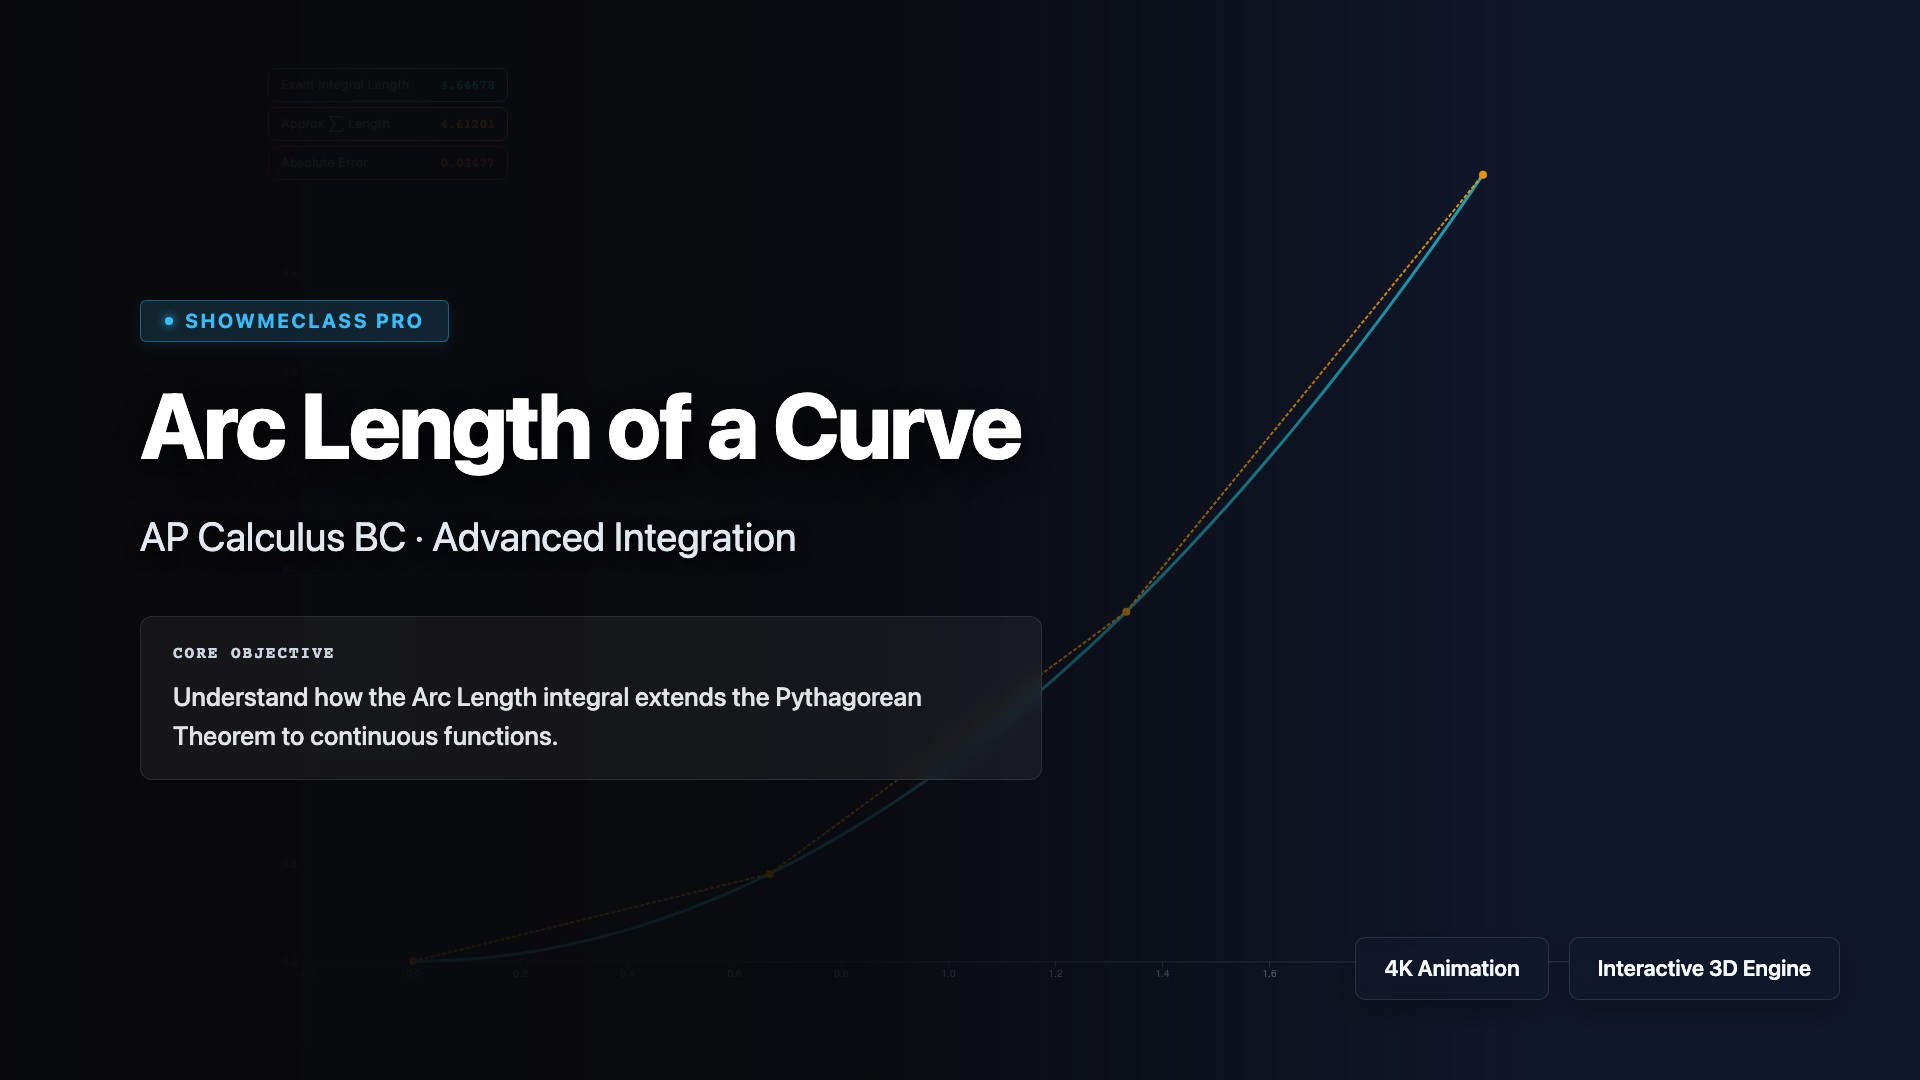
Arc Length of a Curve
Calculate the arc length of curves using integration and the distance formula. Derive and apply the arc length formula L = ∫[a to b] √(1 + [f'(x)]²)dx for functions y = f(x), or L = ∫[α to β] √([dx/dt]² + [dy/dt]²)dt for parametric curves. Understand how the Pythagorean theorem leads to this formula by summing infinitesimal line segments along the curve.
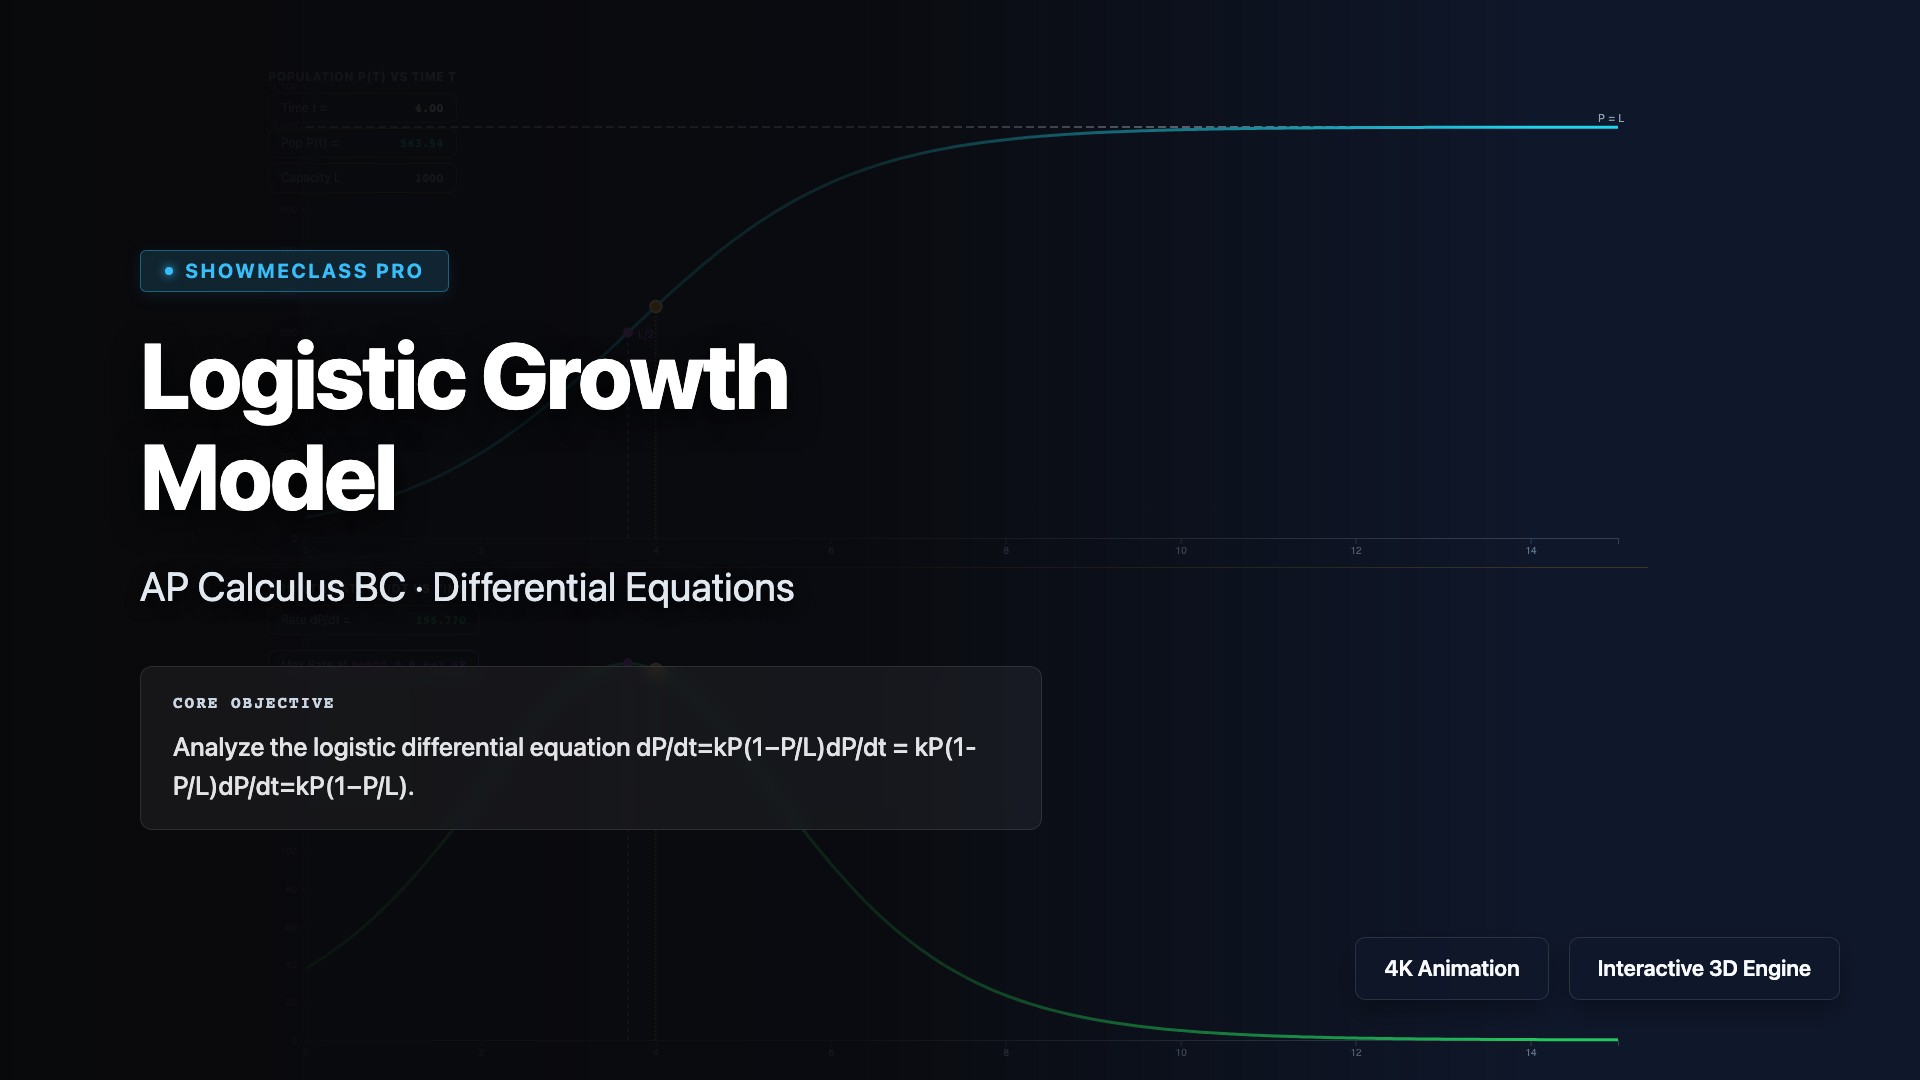
Logistic Growth Model
Model population growth with limited resources using the logistic differential equation dP/dt = kP(1 - P/M), where M is the carrying capacity. Visualize the S-shaped logistic curve P(t) = M/(1 + Ae^(-kt)) and understand how growth rate is fastest at P = M/2. Explore applications in ecology, epidemiology, and economics where growth is constrained by environmental factors, resource availability, or market saturation.
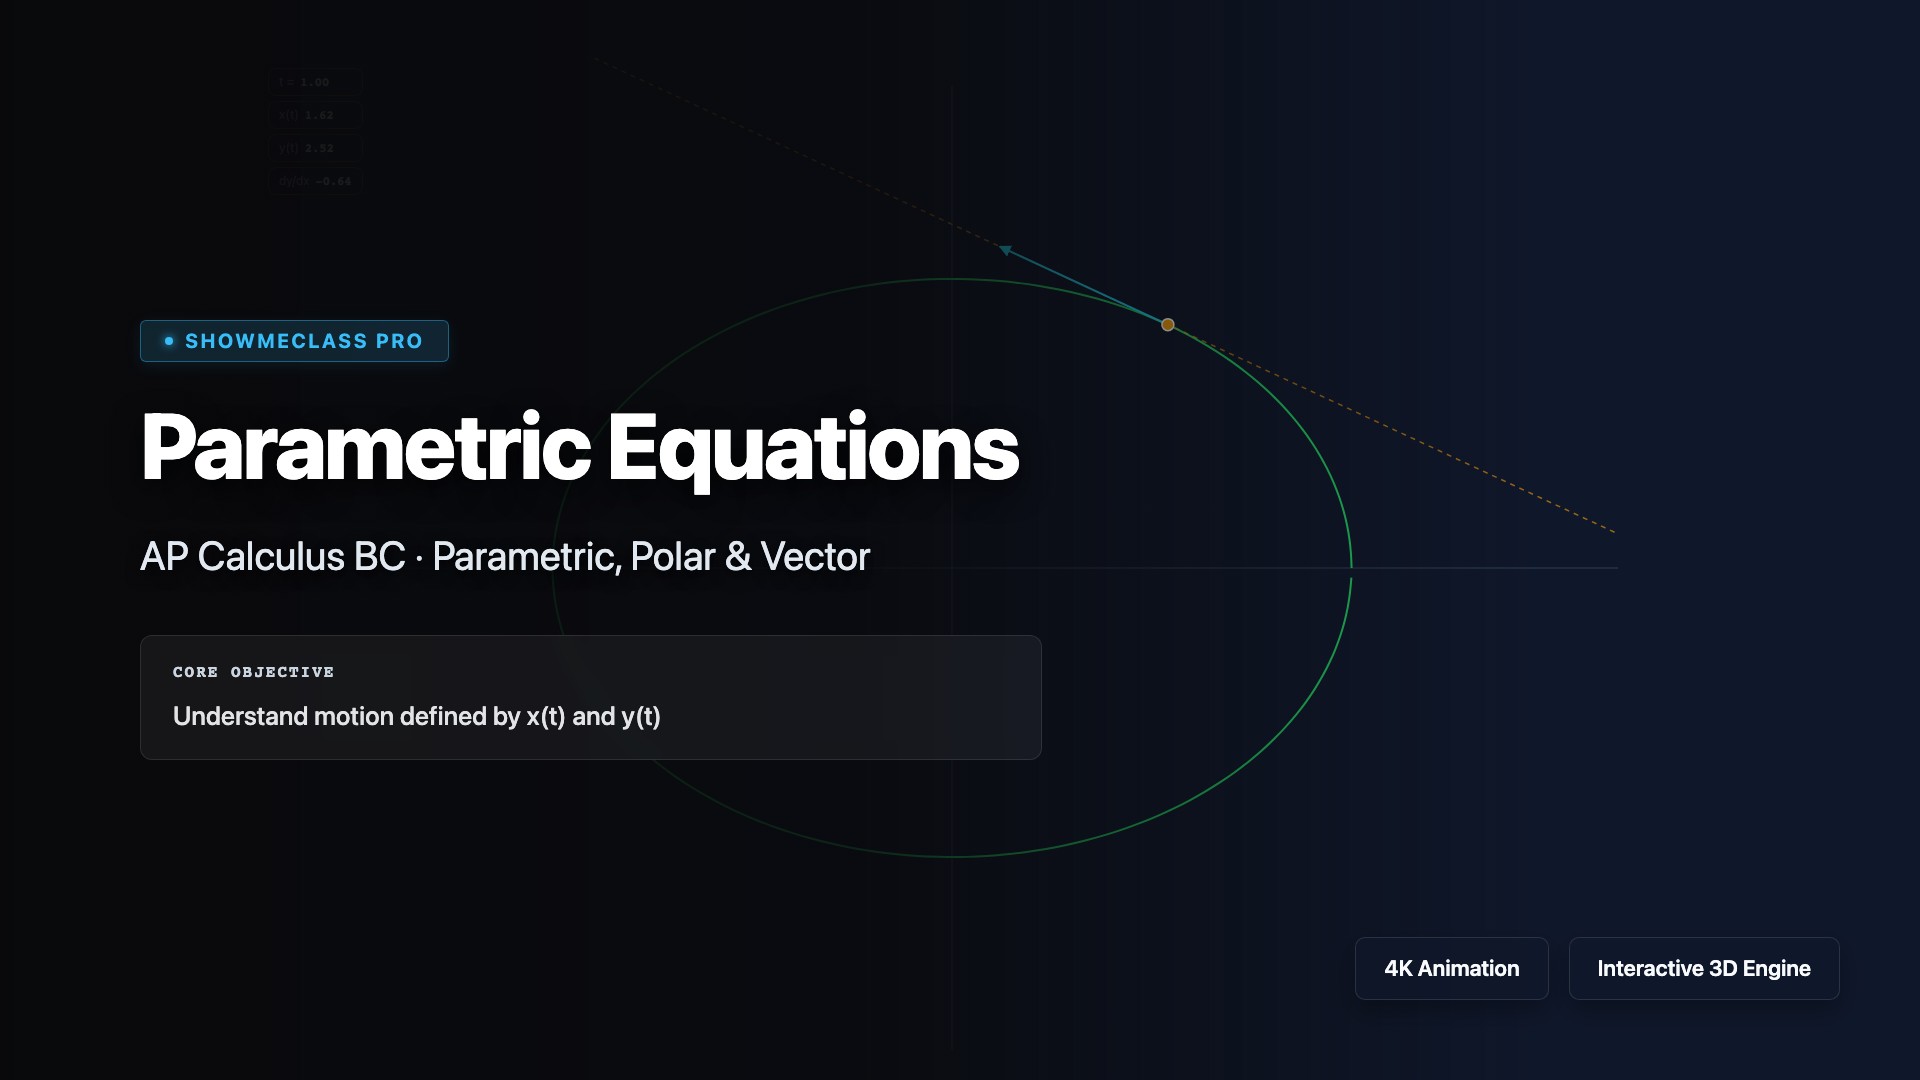
Parametric Equations
Explore parametric equations where x and y are both functions of a parameter t, enabling representation of curves that fail the vertical line test. Calculate derivatives dy/dx = (dy/dt)/(dx/dt) and second derivatives for analyzing concavity. Find arc length, speed, and velocity vectors. Visualize classic parametric curves like cycloids, ellipses, and Lissajous figures, and understand applications in physics for modeling projectile motion and planetary orbits.
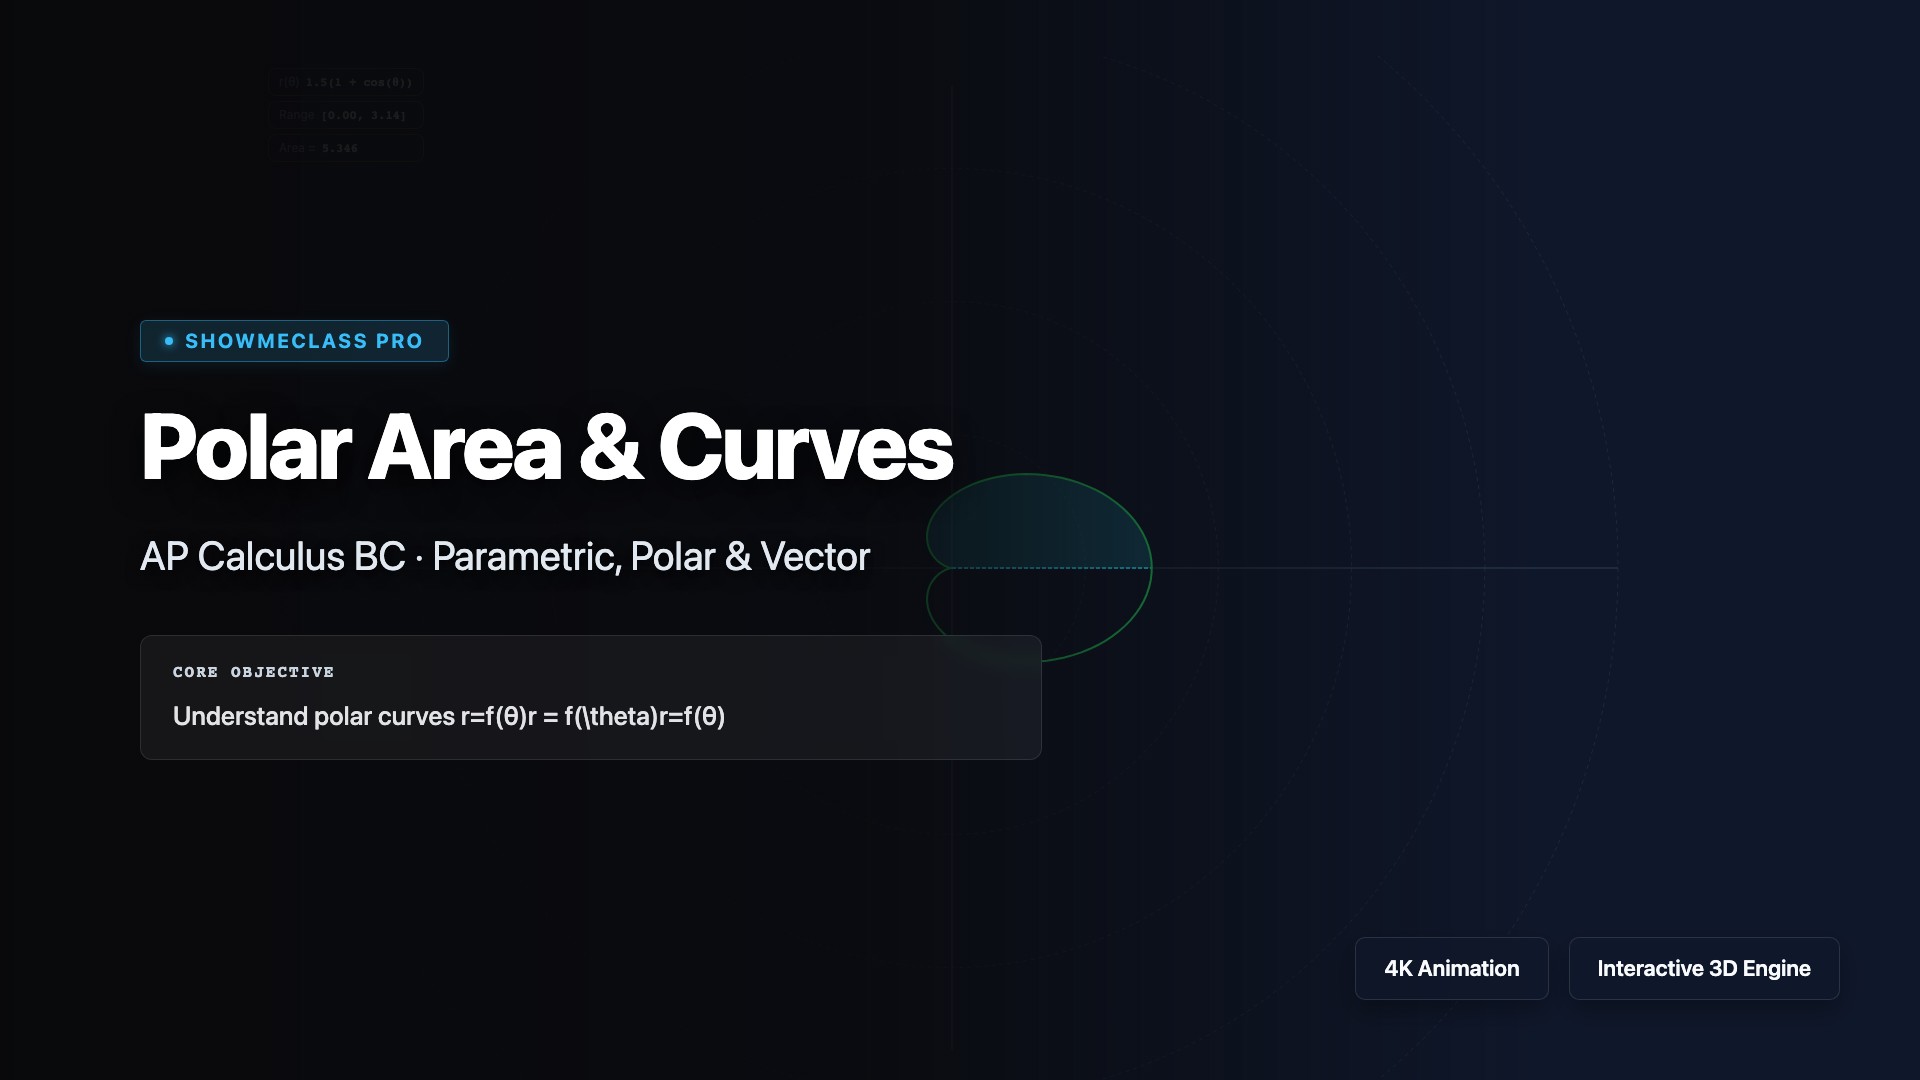
Polar Area & Curves
Graph and analyze curves in polar coordinates where r = f(θ), and calculate areas using A = (1/2)∫[α to β] [r(θ)]²dθ. Visualize classic polar curves including circles, cardioids, limaçons, rose curves, and lemniscates. Understand symmetry tests, find tangent lines using dr/dθ, and explore how polar coordinates naturally describe curves with rotational symmetry that are complex in Cartesian form.
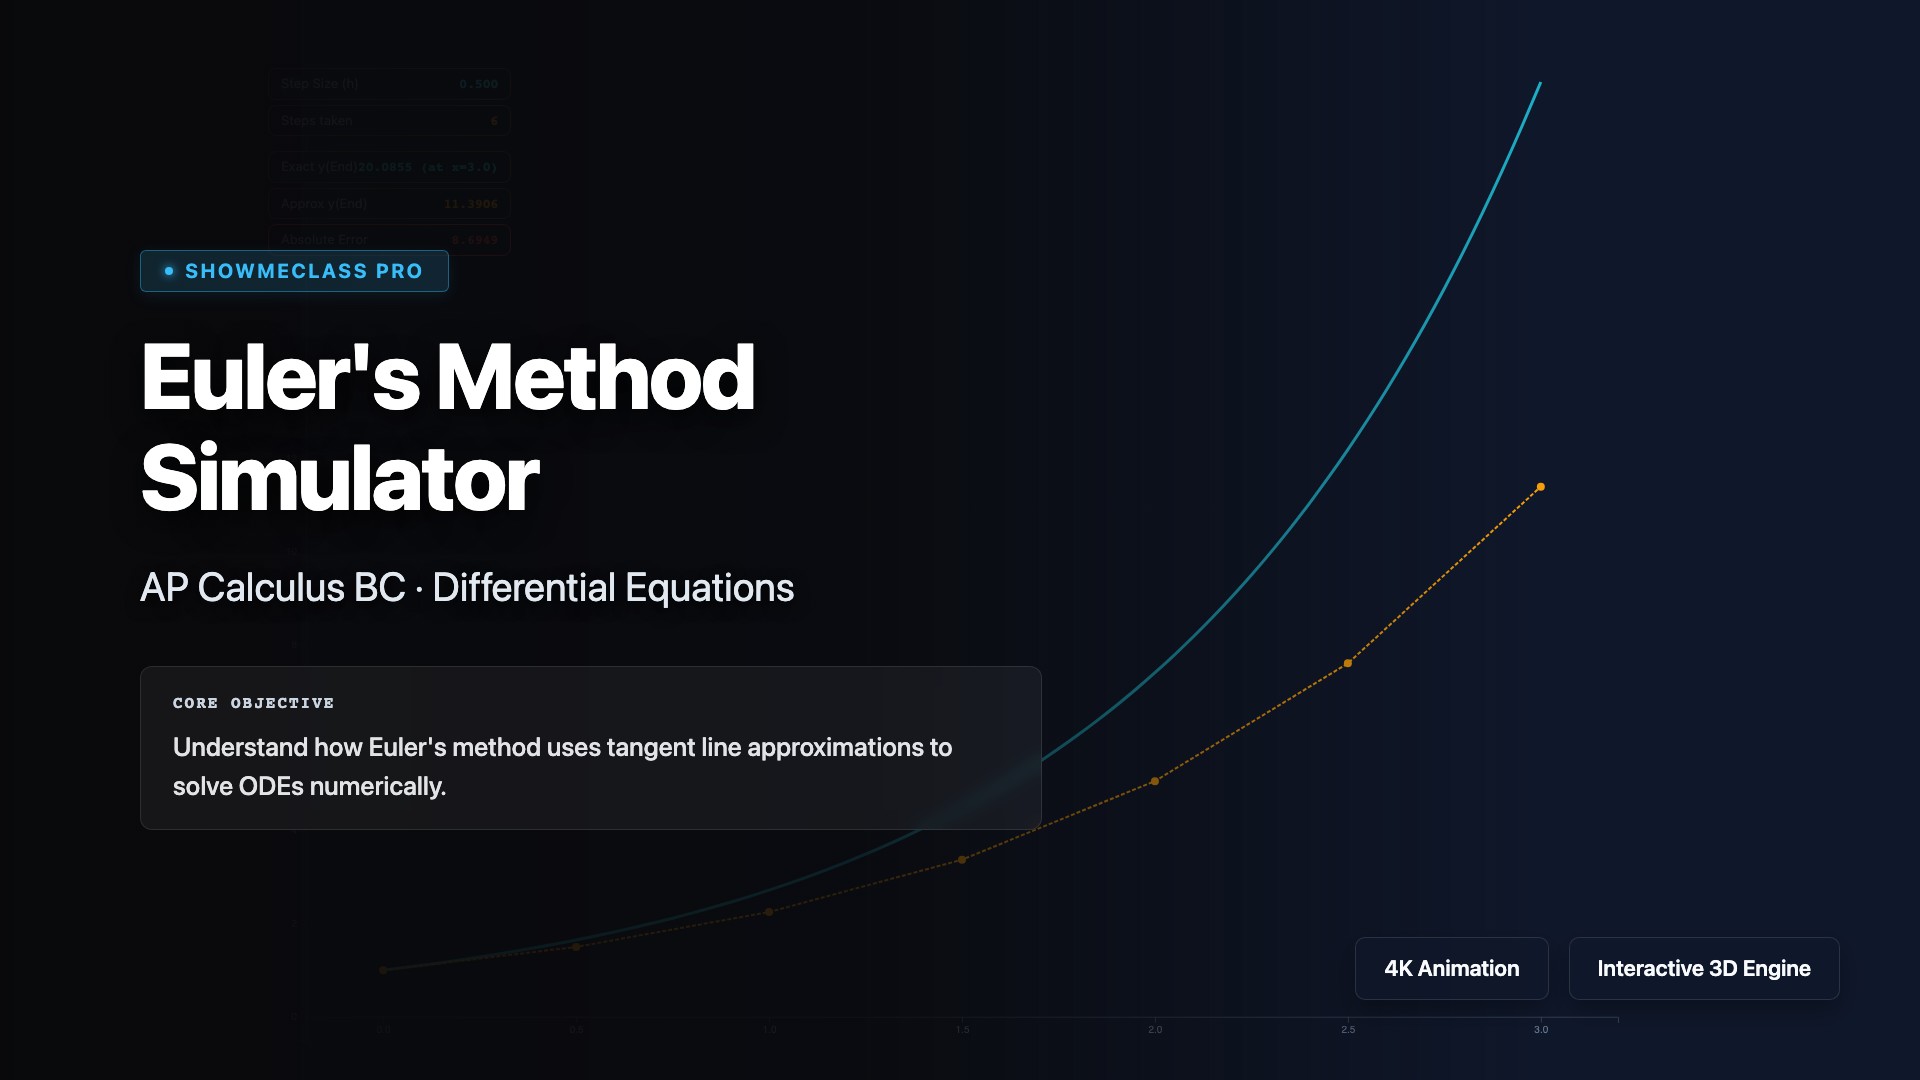
Euler's Method Simulator
Approximate solutions to differential equations using Euler's method, a numerical technique that uses tangent line approximations. Starting from an initial condition, iteratively calculate y_{n+1} = y_n + f(x_n, y_n)·Δx to trace the solution curve. Visualize how smaller step sizes improve accuracy, understand accumulation of error, and explore applications where analytical solutions are difficult or impossible to find.
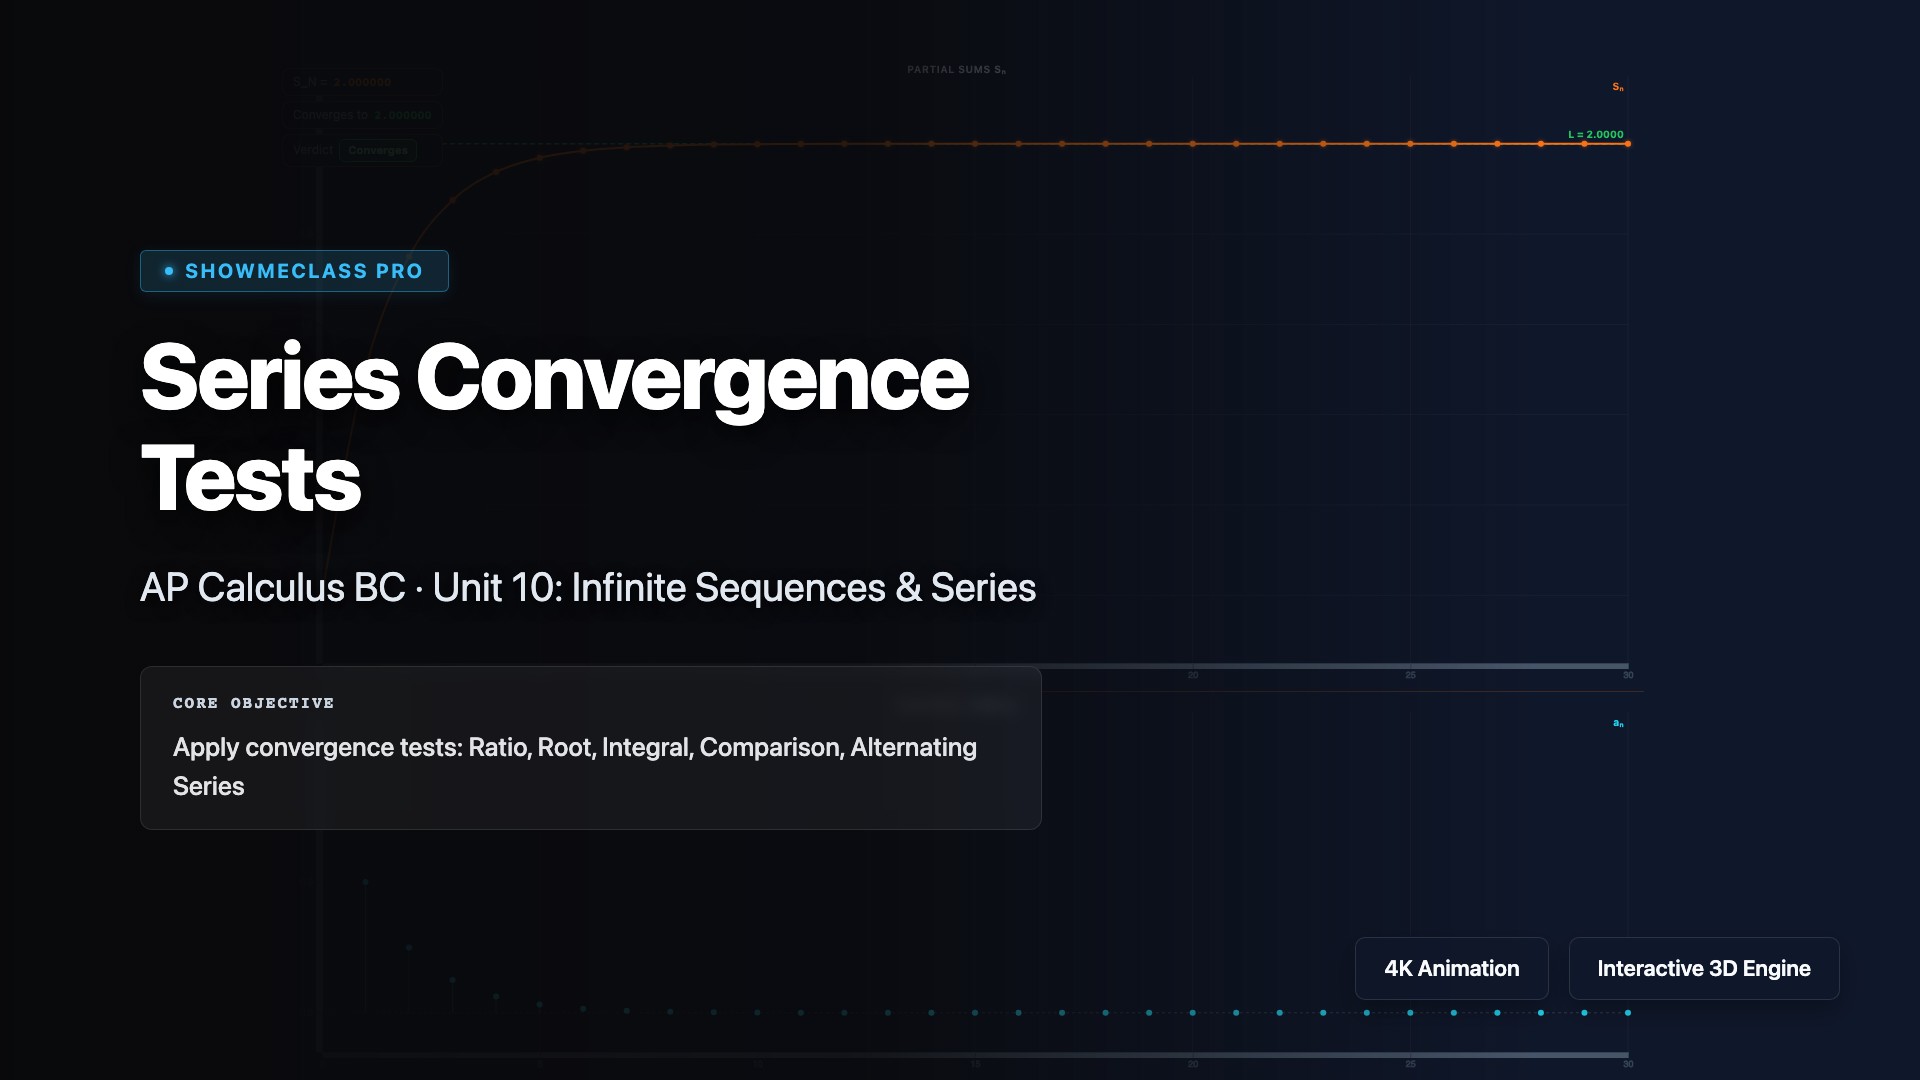
Series Convergence Tests
Master the convergence tests for infinite series including the nth-term test, geometric series test, p-series test, integral test, comparison tests, limit comparison test, alternating series test, ratio test, and root test. Learn when to apply each test, understand their conditions and conclusions, and develop strategies for determining whether ∑aₙ converges or diverges. Practice identifying series types and selecting the most efficient test.
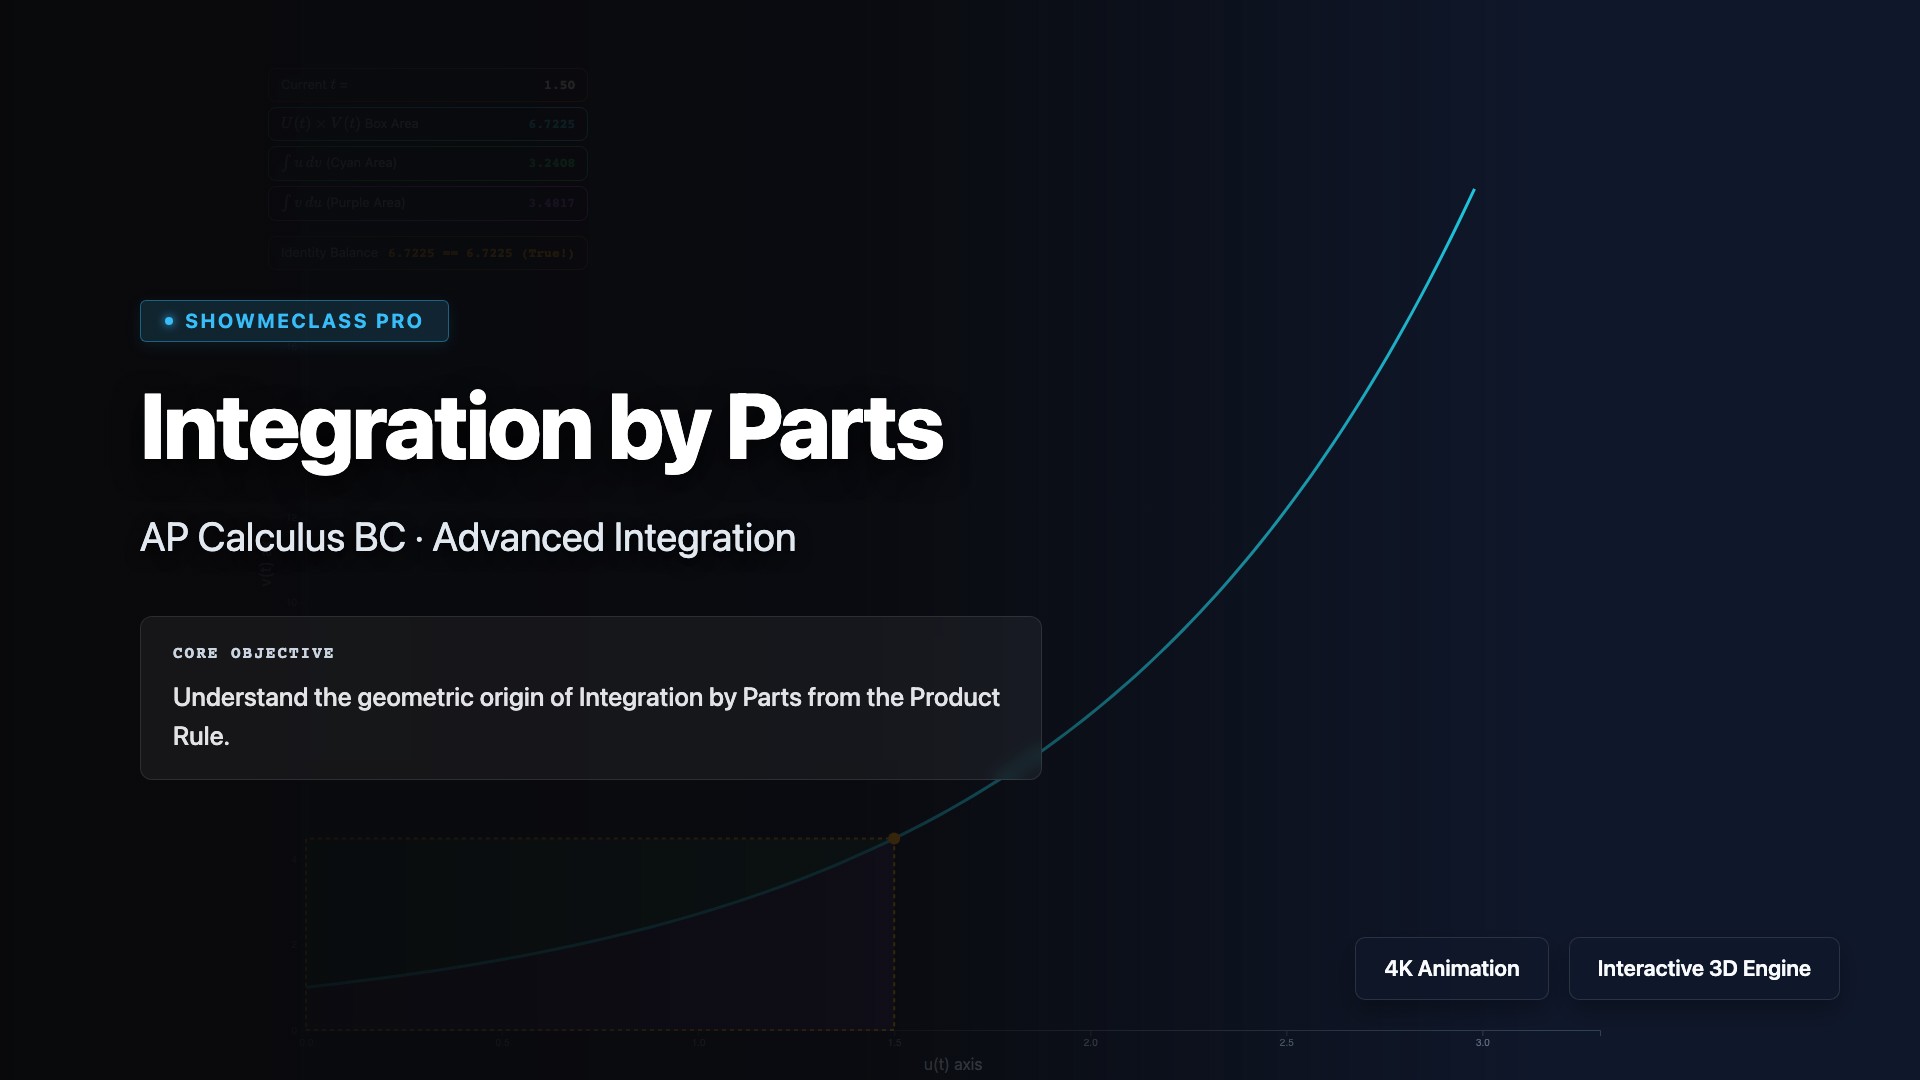
Integration by Parts
Master integration by parts, derived from the product rule for differentiation, using the formula ∫u dv = uv - ∫v du. Learn strategic selection of u and dv using the LIATE priority (Logarithmic, Inverse trig, Algebraic, Trigonometric, Exponential). Practice solving integrals involving products of functions, handling repeated applications, and recognizing when tabular integration or reduction formulas provide efficient solutions.
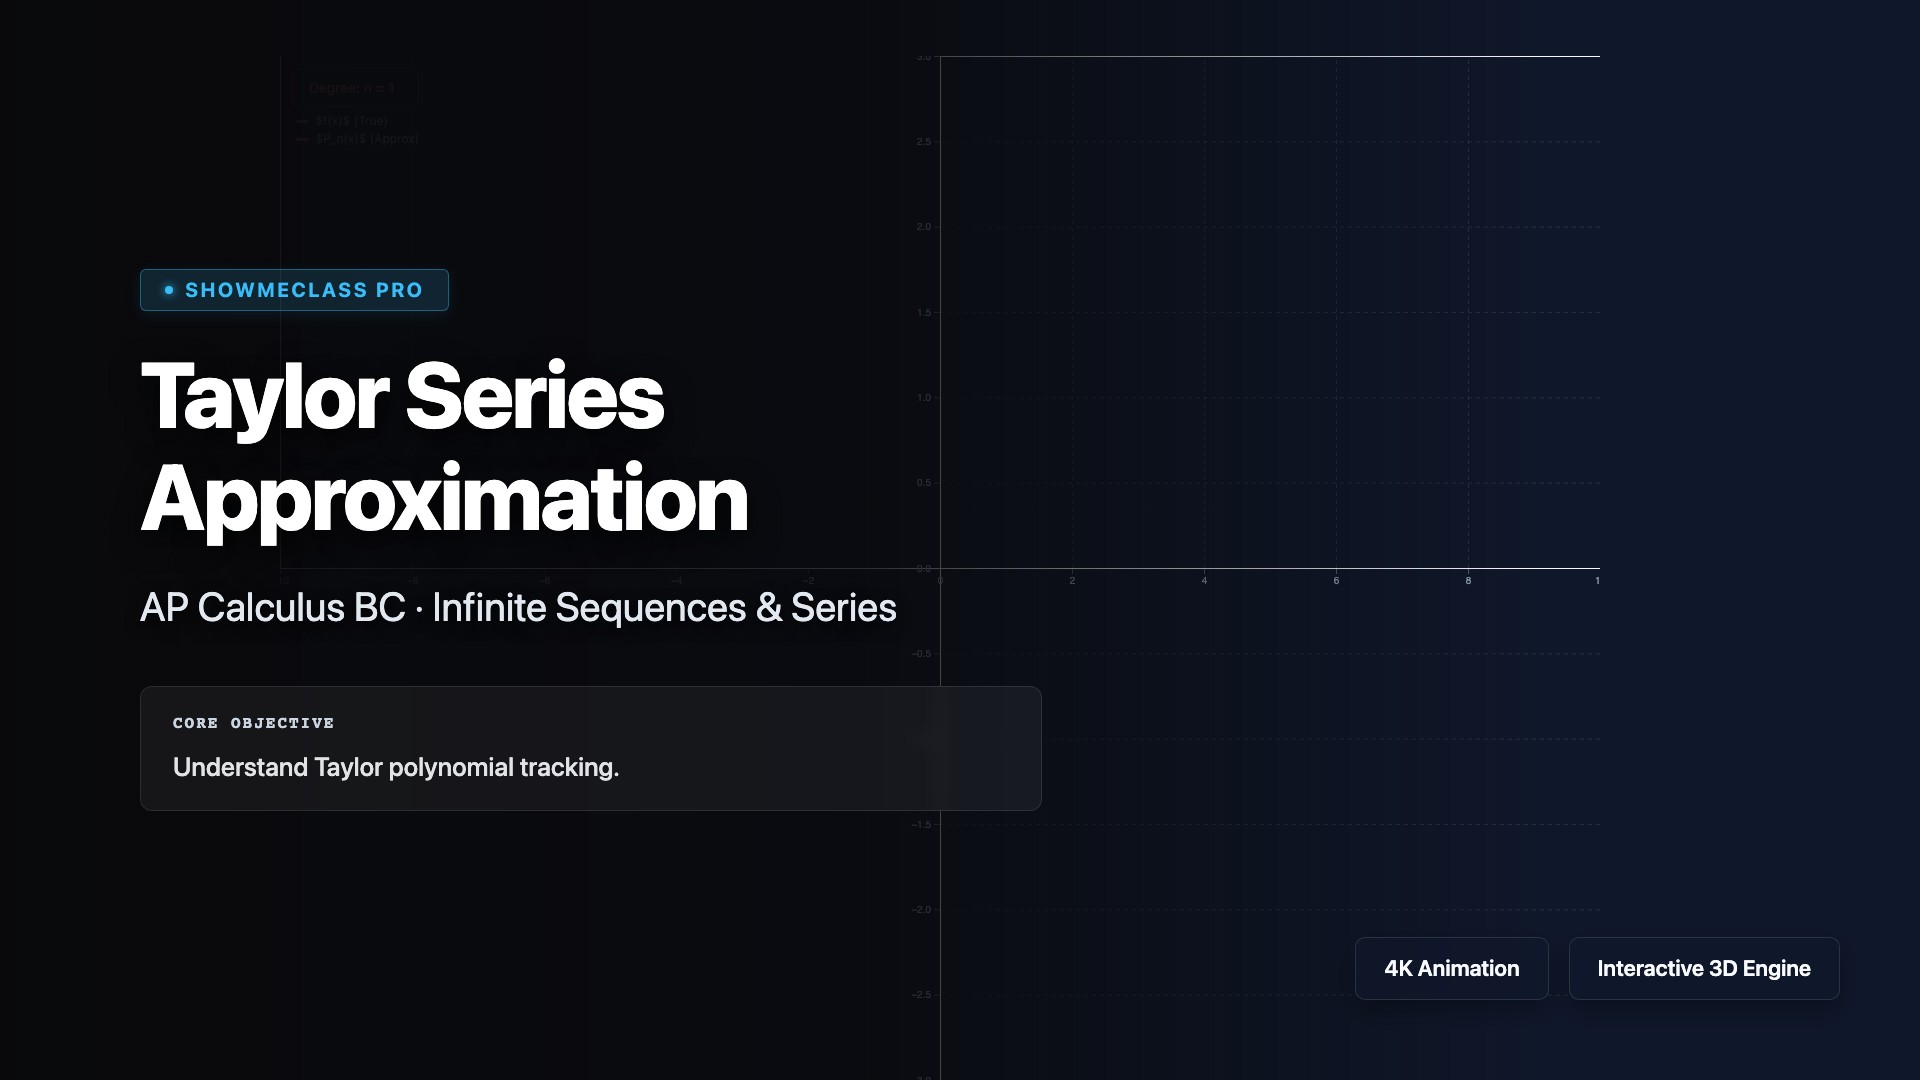
Taylor Series Approximation
Watch Maclaurin series polynomials geometrically 'hug' a target original curve. Drag the slider to add higher-degree polynomial terms to sine, cosine, e^x, and ln(1+x), witnessing convergence intervals.

Improper Integrals & p-Series Convergence
Calculus visualizer demonstrating the paradox of infinite boundaries yielding finite areas (Gabriel's Horn). Dynamically integrate 1/x^p as the bound approaches infinity.
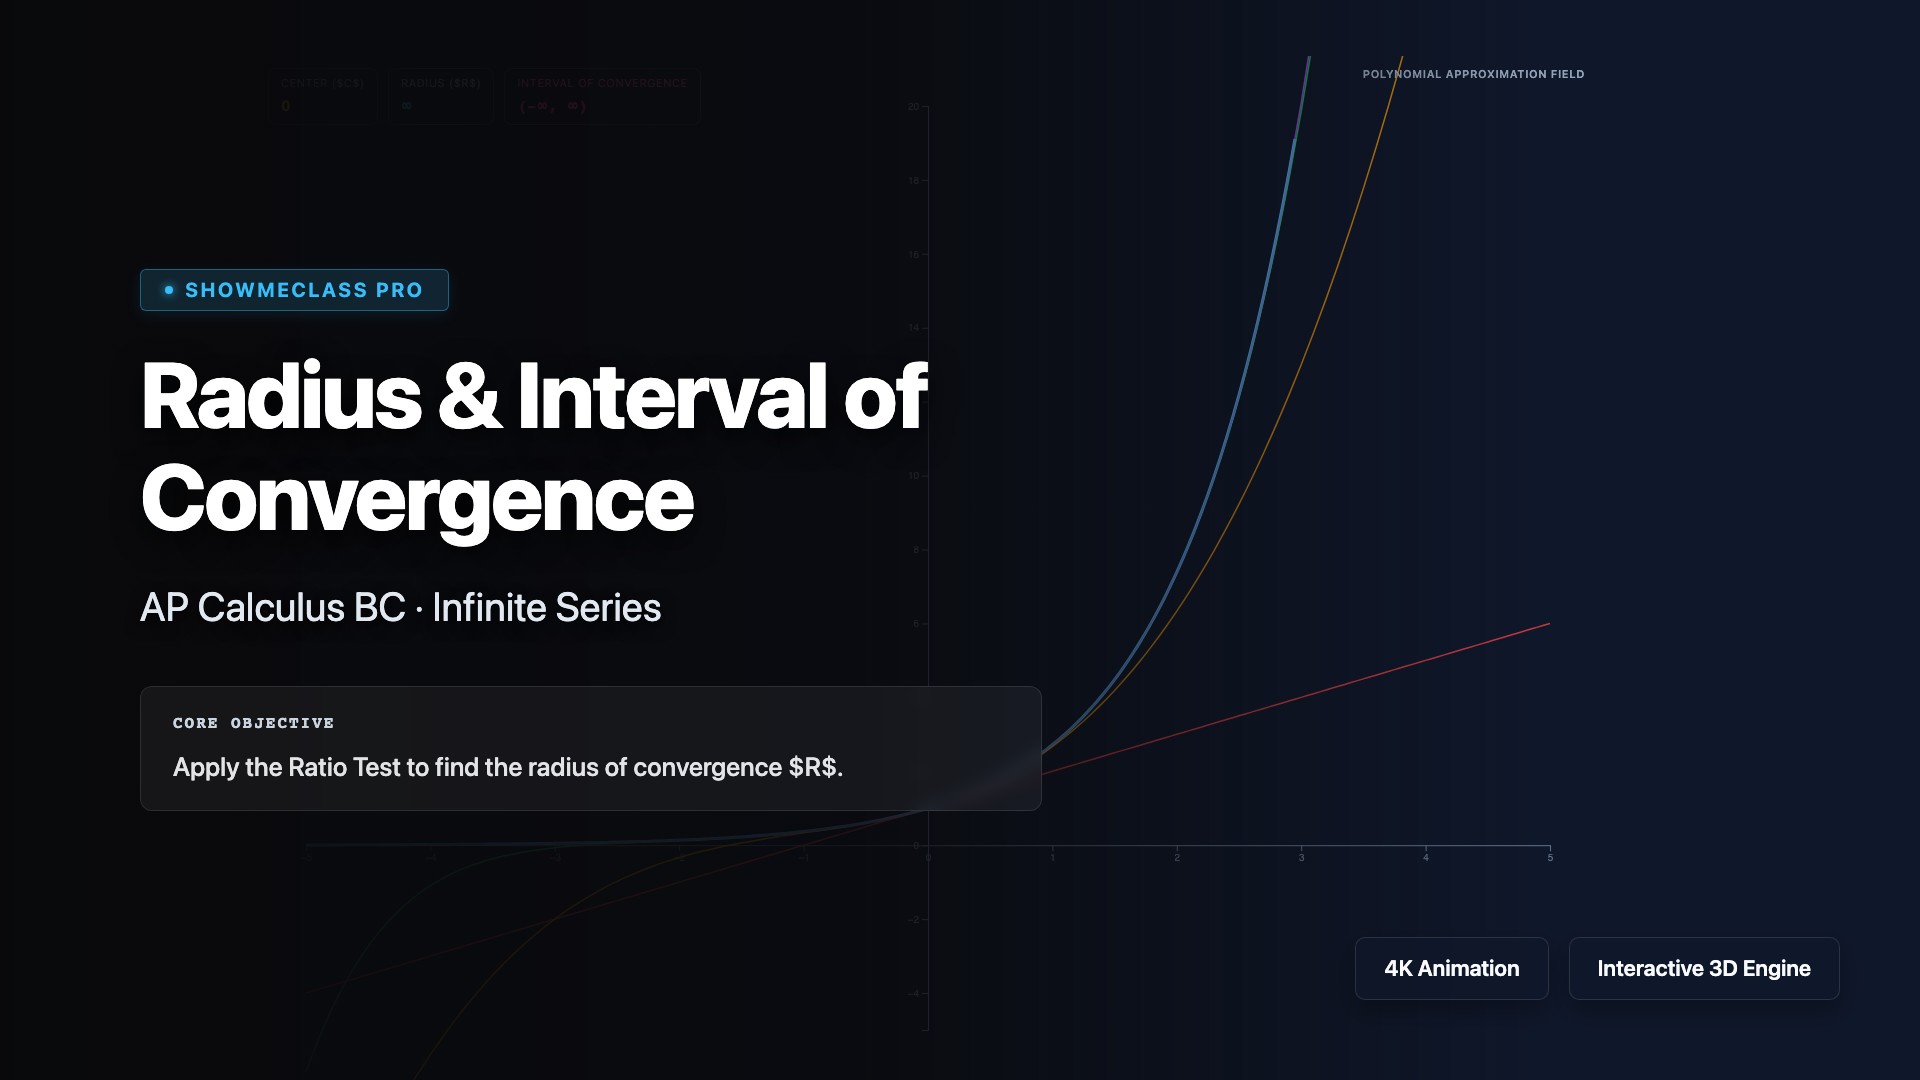
Radius of Convergence (Ratio Test)
Evaluate Taylor series limits to determine radii of convergence. Visually observe the divergence explosion outside the open boundaries of polynomials.
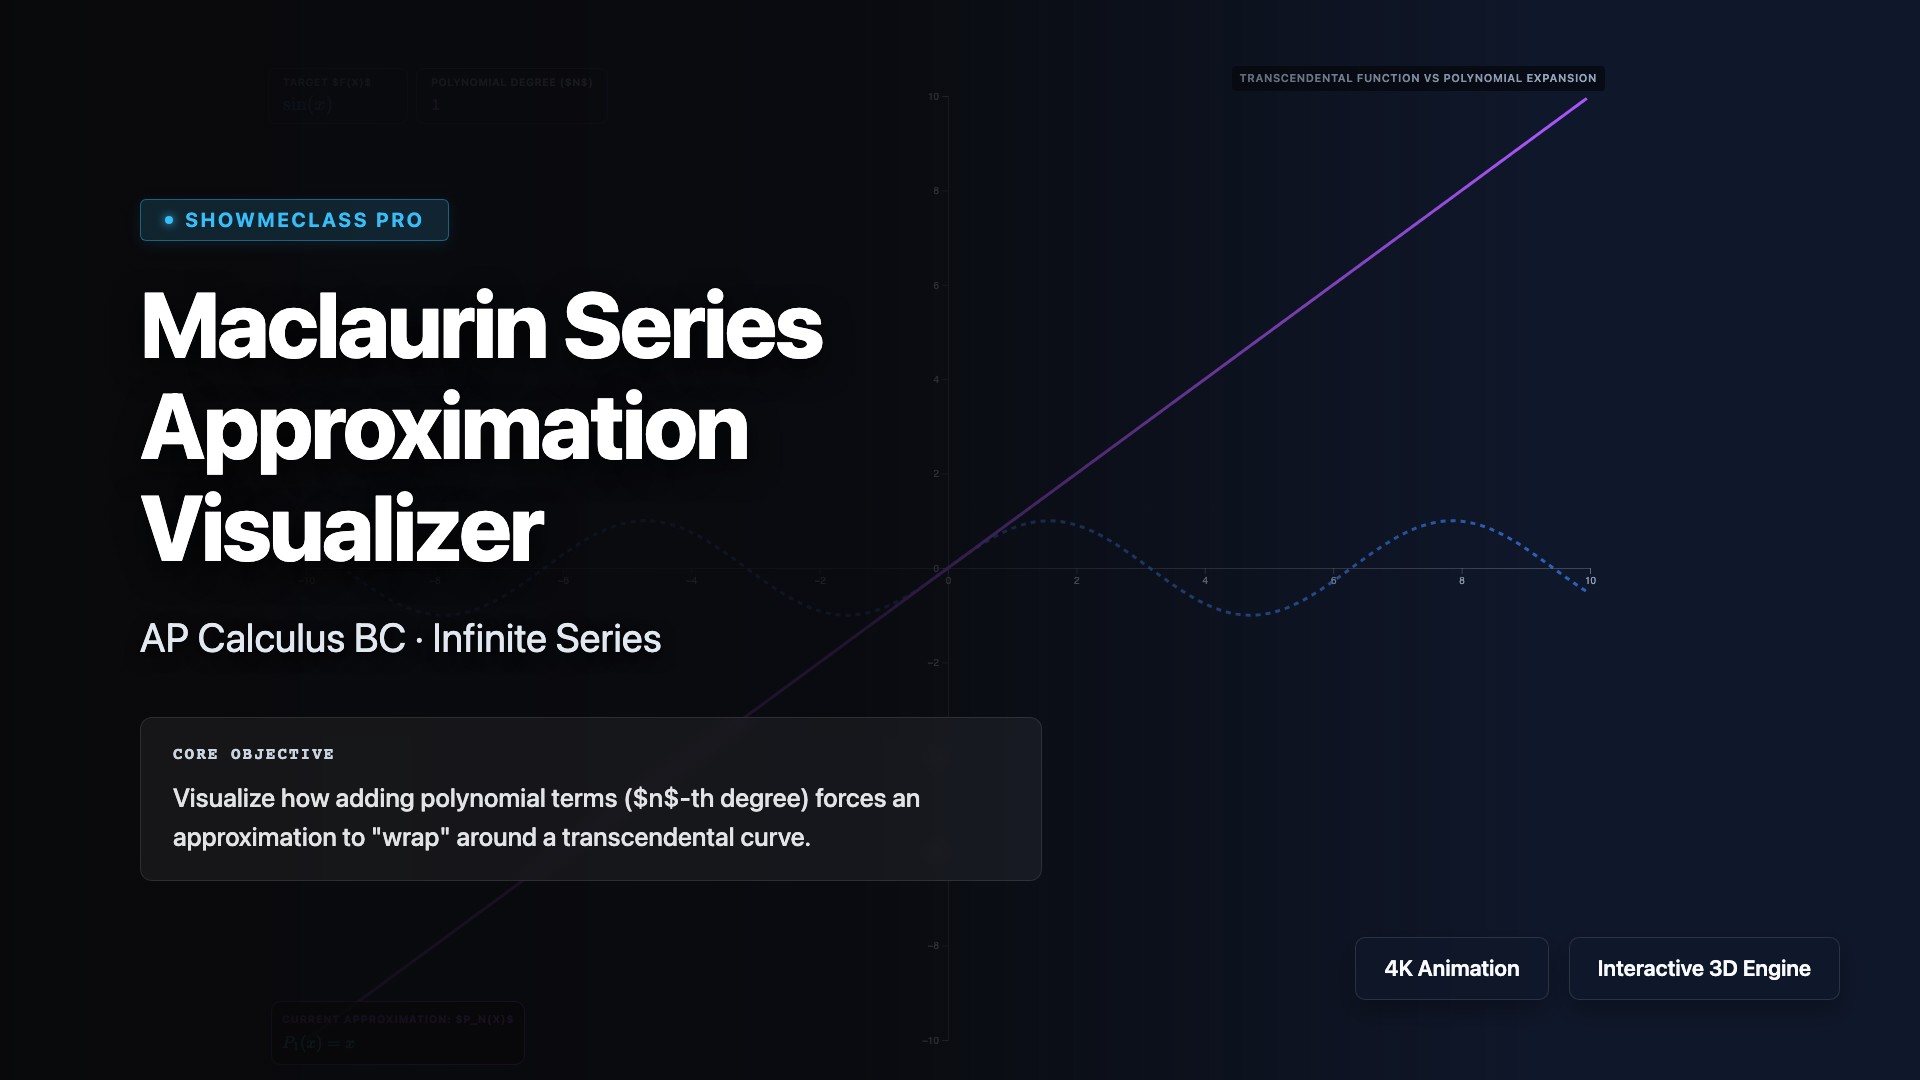
Maclaurin Series Visualizer
Increase the polynomial degree to observe how Taylor/Maclaurin series mathematically trace transcendental functions like sin(x) and e^x.
Integration by Parts
Integration by parts geometric derivation visualizing the separation of total paramteric bounding box $uv$ into constituent sub-integrals $\int v du$ and $\int u dv$ via animated slicing logic.
Improper Integrals Explorer
Improper integrals interactive limit testing. Visually computes limit convergence against infinity comparing $1/x$, $1/x^2$, and $e^{-x}$ behavior with dynamic auto-zooming coordinate geometries.
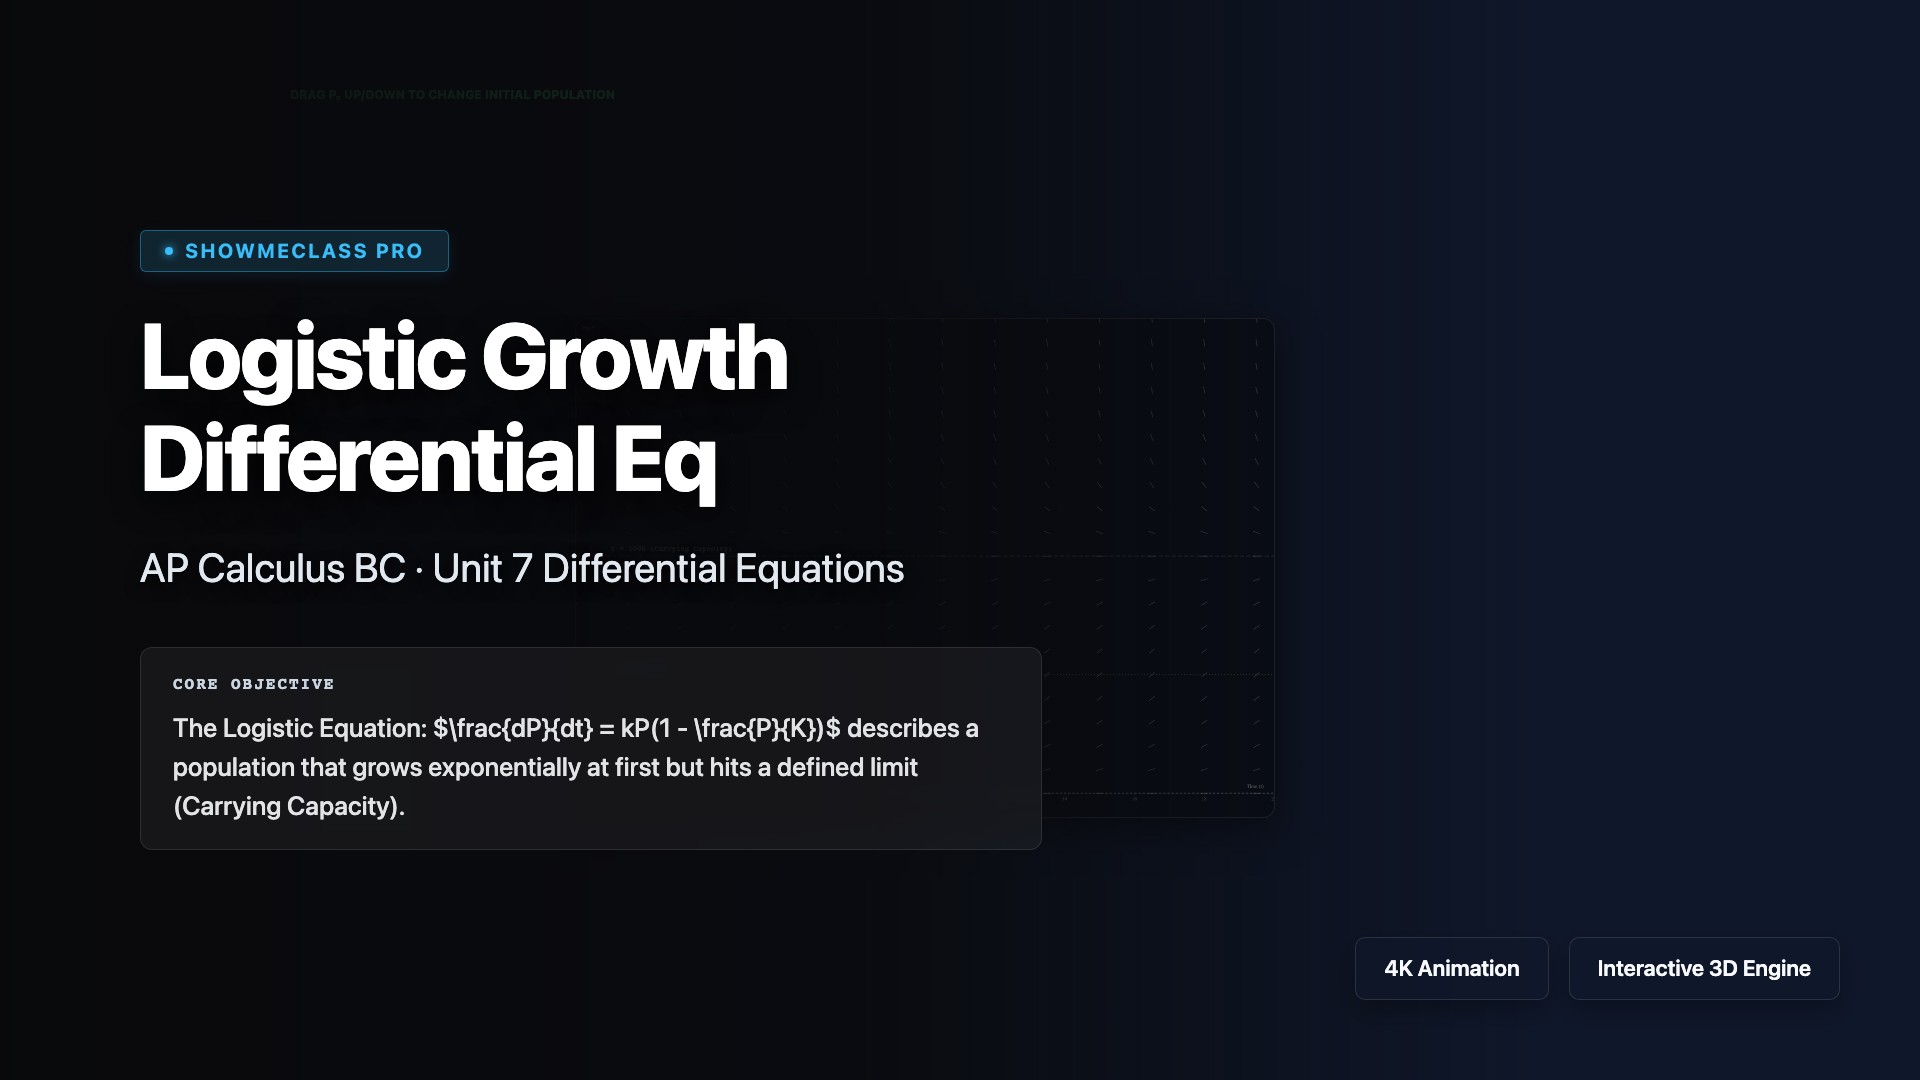
Logistic Growth Differential Eq
Differential logistic population map visualizing the $dP/dt = kP(1 - P/K)$ growth carrying capacity asymptote model. Sweeps dynamic background slopefields evaluating inflection velocity shifts mathematically derived from Partial Fractions.
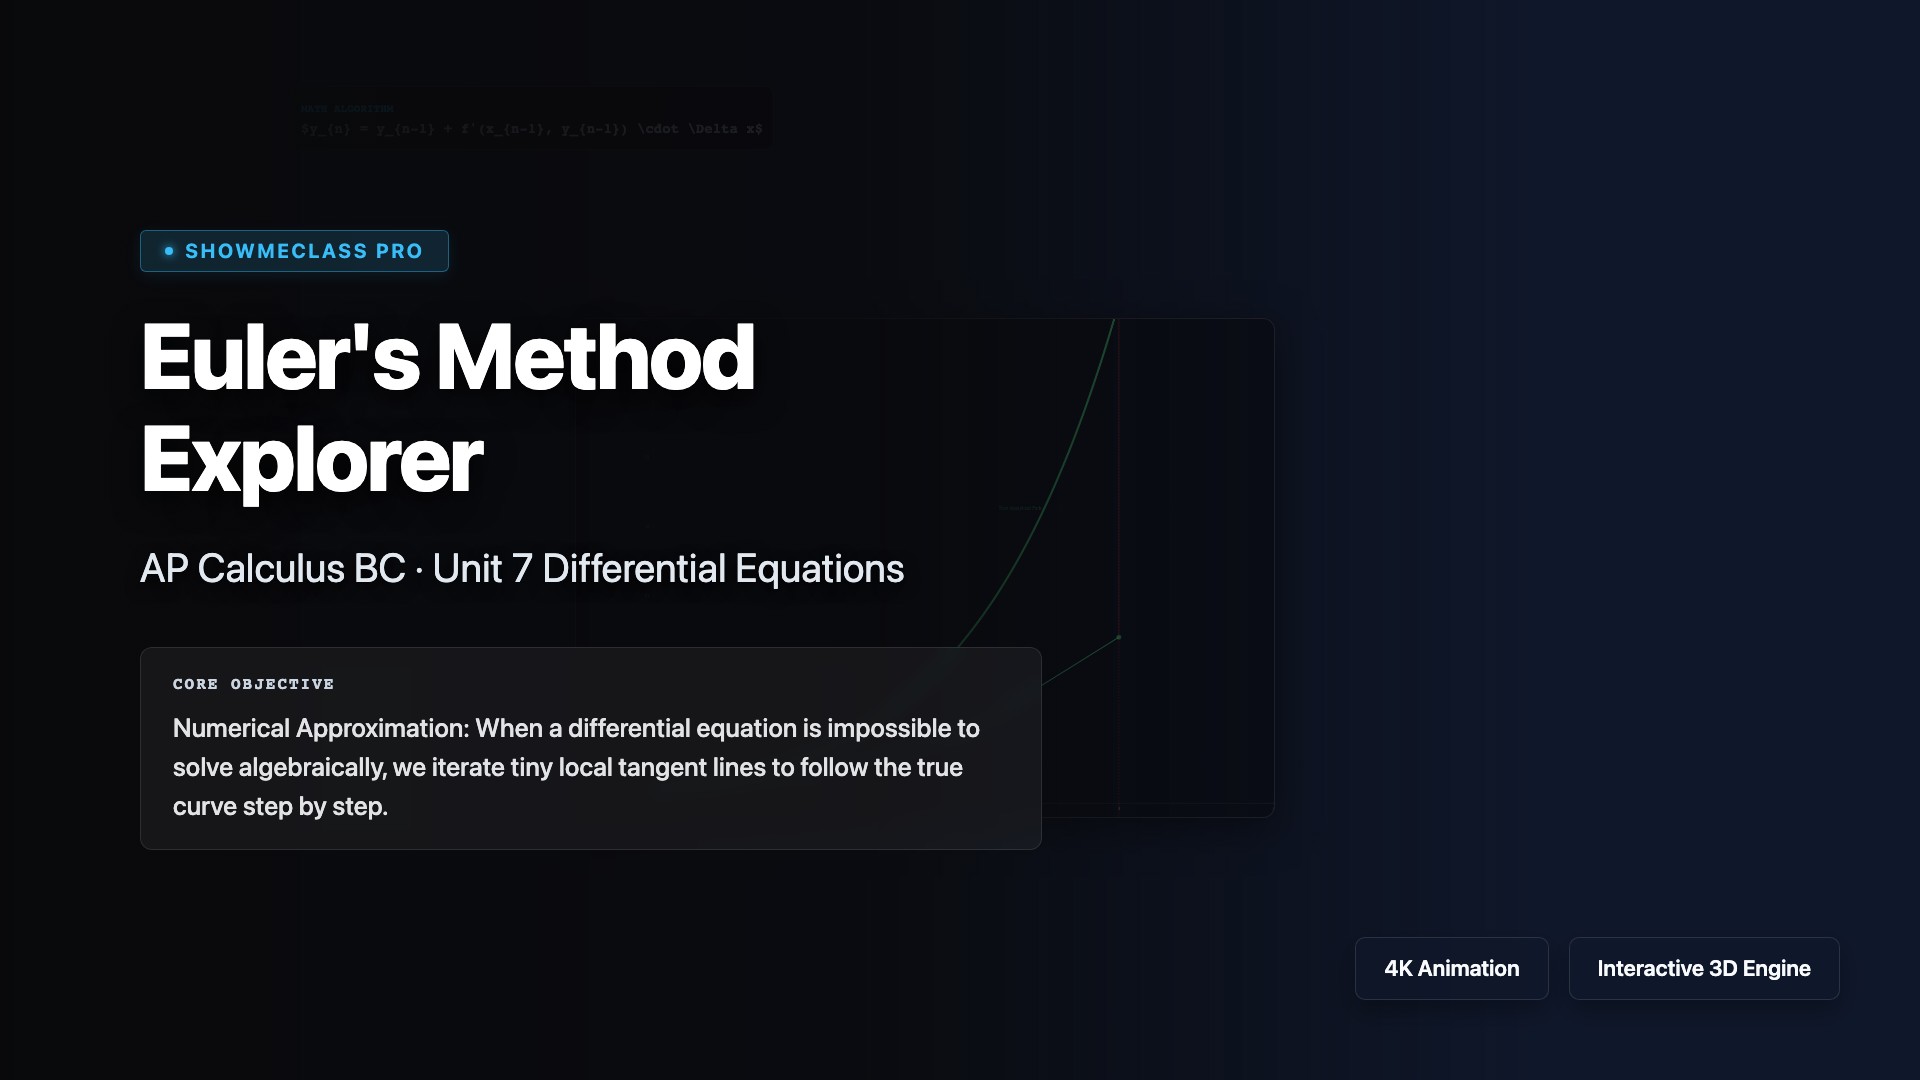
Euler's Method Explorer
Iterative numeric sequence plotting Euler's method vs True Analytical Solution paths. Modifying the $\Delta x$ subdivision actively updates truncation error margins mapping concave dynamics across polynomial and sinusoidal shift patterns.
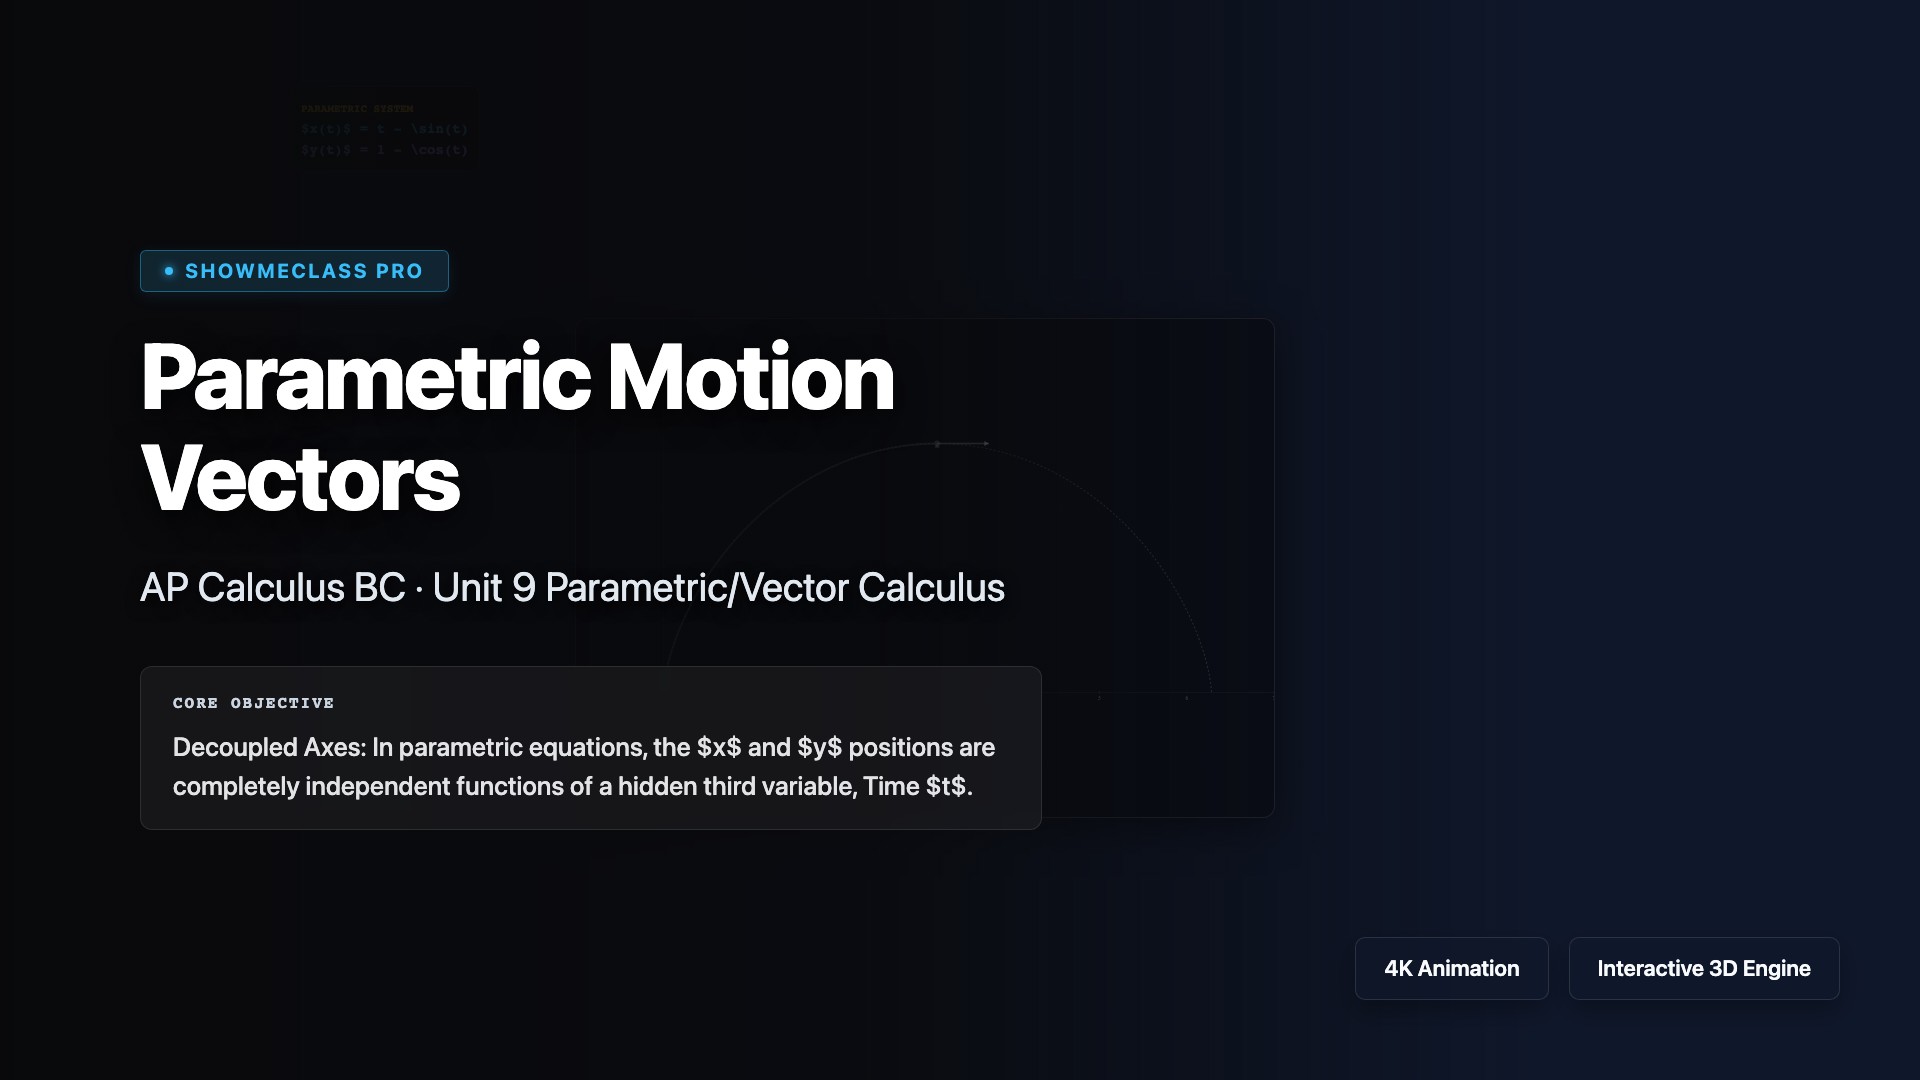
Parametric Motion Vectors
Parametric Cartesian vector tracking framework decoupling $x$ and $y$ positional derivatives. Casts independent $\langle dx/dt, dy/dt \rangle$ vectors against the path map to visualize orthogonal component logic and resulting chain rule geometry.
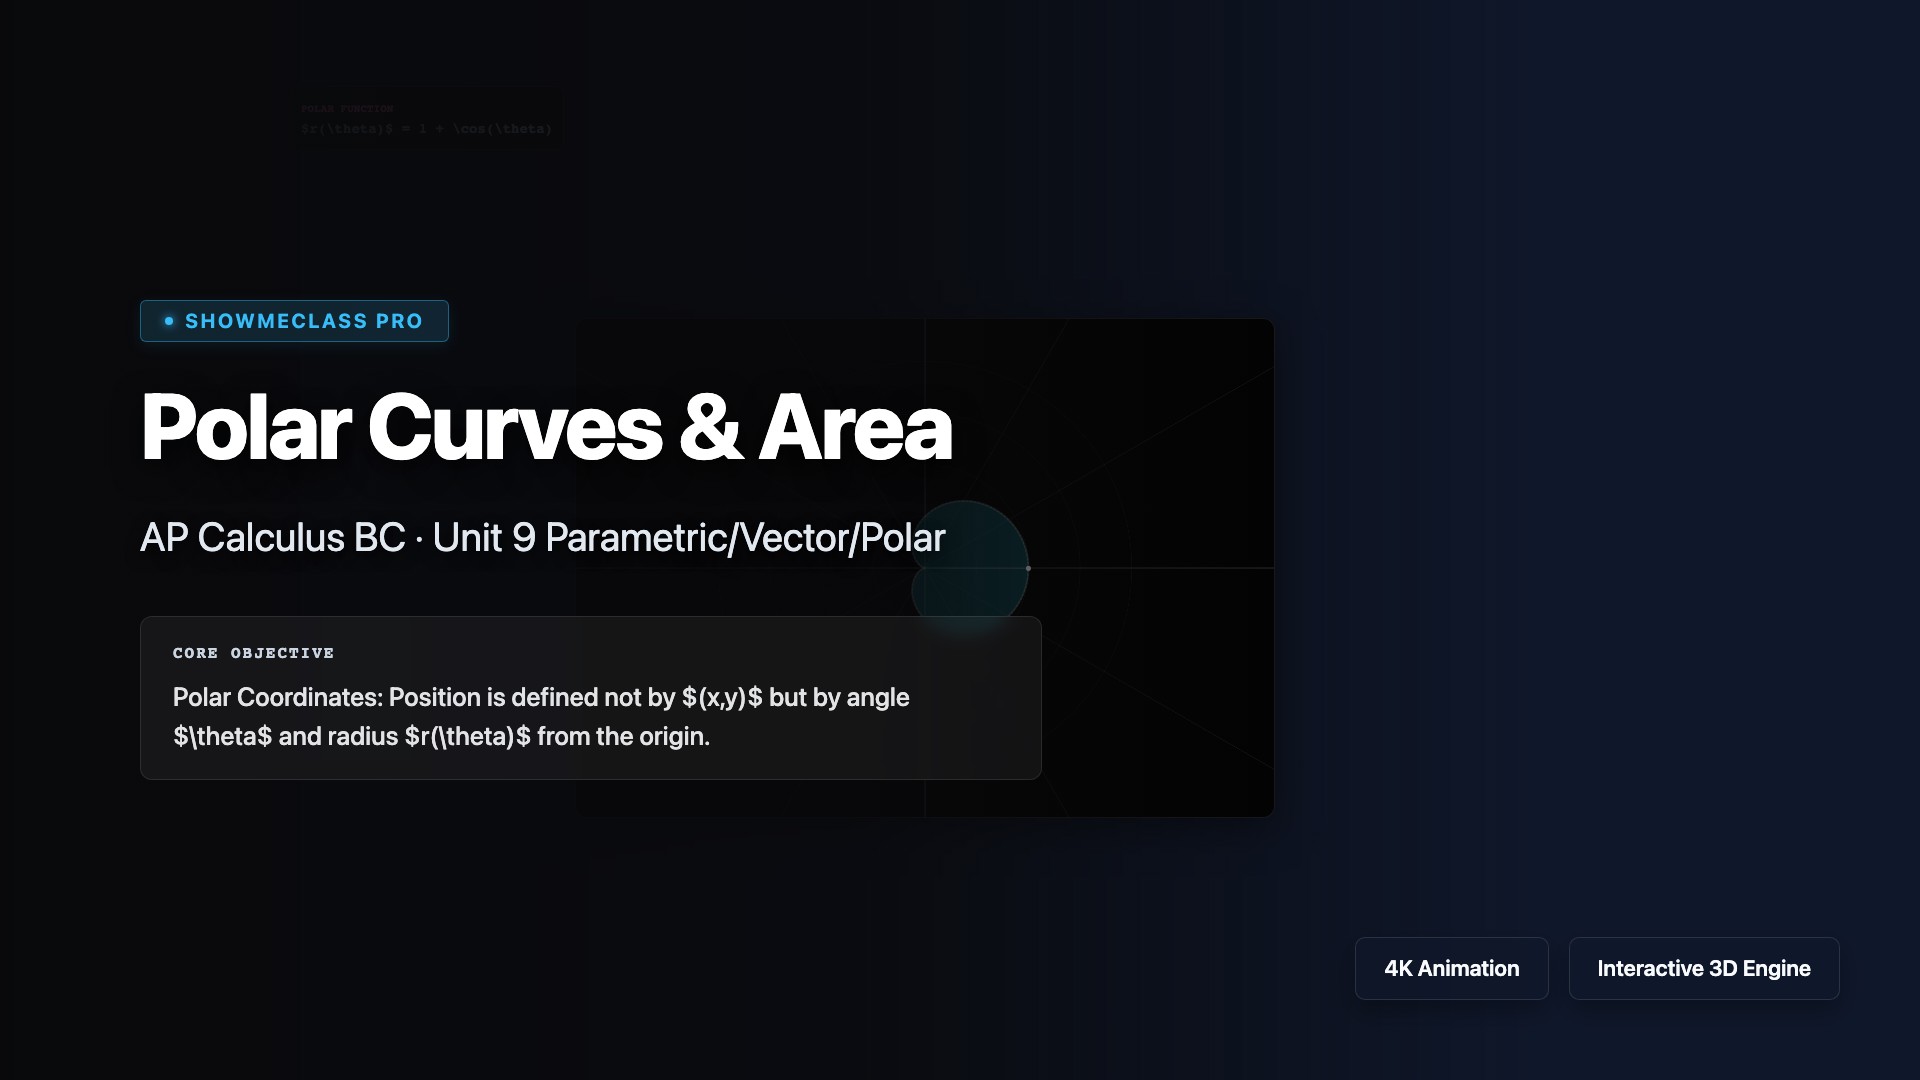
Polar Curves & Area
Polar geometry visualizer tracking rotational $r(\theta)$ traces. Highlights integral sector area sweeps $A = 1/2 \int r^2 d\theta$ and visualizes the geometric backward-rendering anomaly when traversing negative radii.

Series Convergence Tests
Convergence testing interactive engine visually exposing the logical divergence of p-series compared with Alternating boundaries (AST bounce) and absolute factorial crushes dictated by Ratio limit laws.
Taylor/Maclaurin Polynomials
Taylor/Maclaurin generator interactively layering $n$-degree $f^{(n)}/n!$ polynomial sweeps over transcendental seeds ($\sin(x), e^x, \ln(1+x)$). Demonstrates active radius of convergence limits dynamically via Center-$c$ shifting.
Radius of Convergence
Convergence mapping UI tracking power series expansion endpoints. Computes spatial Ratio test limits rendering absolute, conditional intervals visually over 1D axis coordinate models to distinguish $[a, b)$ limits structurally.
Arc Length Geometry
Integration geometric summation modeling arc length via continuous reduction of $ds = \sqrt{dx^2 + dy^2}$ discrete limits approaching exact mathematical integrals. Reveals consistent finite approximation underestimation behavior against true curved lines.

Parametric Speed & Arc Length
Interactive parametric curve visualizer showing position, velocity vector, instantaneous speed |v(t)|, and arc length via Simpson integration. Animate particles along Cycloid, Ellipse, Lissajous, and Butterfly curves with real-time distance accumulation.

Polar Tangent Lines & Slope
Visualize dy/dx for polar curves r=f(θ) using the chain rule conversion to Cartesian. Shows tangent lines, radial vectors, and identifies horizontal/vertical tangents on Cardioid, Rose, Limaçon, and Lemniscate curves.

Logistic Growth & Phase Line
Dual-panel logistic differential equation analyzer. Top: P(t) solution curve with carrying capacity K and inflection at K/2. Bottom: dP/dt vs P parabolic phase space showing stable/unstable equilibria and maximum growth rate. Adjustable k, K, and P₀.
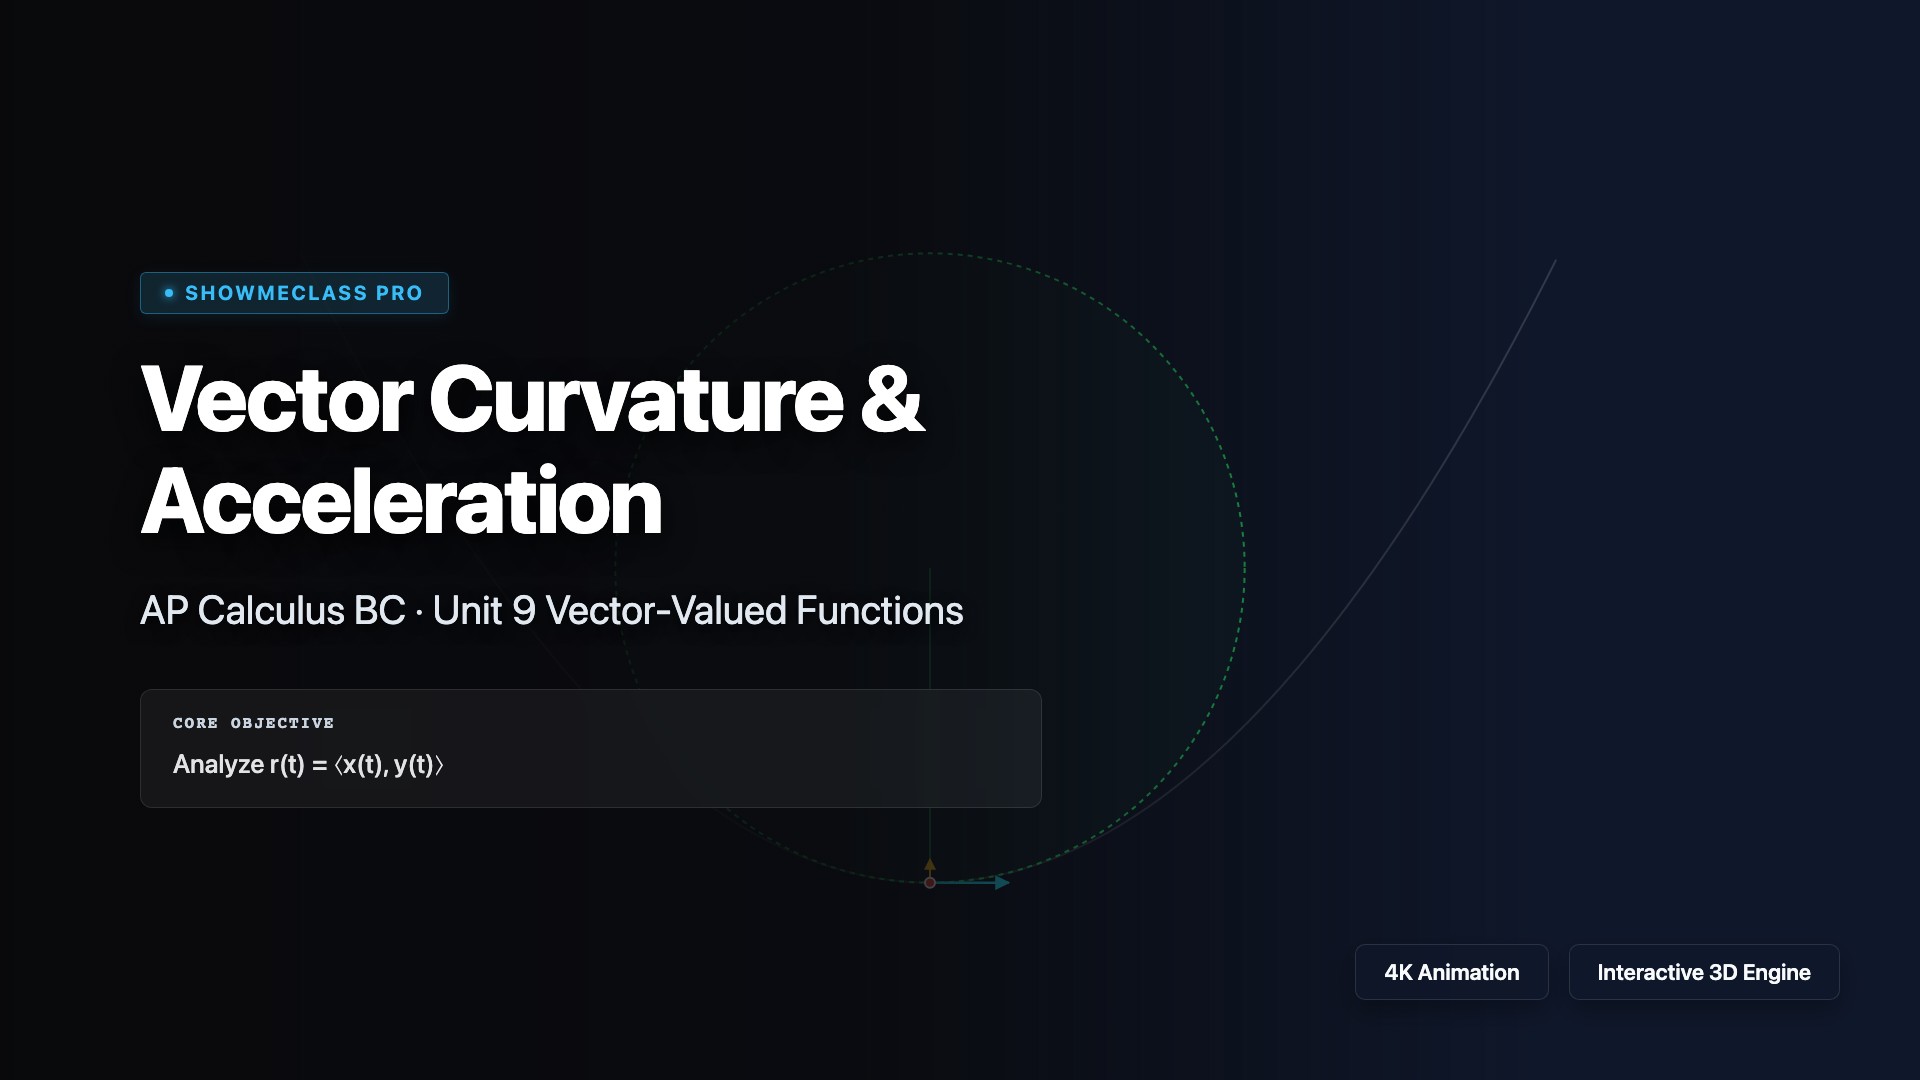
Vector Curvature & Acceleration
Vector-valued function analyzer showing velocity (tangent), acceleration vectors, curvature κ, and osculating circle with radius R=1/κ. Explore Parabola, Sine Wave, Spiral, and Astroid trajectories with animated particle motion.
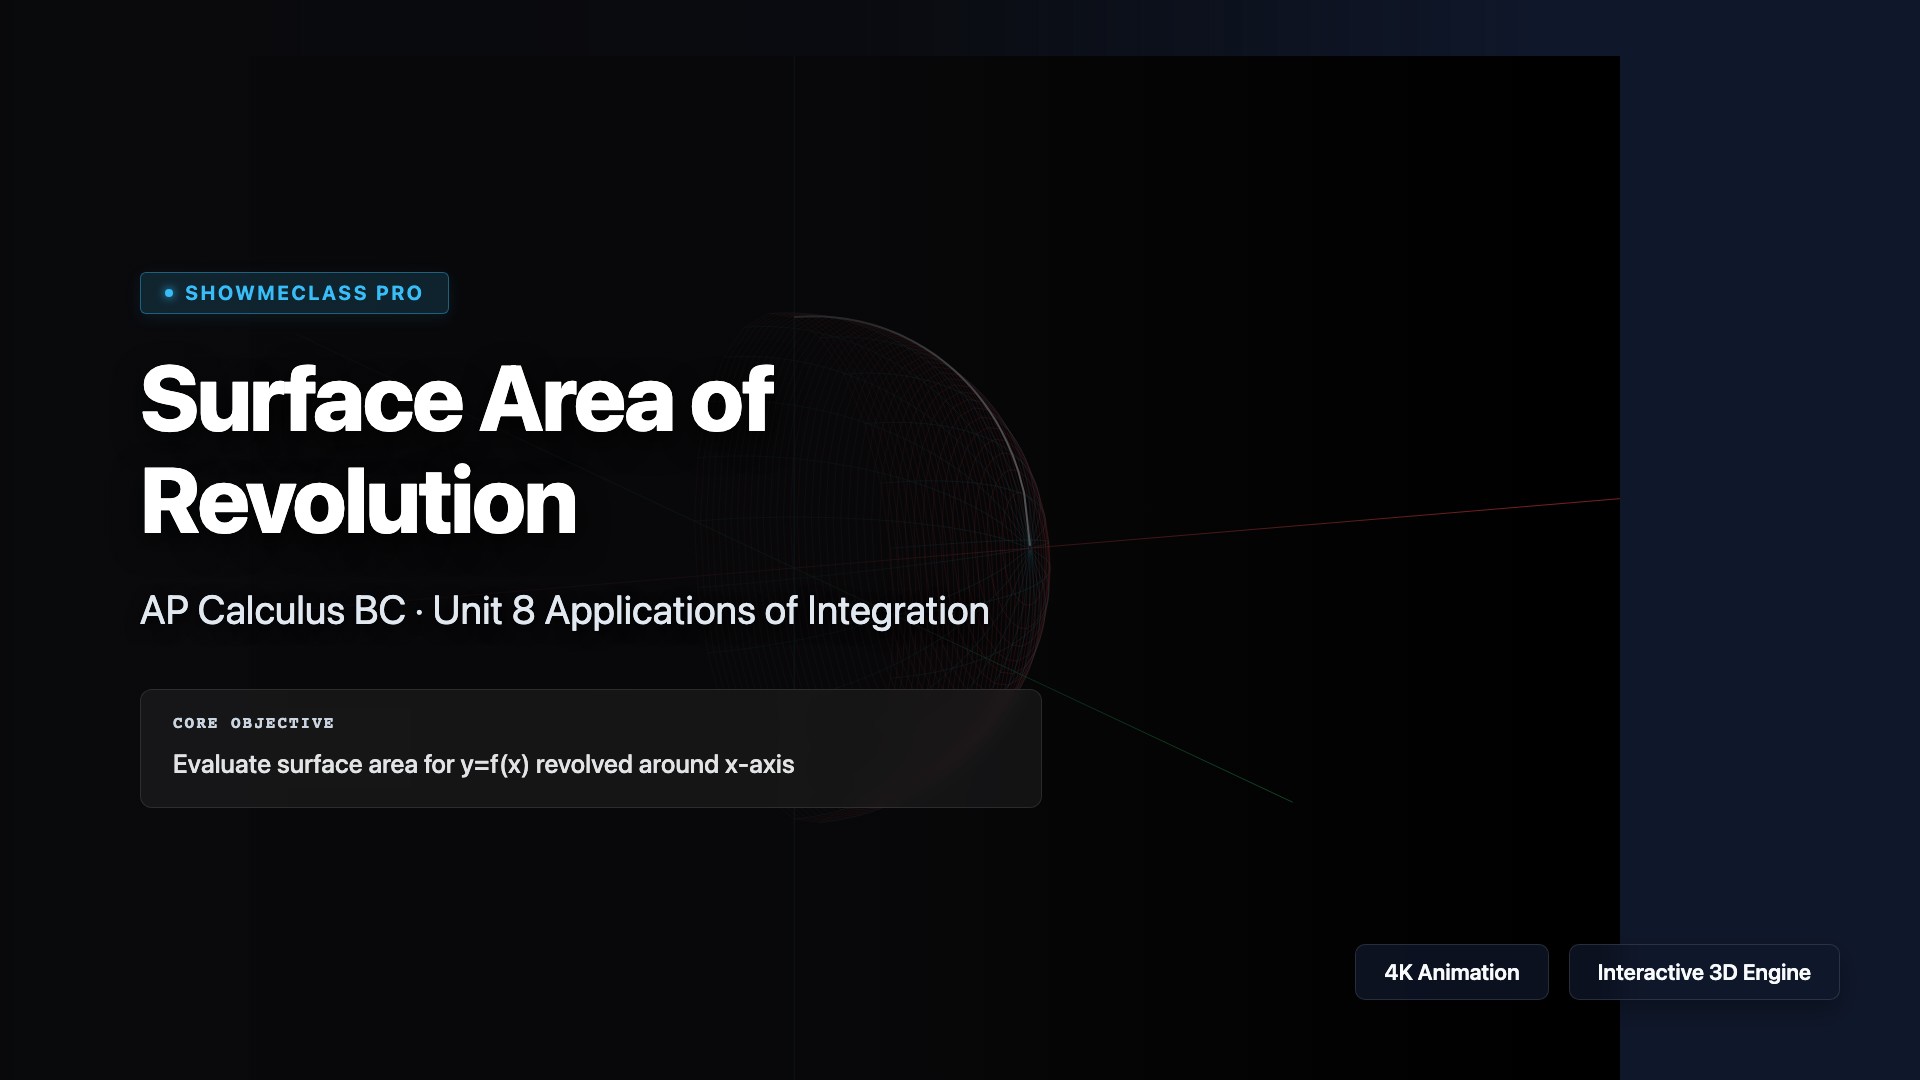
Surface Area of Revolution
3D wireframe rendering of surfaces of revolution around the x-axis. Demonstrates S = ∫2πf(x)√(1+f'(x)²)dx with interactive rotation angle and bounds. Explore Sphere, Cone, Gabriel's Horn, and Sine Vase with drag-to-orbit camera.
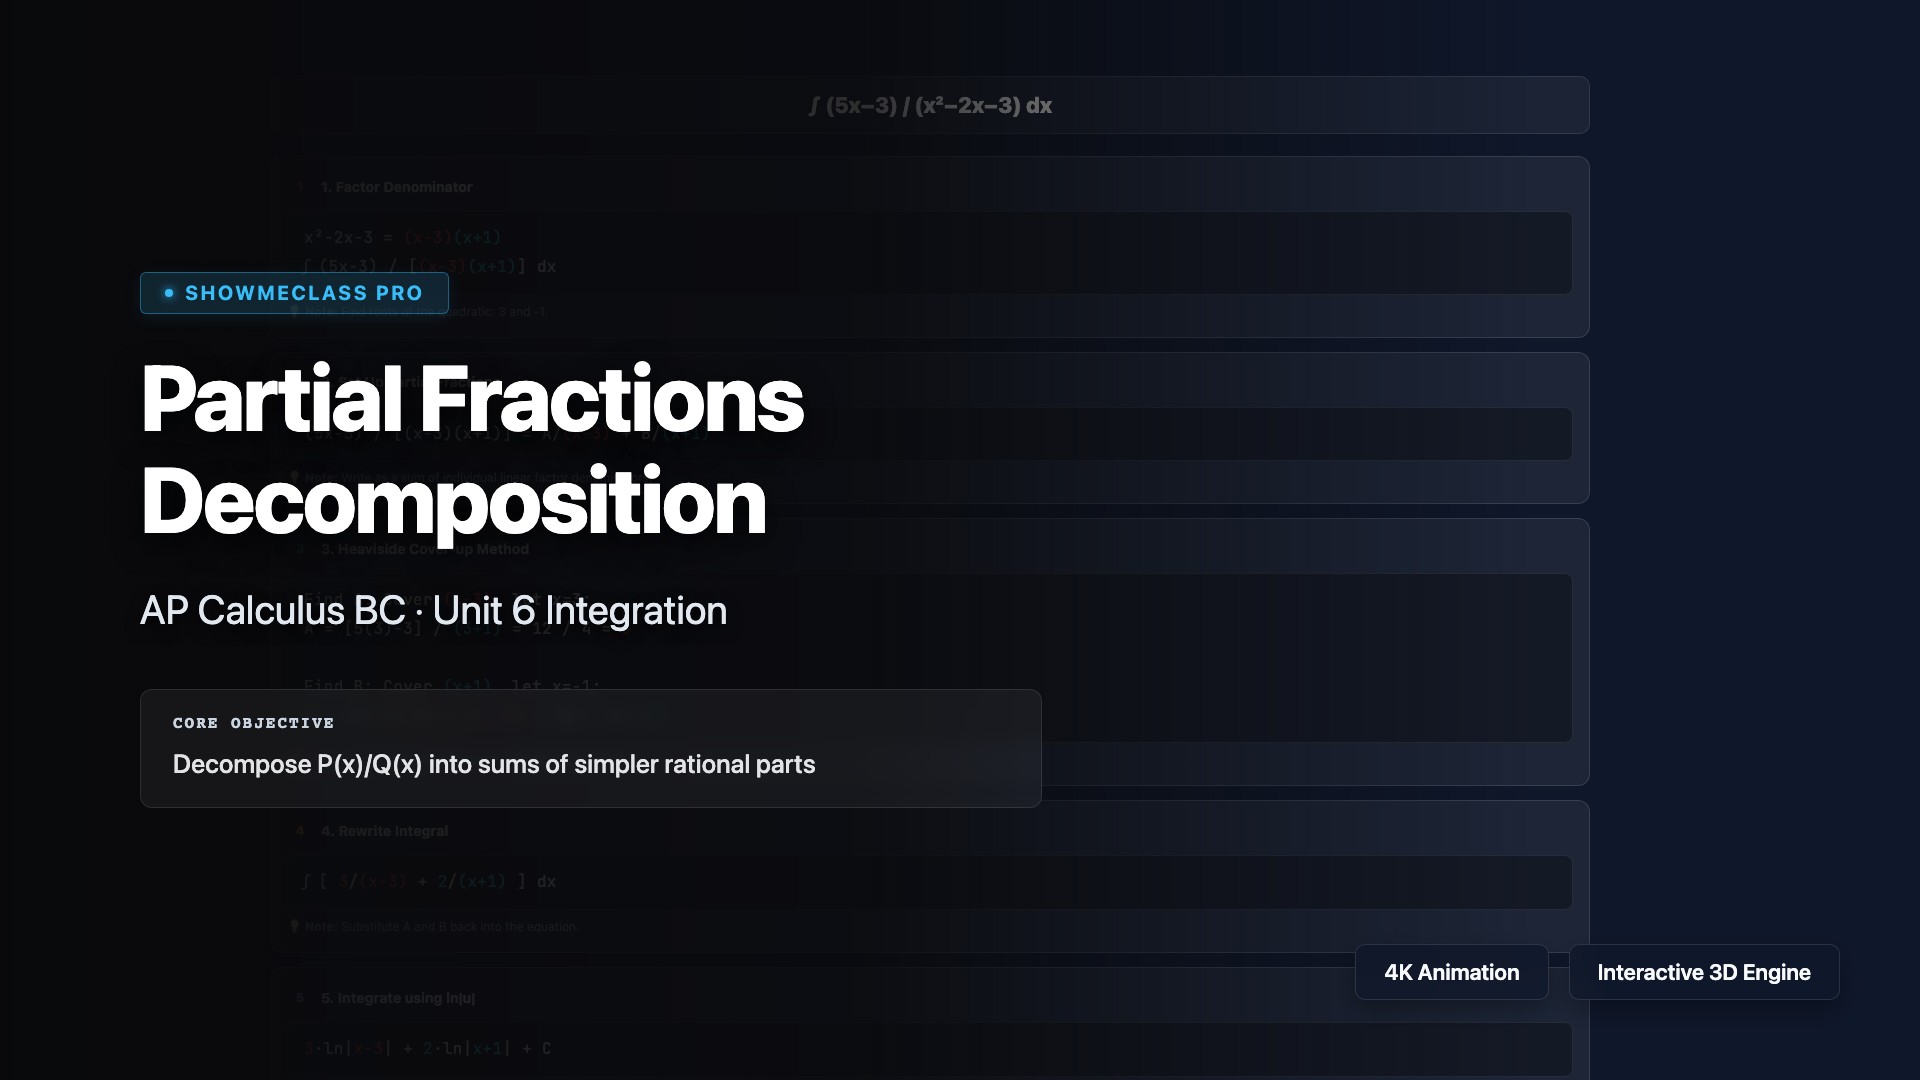
Partial Fractions Decomposition
Step-by-step partial fractions decomposition walkthrough using the Heaviside Cover-Up Method. Color-coded algebraic steps for 4 integral types including factoring, coefficient solving, and natural log integration with u-substitution bypass detection.
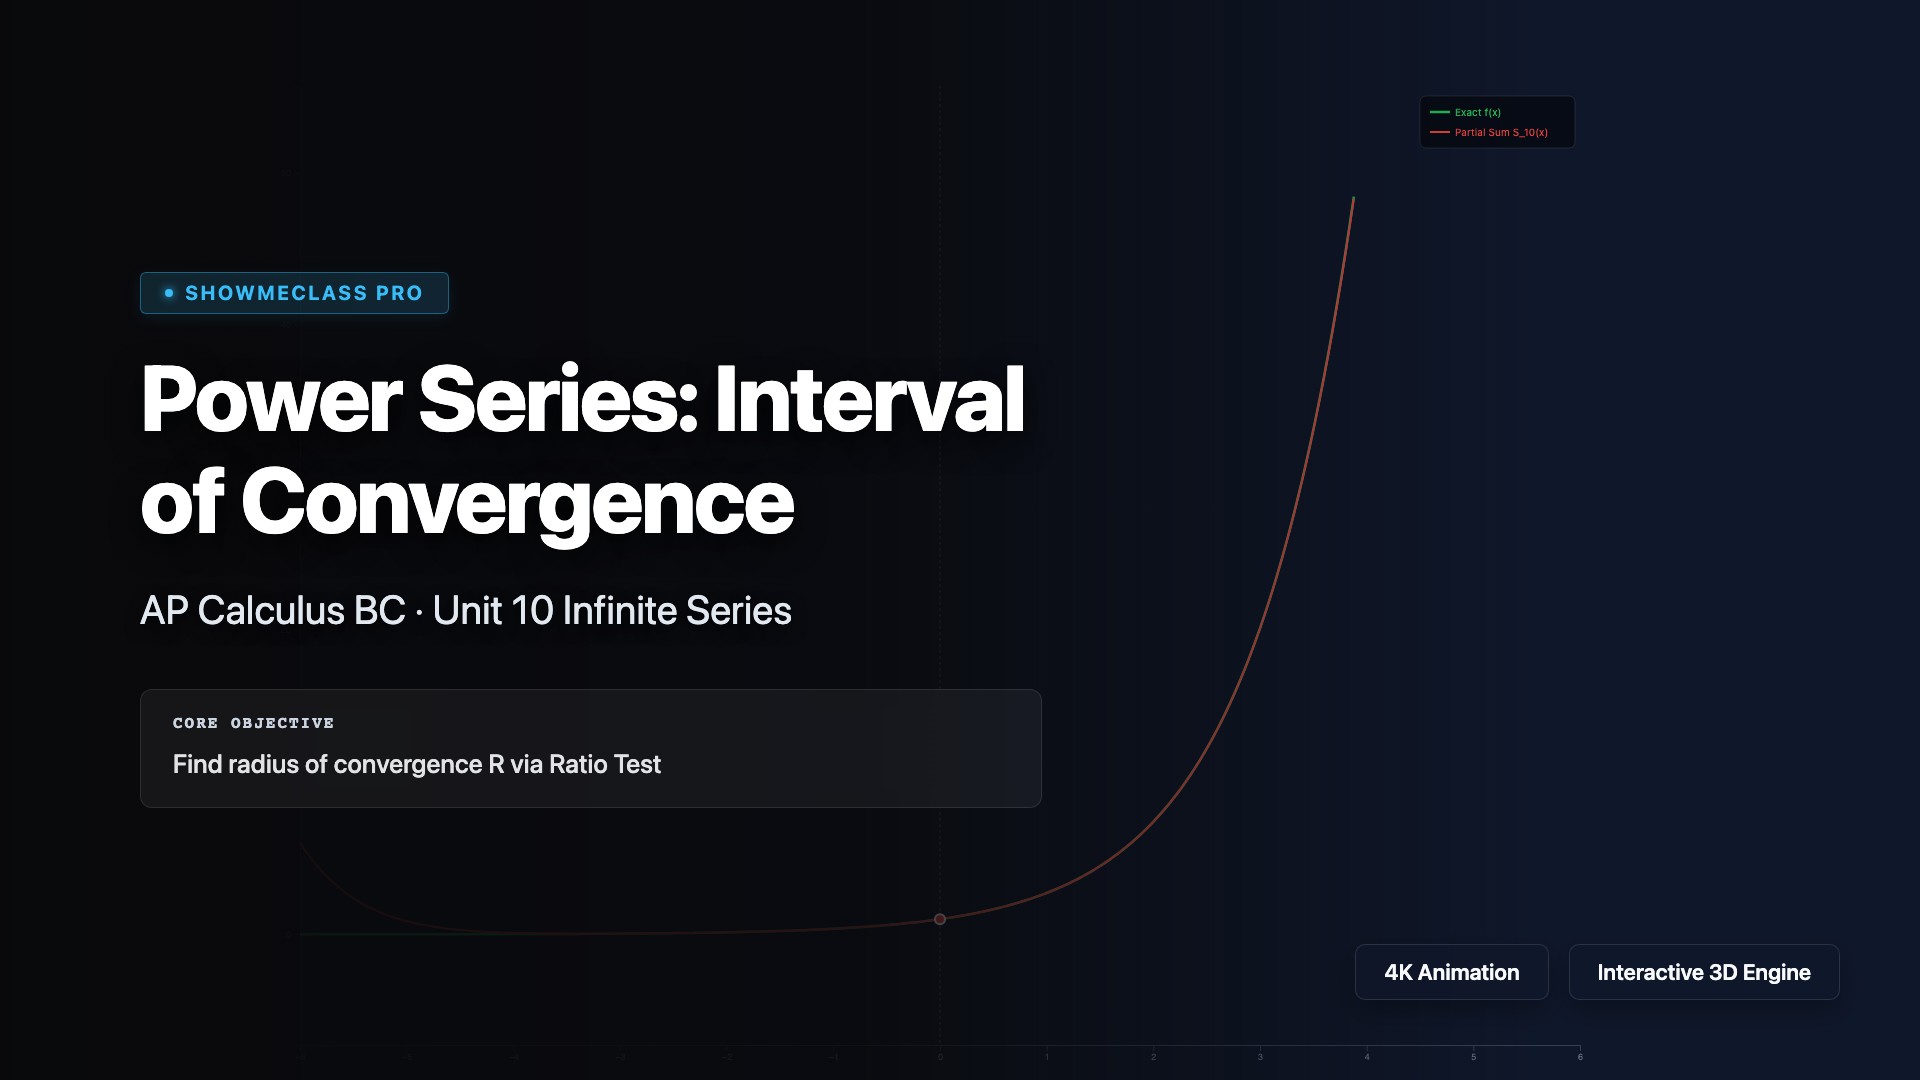
Power Series: Interval of Convergence
Interactive power series convergence visualizer comparing partial sums S_N(x) against exact functions. Shows convergence interval with amber boundary lines, Ratio Test explanations, and endpoint analysis for e^x, geometric, ln, cos(x), and n^n x^n/n! series.

Polar Area Between Curves
Polar coordinate area calculator for enclosed regions between two curves. Computes ½∫(R²−r²)dθ via Simpson's rule with adjustable α and β bounds. Visualizes Circle vs Cardioid, Rose vs Circle, Limaçon vs Circle, and dual Rose comparisons.
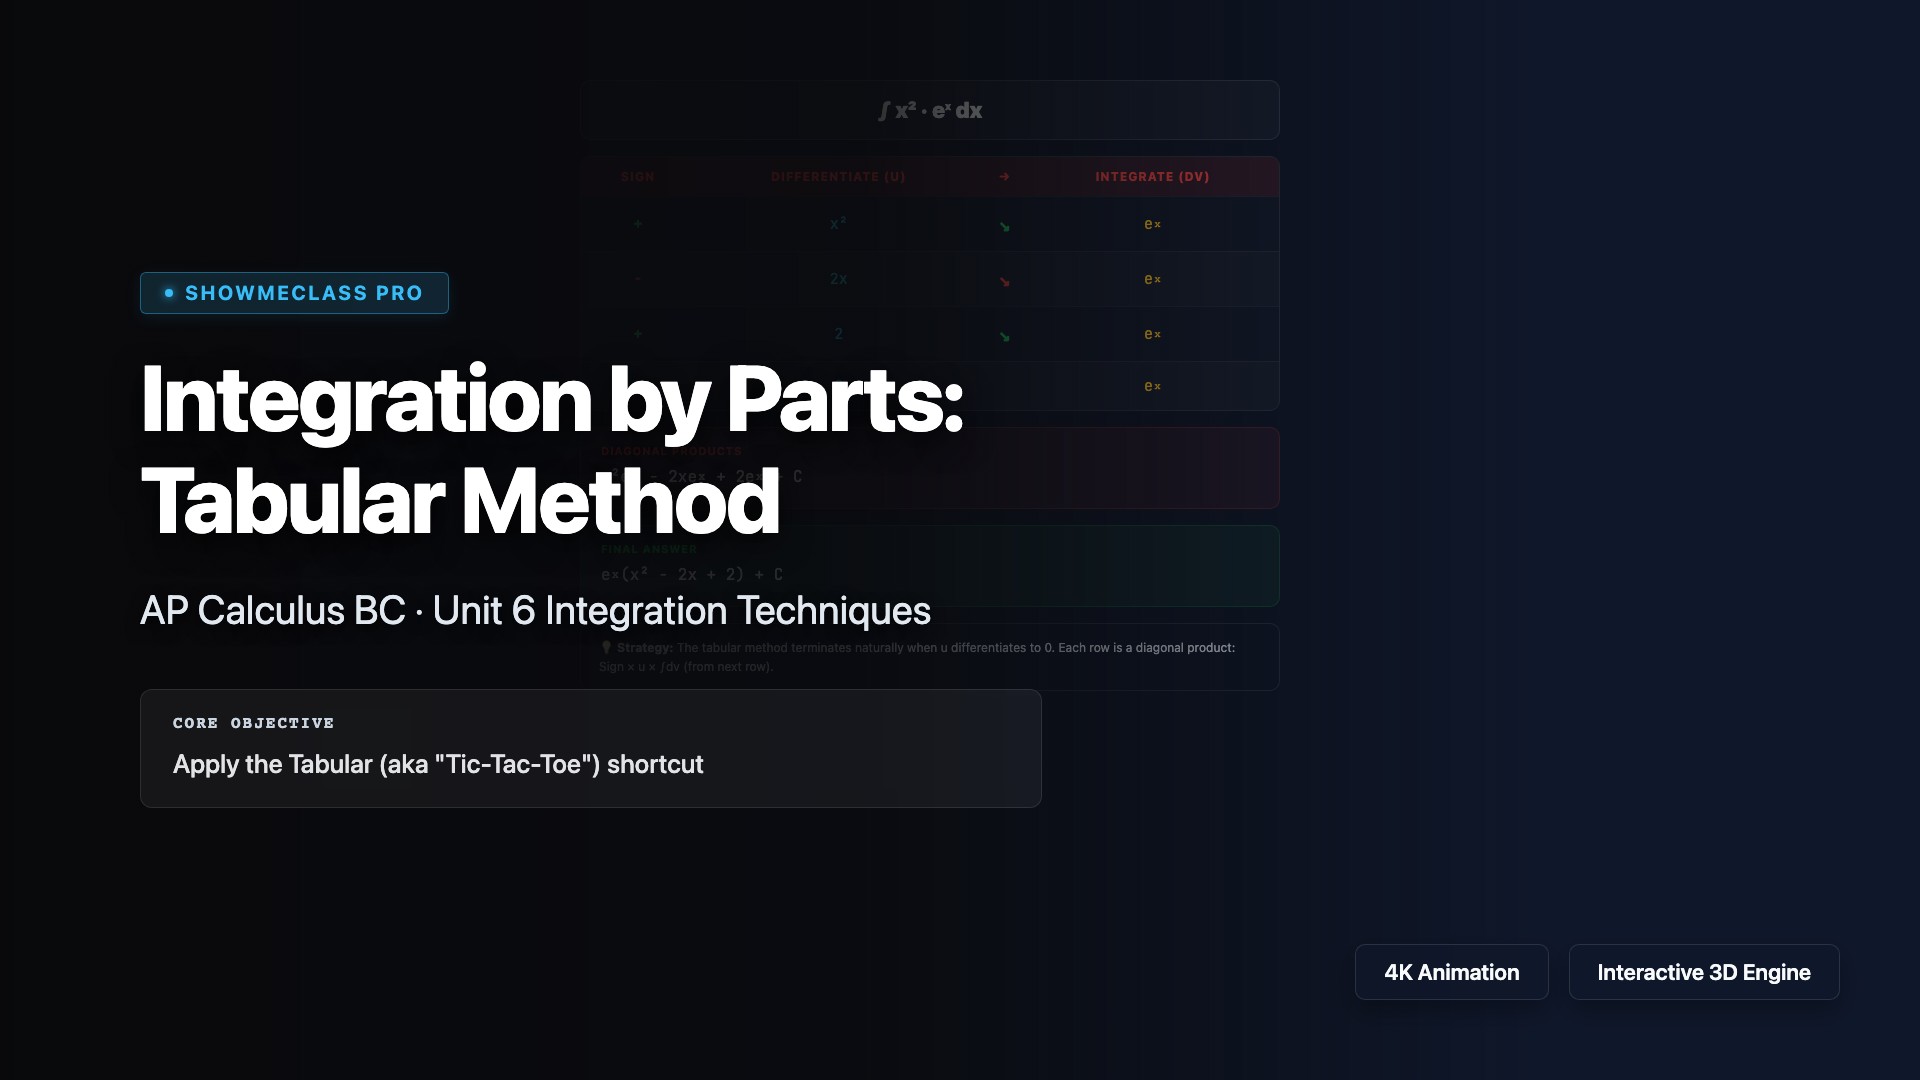
Integration by Parts: Tabular Method
Step-by-step Tabular (Tic-Tac-Toe) Method for Integration by Parts with diagonal product visualization, alternating signs, and LIATE selection rule. Covers polynomial×exp, polynomial×trig, logarithmic, and cyclic eˣ·sin(x) cases.