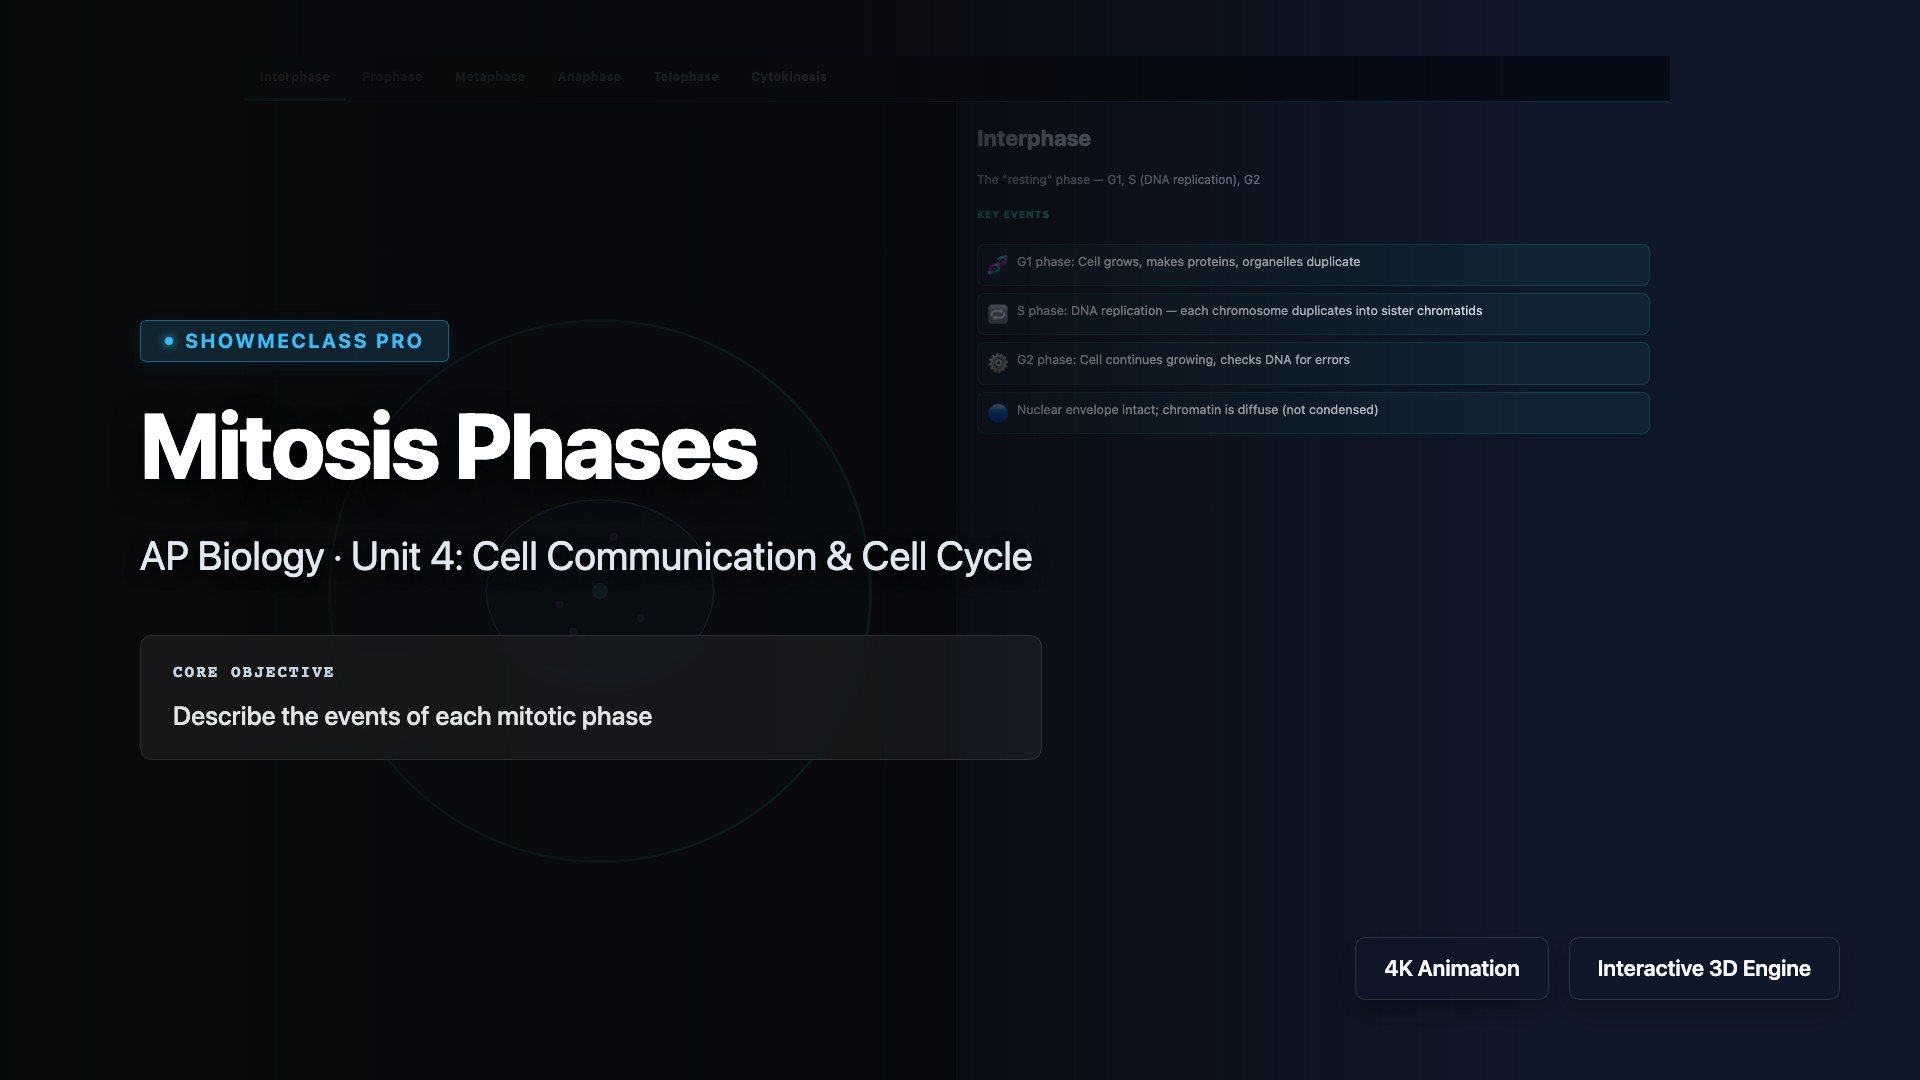
Mitosis Phases
Visualize the stages of mitosis—prophase, metaphase, anaphase, and telophase—the process by which a eukaryotic cell divides to produce two genetically identical daughter cells. Explore chromosome condensation, spindle fiber attachment at kinetochores, sister chromatid separation, and cytokinesis. Understand how mitosis maintains chromosome number and ensures accurate distribution of genetic material for growth, repair, and asexual reproduction.
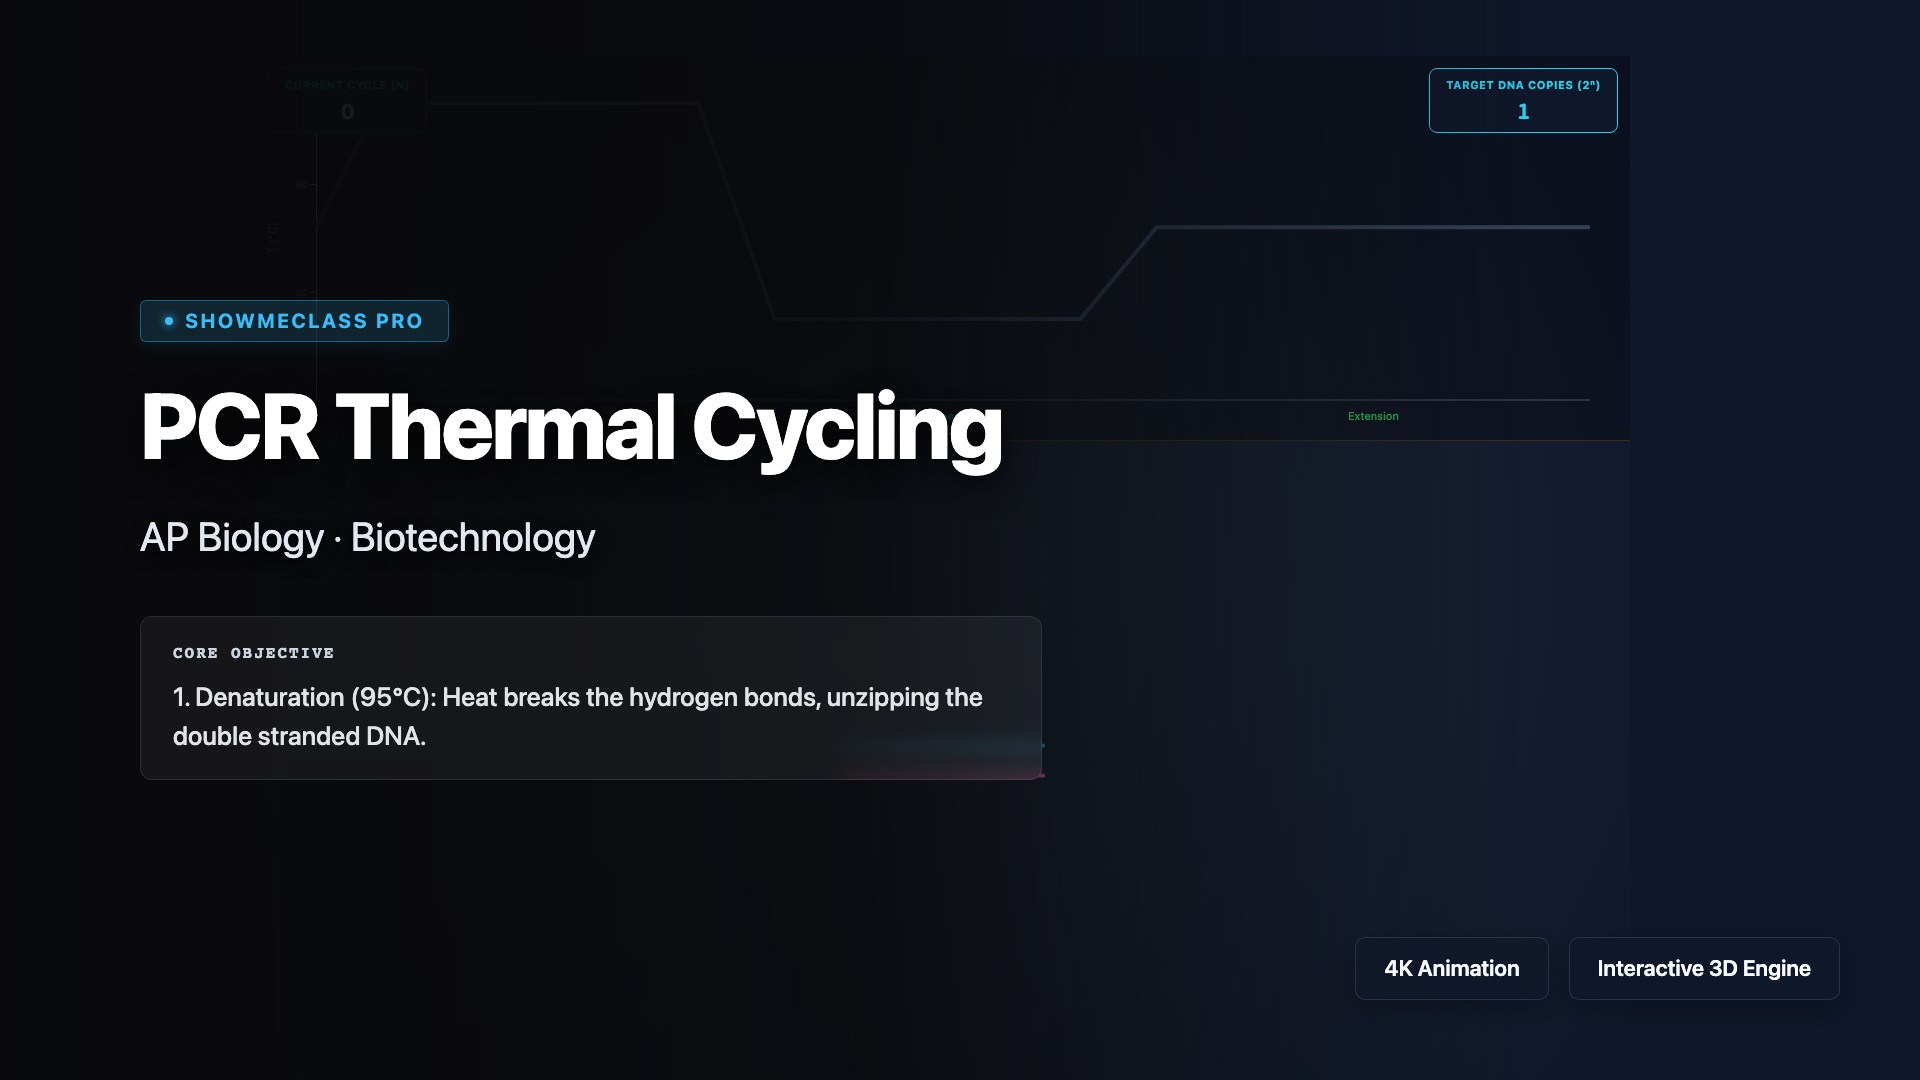
PCR Thermal Cycling
Simulate the polymerase chain reaction (PCR) technique that exponentially amplifies specific DNA sequences through repeated thermal cycling. Visualize the three temperature-dependent steps: denaturation (95°C separates DNA strands), annealing (55°C allows primers to bind), and extension (72°C enables Taq polymerase to synthesize new strands). Understand how PCR enables DNA cloning, forensics, medical diagnostics, and genetic research.
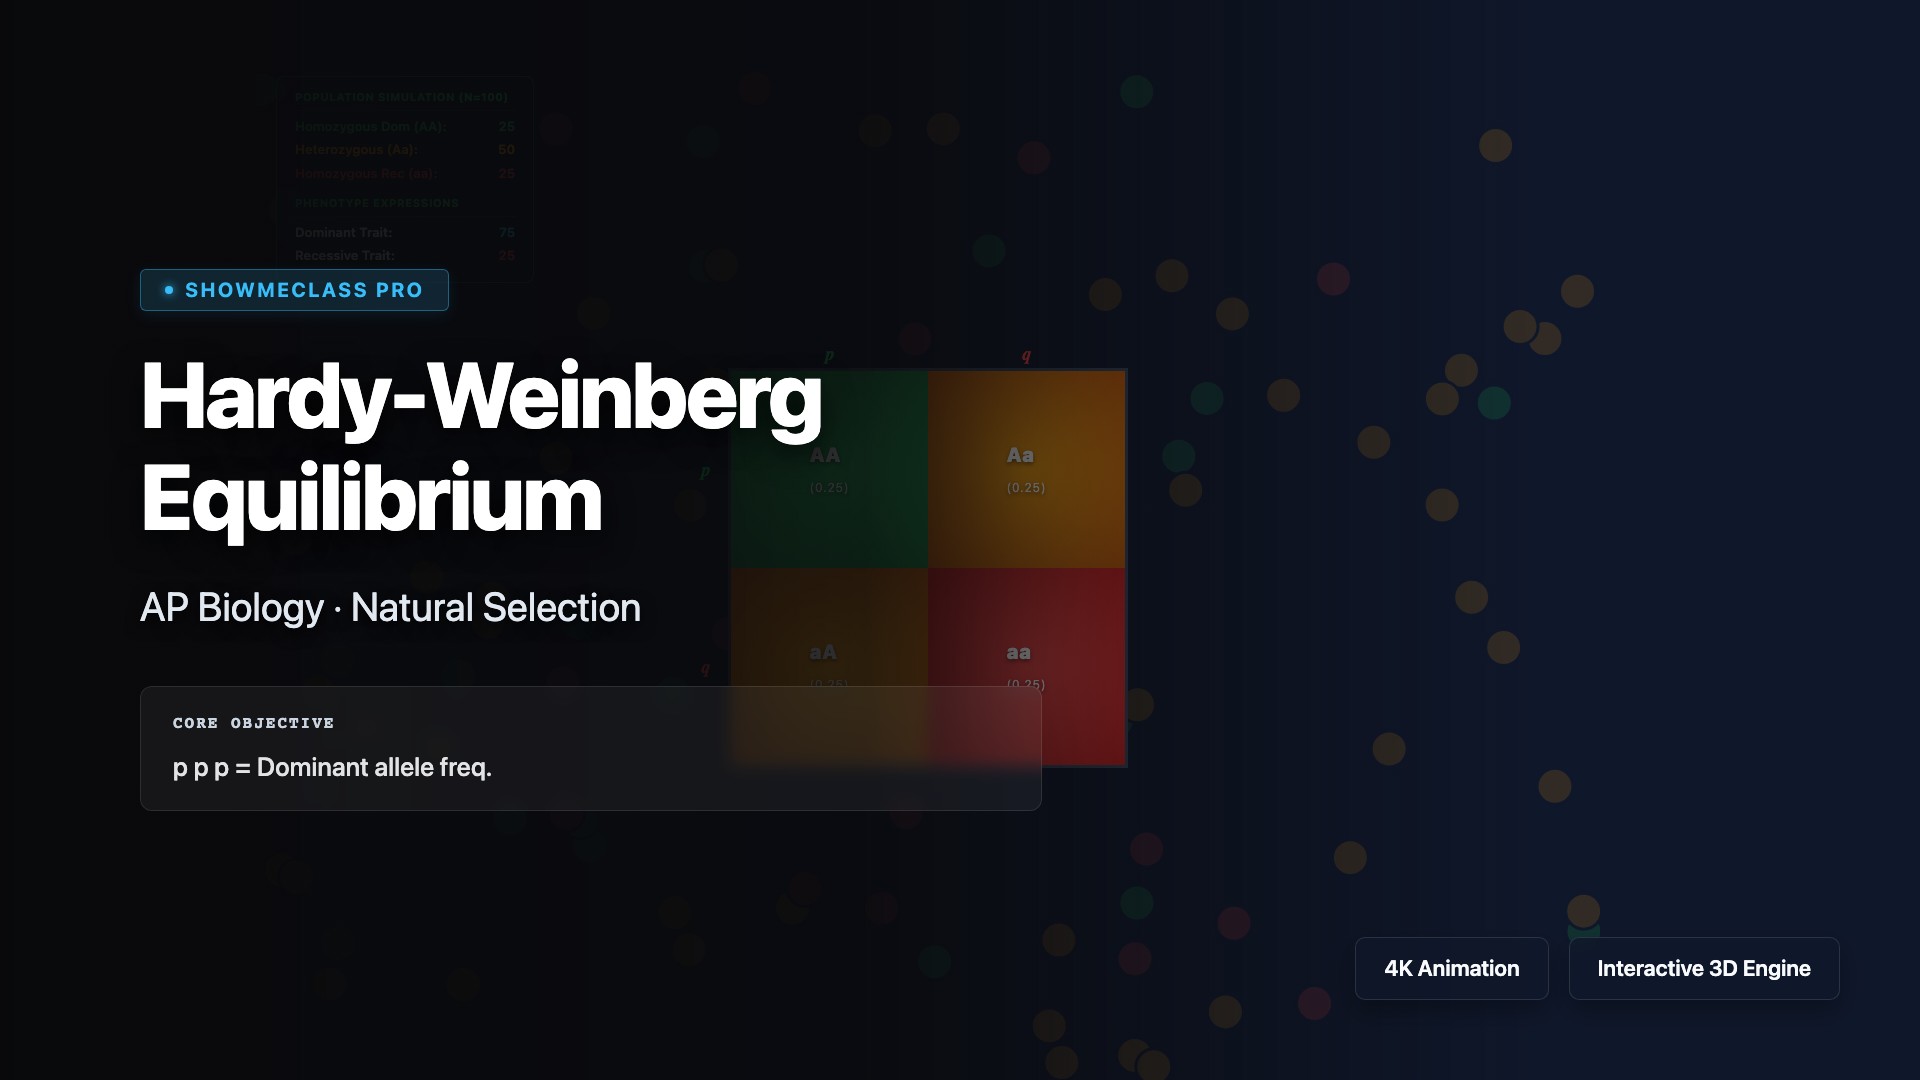
Hardy-Weinberg Equilibrium
Explore the Hardy-Weinberg equilibrium model to predict allele and genotype frequencies in non-evolving populations. Use the equations p² + 2pq + q² = 1 and p + q = 1 to calculate frequencies, and understand how violations of the five conditions (no mutation, random mating, no gene flow, infinite population size, no selection) indicate evolutionary change.
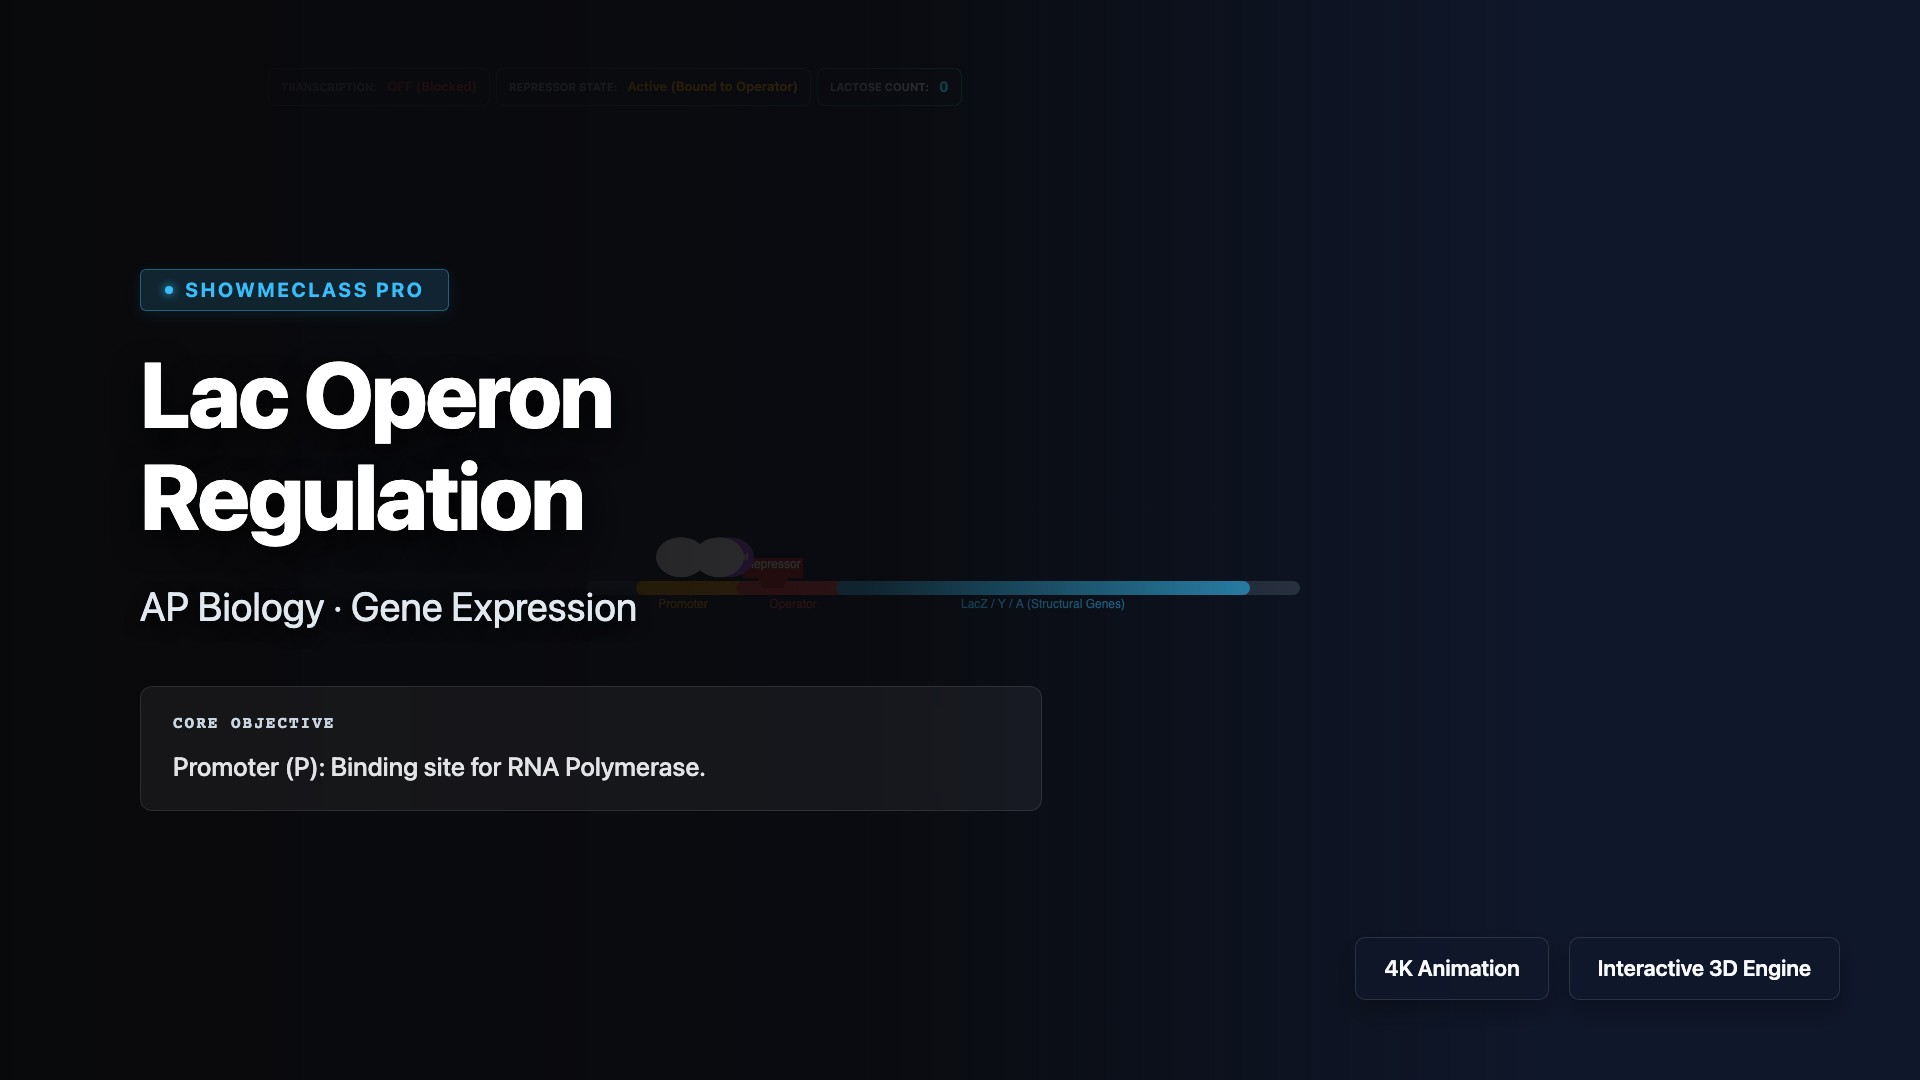
Lac Operon Regulation
Explore prokaryotic gene regulation through the lac operon in E. coli, a classic model of negative and positive control. Visualize how the repressor protein blocks transcription in the absence of lactose, and how lactose (allolactose) acts as an inducer to allow transcription of genes encoding β-galactosidase, permease, and transacetylase. Understand CAP-cAMP positive regulation under low glucose conditions.
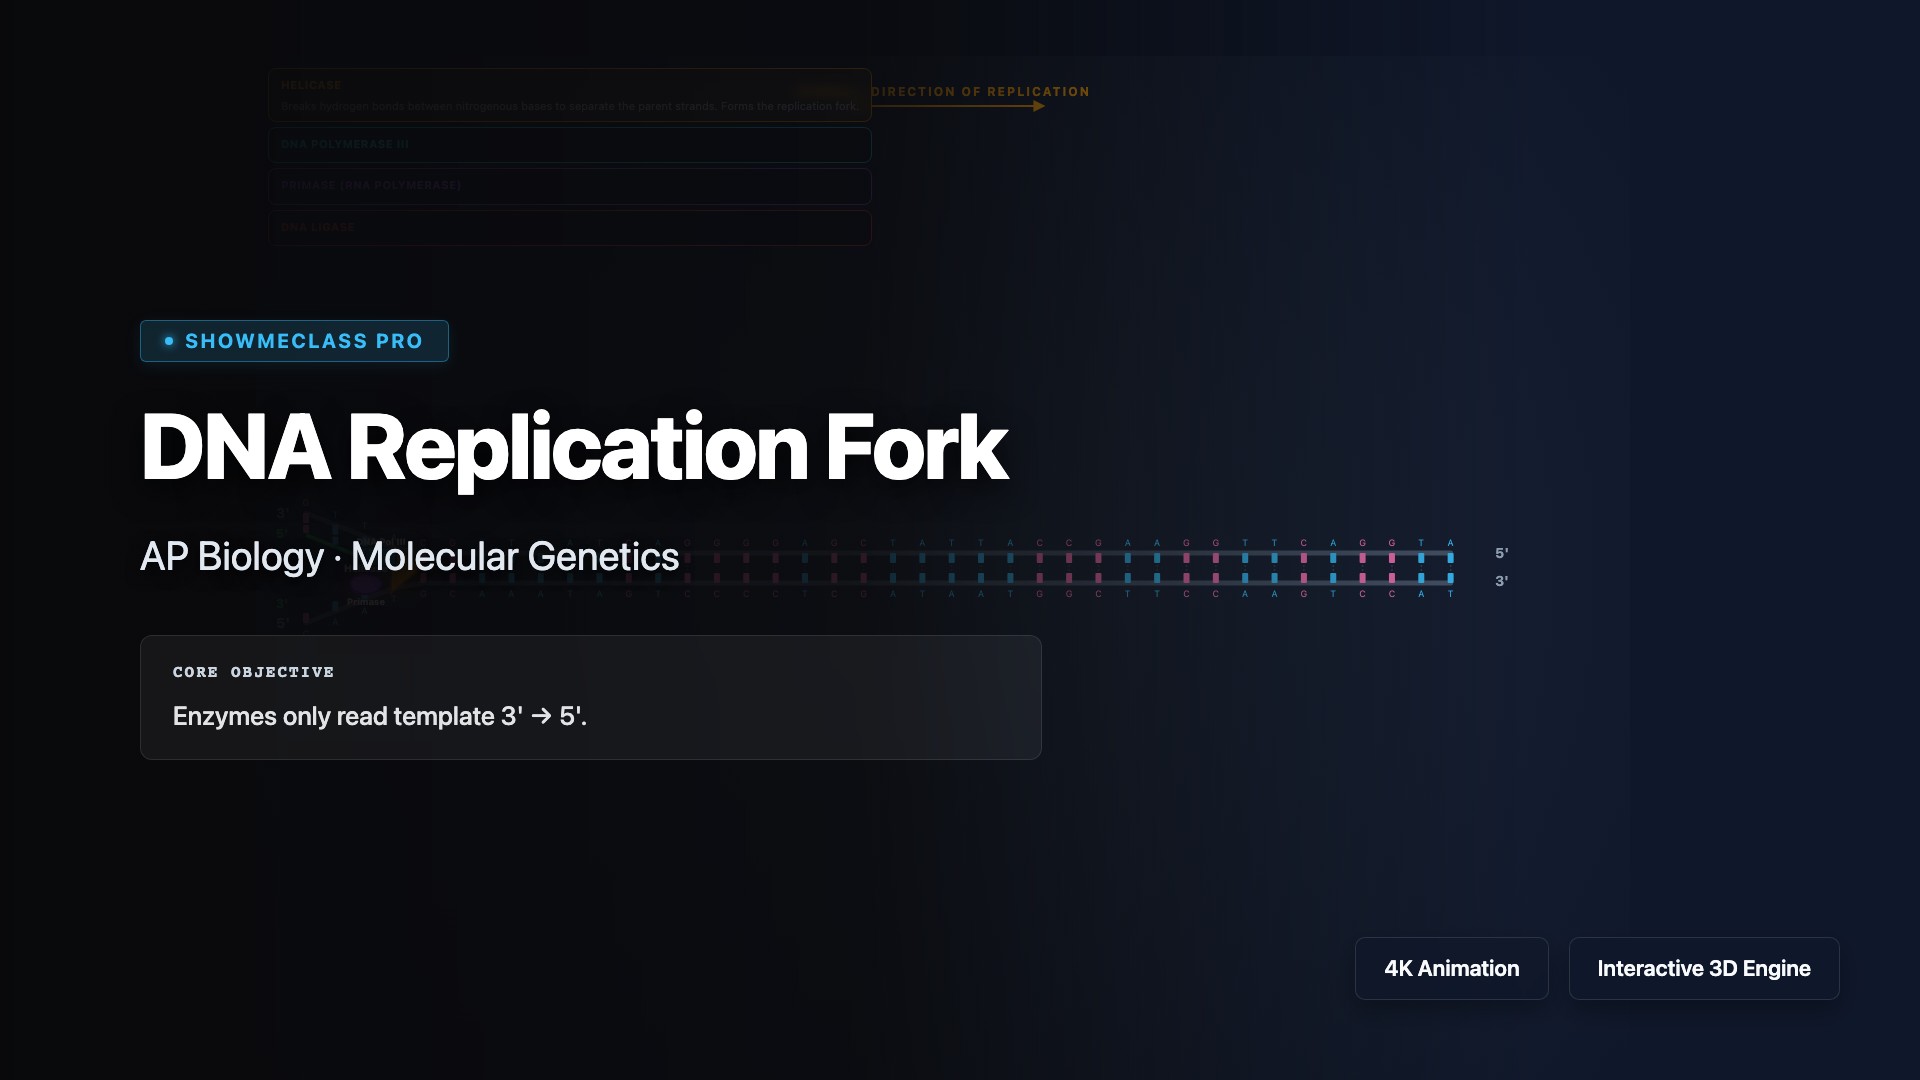
DNA Replication Fork
Visualize the semiconservative DNA replication process at the replication fork, including the roles of helicase, primase, DNA polymerase III, and ligase. Explore how the leading strand is synthesized continuously 5' to 3' while the lagging strand forms discontinuous Okazaki fragments, and understand the proofreading mechanisms that ensure replication fidelity.
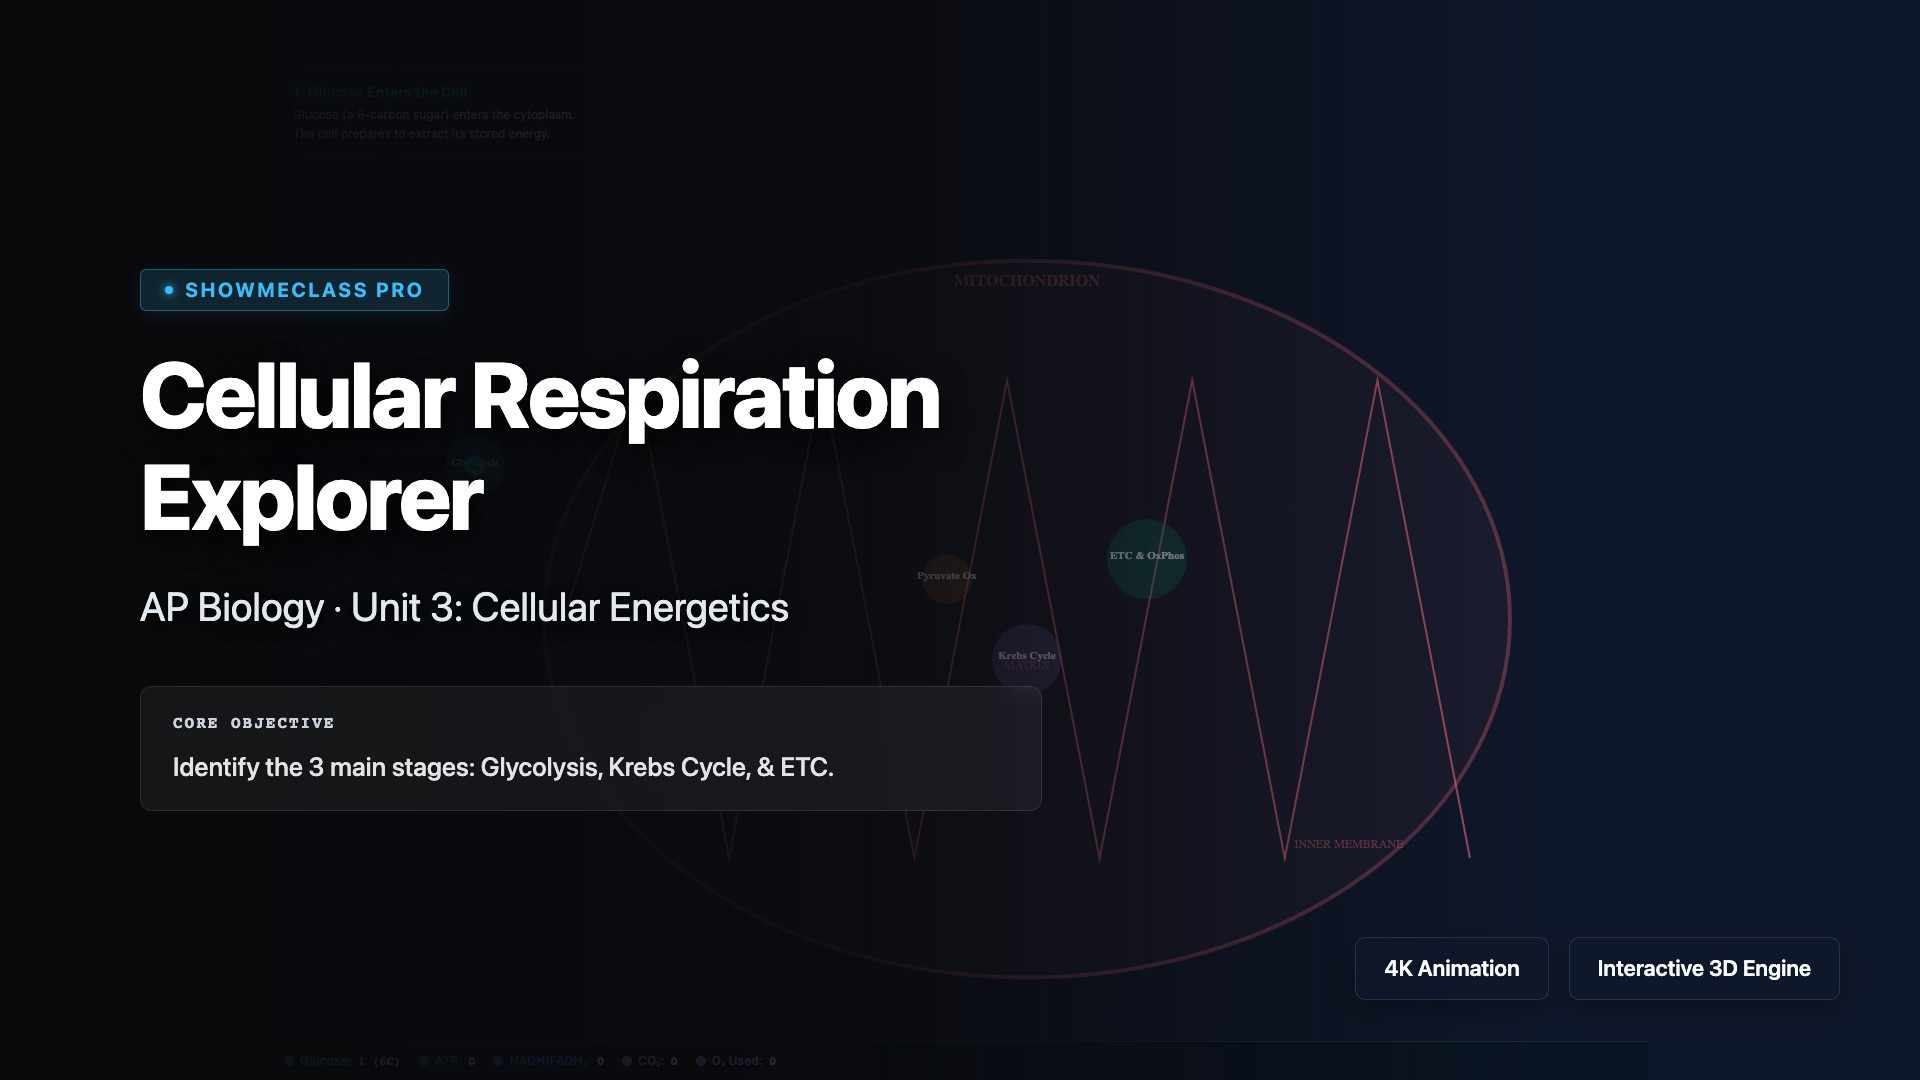
Cellular Respiration Explorer
Step through the complete cellular respiration pathway from glucose to ATP. Explore glycolysis in the cytoplasm, the Krebs cycle in the mitochondrial matrix, and oxidative phosphorylation in the inner membrane. Track the production of ATP, NADH, FADH₂, and CO₂ at each stage to understand how cells extract energy from organic molecules.
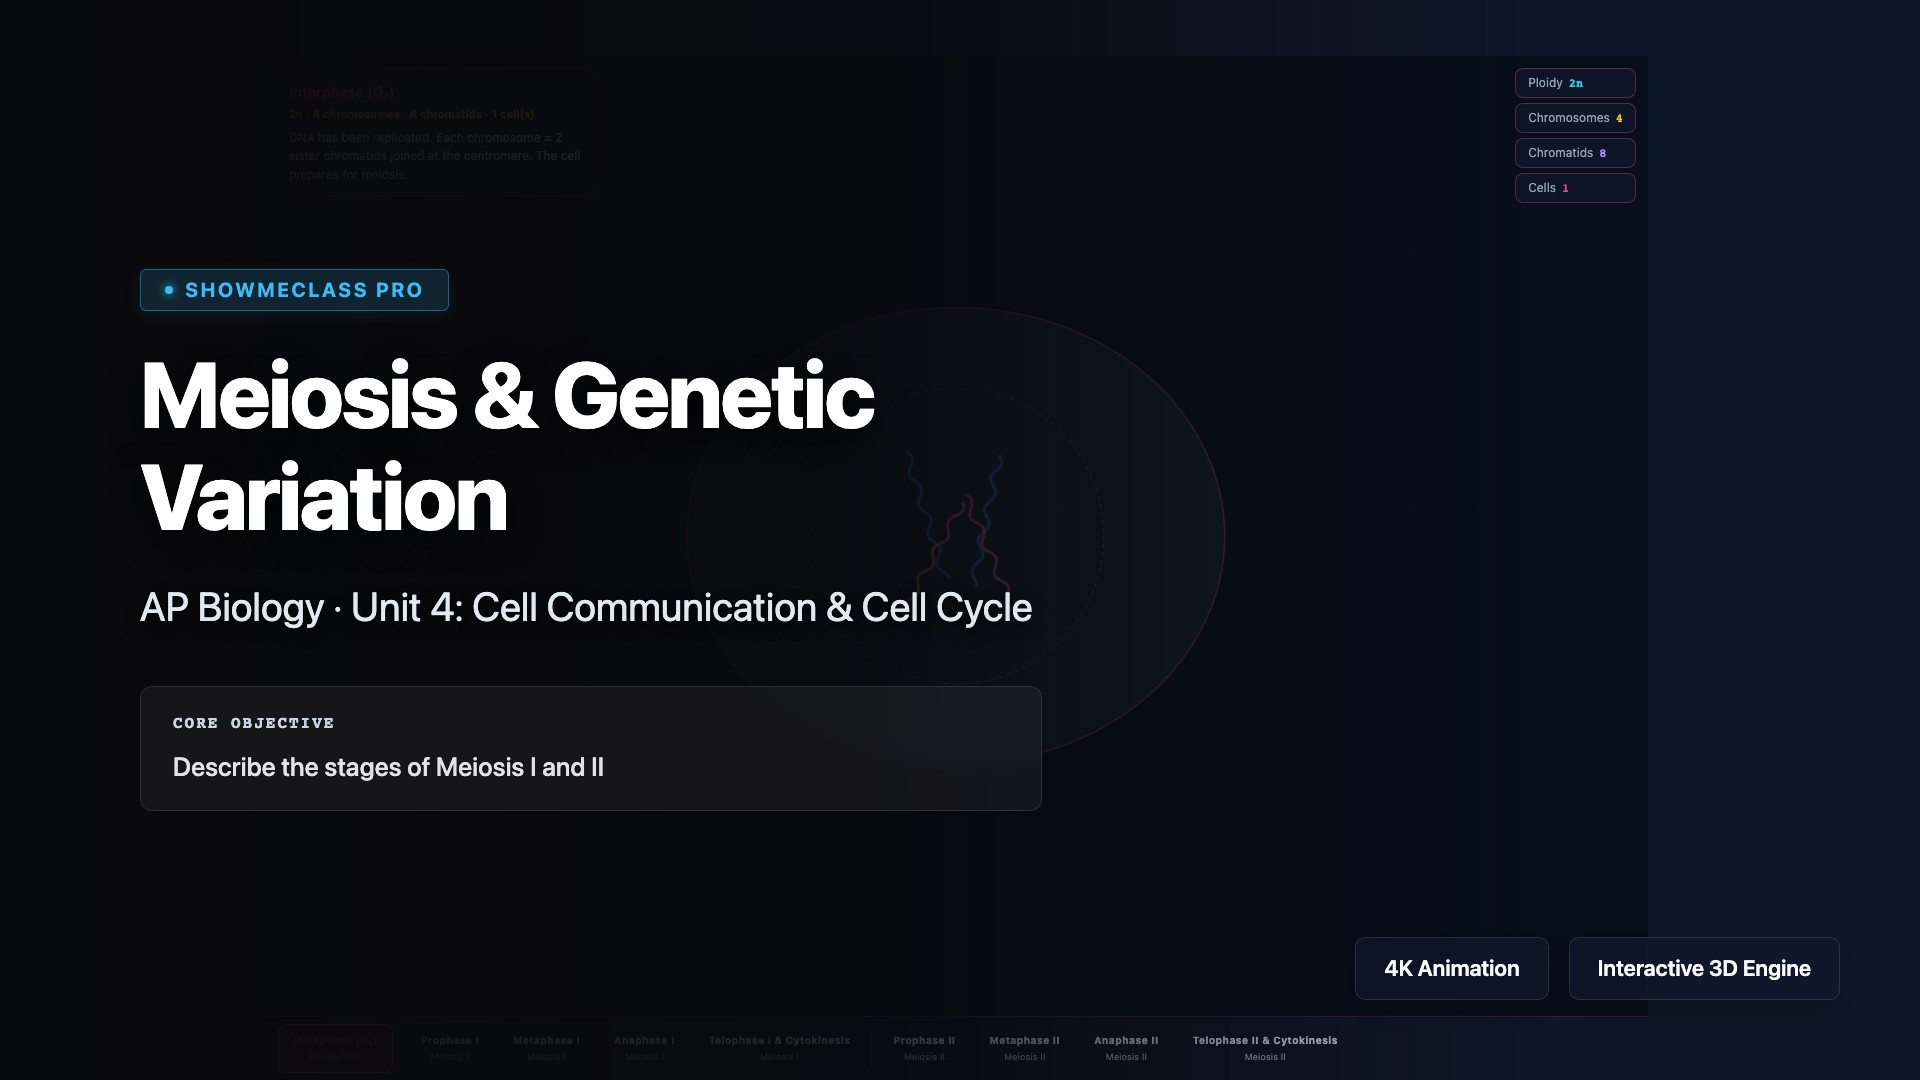
Meiosis & Genetic Variation
Visualize the stages of meiosis I and meiosis II, the specialized cell division that produces four haploid gametes from one diploid cell. Explore how crossing over during prophase I and independent assortment during metaphase I generate genetic variation, and understand how meiosis reduces chromosome number while maintaining genetic diversity essential for sexual reproduction.
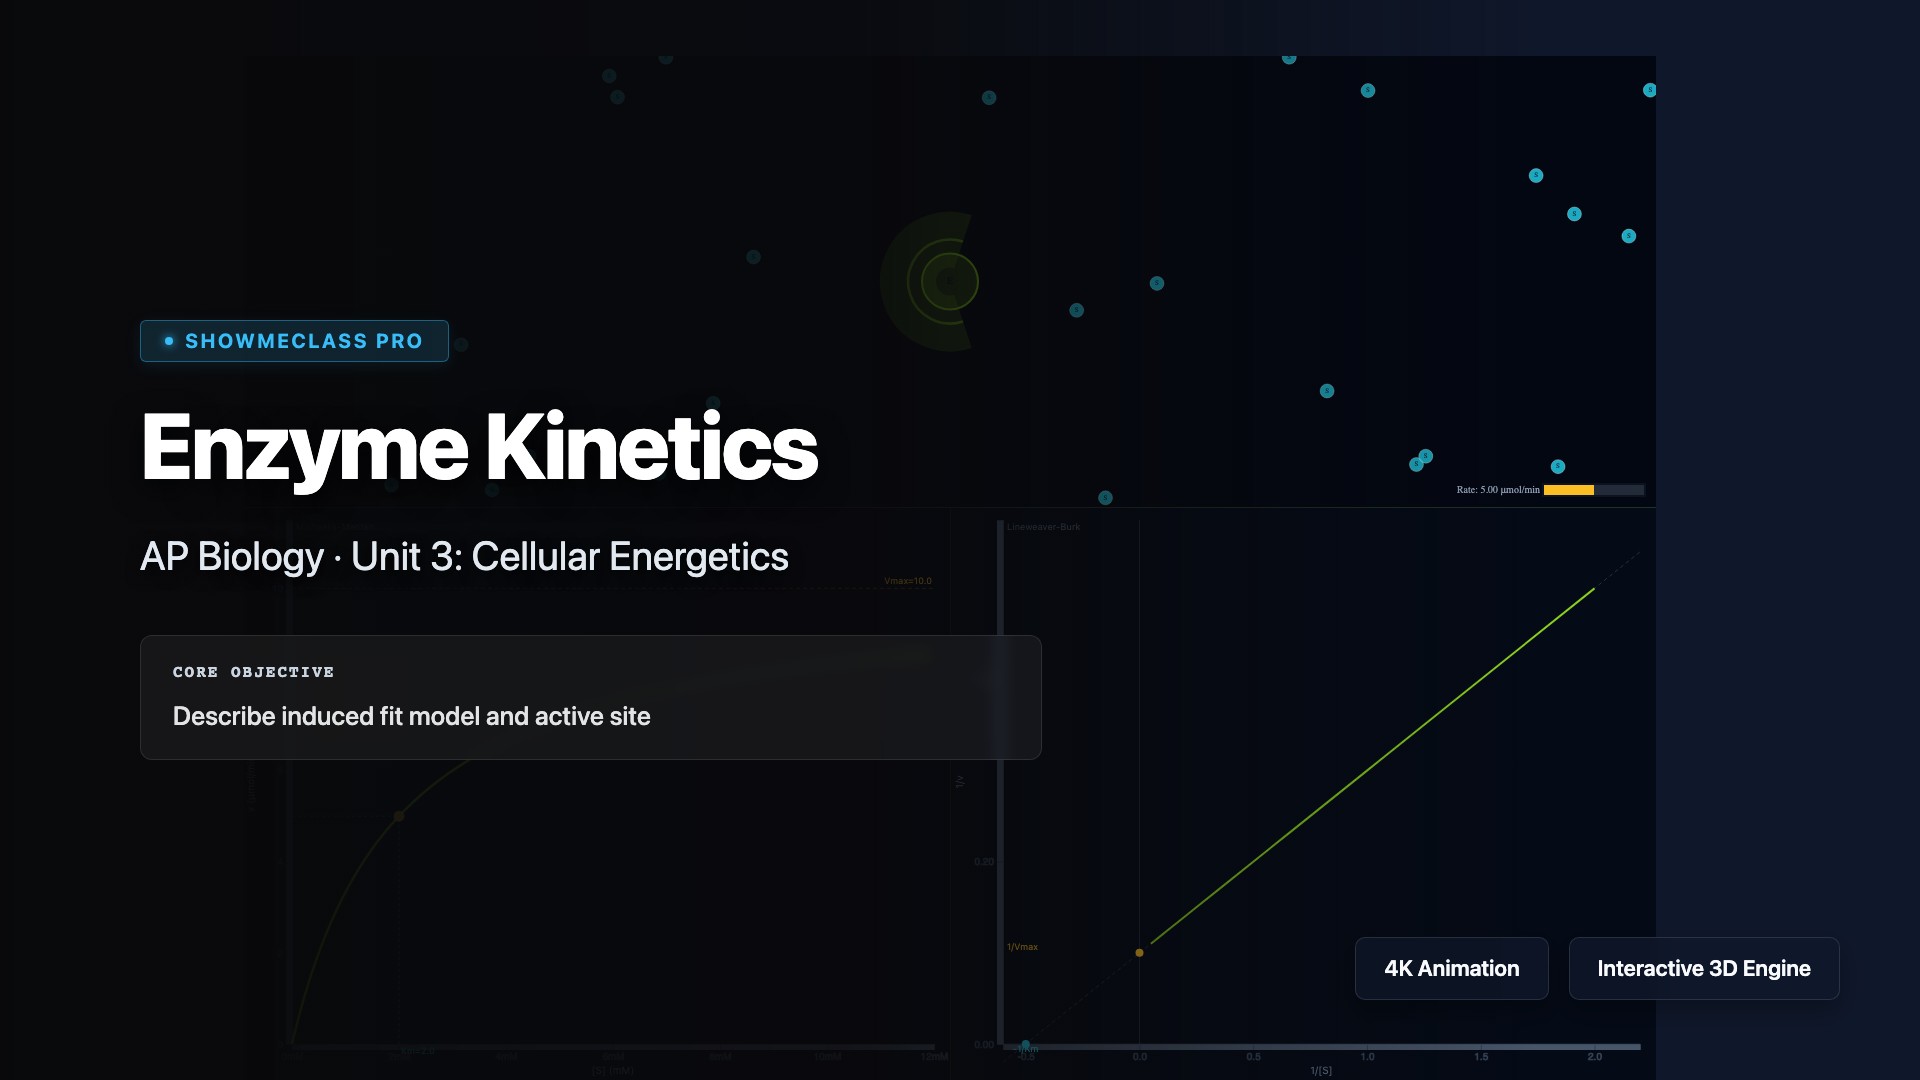
Enzyme Kinetics
Explore enzyme kinetics through Michaelis-Menten models, visualizing how substrate concentration affects reaction velocity. Understand key parameters including Vmax (maximum velocity), Km (Michaelis constant), and how competitive and non-competitive inhibitors alter enzyme activity by affecting substrate binding and catalytic efficiency.
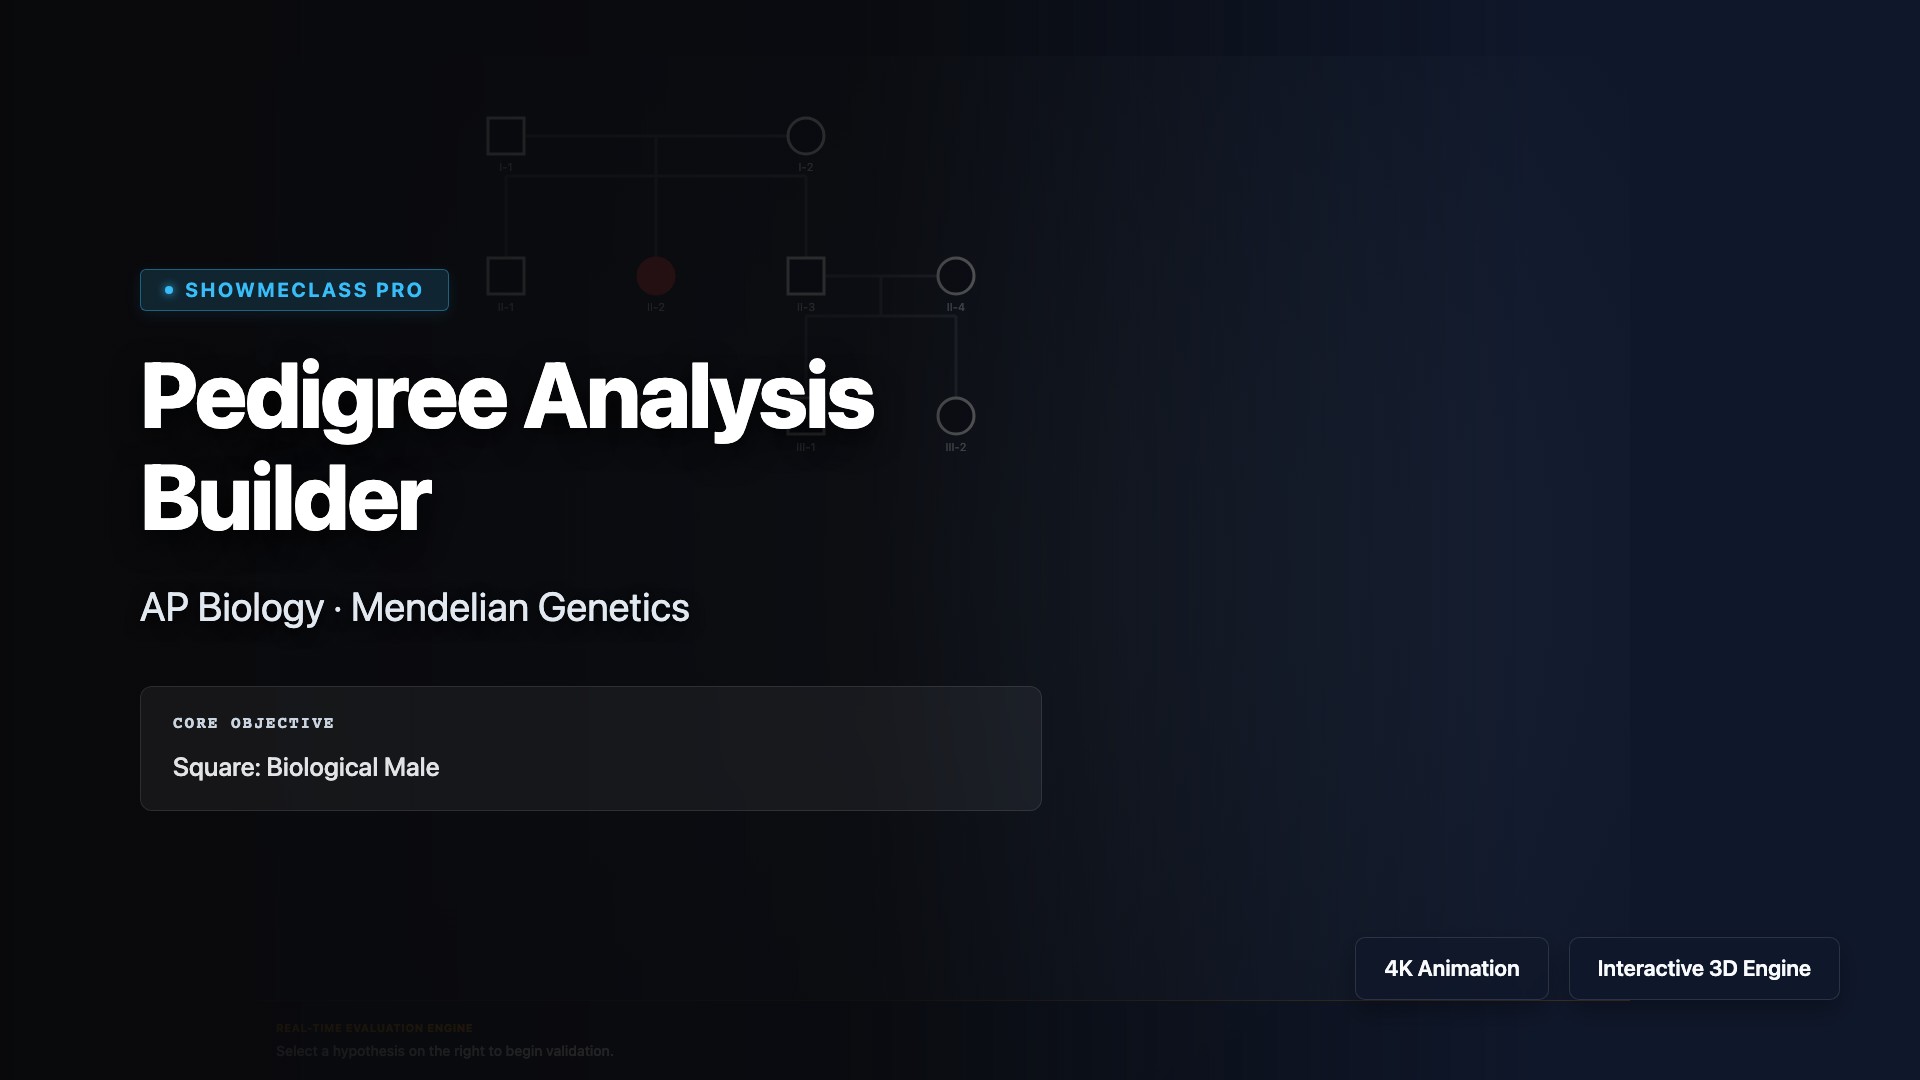
Pedigree Analysis Builder
Build and analyze pedigrees to trace inheritance patterns of genetic traits through family trees. Learn to identify autosomal dominant, autosomal recessive, X-linked recessive, and X-linked dominant inheritance patterns by examining affected individuals across generations. Practice determining genotypes, calculating probabilities, and distinguishing between different modes of inheritance using standard pedigree symbols.
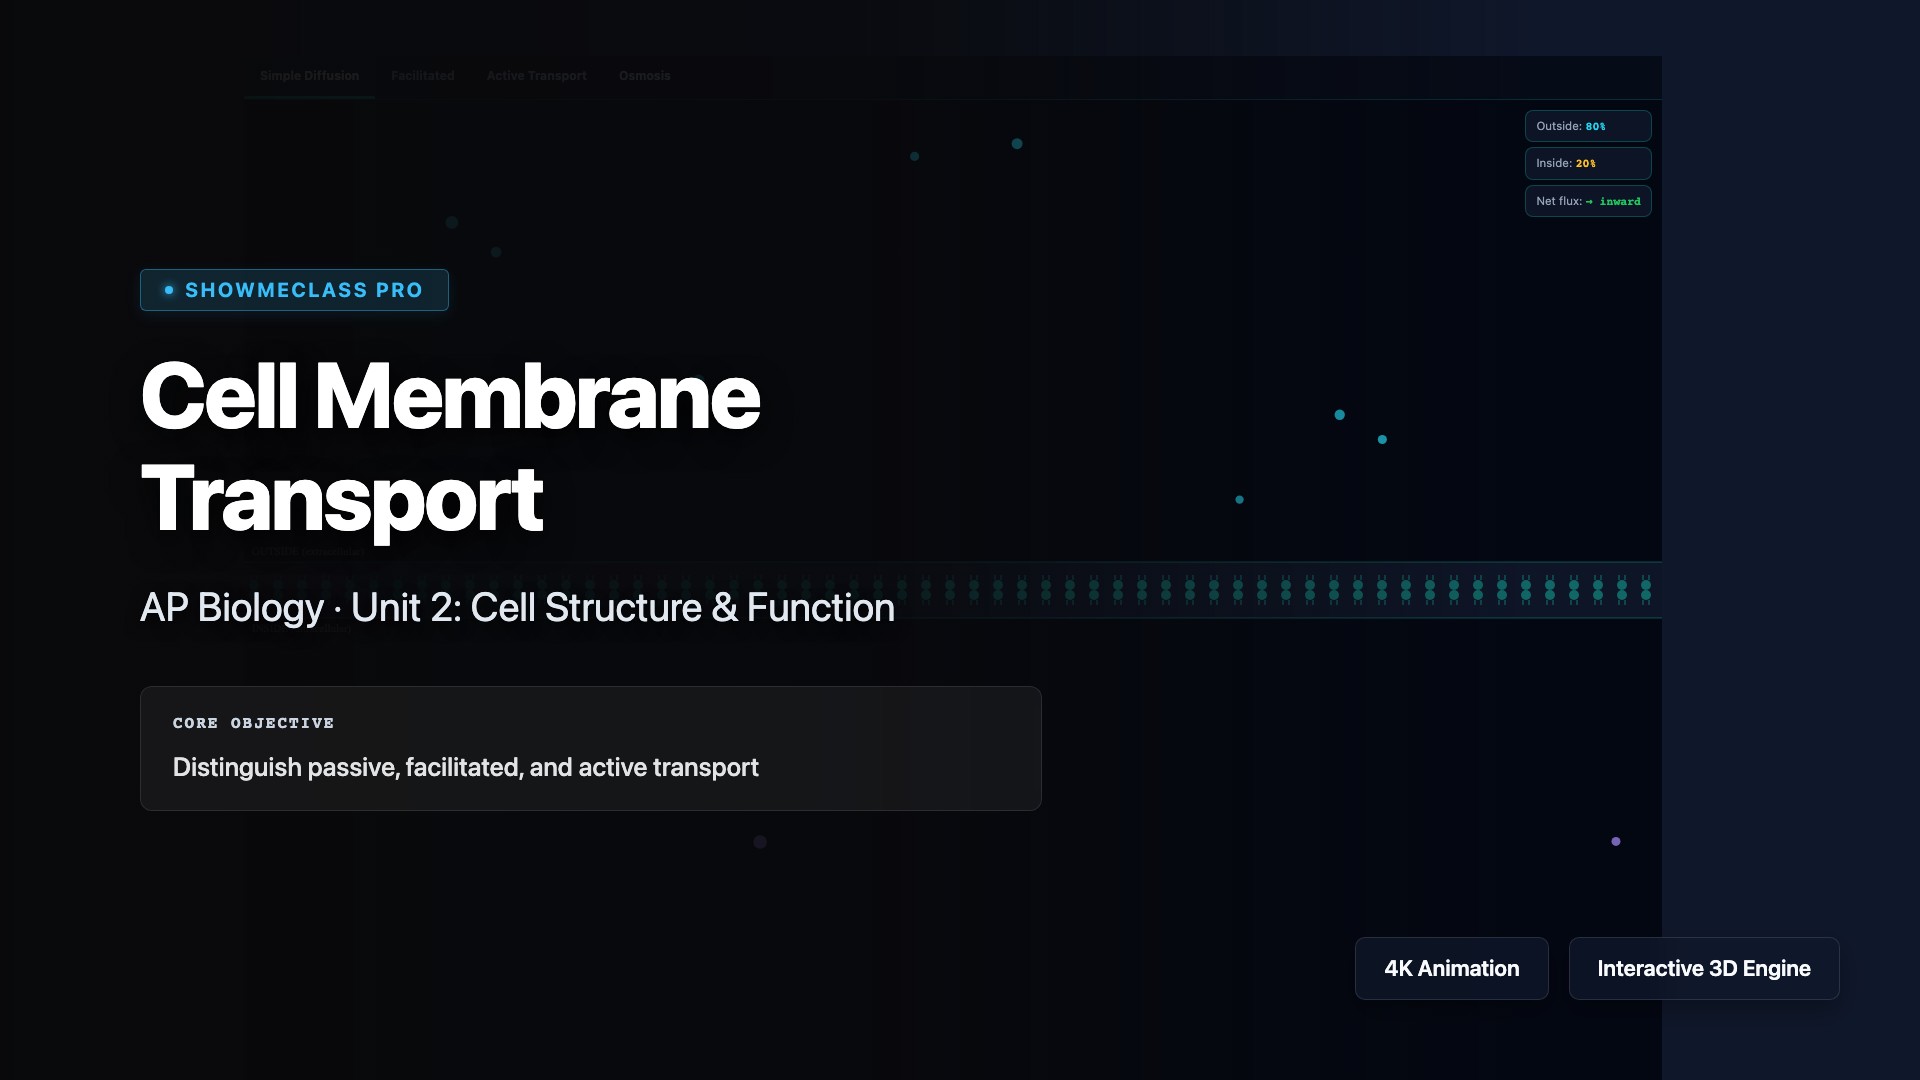
Cell Membrane Transport
Compare passive and active transport mechanisms across the selectively permeable cell membrane. Observe simple diffusion, facilitated diffusion, osmosis, and active transport (including sodium-potassium pumps and endocytosis). Adjust concentration gradients and ATP availability to see how cells maintain homeostasis.
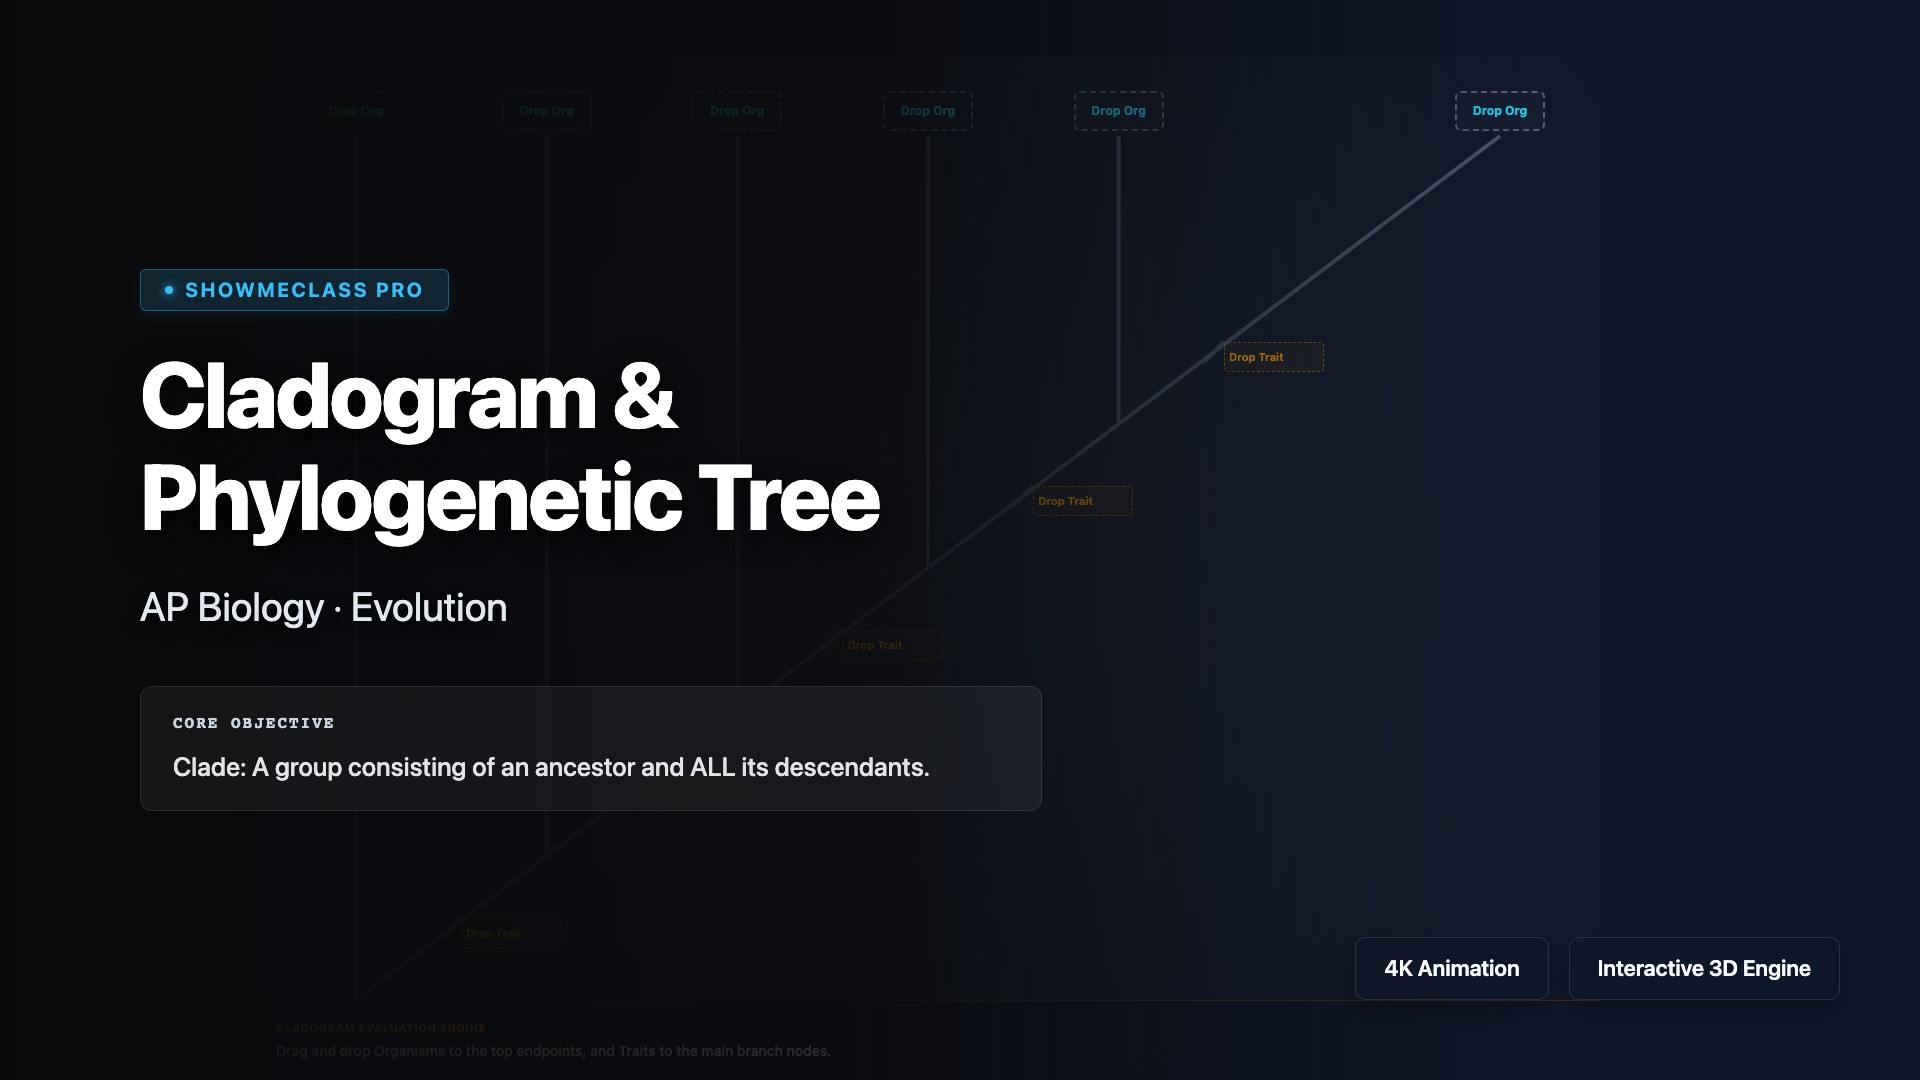
Cladogram & Phylogenetic Tree
Build cladograms and phylogenetic trees to visualize evolutionary relationships between organisms based on shared derived characteristics. Explore how cladistics uses synapomorphies to determine common ancestry, construct branching diagrams, and interpret evolutionary history through the principle of parsimony.
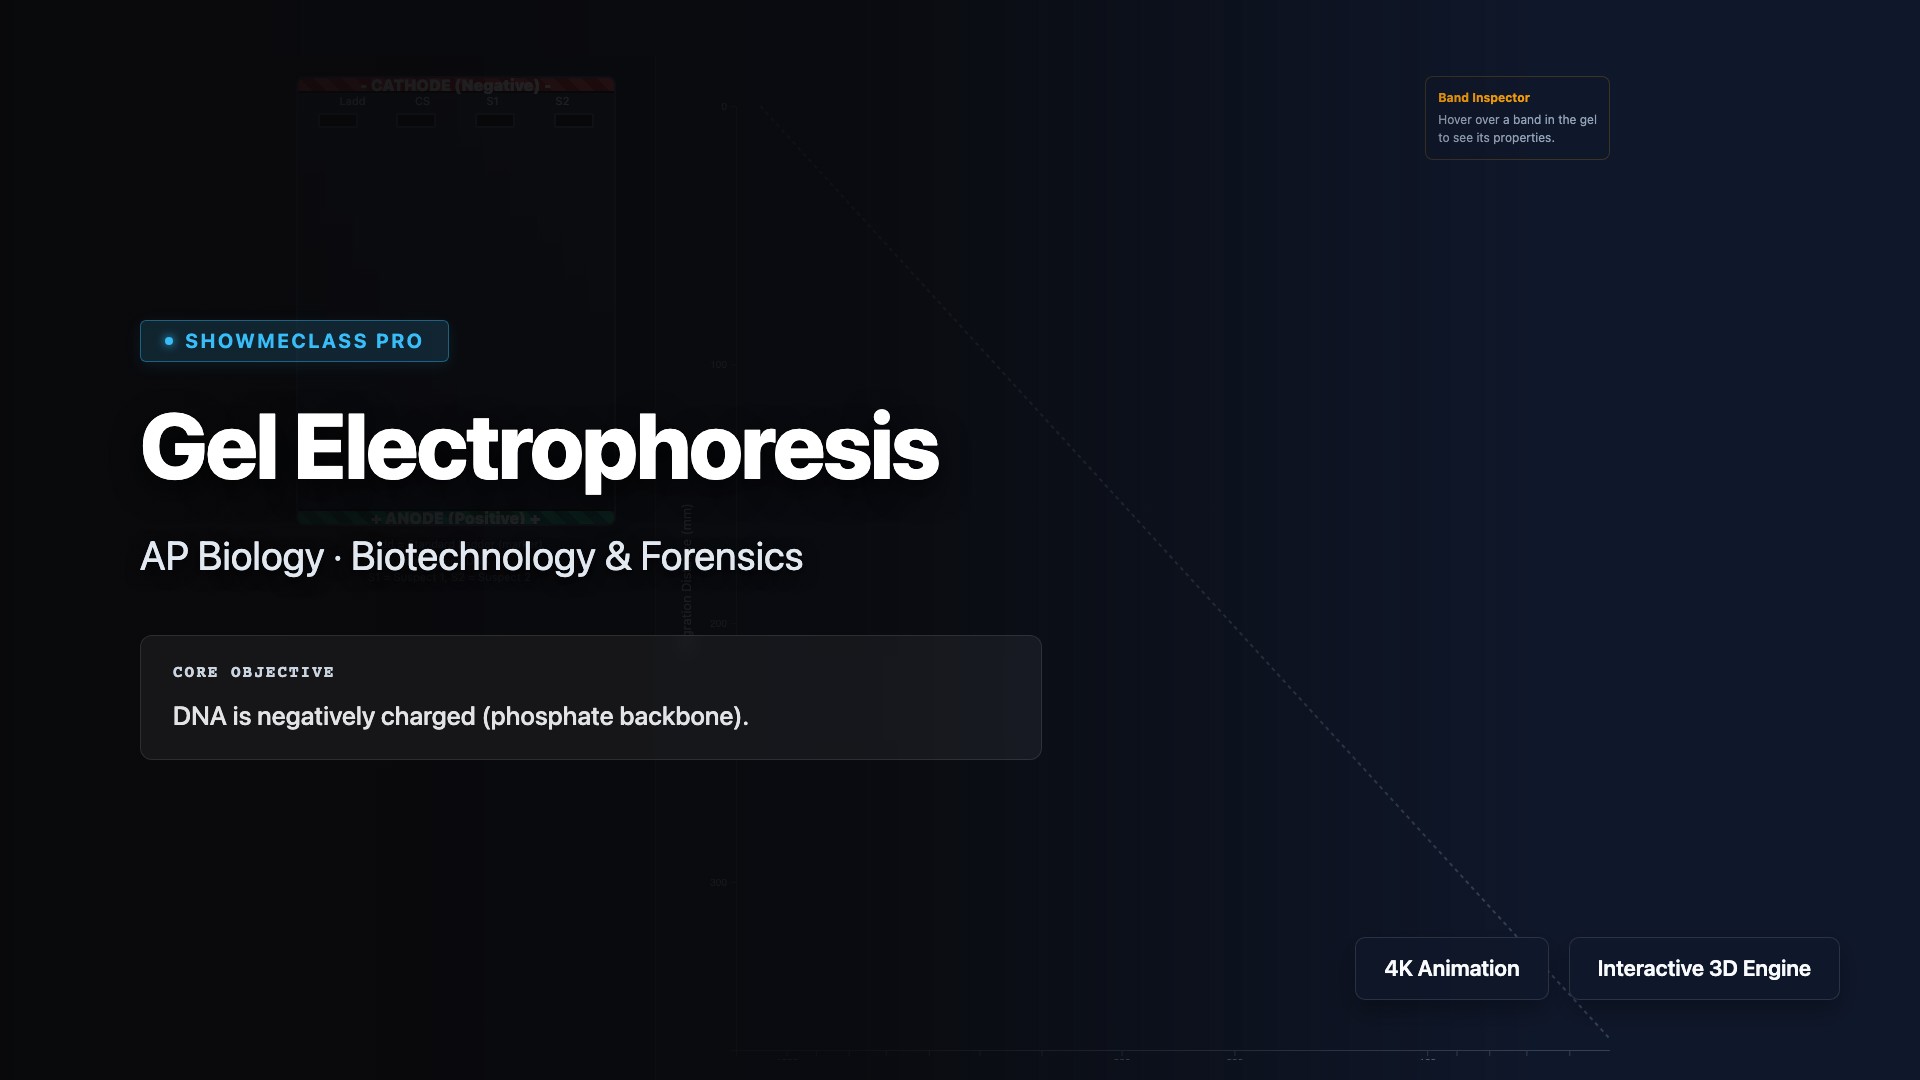
Gel Electrophoresis
Simulate gel electrophoresis to separate DNA fragments by size using an electric field through an agarose gel matrix. Visualize how negatively charged DNA molecules migrate toward the positive electrode, with smaller fragments traveling faster and farther than larger ones. Learn applications in DNA fingerprinting, RFLP analysis, and forensic identification.
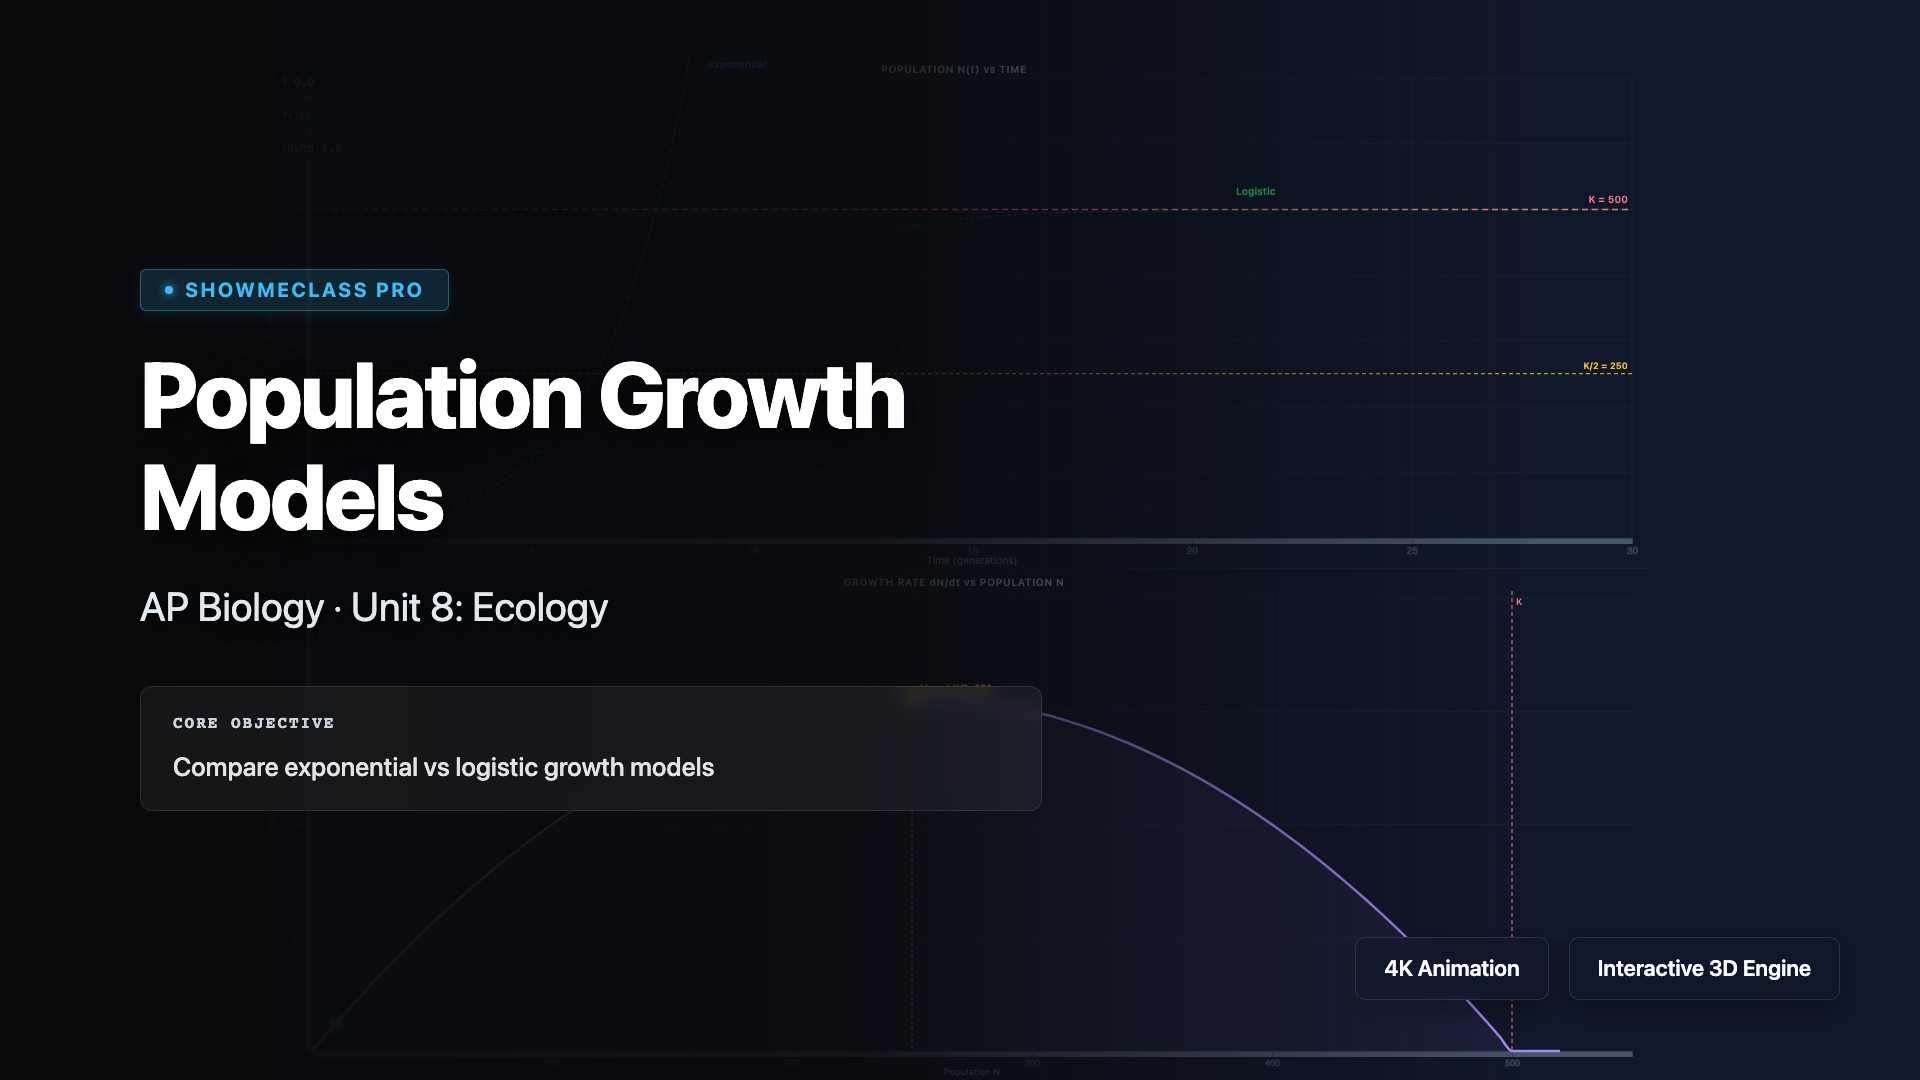
Population Growth Models
Compare exponential and logistic population growth models to understand how populations change over time. Visualize the J-shaped curve of exponential growth (unlimited resources) versus the S-shaped curve of logistic growth (limited by carrying capacity). Explore how density-dependent and density-independent factors regulate population size, and calculate growth rates using the equations dN/dt = rN and dN/dt = rN(K-N)/K.
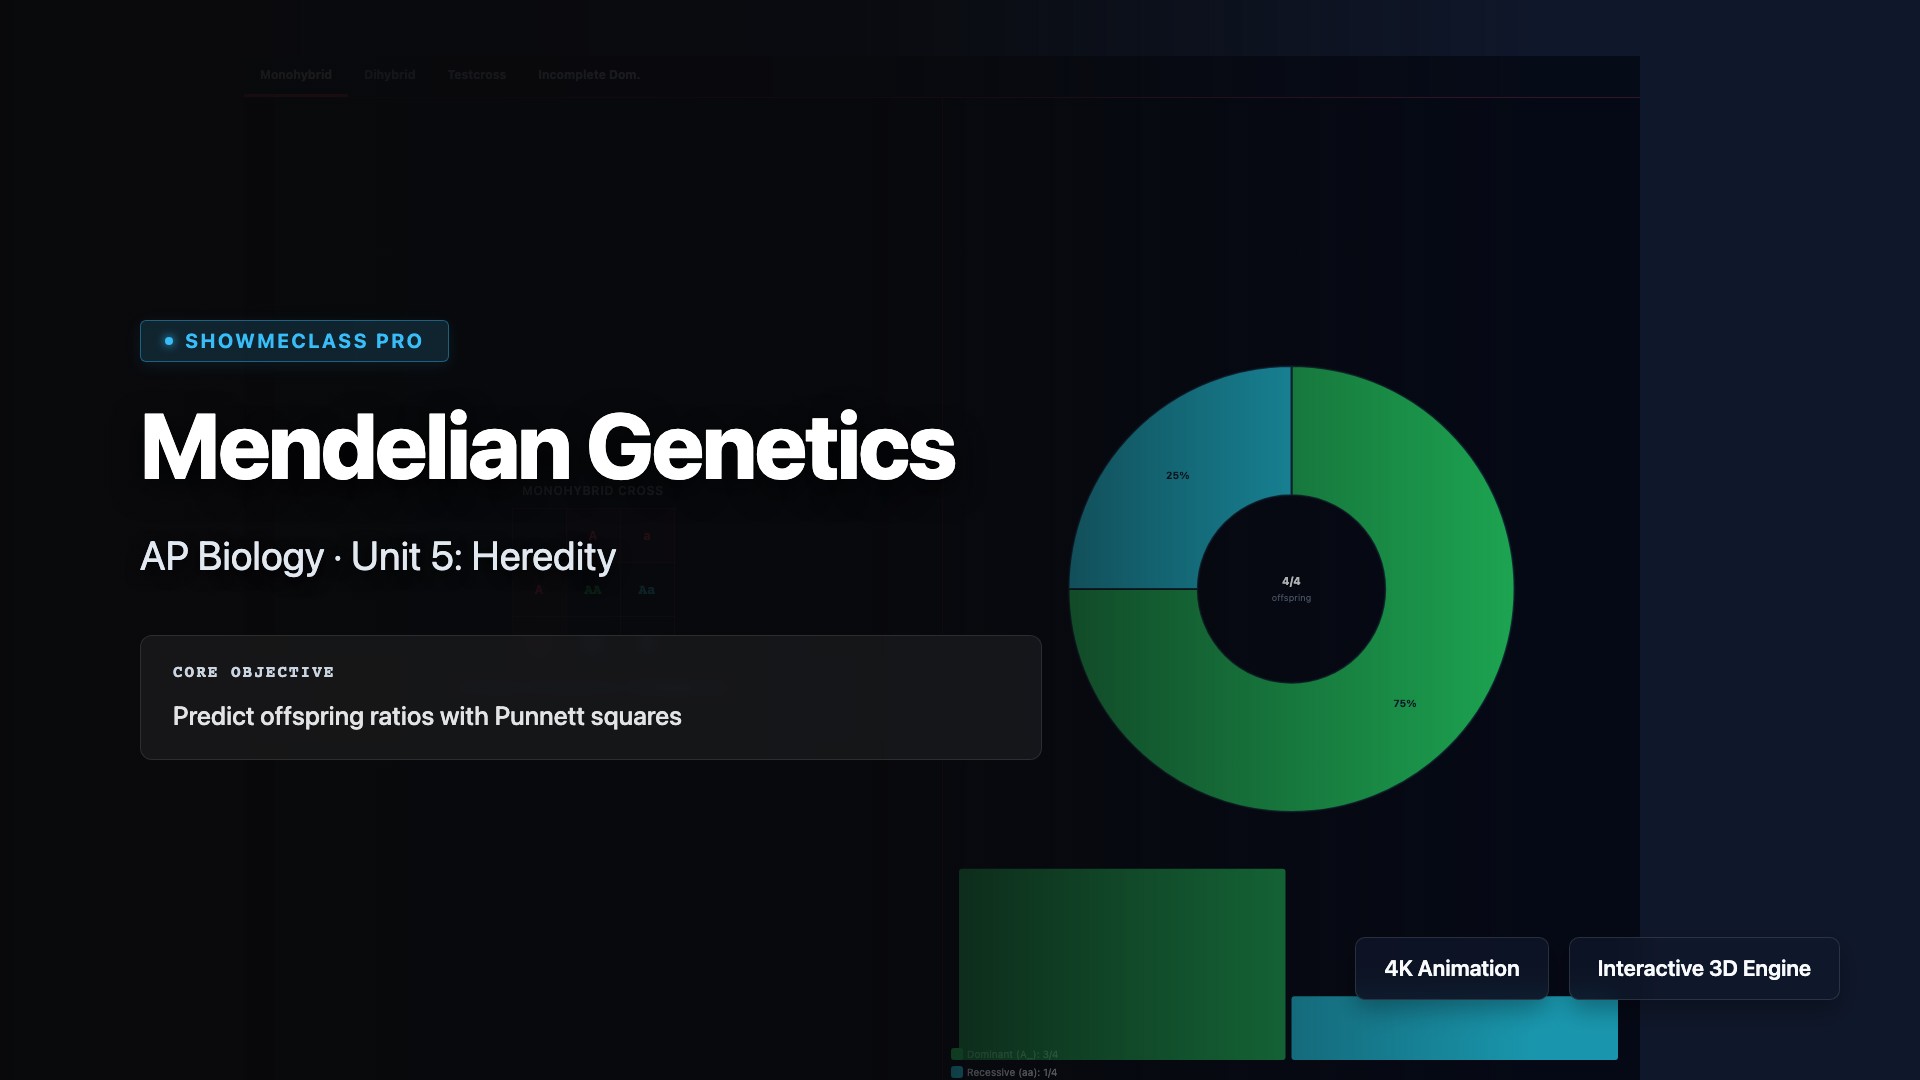
Mendelian Genetics
Explore Gregor Mendel's fundamental laws of inheritance through interactive Punnett squares and genetic crosses. Visualize the law of segregation (alleles separate during gamete formation) and the law of independent assortment (genes for different traits segregate independently). Practice predicting offspring genotypes and phenotypes for monohybrid and dihybrid crosses, and understand dominant, recessive, and codominant inheritance patterns.
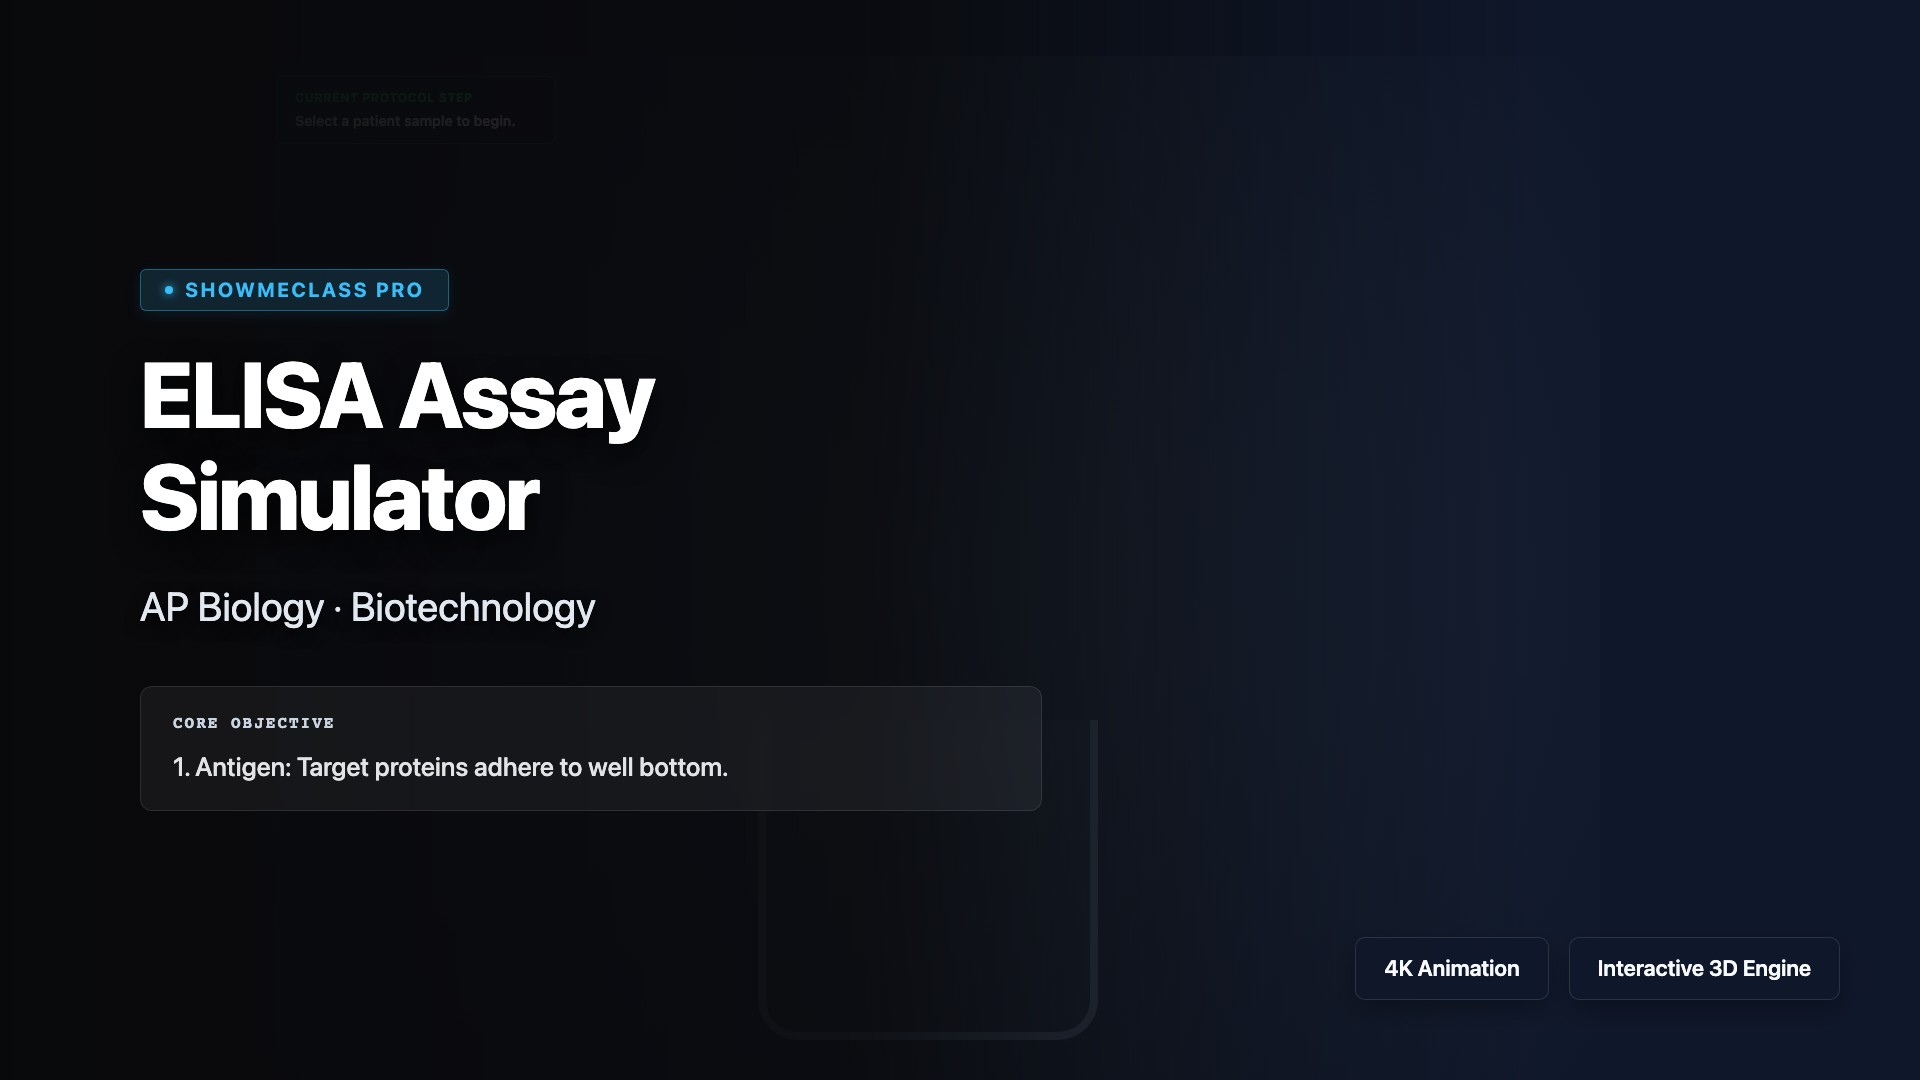
ELISA Assay Simulator
Simulate the enzyme-linked immunosorbent assay (ELISA) technique used to detect and quantify specific antigens or antibodies in biological samples. Explore the sandwich ELISA method, understand antibody-antigen binding specificity, and learn how colorimetric detection enables diagnostic applications in medicine, research, and disease screening.
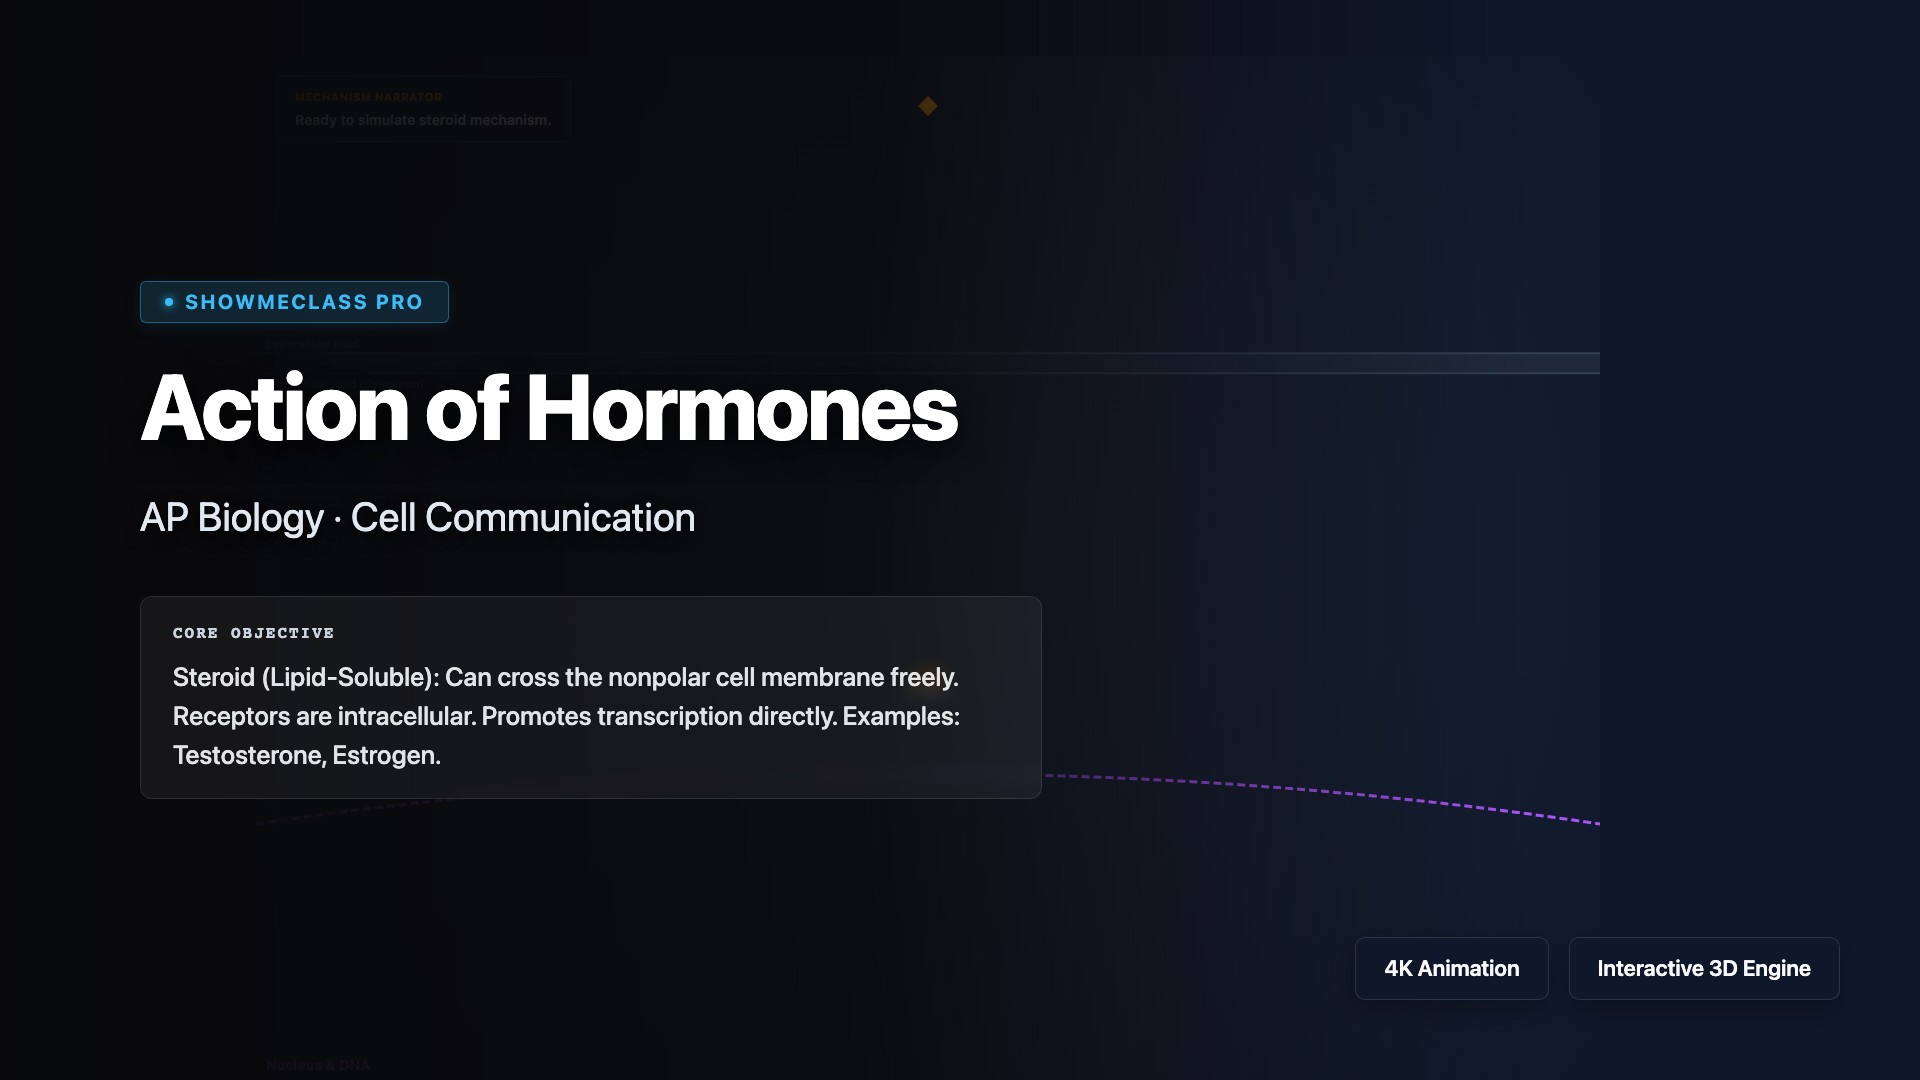
Action of Hormones
Visualize how hormones trigger cellular responses through signal transduction pathways. Explore the differences between lipid-soluble hormones (steroids) that pass through membranes to bind intracellular receptors and water-soluble hormones (peptides) that bind surface receptors, activating second messenger systems like cAMP and initiating phosphorylation cascades via G-protein coupled receptors (GPCRs).
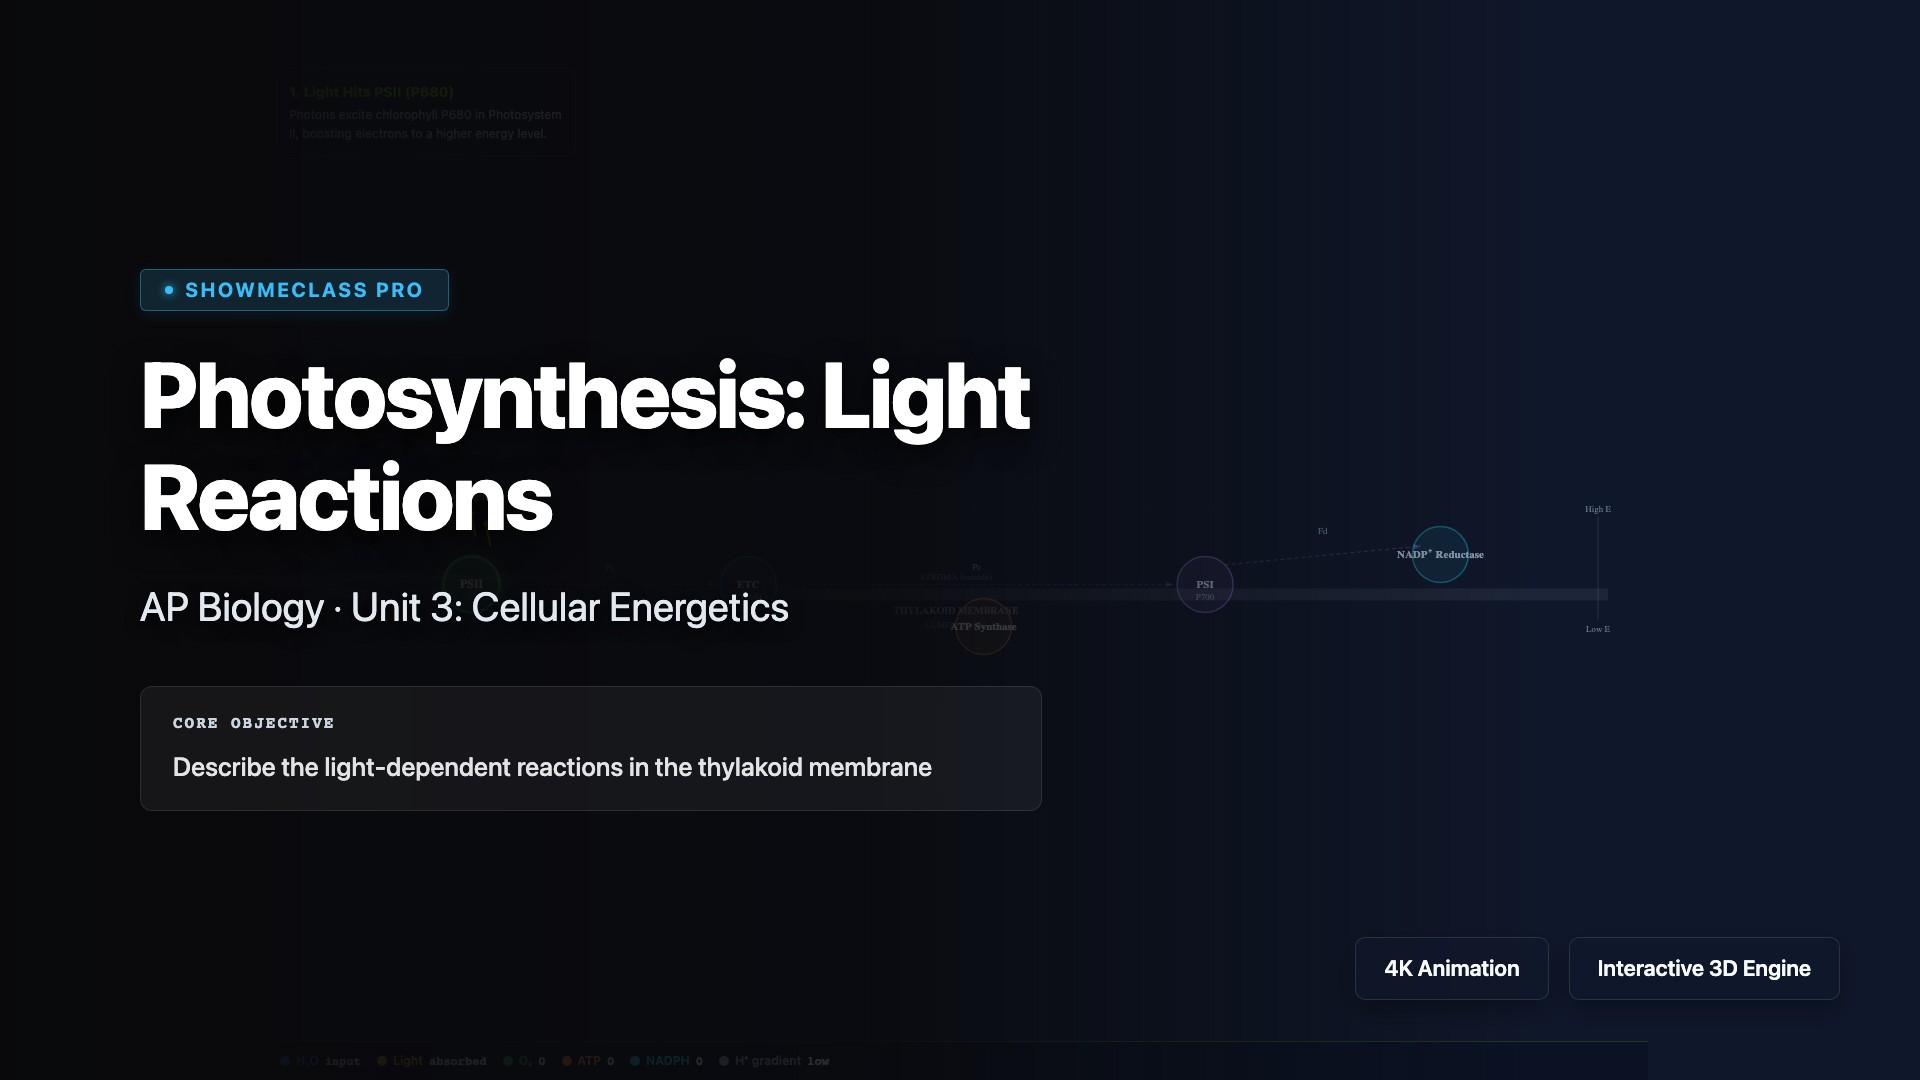
Photosynthesis: Light Reactions
Explore the light-dependent reactions of photosynthesis occurring in the thylakoid membranes of chloroplasts. Visualize how photosystems II and I capture light energy to drive electron transport, generate ATP via chemiosmosis, and produce NADPH. Understand photolysis of water, the Z-scheme electron flow, and how these products power the Calvin cycle to fix carbon dioxide into glucose.
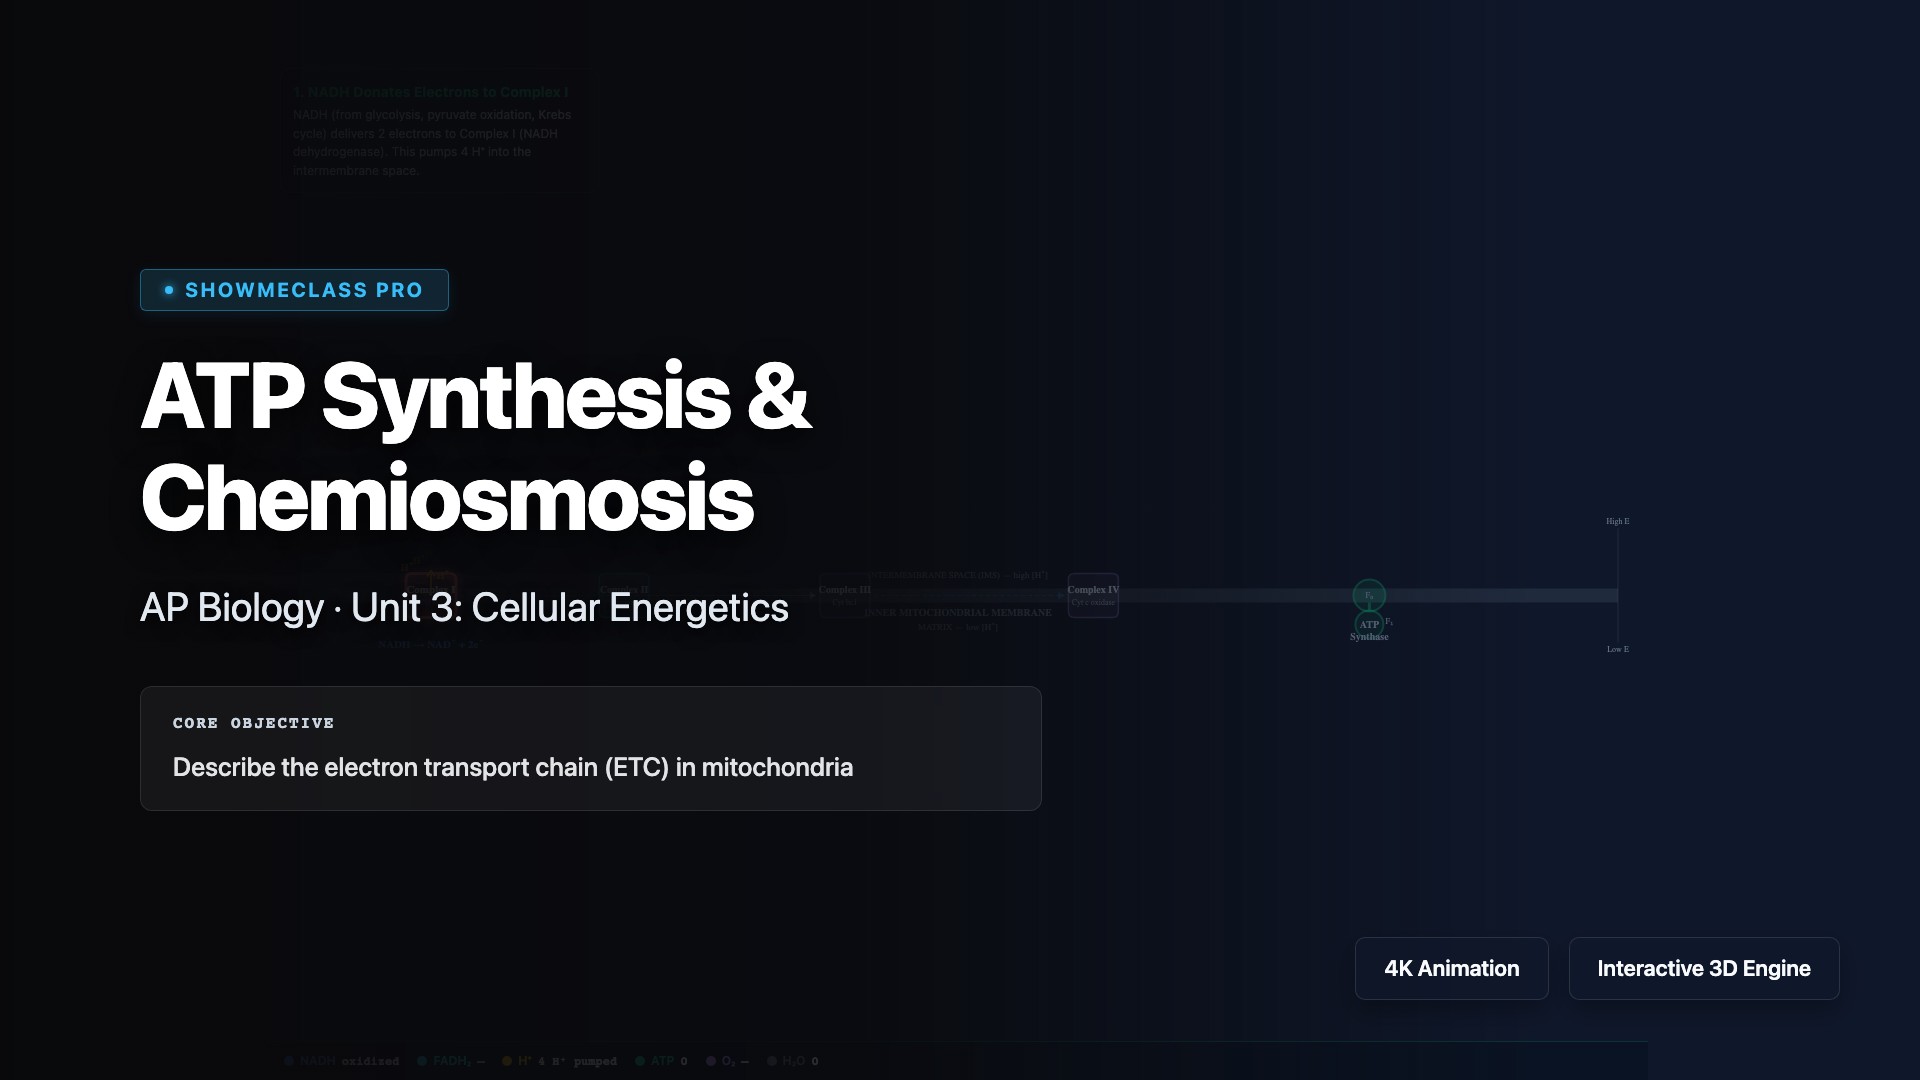
ATP Synthesis & Chemiosmosis
Explore how ATP synthase harnesses the proton gradient across the inner mitochondrial membrane to produce ATP through chemiosmosis. Visualize the electron transport chain, proton pumping, and the rotation of ATP synthase as it catalyzes the phosphorylation of ADP to ATP—the universal energy currency of cells.
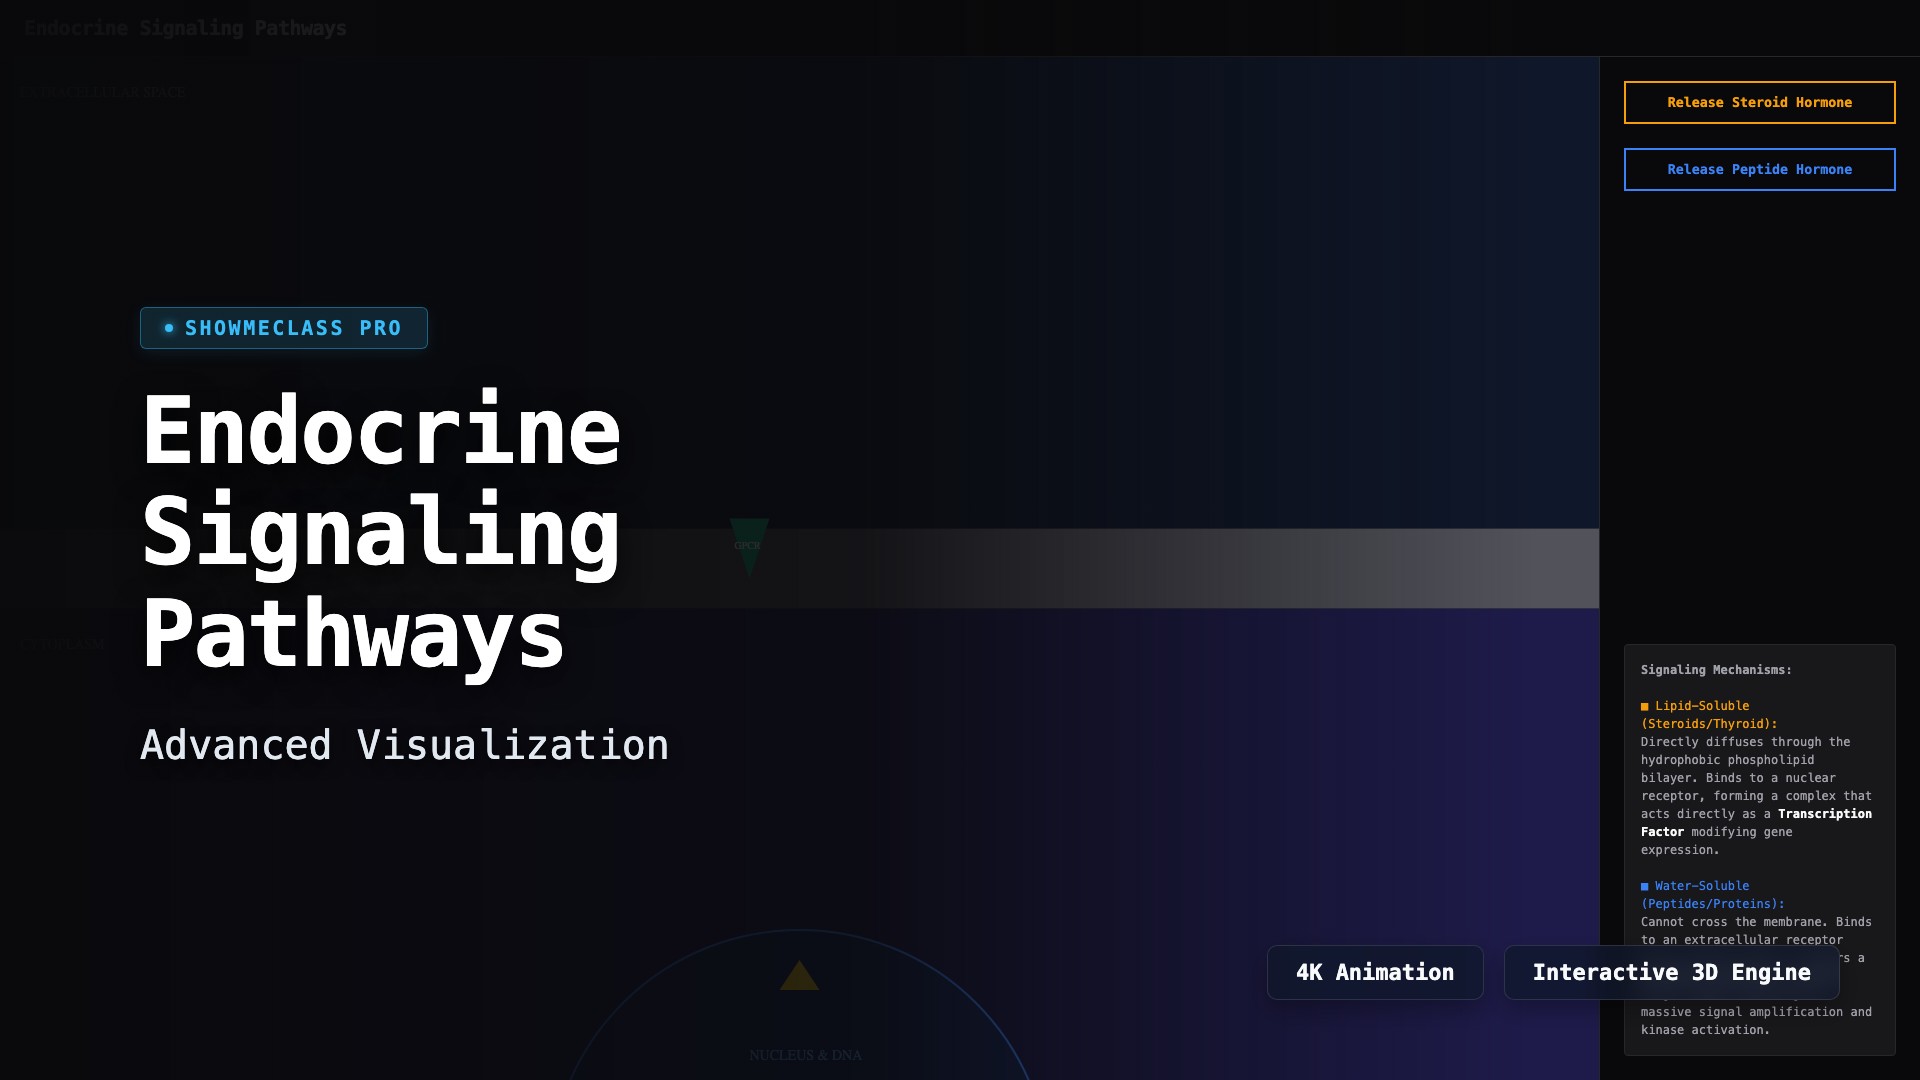
Endocrine System Signaling Pathways
Simulate hormone cell signaling. Compare lipid-soluble steroid diffusion acting as a nuclear transcription factor versus water-soluble peptide binding that triggers a massive cAMP secondary messenger cascade.
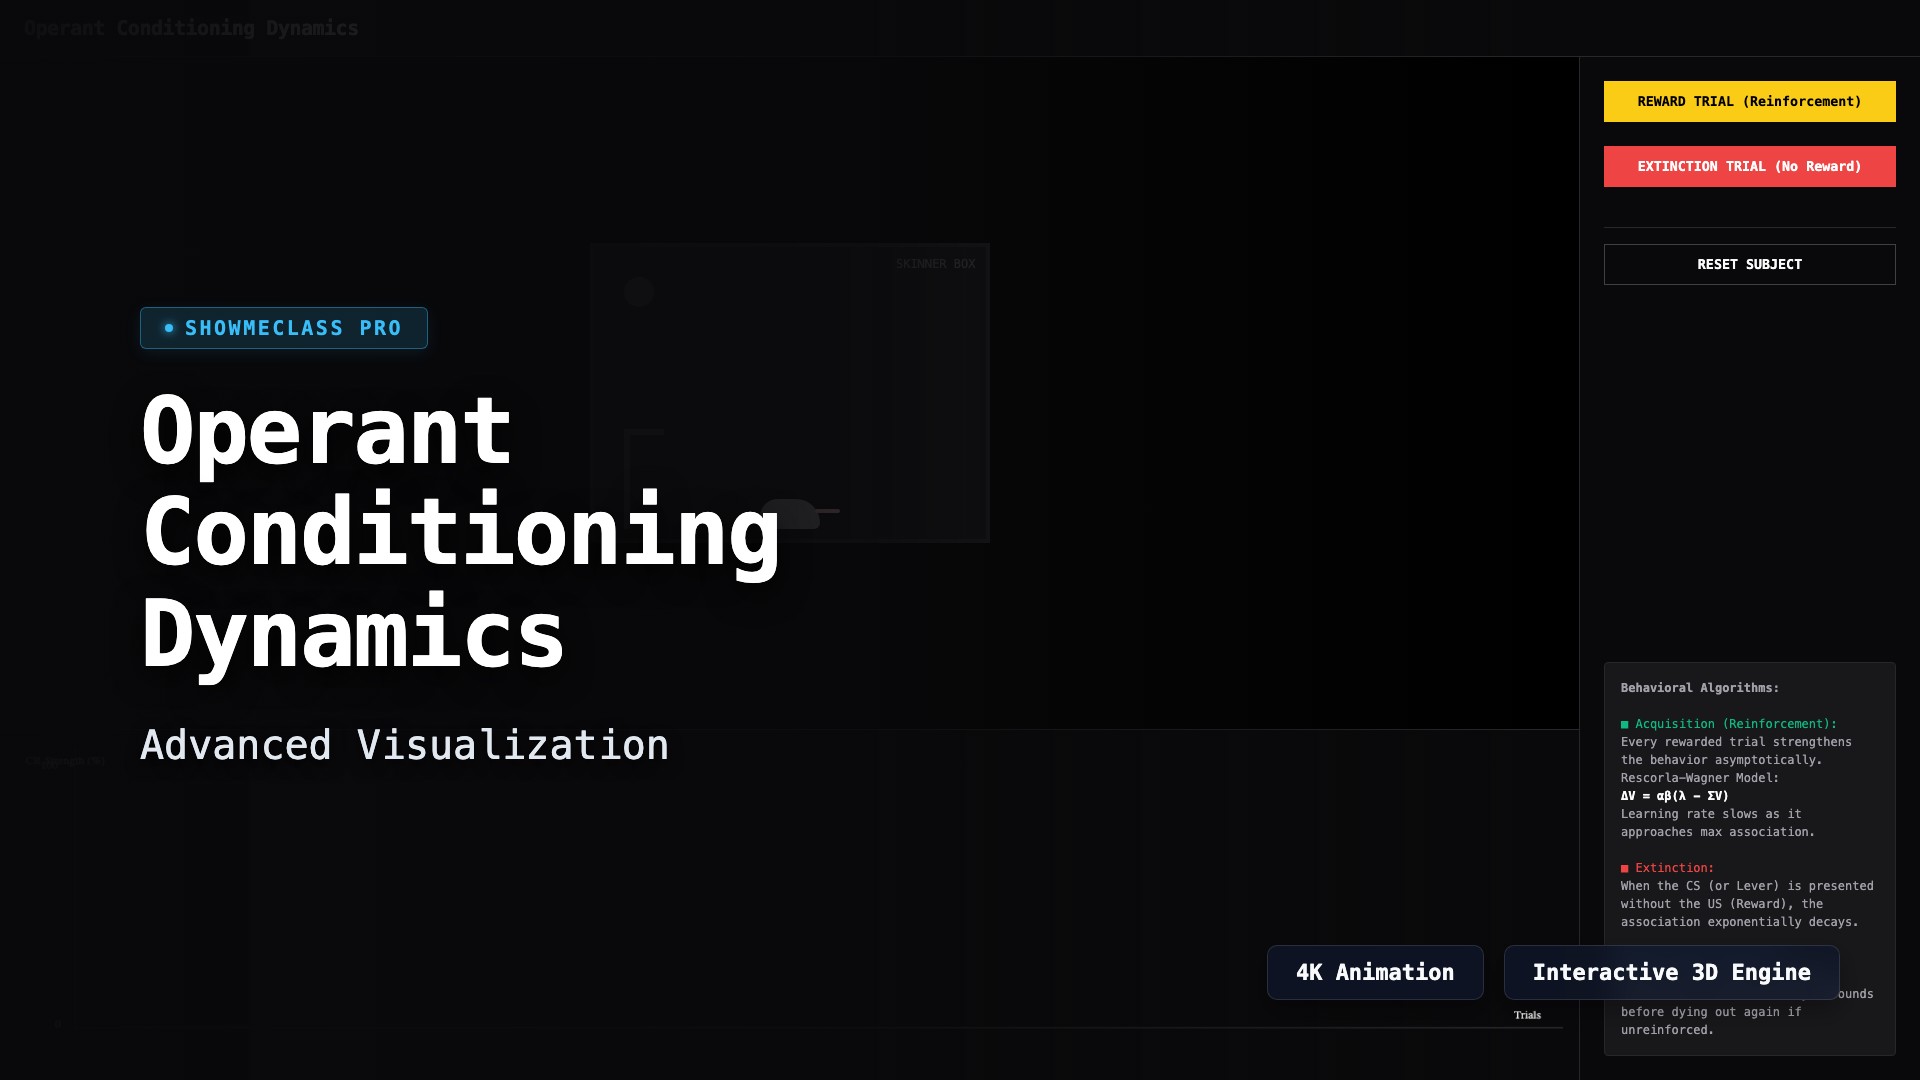
Operant vs Classical Conditioning
A cross-over behavioral simulation mapping the Rescorla-Wagner model. Execute reinforcement reward trials to plot the asymptotic acquisition curve, and trigger extinction trials to map the exponential decay in a virtual Skinner box.
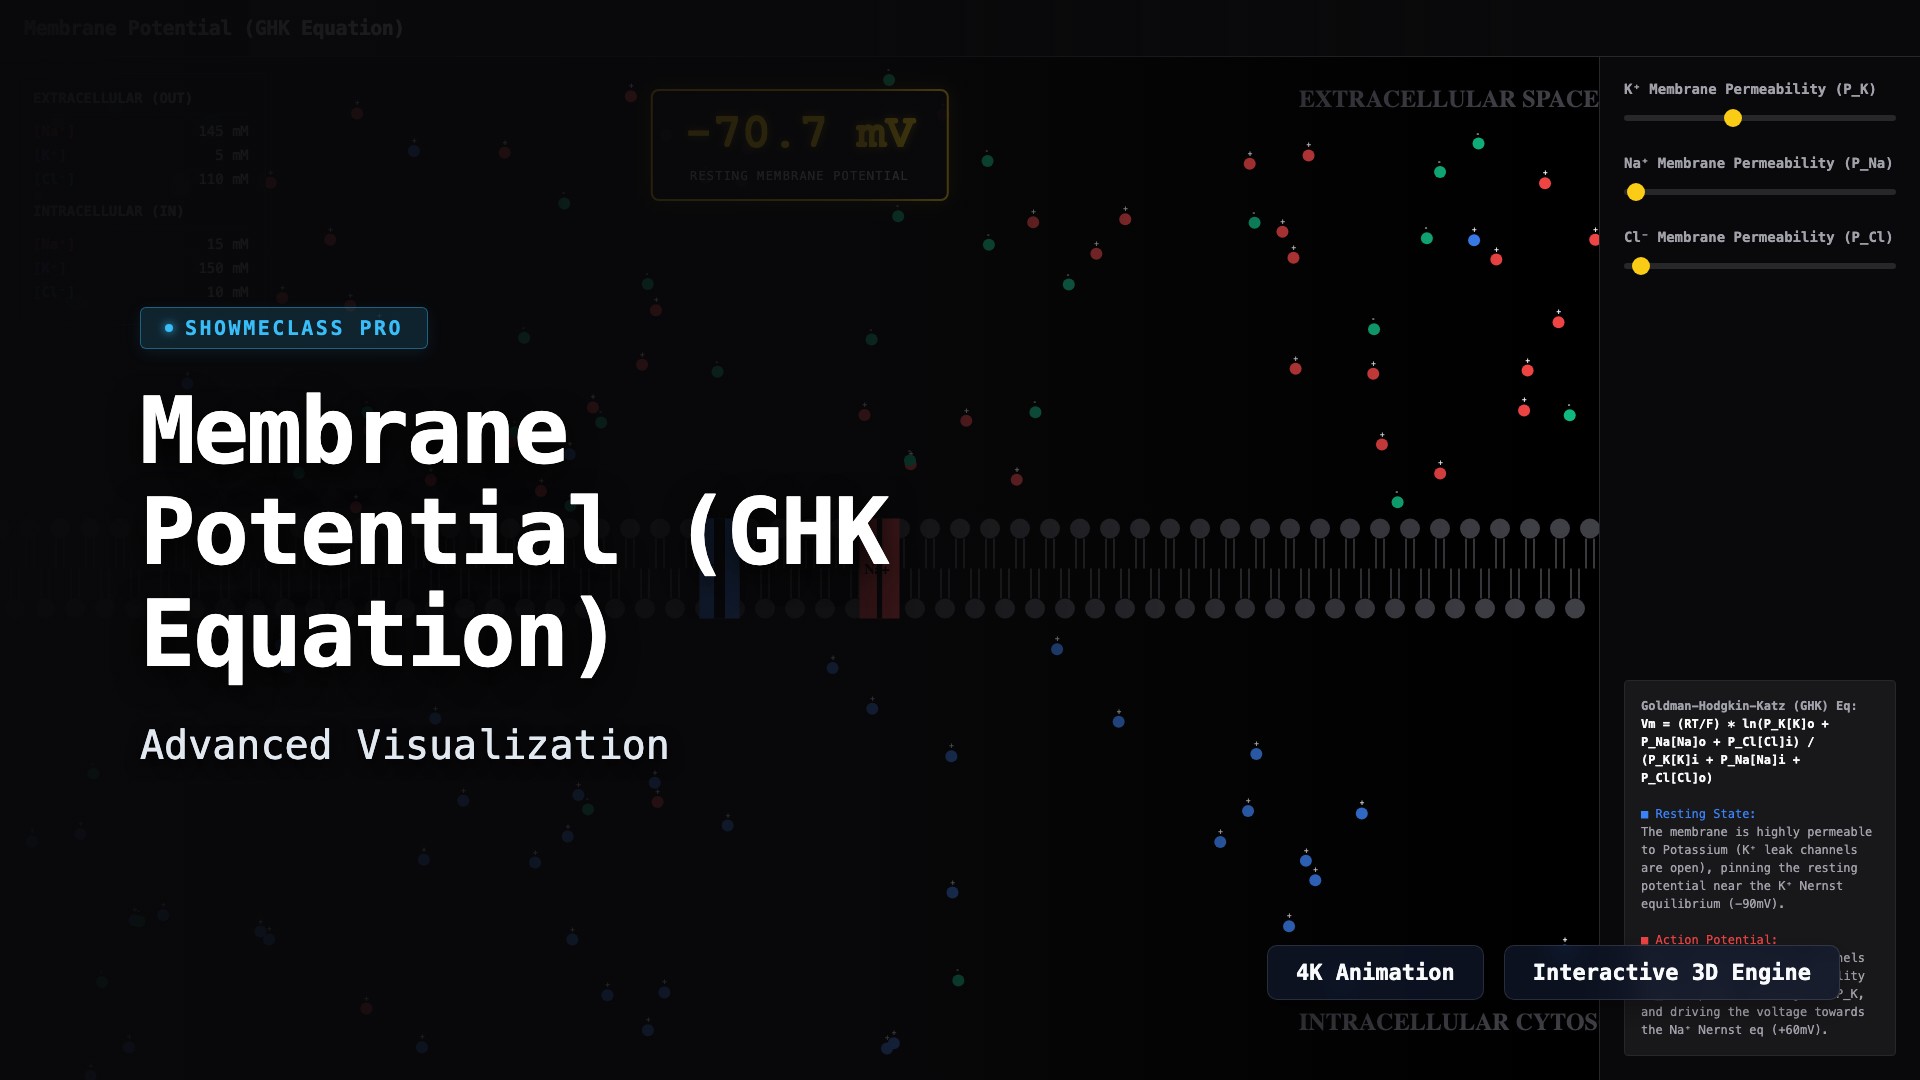
Membrane Potential & Nernst Equation
Calculate the resting membrane potential using the Goldman-Hodgkin-Katz equation. Visualize Na⁺ and K⁺ leak channels, actively tweak permeabilities, and trigger simulated action potentials.
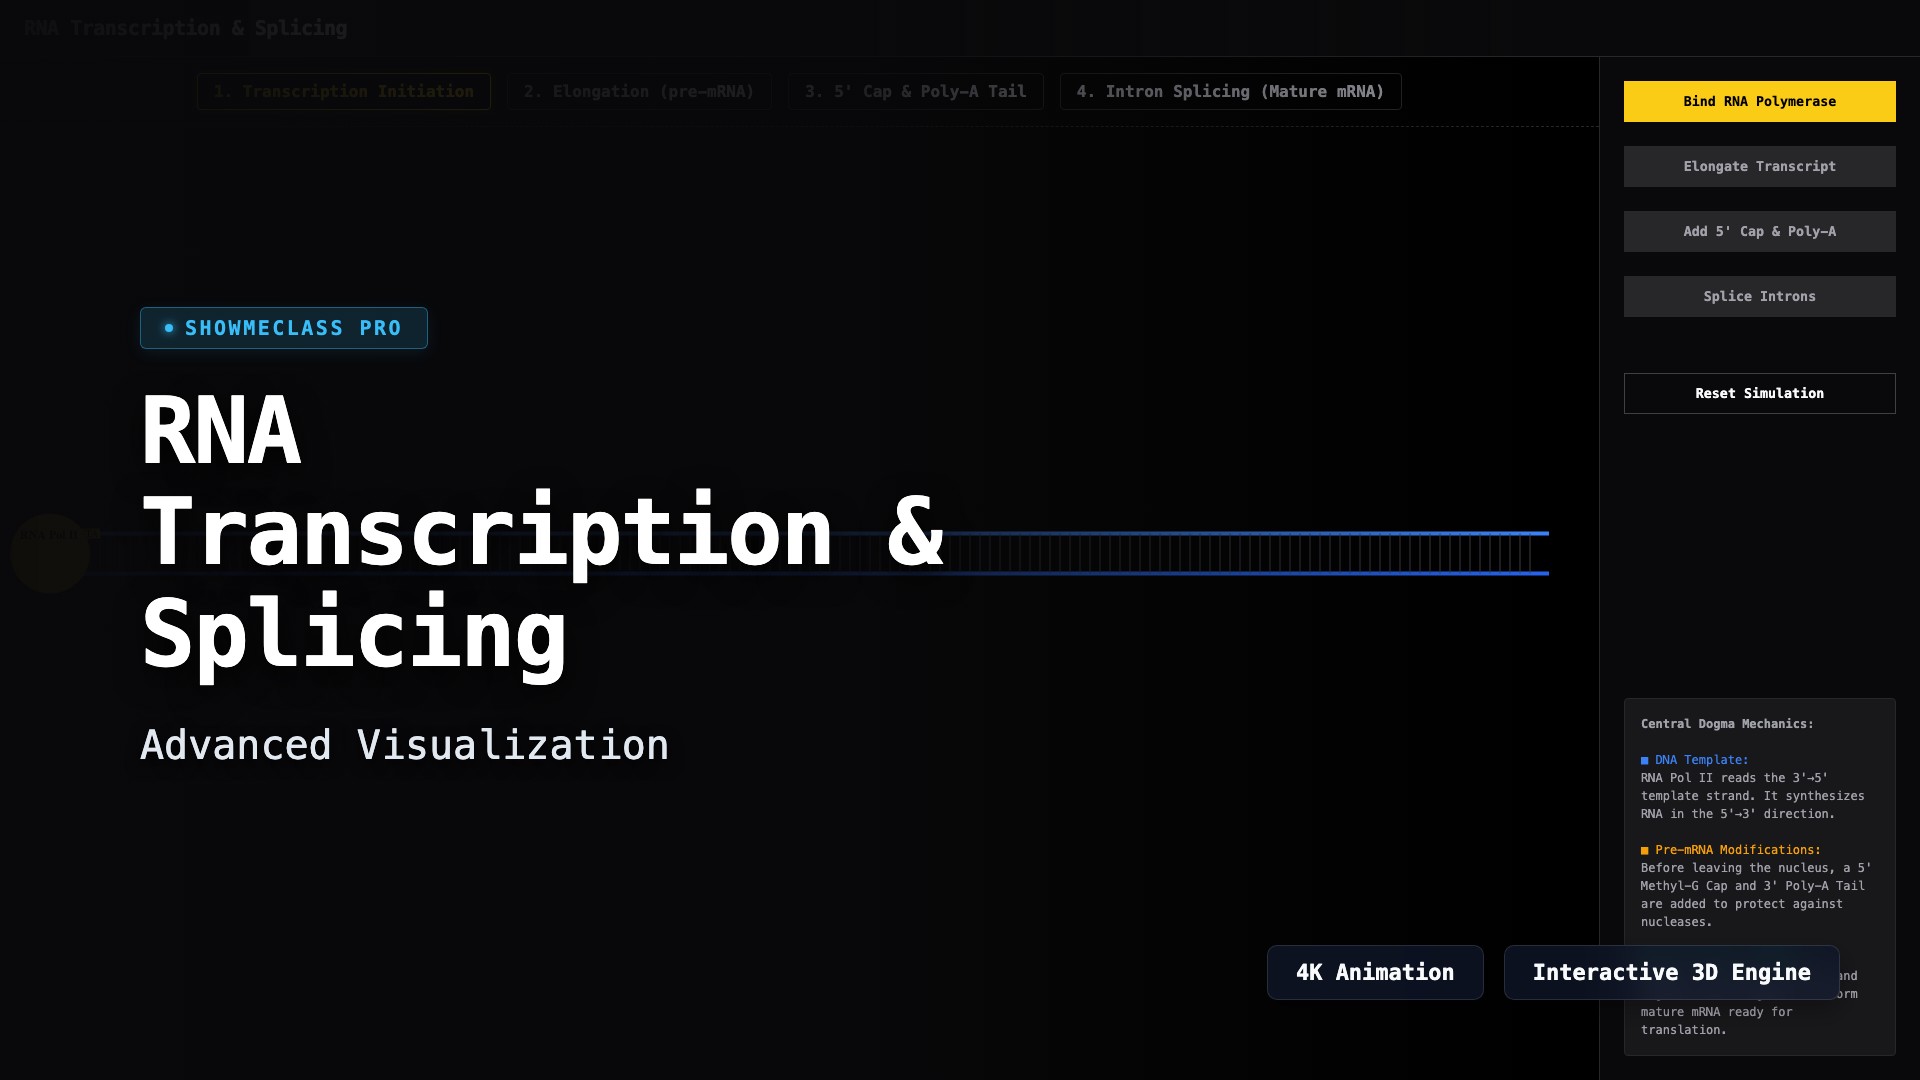
RNA Transcription & Splicing Processing
Walk through the Central Dogma. Bind RNA Polymerase II to the promoter, elongate the pre-mRNA transcript, and execute post-transcriptional modifications including 5' Capping, Poly-A tailing, and spliceosome intron cleavage.
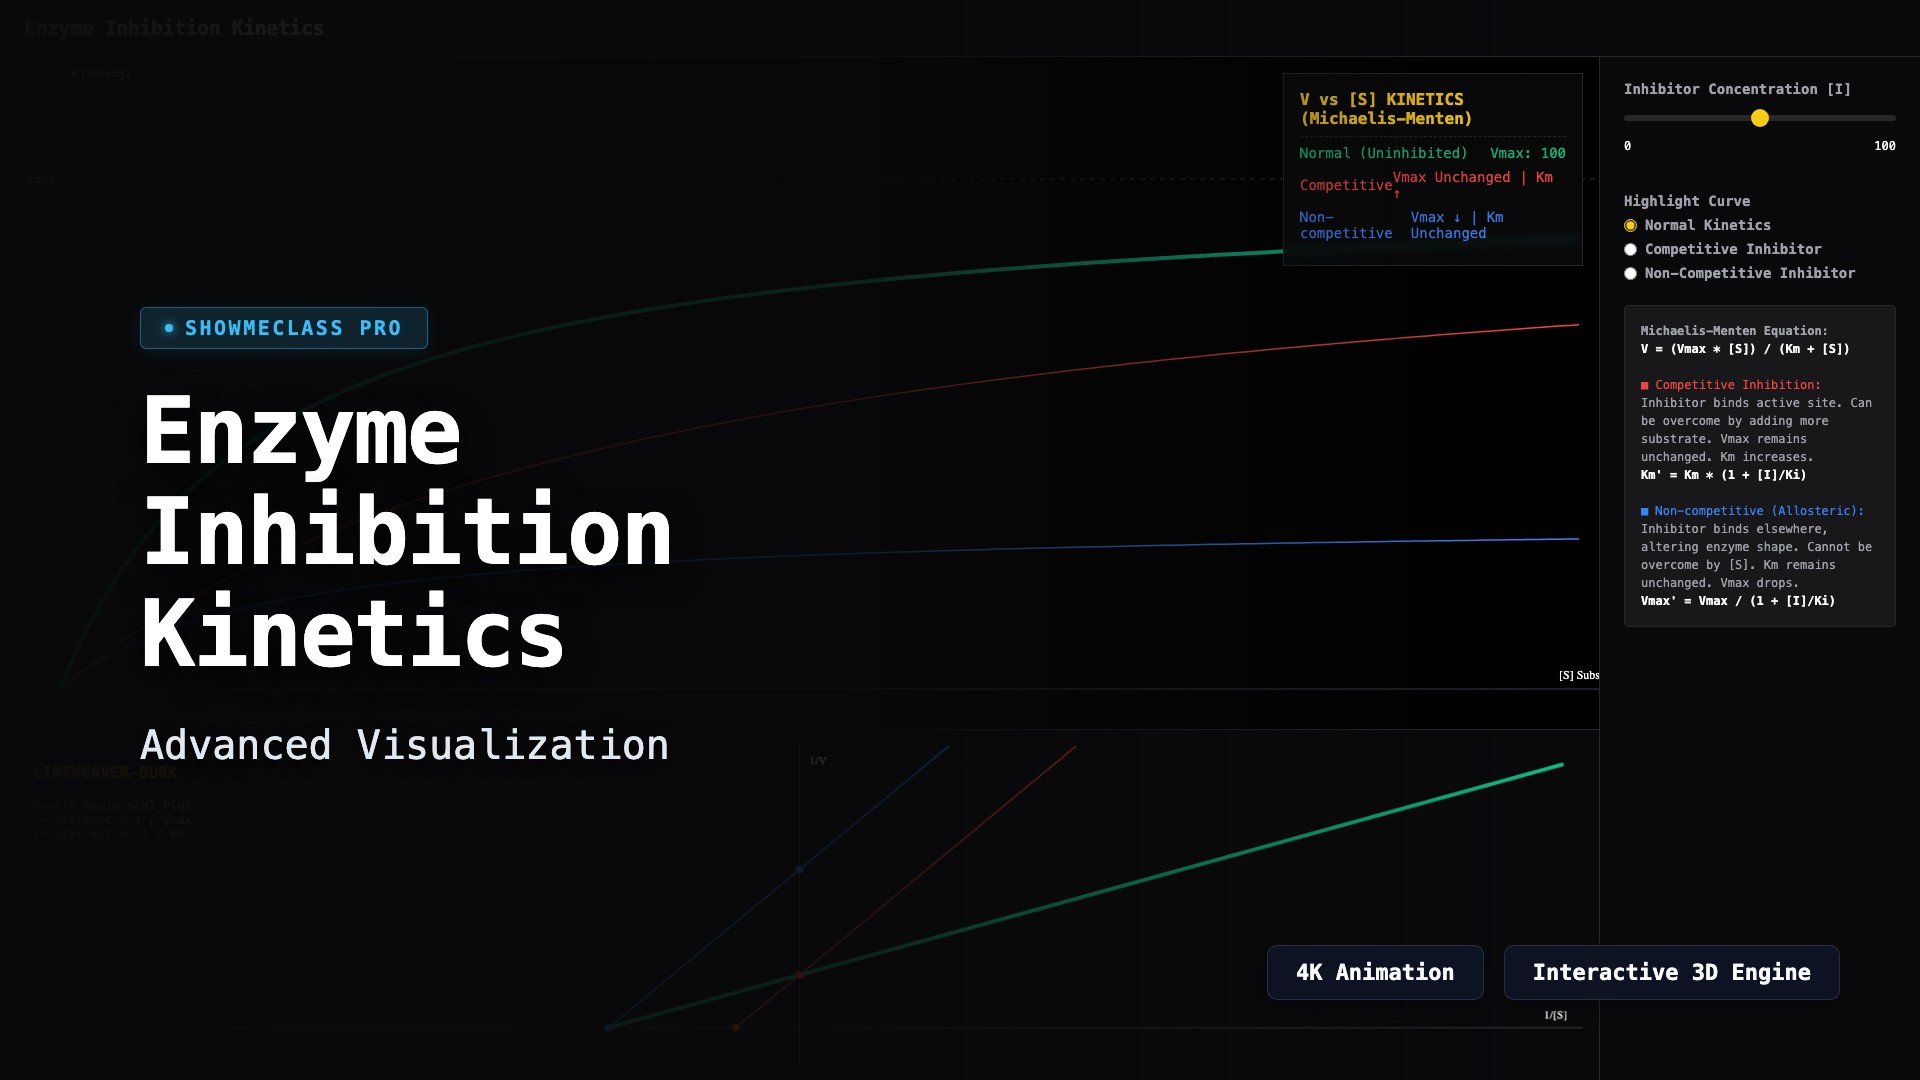
Enzyme Inhibition Kinetics
Analyze Michaelis-Menten kinetics and Lineweaver-Burk double reciprocal plots. Dynamically compare Normal, Competitive, and Non-competitive (Allosteric) inhibition by altering substrate and inhibitor concentrations.
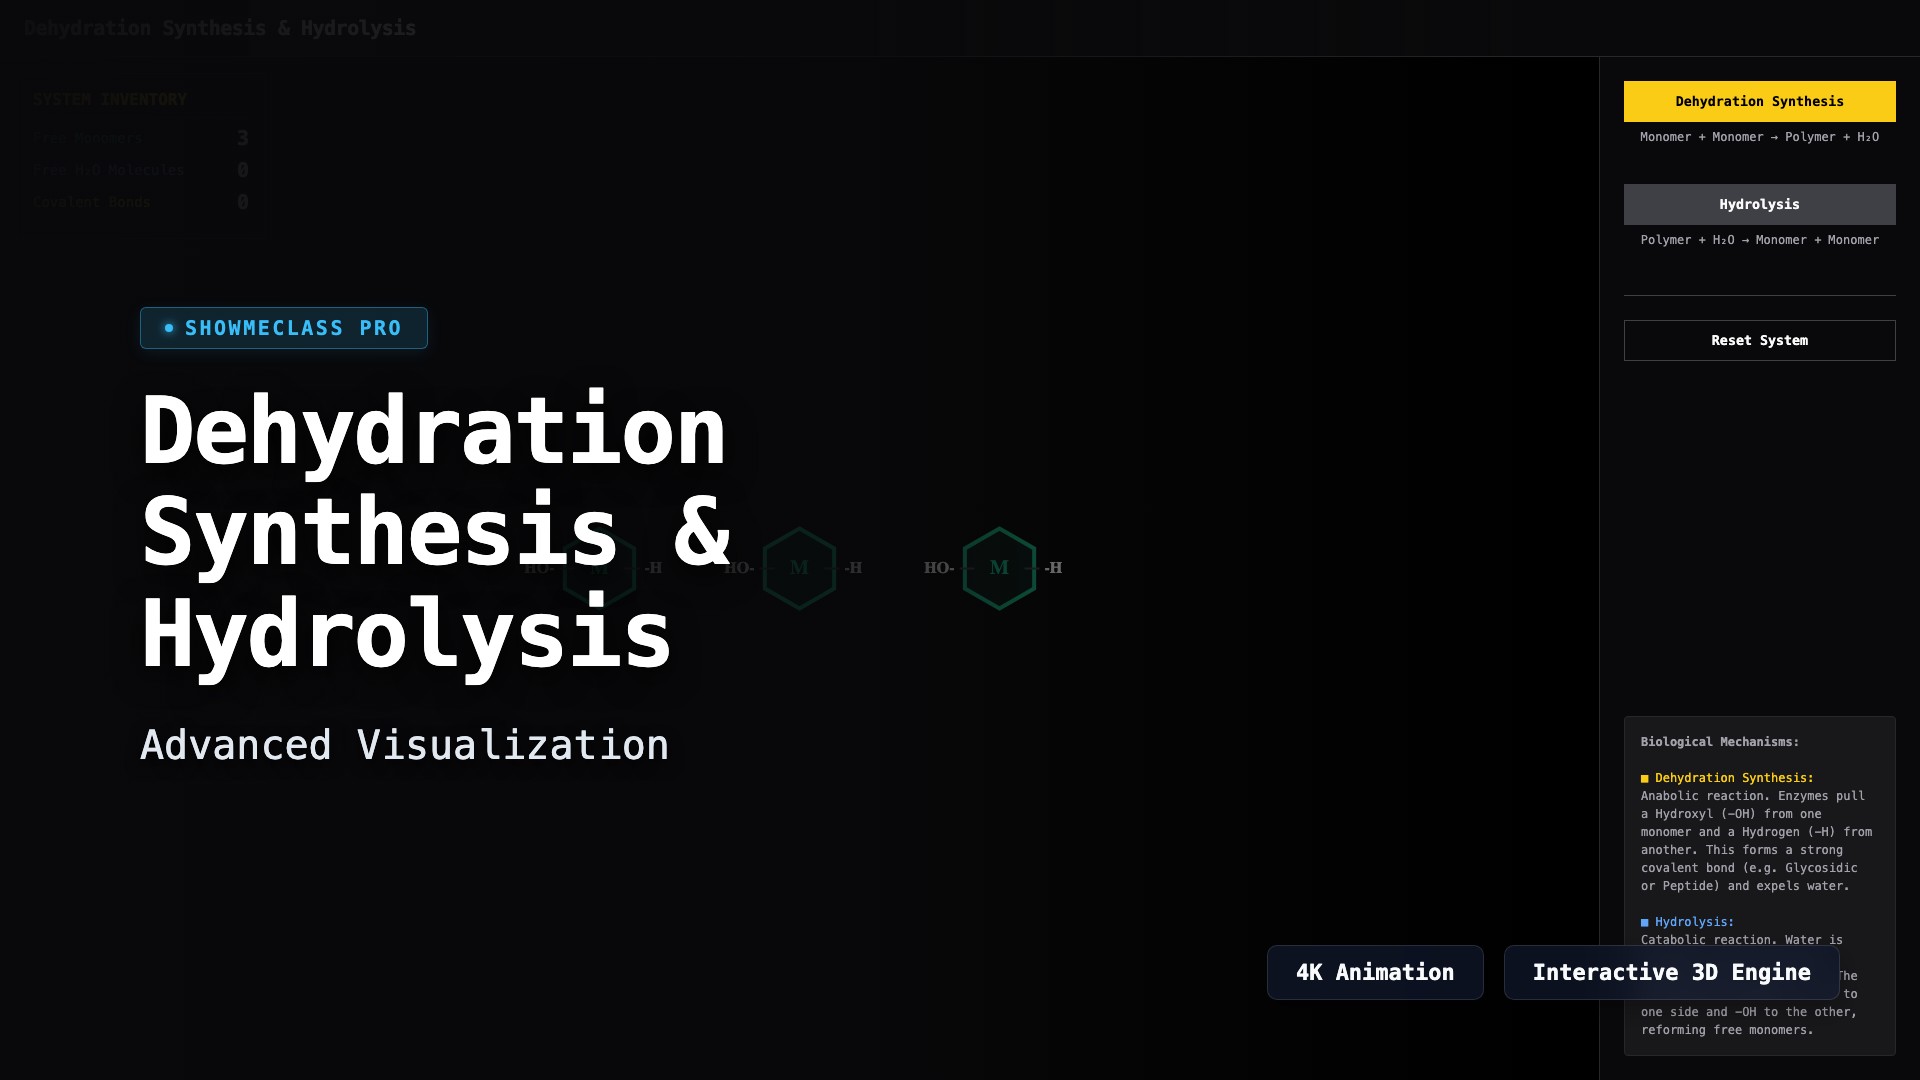
Biomolecule Dehydration Synthesis & Hydrolysis
Visualize the anabolic and catabolic mechanisms of macromolecules. Trigger Dehydration Synthesis to form covalent bonds and expel water, or inject H2O via Hydrolysis to cleave polymers back into monomers.
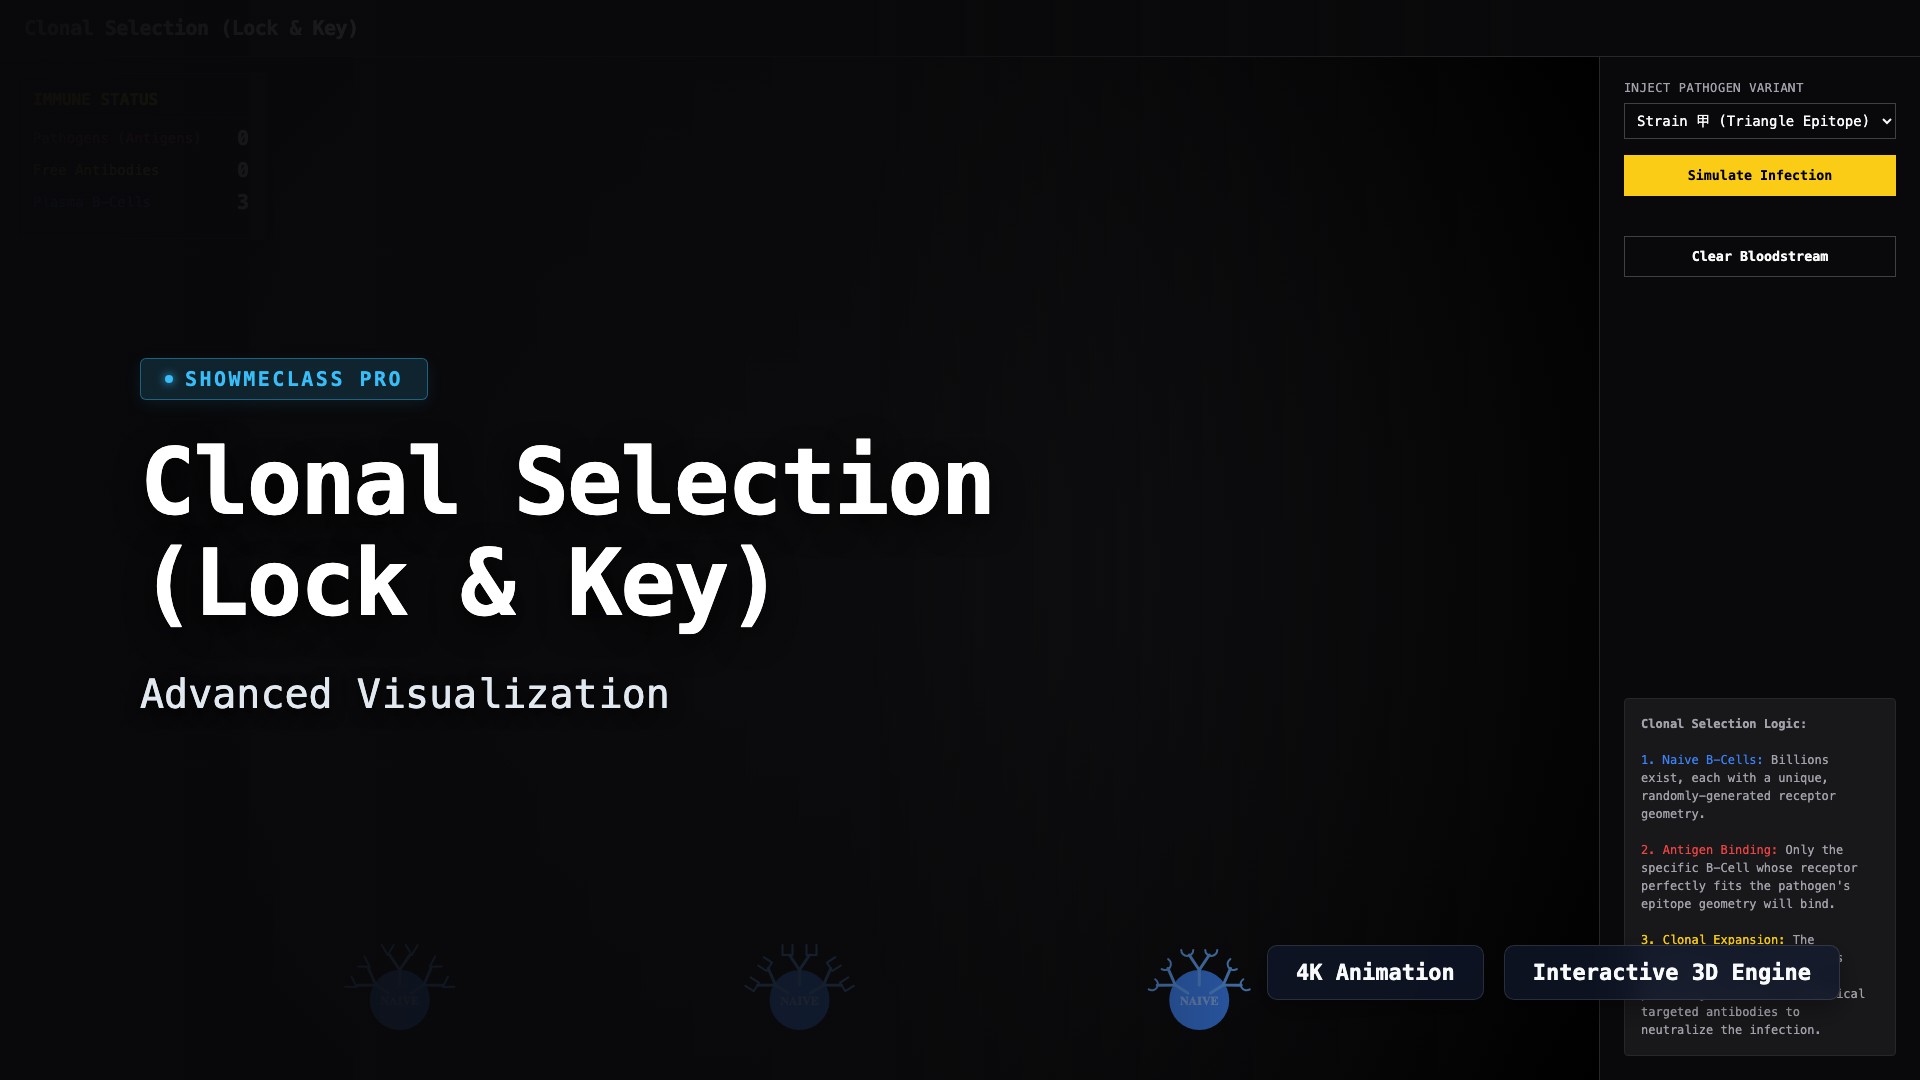
Immune System Clonal Selection
Simulate the Lock-and-Key mechanism of the immune system. Inject various pathogen epitopes and observe how massive clonal expansion and antibody production is triggered only when a naive B-Cell matches the exact molecular geometry.
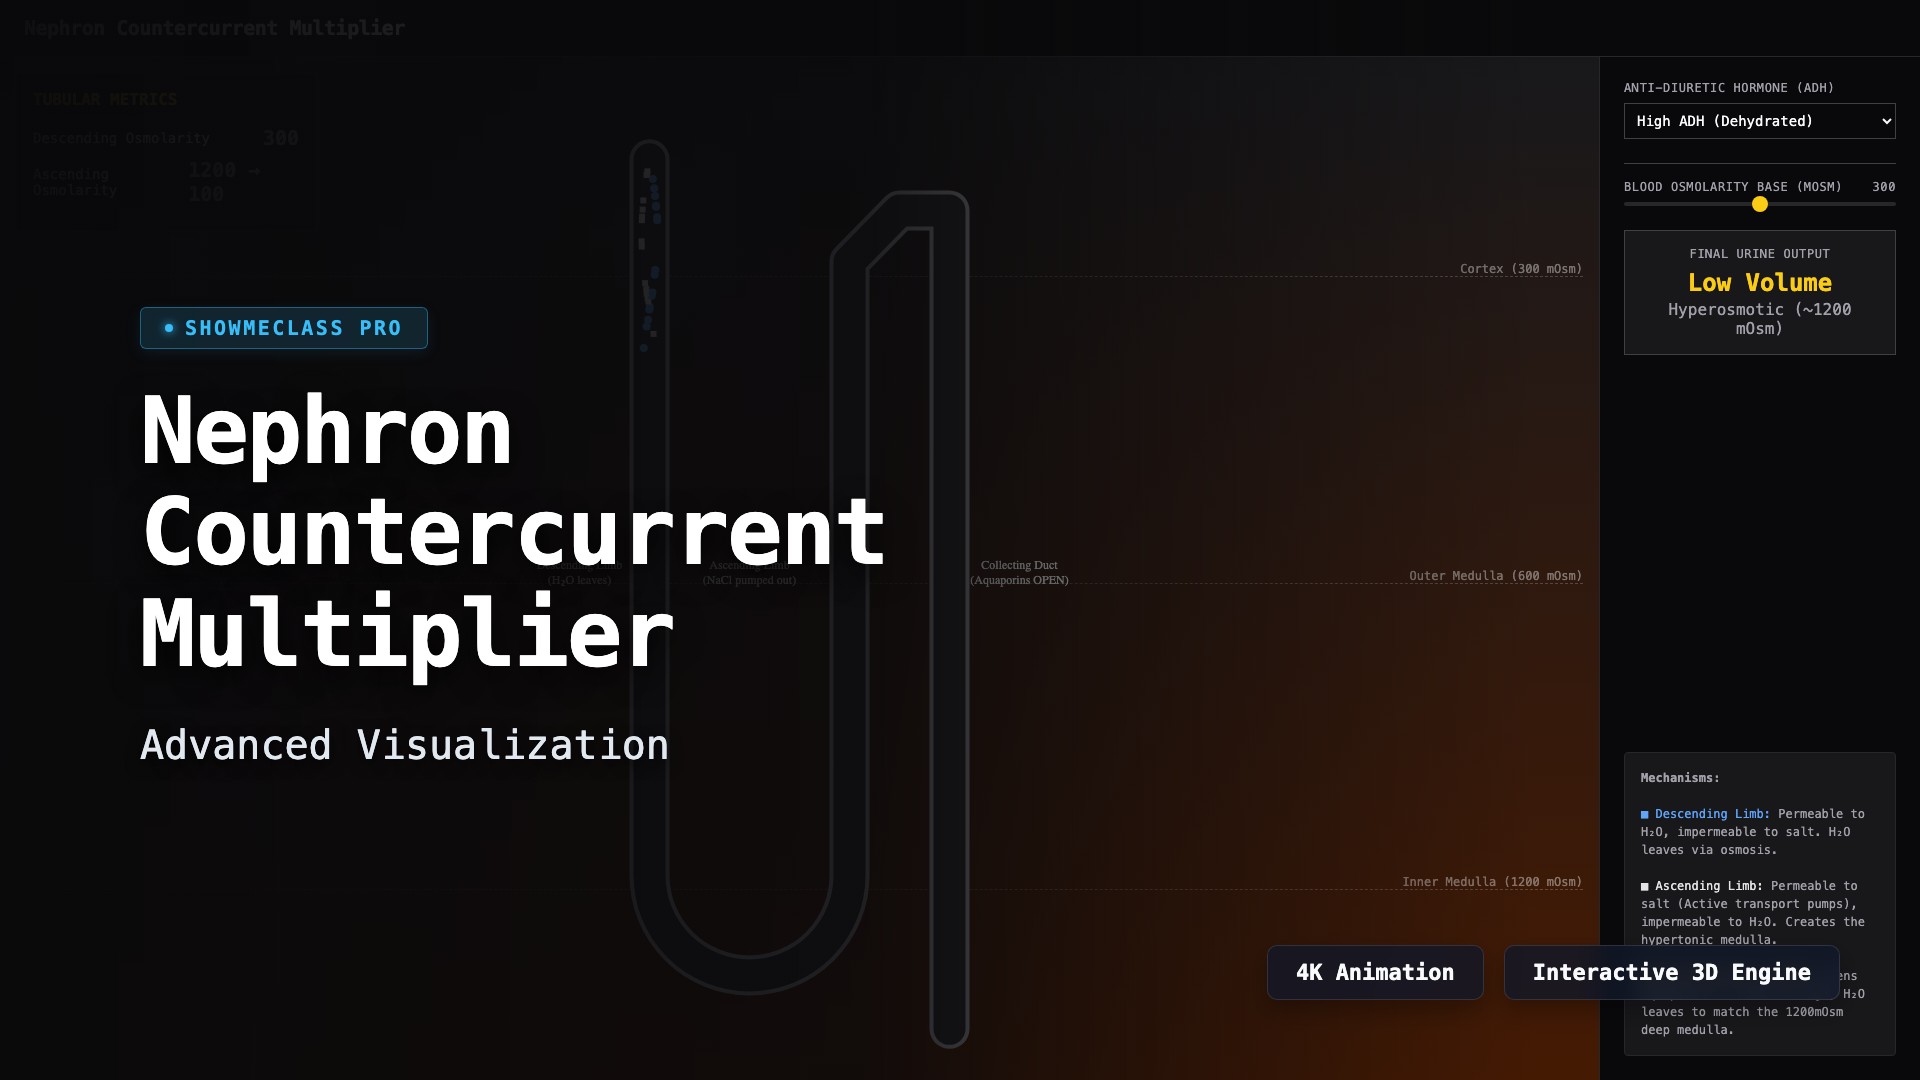
Kidney Nephron Countercurrent Multiplier
Visualize the complex osmotic gradients of the Loop of Henle. Observe how the active transport of NaCl in the ascending limb drives the passive reabsorption of H2O in the descending limb and collecting duct via ADH regulation.
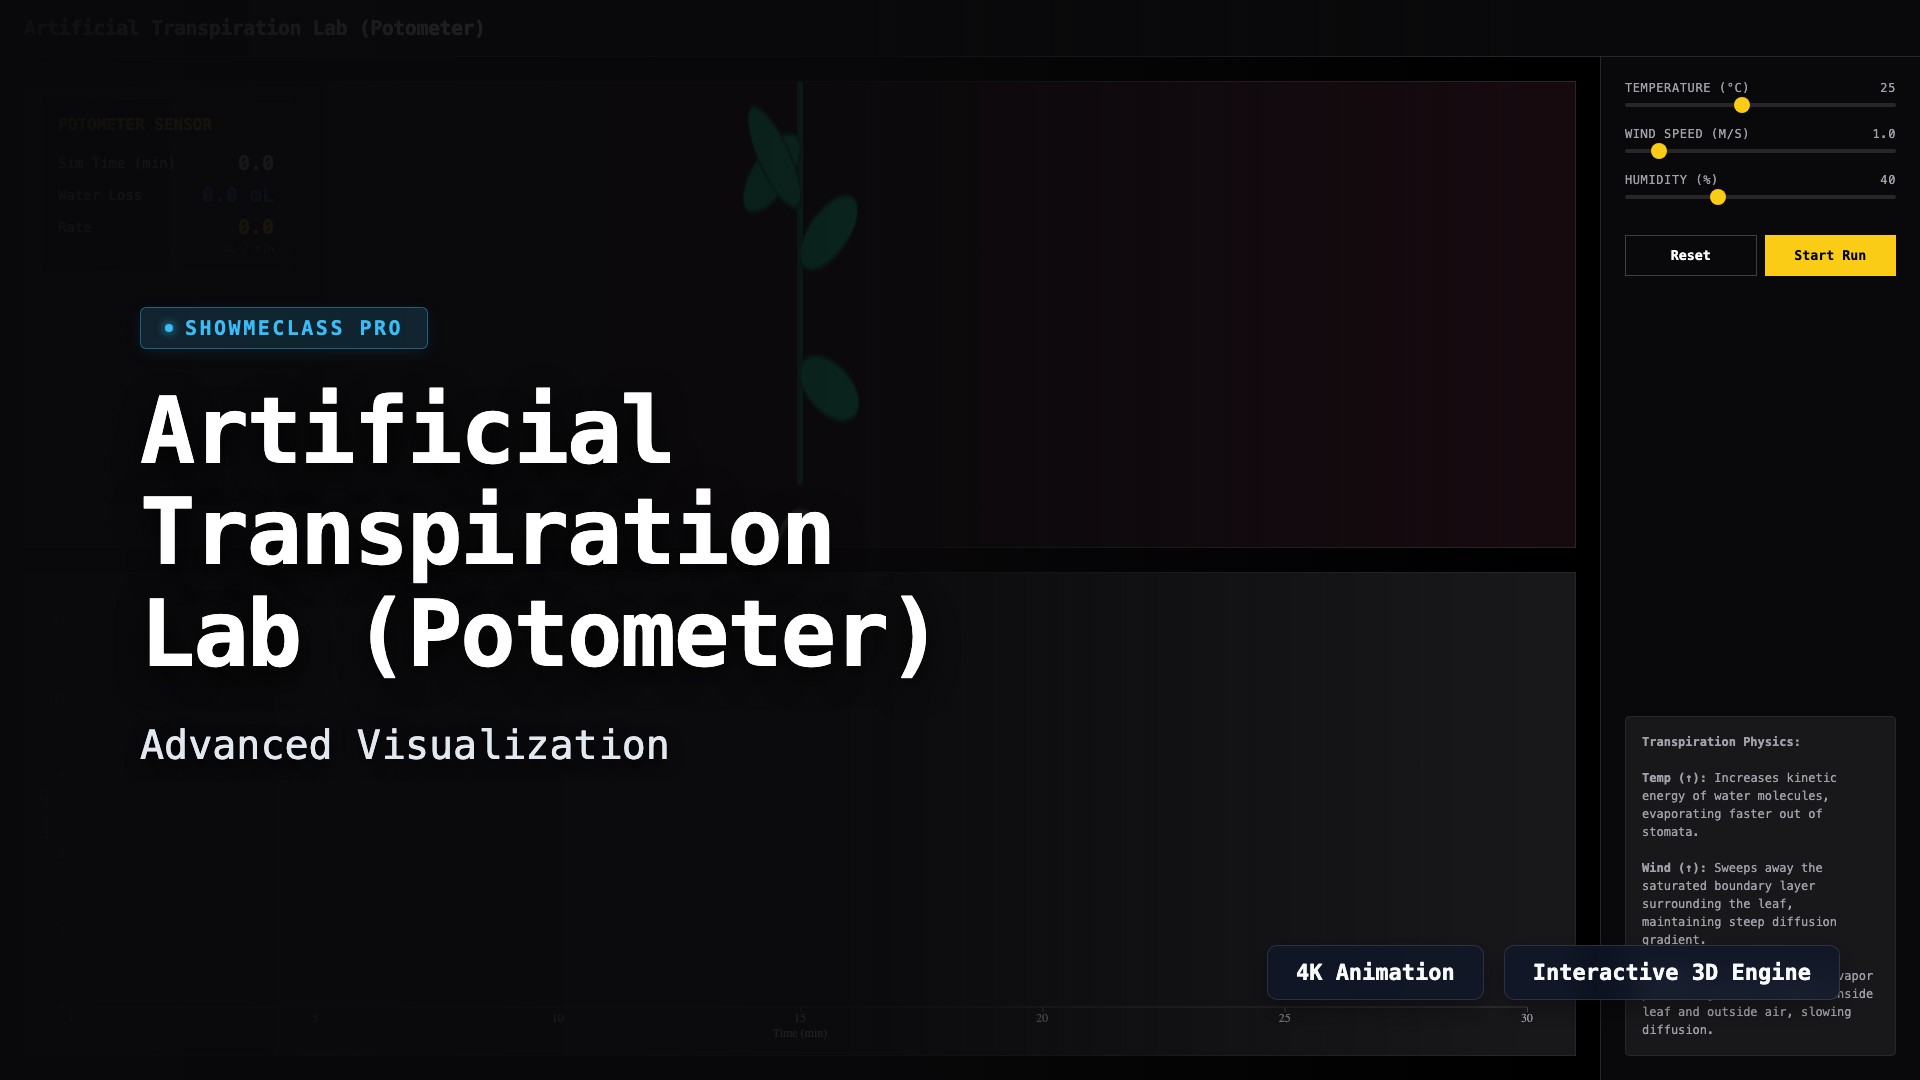
Artificial Transpiration Lab (Potometer)
Measure the rate of water loss in a simulated plant cutting using a virtual potometer. Adjust environmental physics variables including Temperature, Wind Speed, and Humidity to determine their exact multiplicative effects on evaporation.
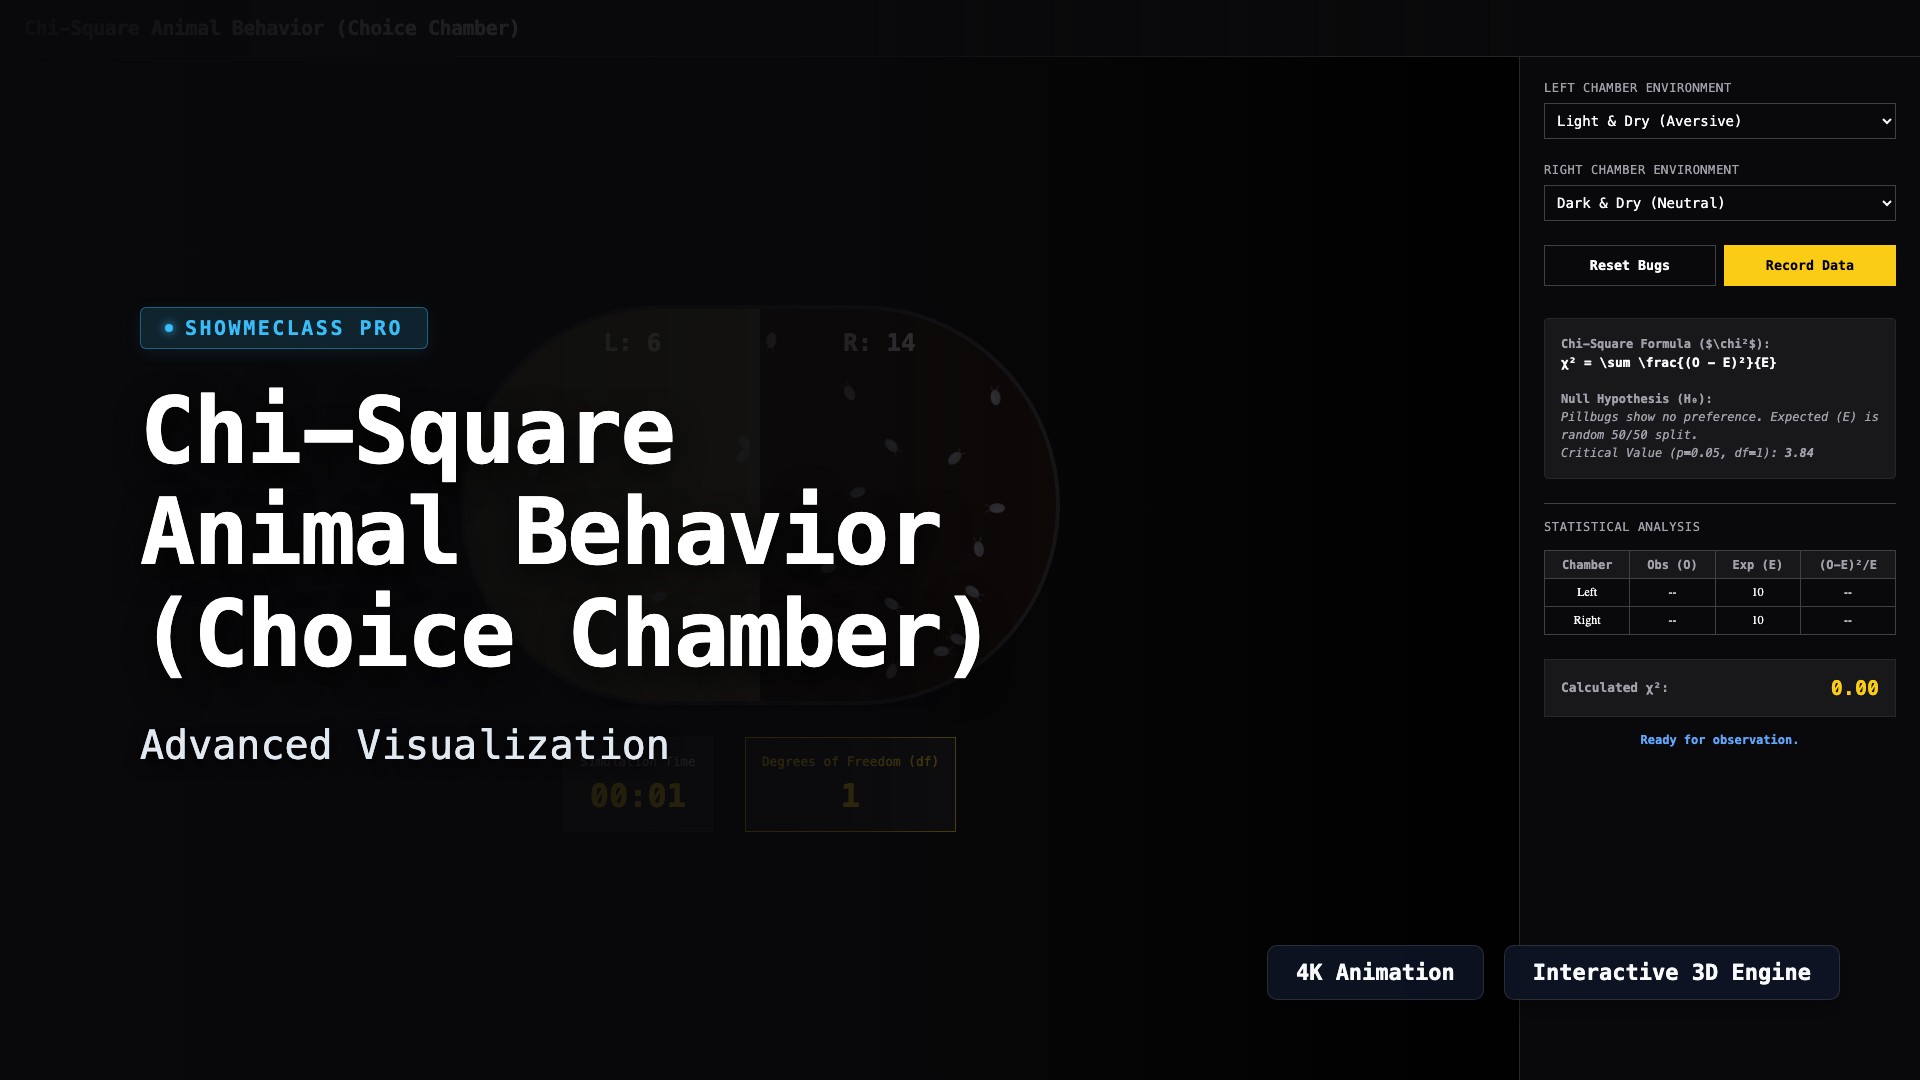
Chi-Square Animal Behavior (Choice Chamber)
Simulate pillbug movement across varying environmental conditions (Light/Dark, Dry/Wet). Record real-time location data and dynamically calculate the Chi-Square (χ²) statistic to reject or fail to reject the null hypothesis of random distribution.
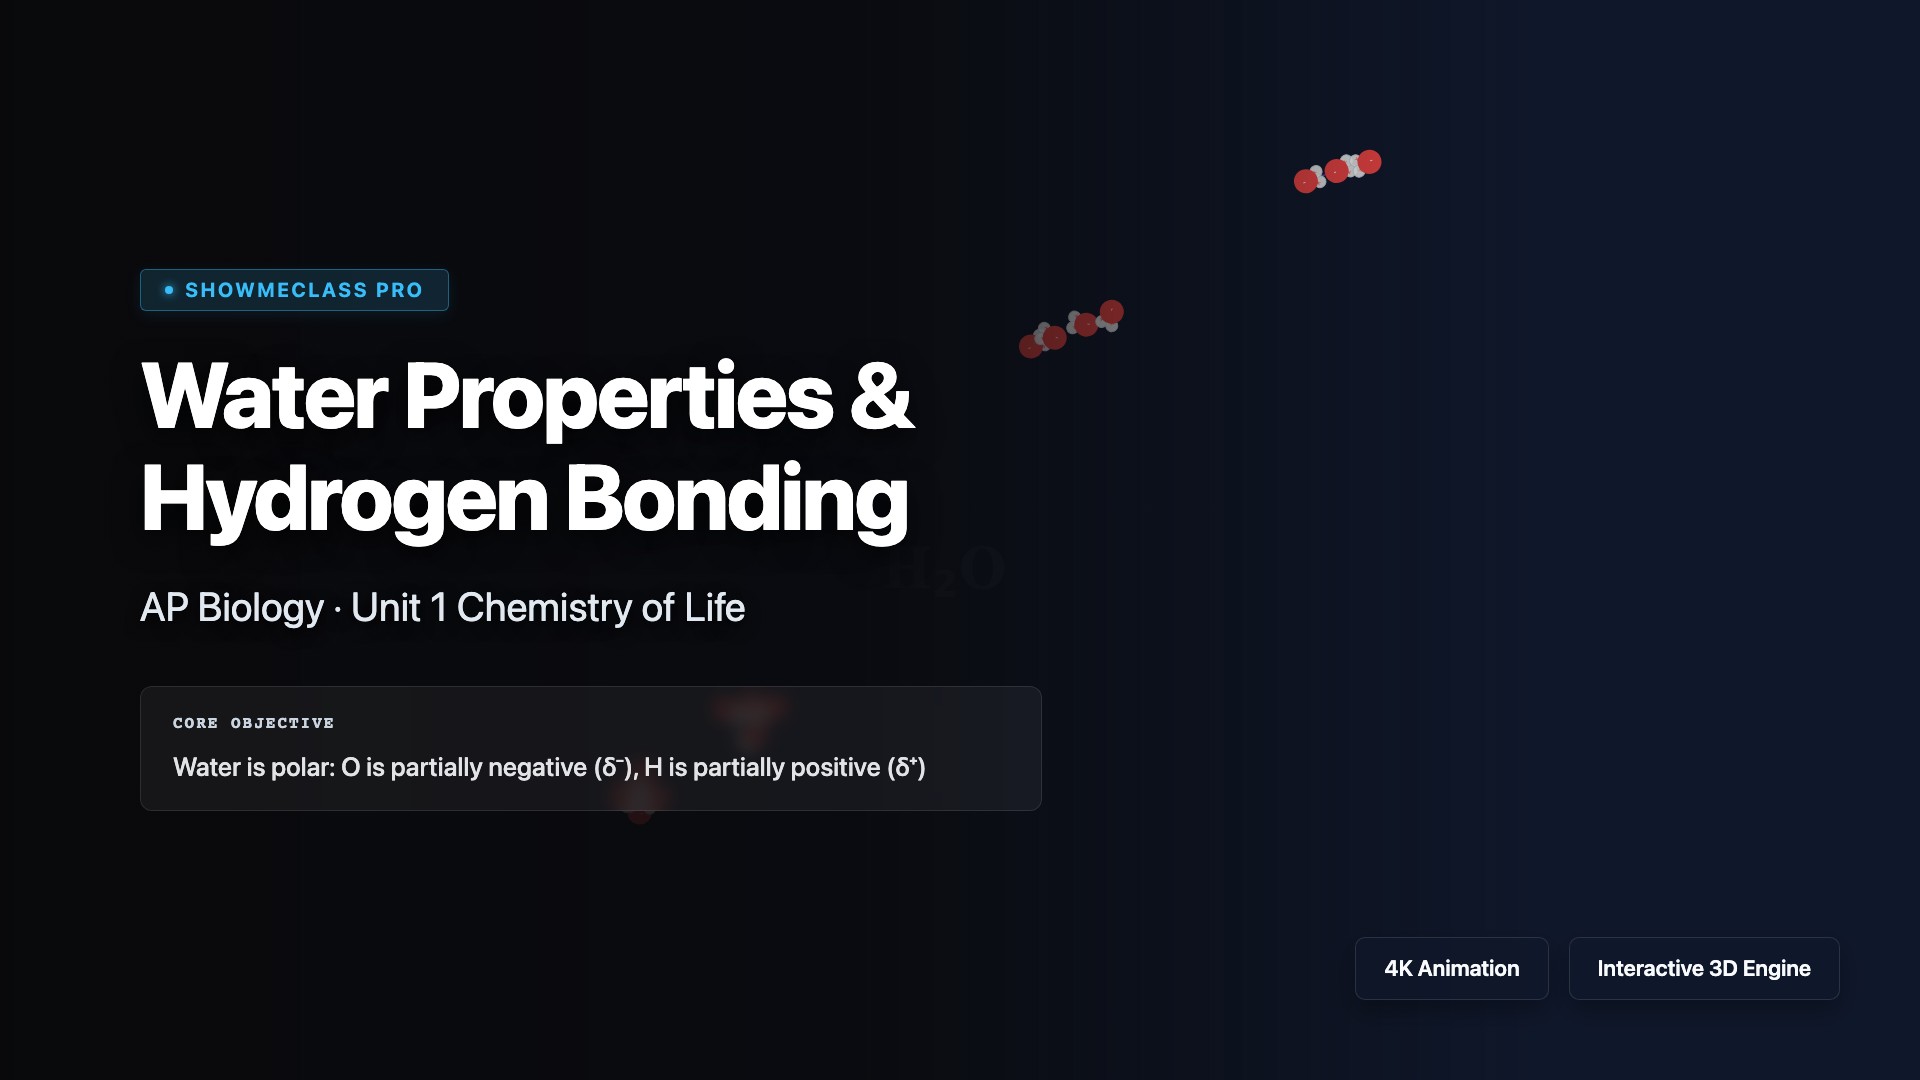
Water Properties & Hydrogen Bonding
Interactive water molecule simulator demonstrating polarity, hydrogen bonding networks, and temperature effects acting as solvent shells around NaCl ions.
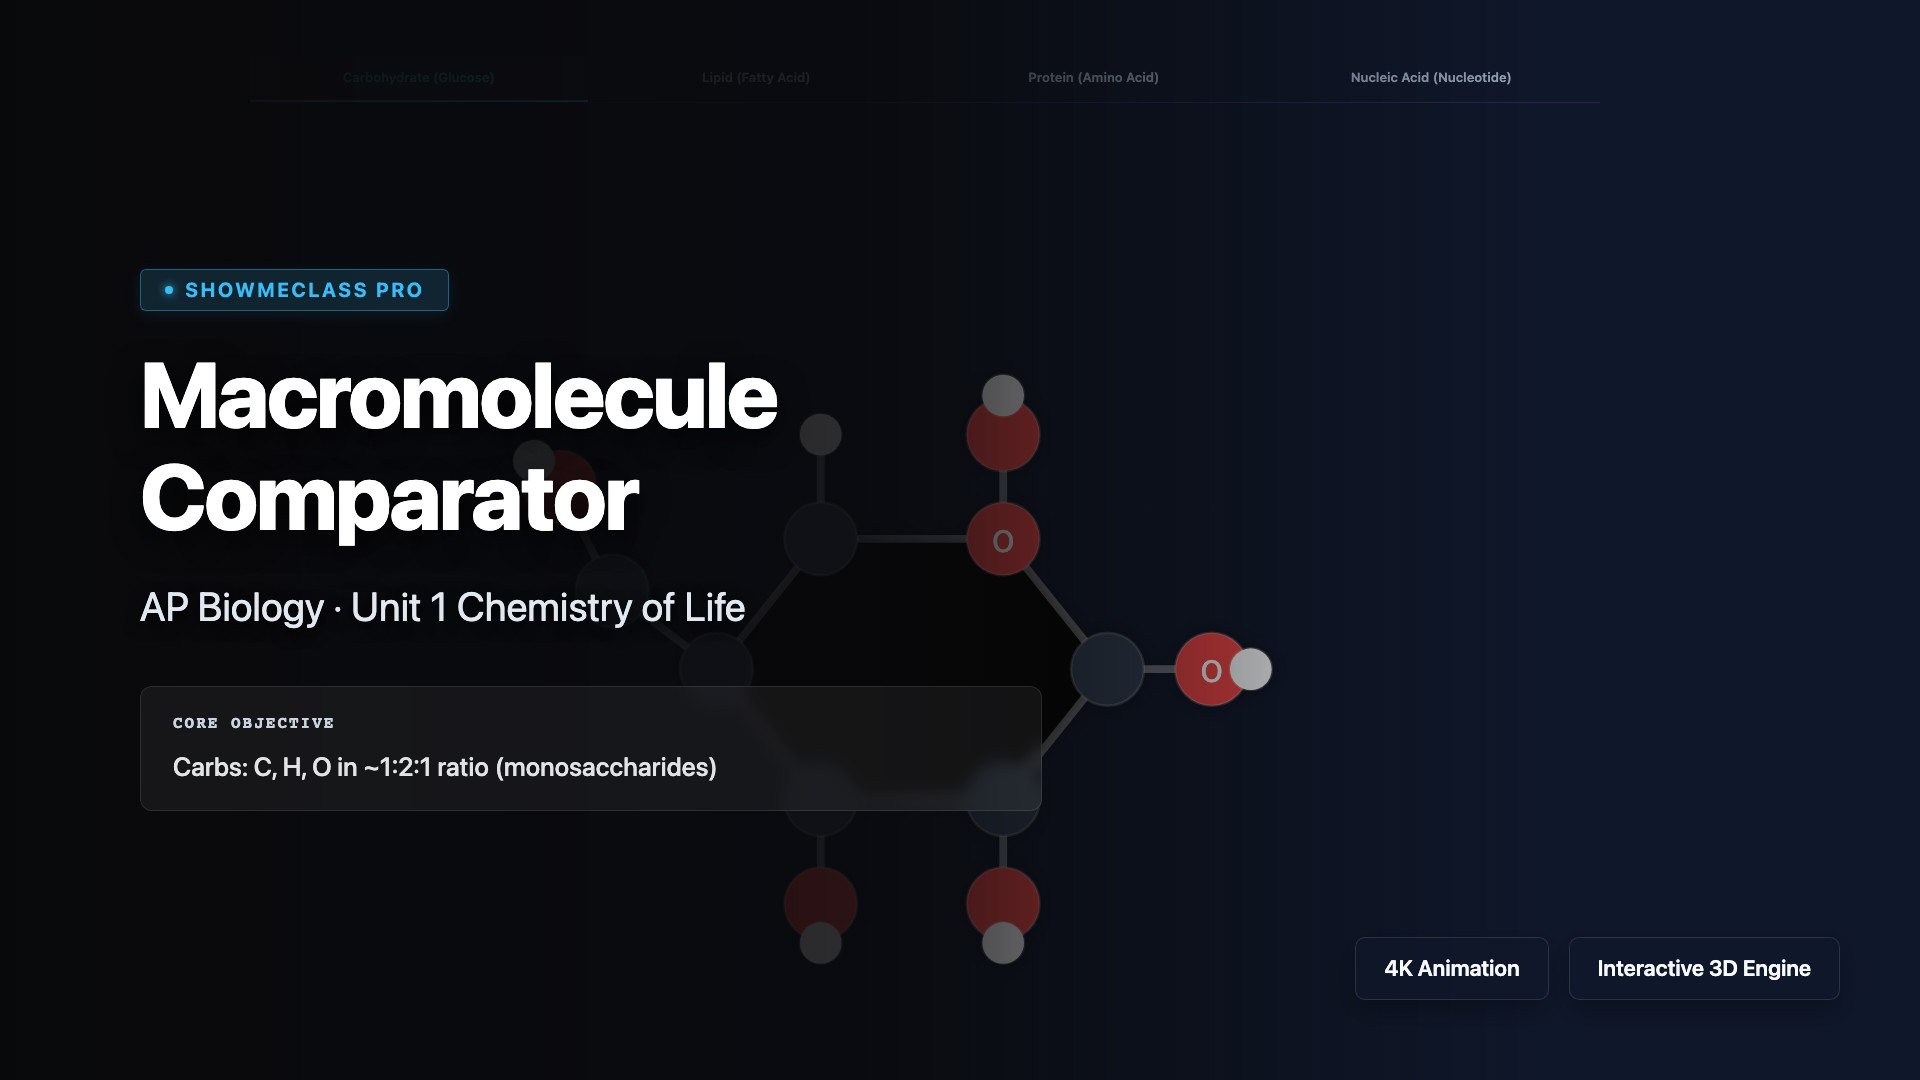
Macromolecule Structure Comparator
Compare the 2D SVG molecular structures of Carbohydrates, Lipids, Proteins, and Nucleic Acids. Identify key elements and monomers.
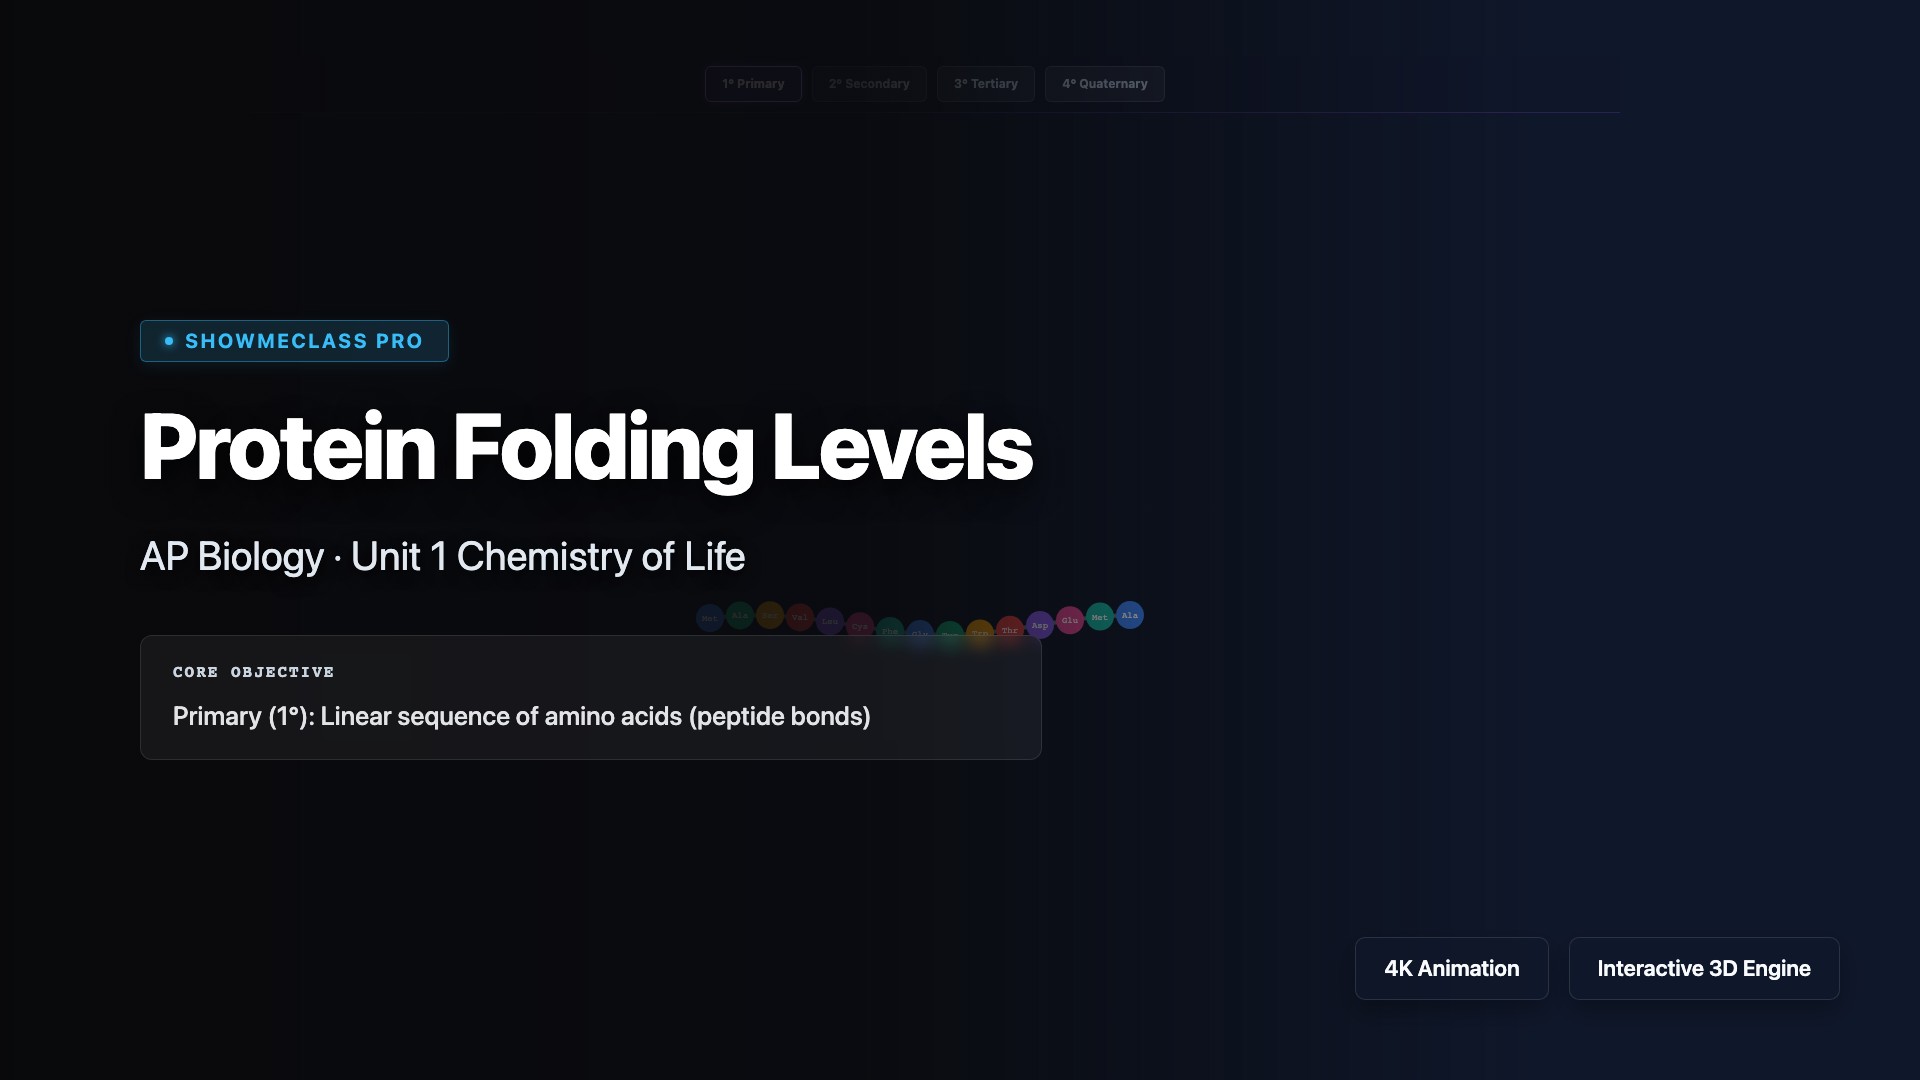
Protein Folding Levels (1°-4°)
Animated stepwise assembly of a protein from its primary amino acid sequence through alpha-helices/beta-sheets to complex 3D tertiary and quaternary structures, including extreme heat denaturation.
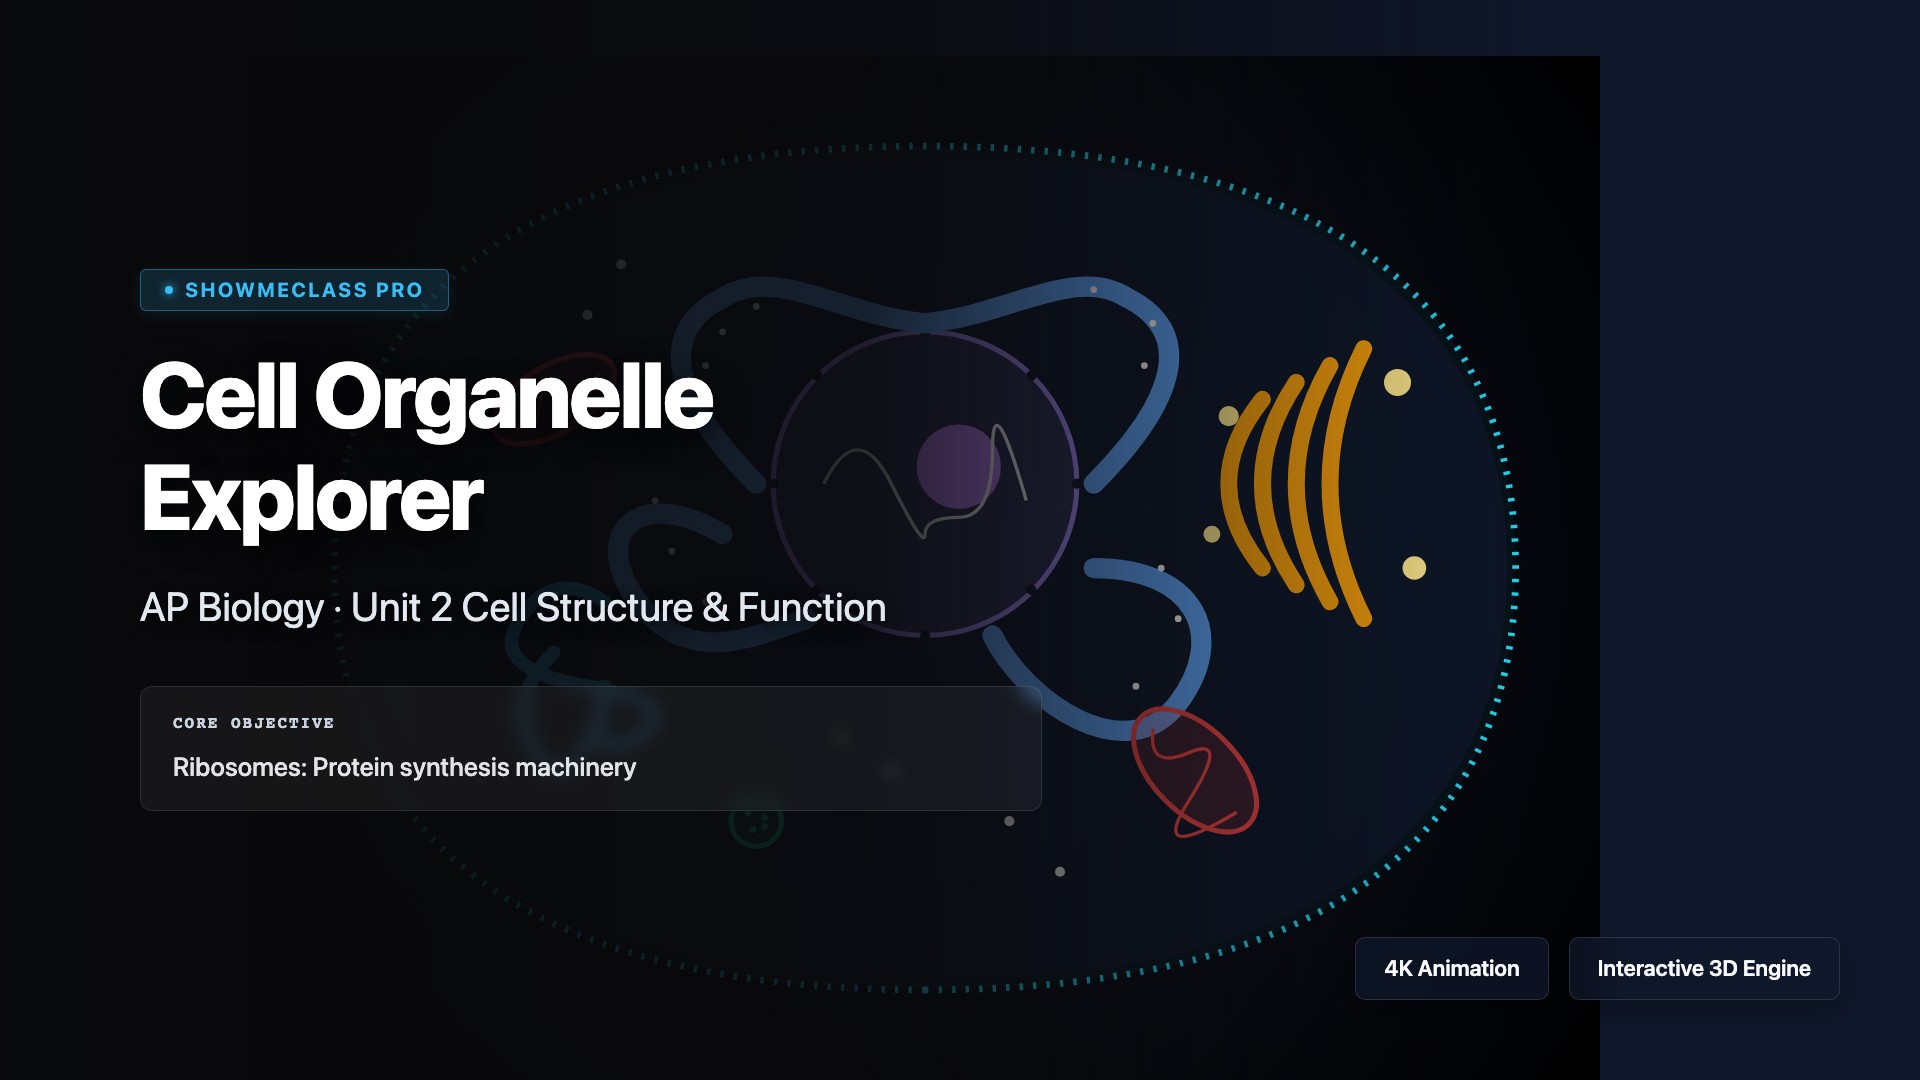
Cell Organelle Function Explorer
Explore an interactive diagram of a eukaryotic cell. Click on organelles like the Nucleus, Rough/Smooth ER, Golgi, and Mitochondria to view detailed functions.
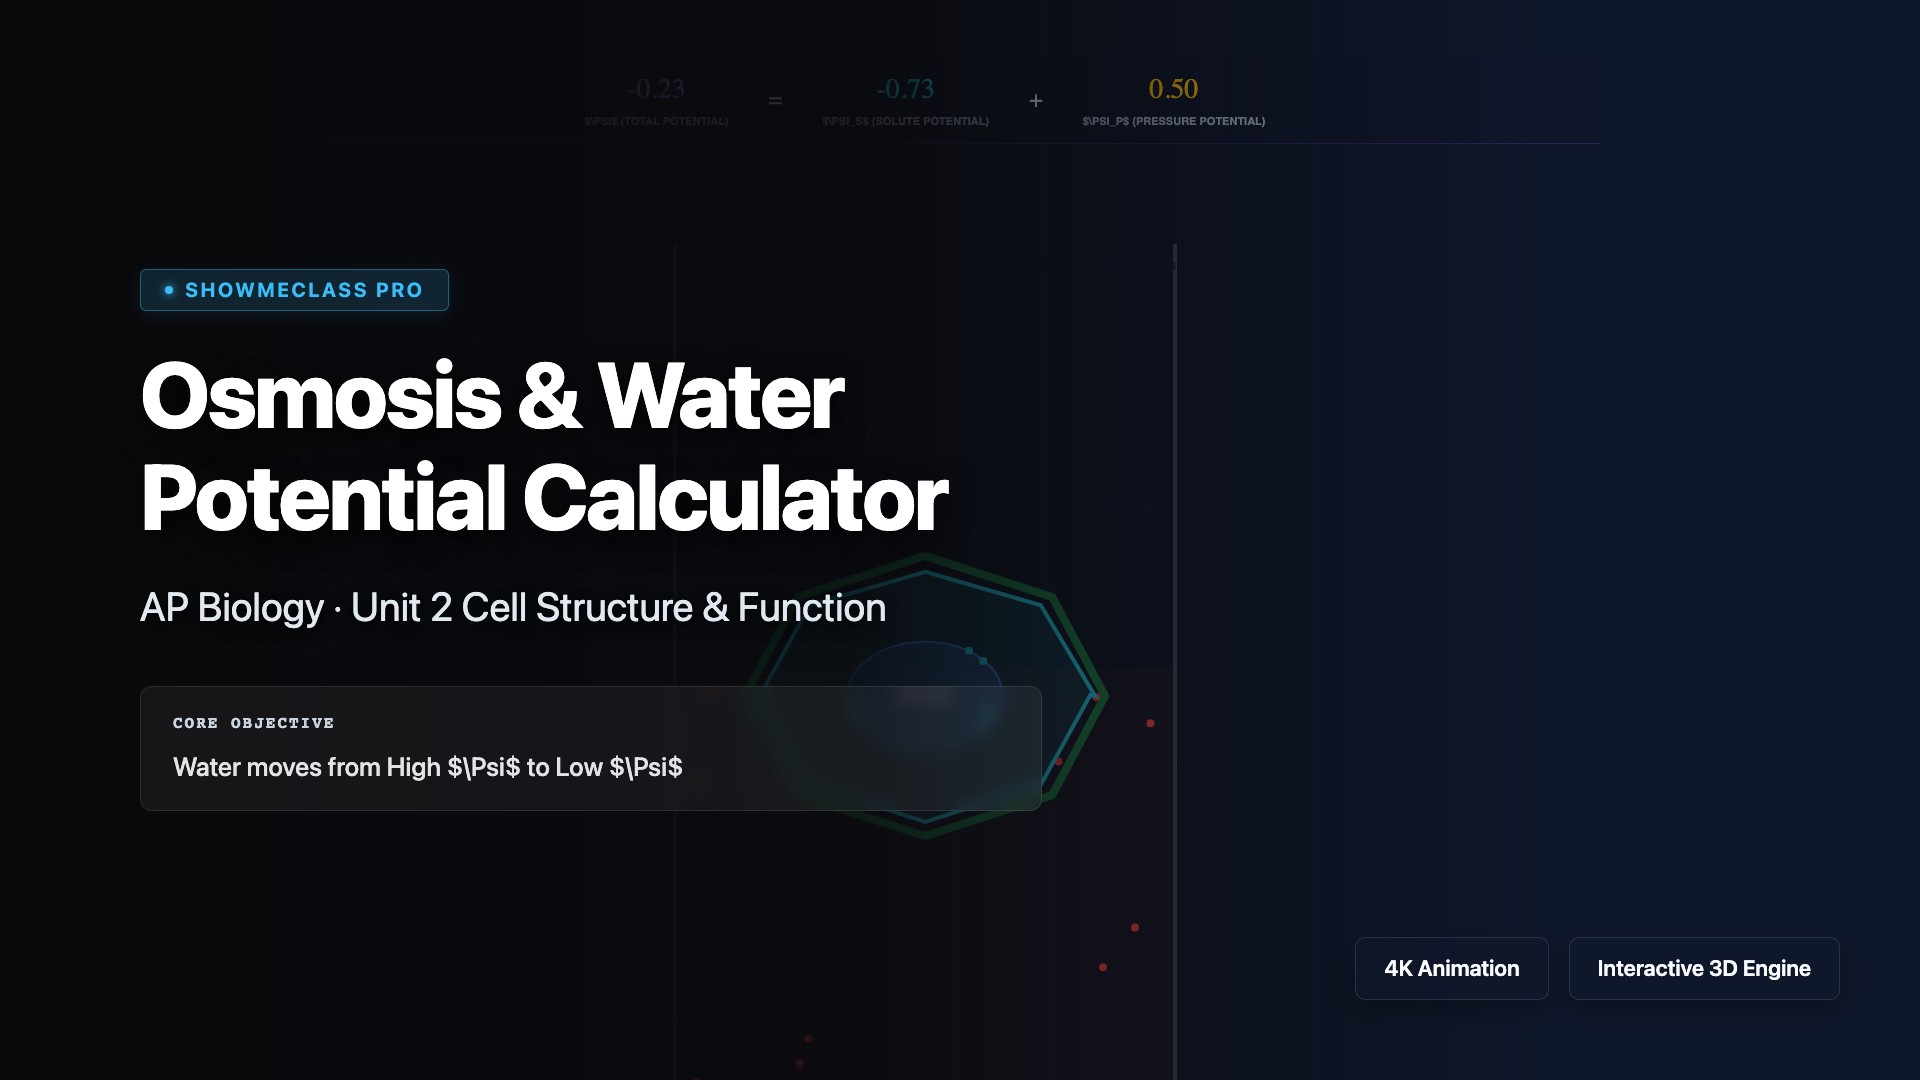
Osmosis & Water Potential Calculator
Calculate and visualize water potential (Ψ = Ψs + Ψp) across a plant cell membrane. Watch water movement and cell plasmolysis/turgidity based on hypertonic/hypotonic environments.
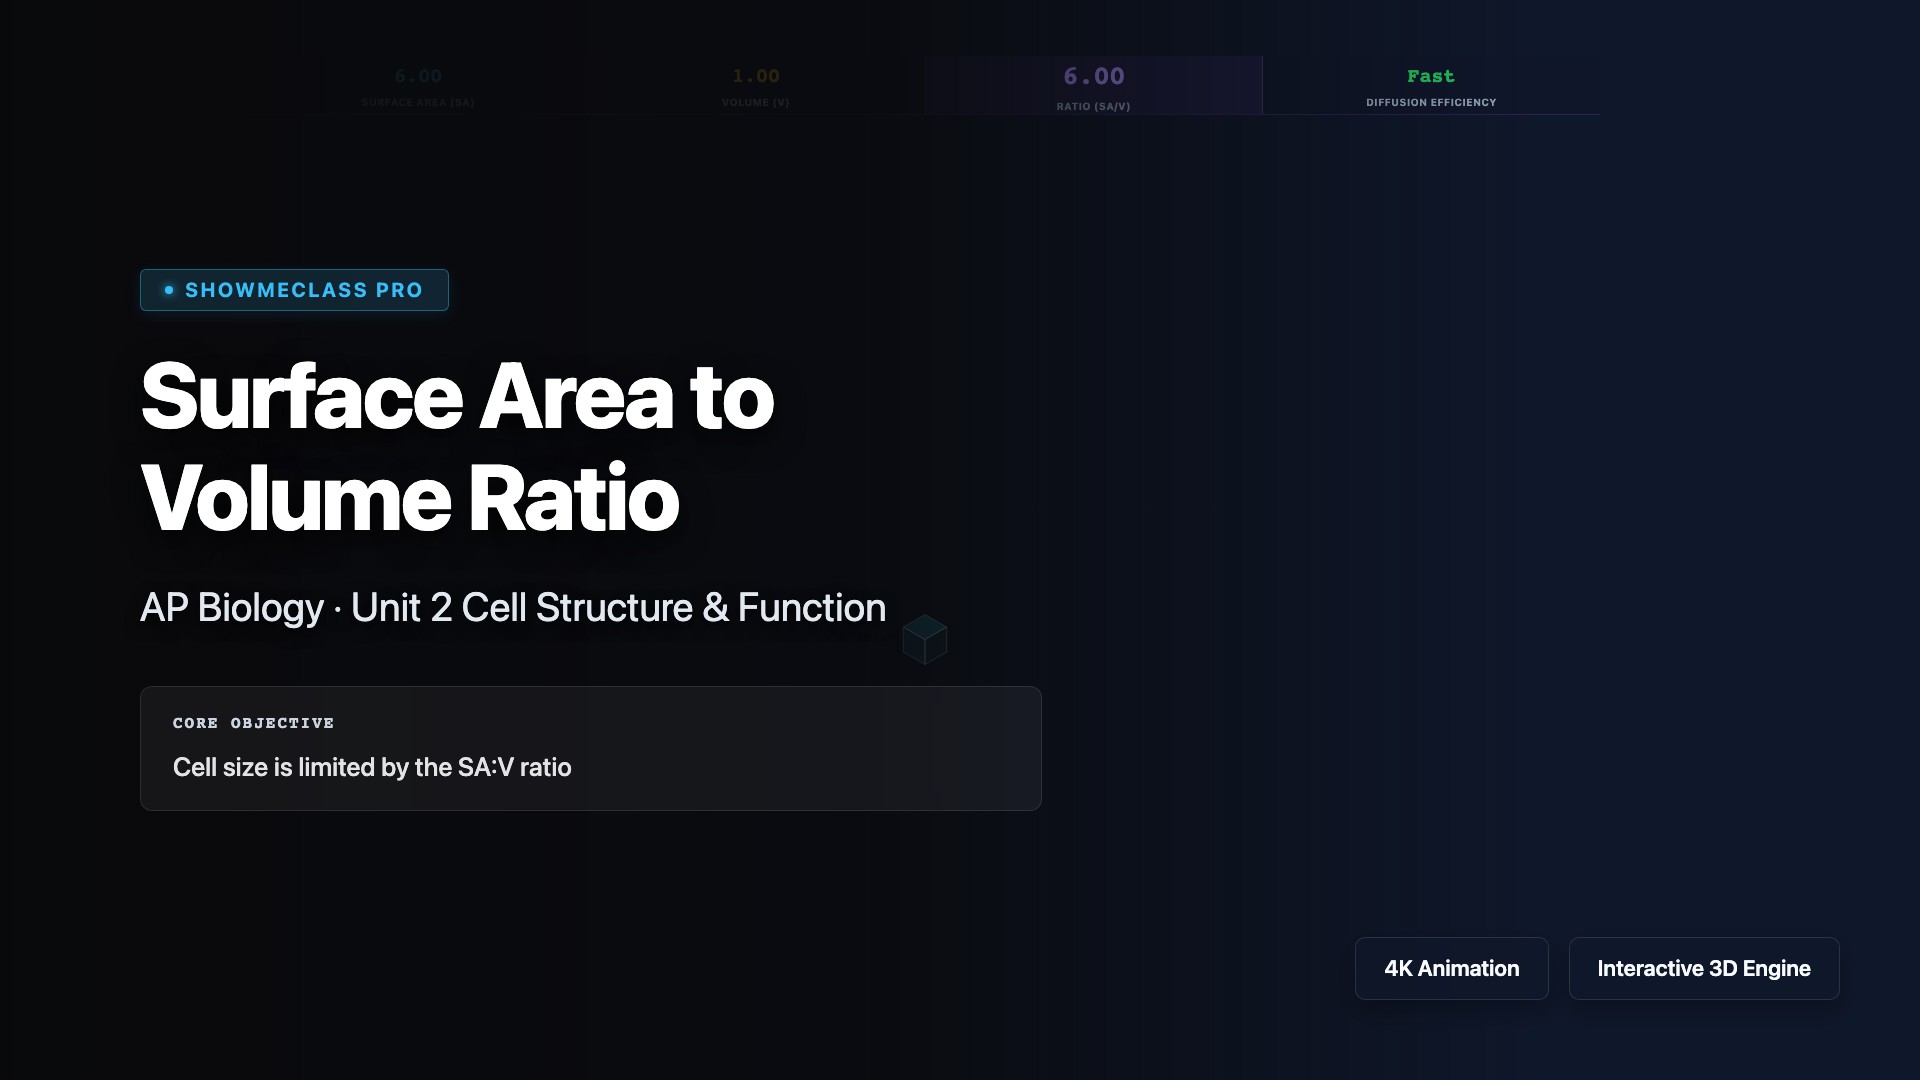
Surface Area to Volume Ratio Animator
Visualize how increasing cell size severely decreases the SA:V ratio, simulating diffusion waves to show why cells must remain small or develop folds.
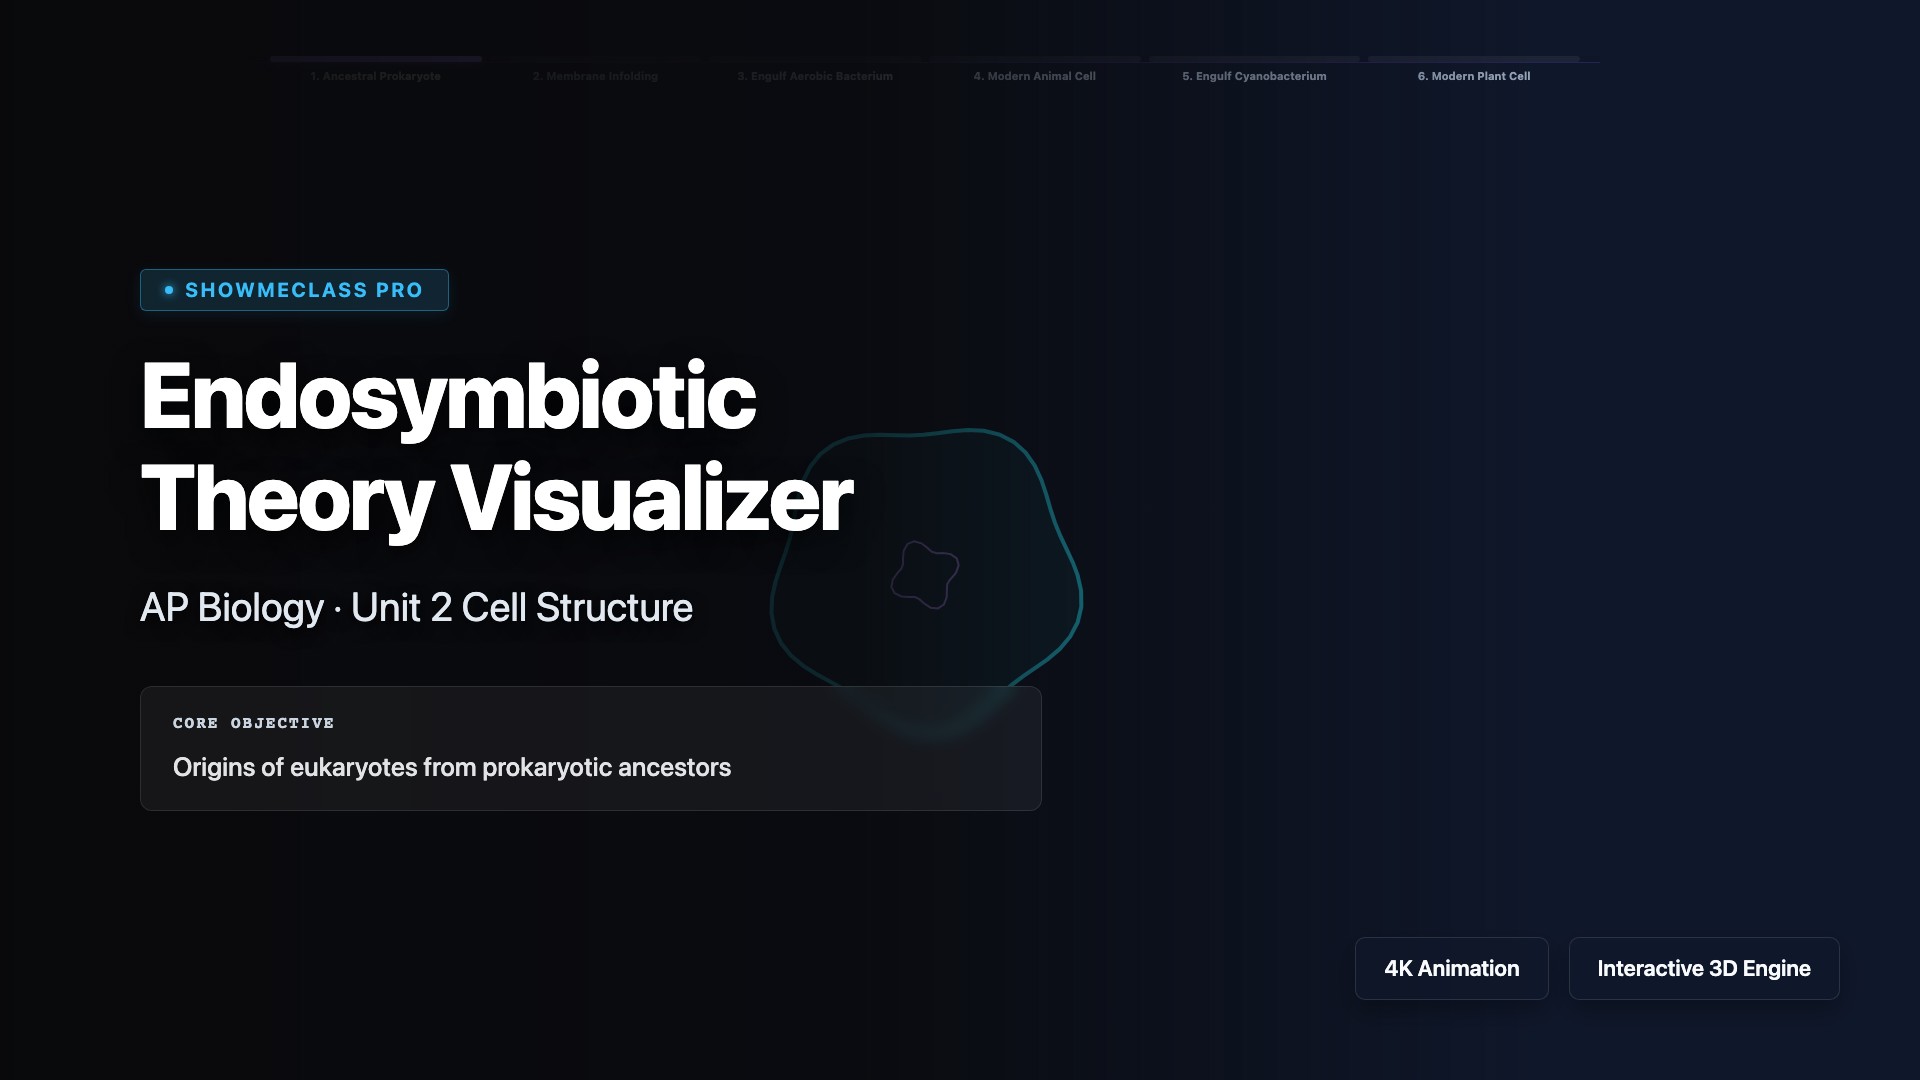
Endosymbiotic Theory Visualizer
Step through an animated history of a eukaryotic cell engulfing aerobic and photosynthetic bacteria to form mitochondria and chloroplasts, respectively.
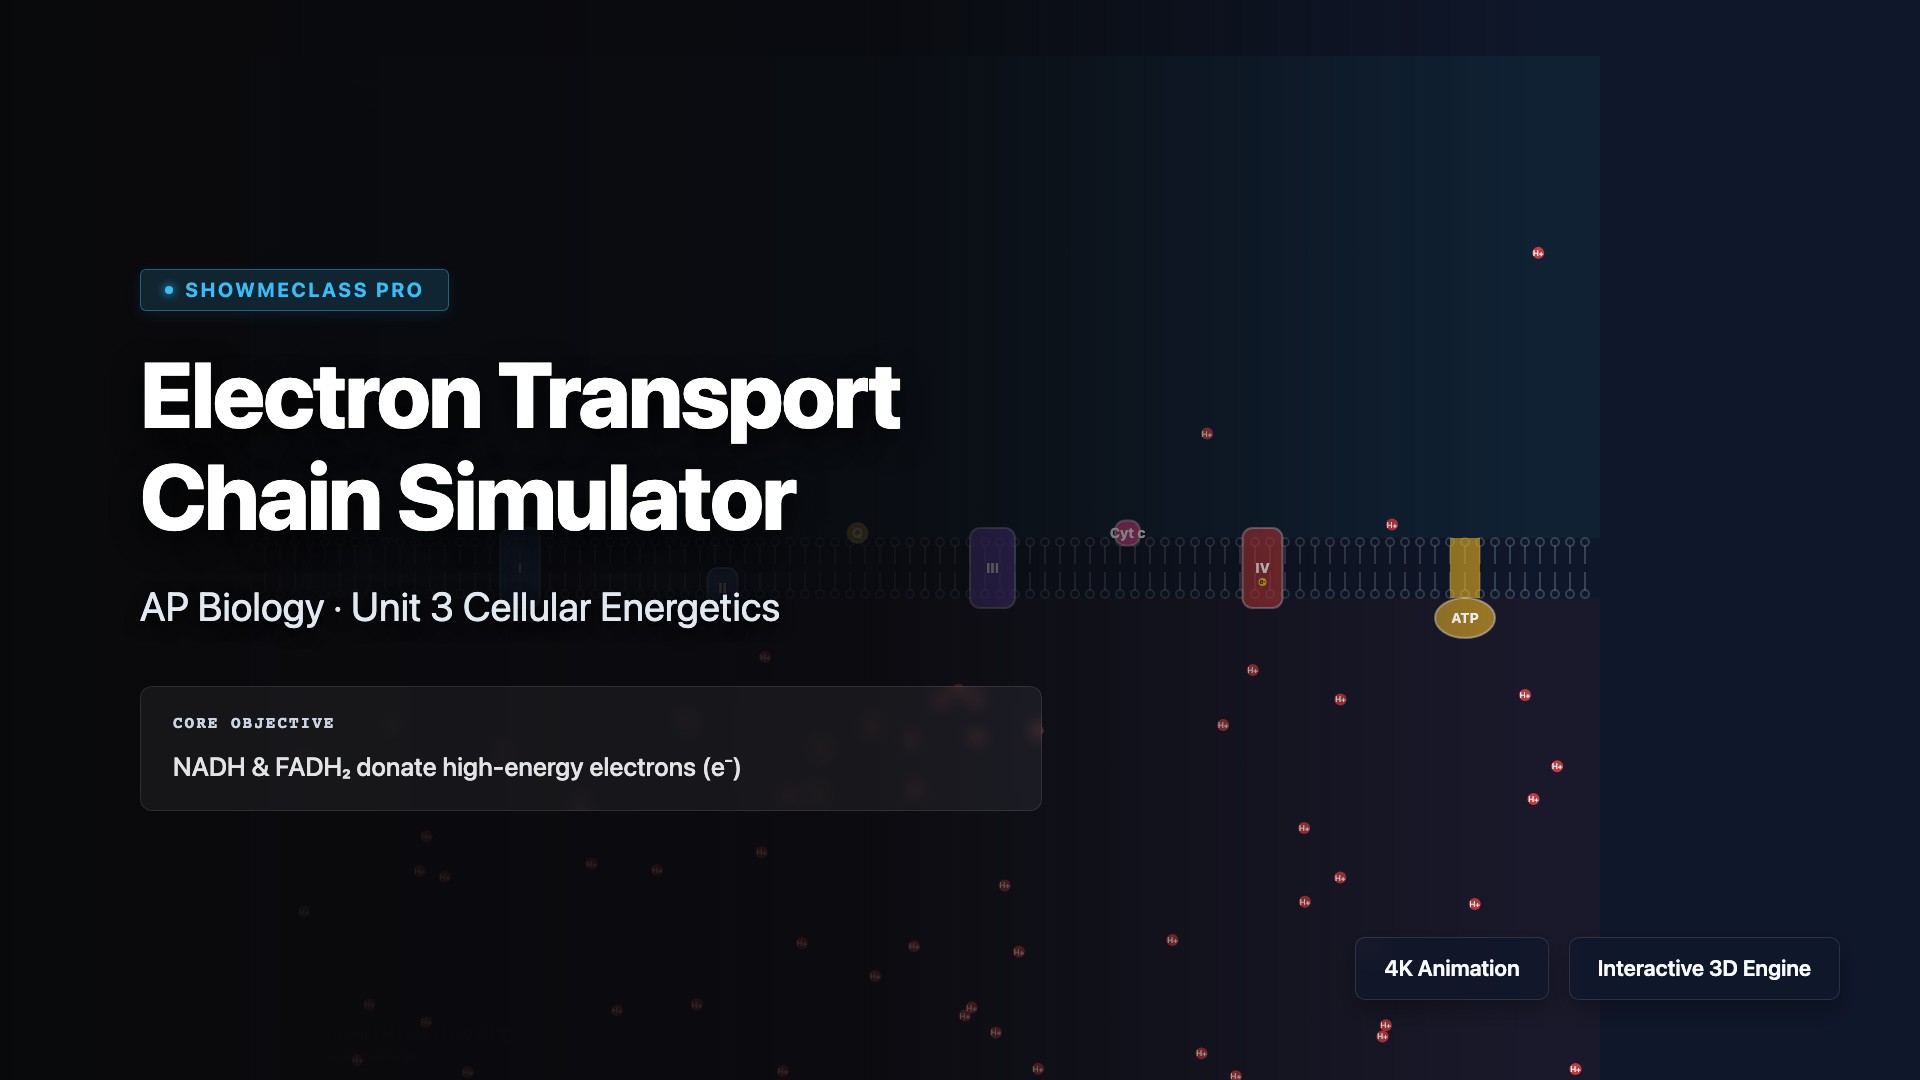
Electron Transport Chain Simulator
Interact with Mitochondrion Complexes I-IV and ATP Synthase. Adjust NADH/O₂ supplies and apply inhibitors (Cyanide, DNP) to observe effects on the proton motive force.
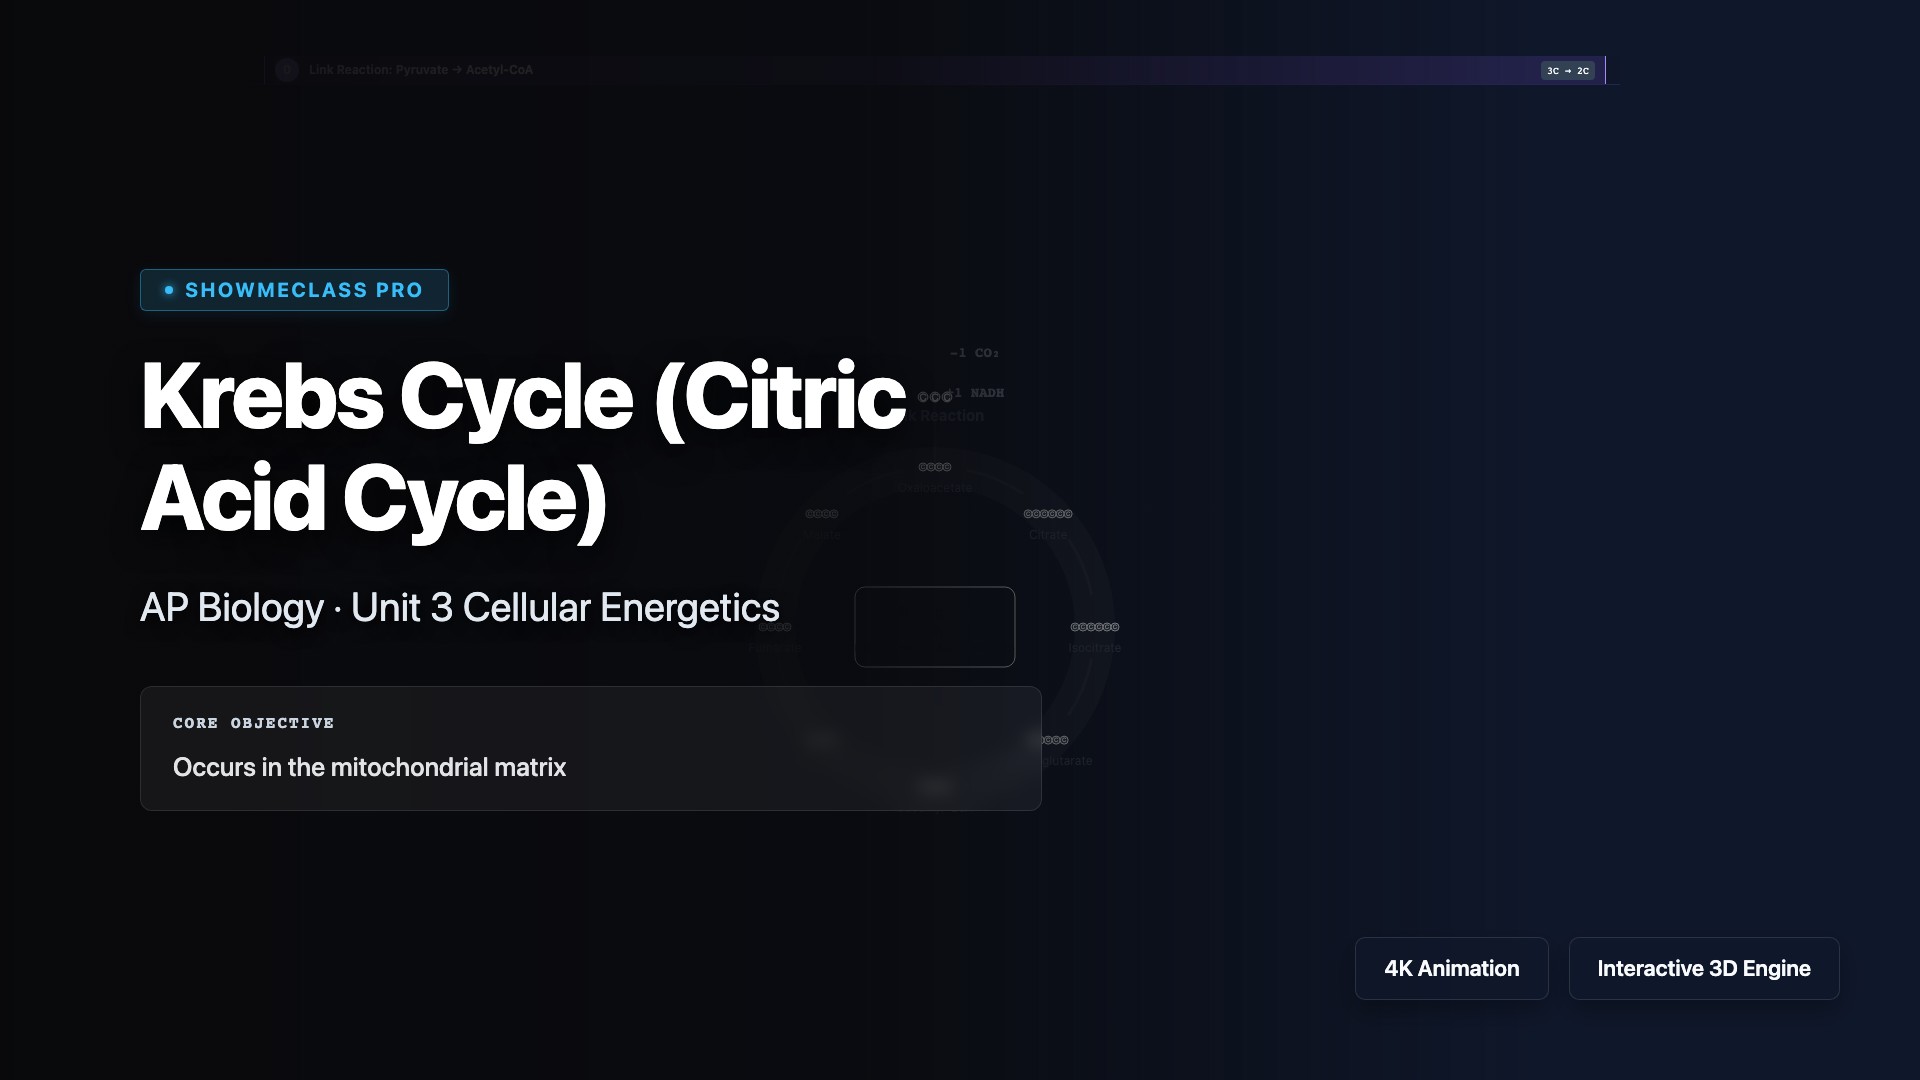
Krebs Cycle Step-by-Step
Step through the 8 stages of the Citric Acid Cycle, visualizing the breakdown of Acetyl-CoA and the tracking of Carbon, NADH, FADH₂, and ATP yields.
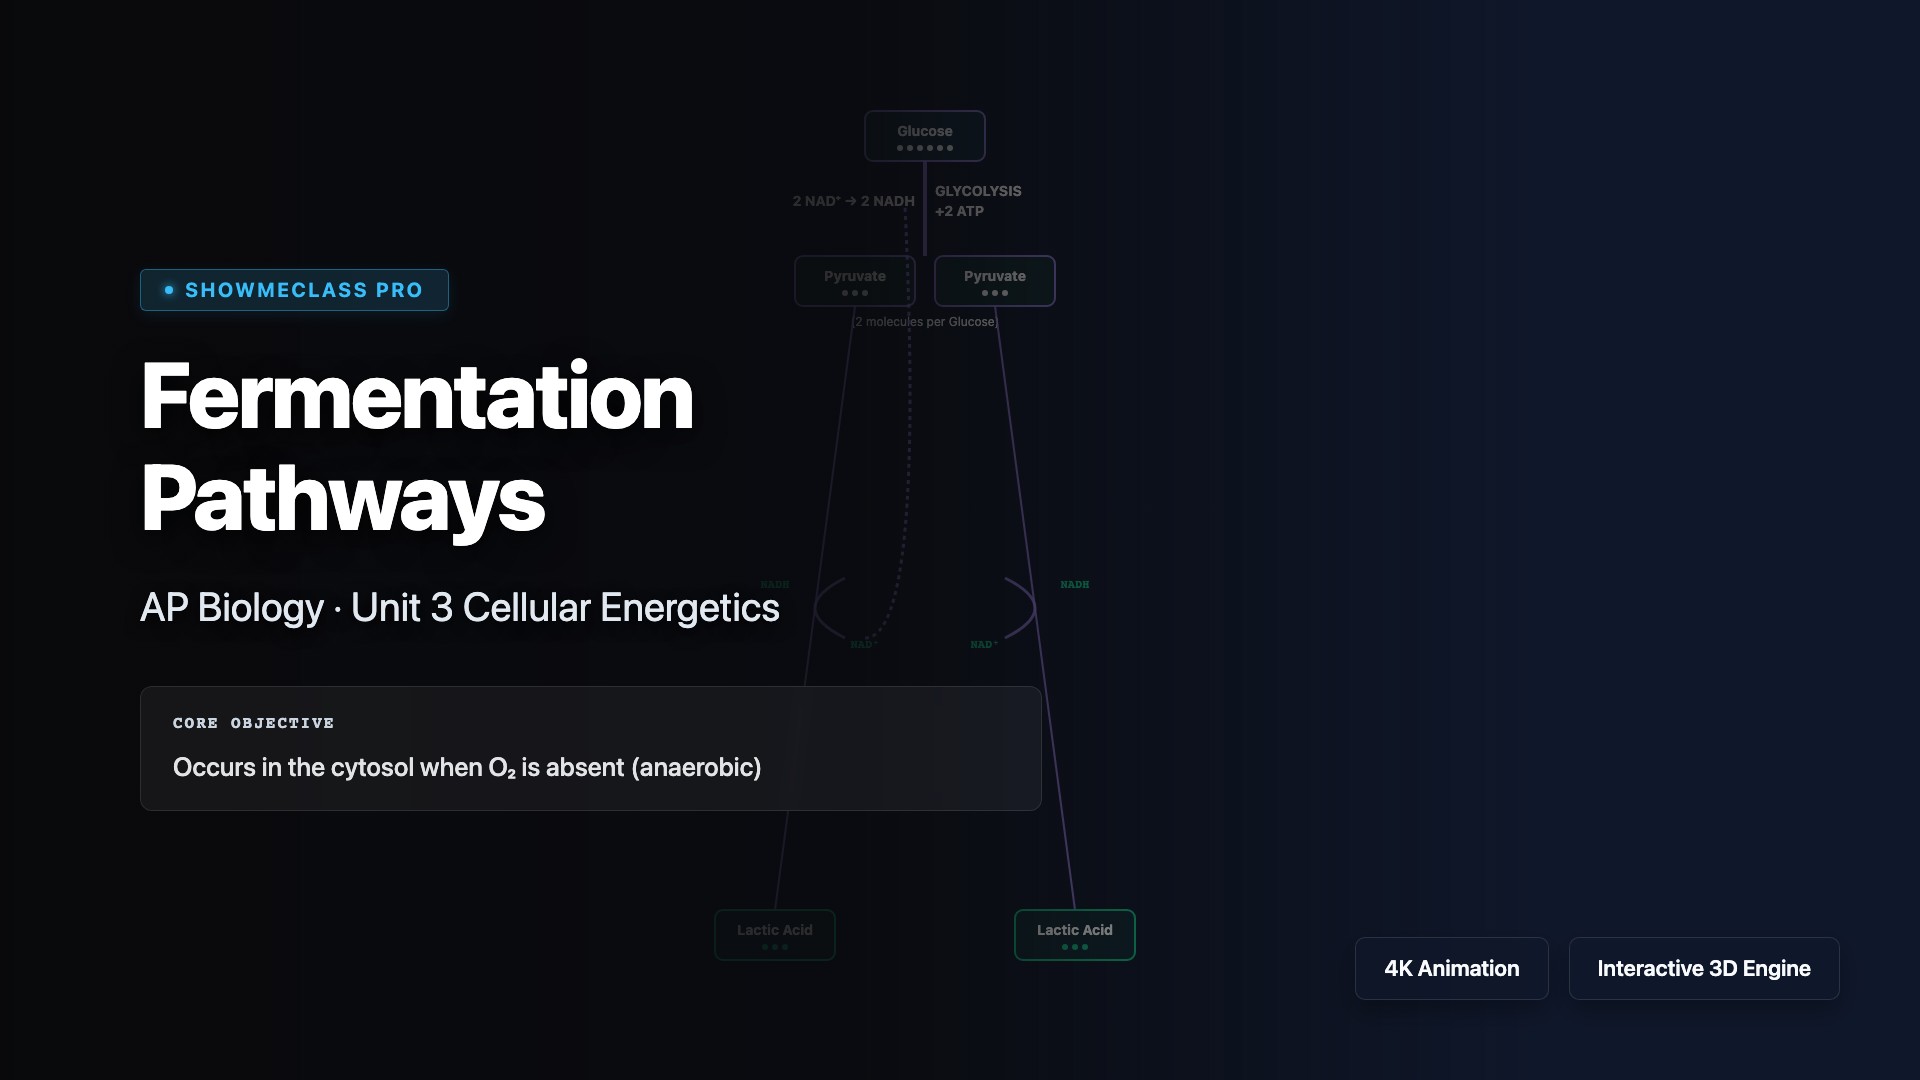
Fermentation Pathways Simulator
Compare anaerobic Lactic Acid Fermentation vs Alcoholic Fermentation to Aerobic Respiration, emphasizing the critical need to regenerate NAD⁺ for glycolysis.
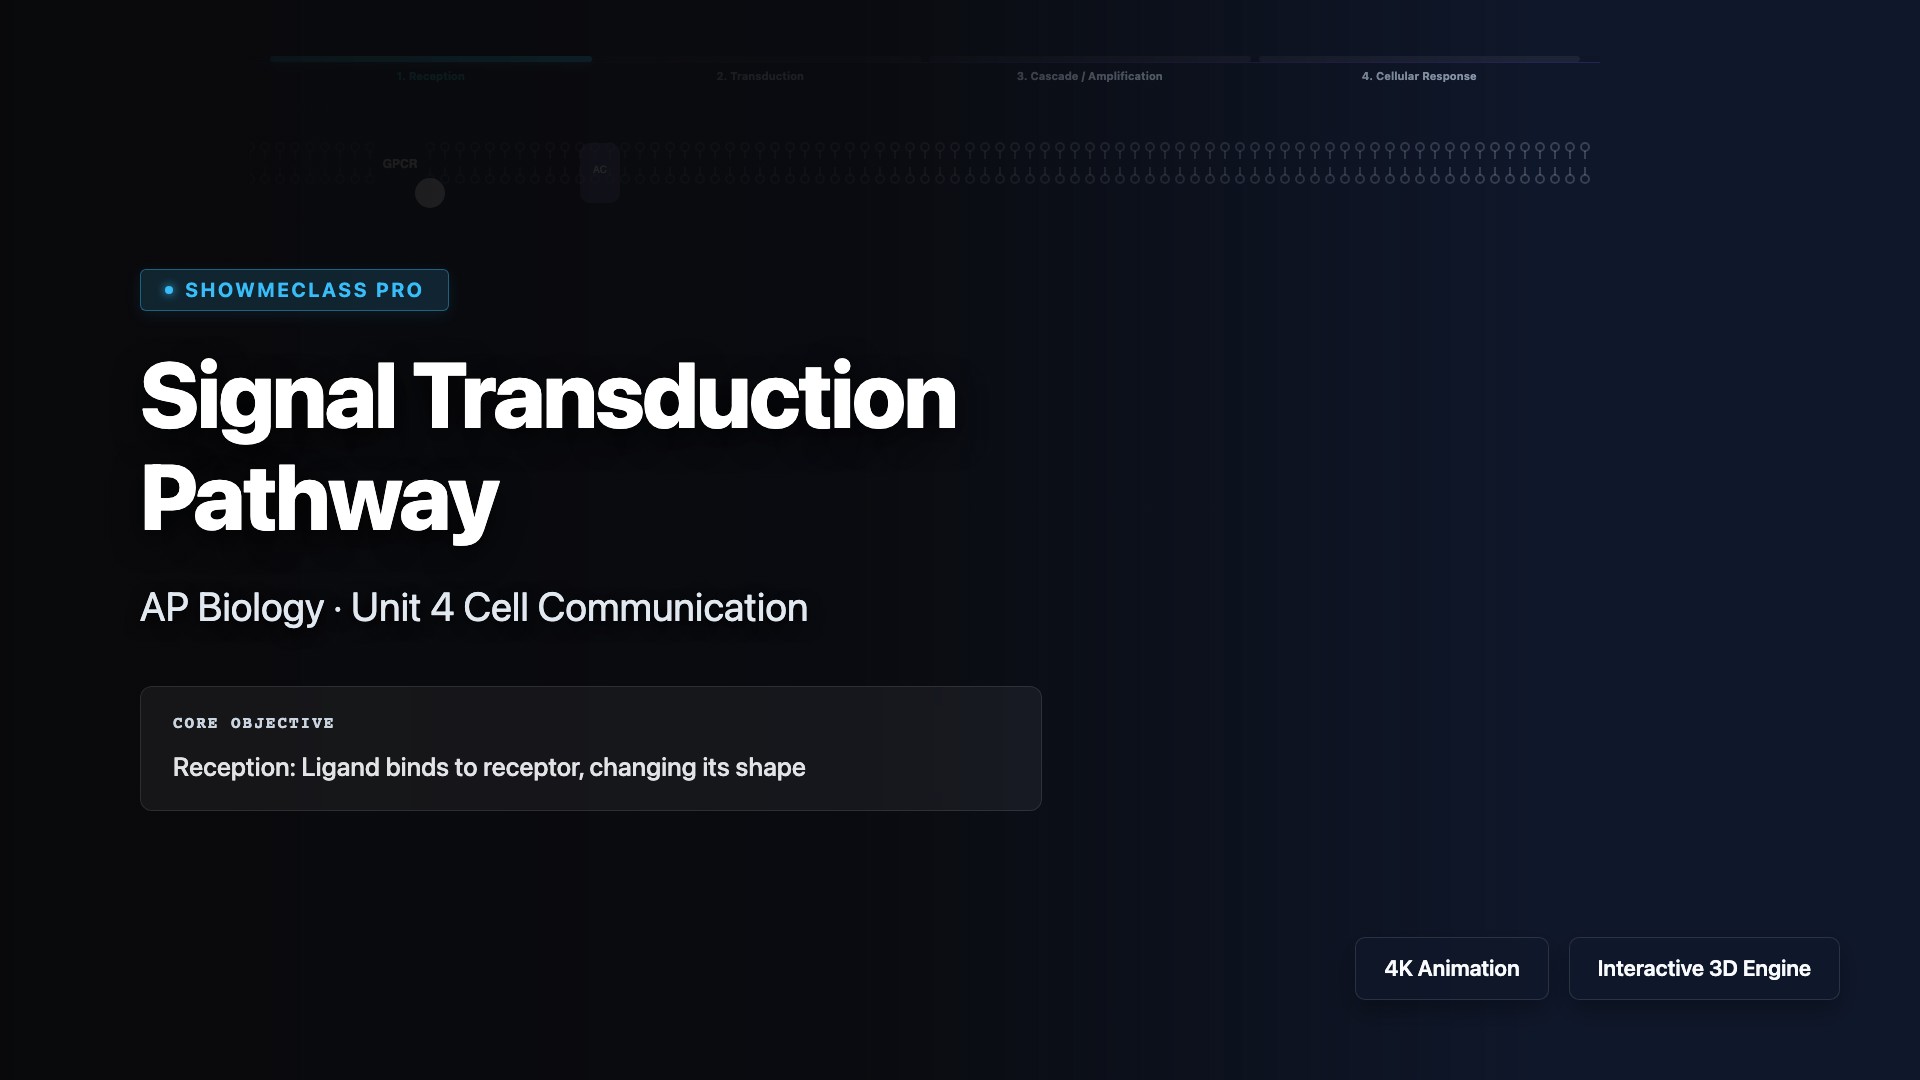
Signal Transduction Pathway
Trigger an epinephrine signaling cascade spanning Reception (GPCR), Transduction (G-protein, Adenylyl Cyclase, cAMP), and Response (PKA kinase amplification).
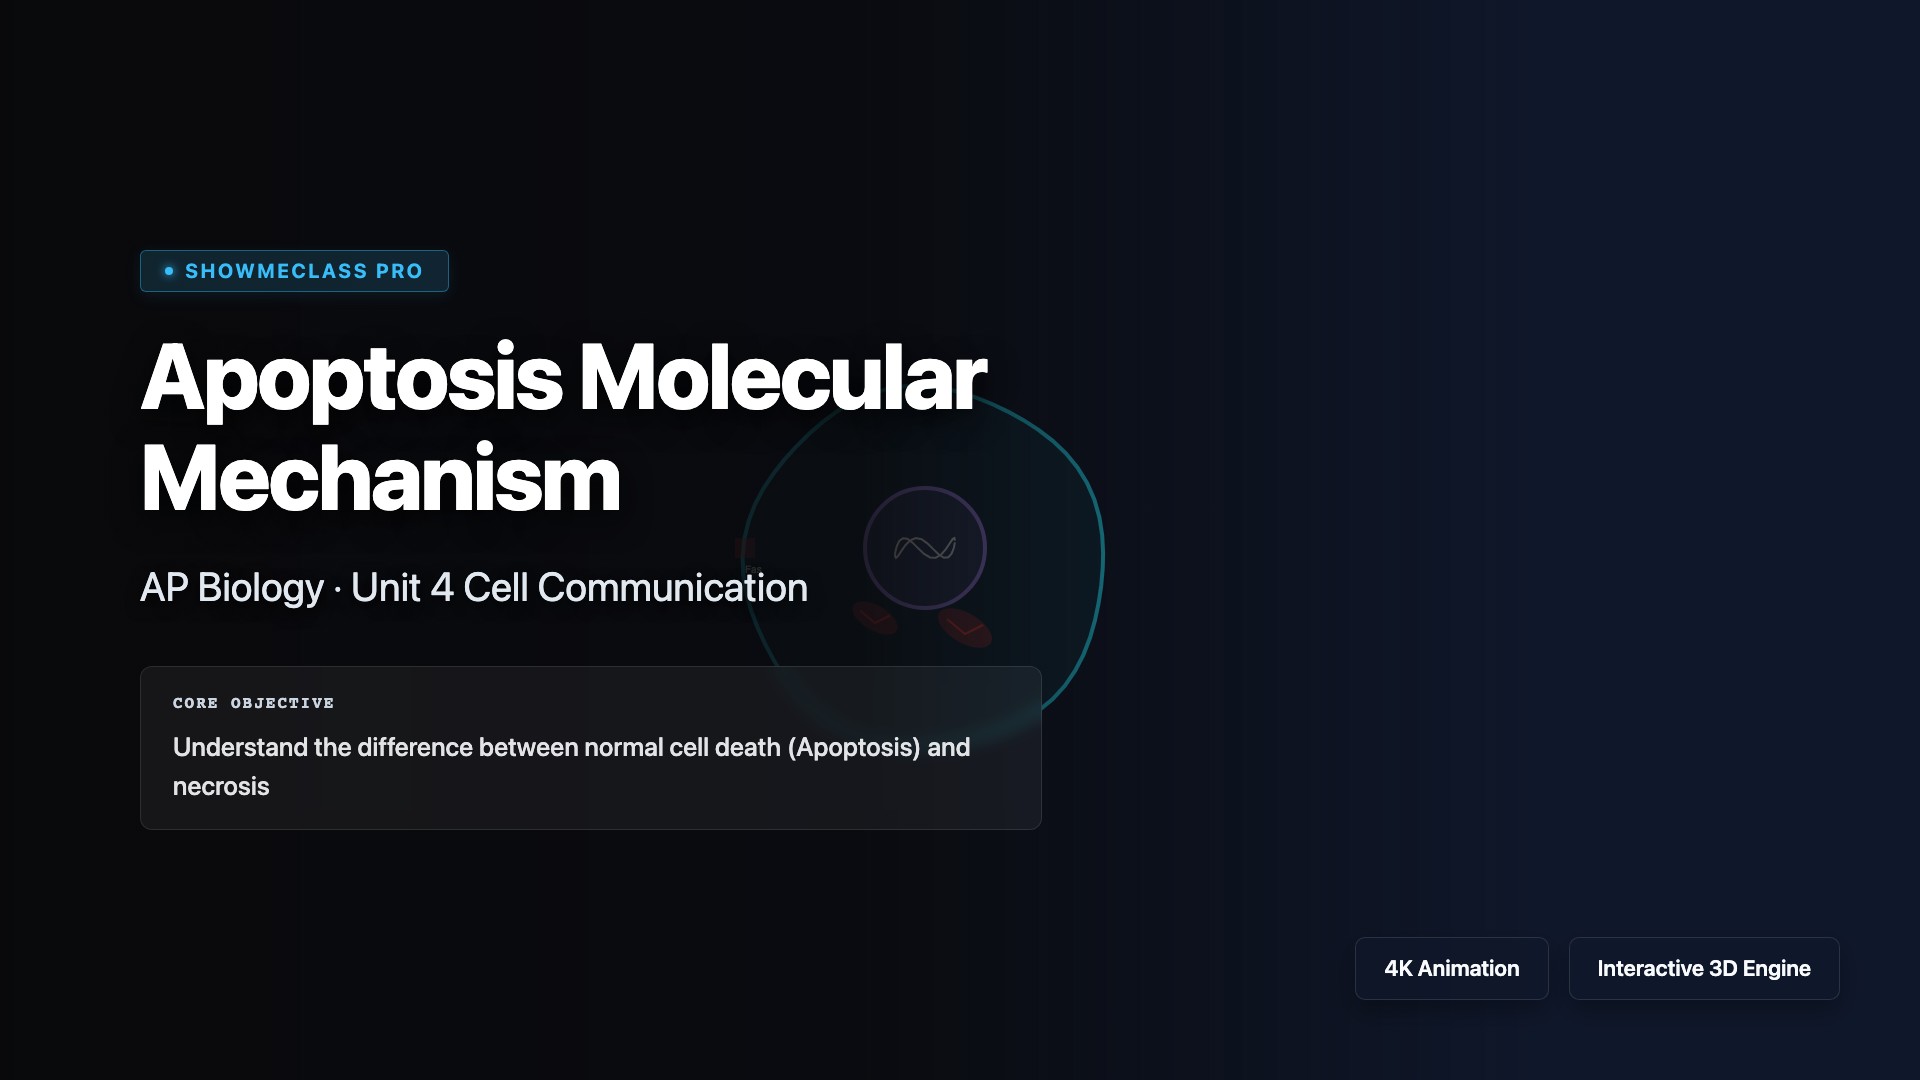
Apoptosis Molecular Mechanism
Trigger the intrinsic (mitochondrial/cytochrome c leakage) or extrinsic pathways of programmed cell death leading to the destructive Caspase cascade and cellular blebbing.
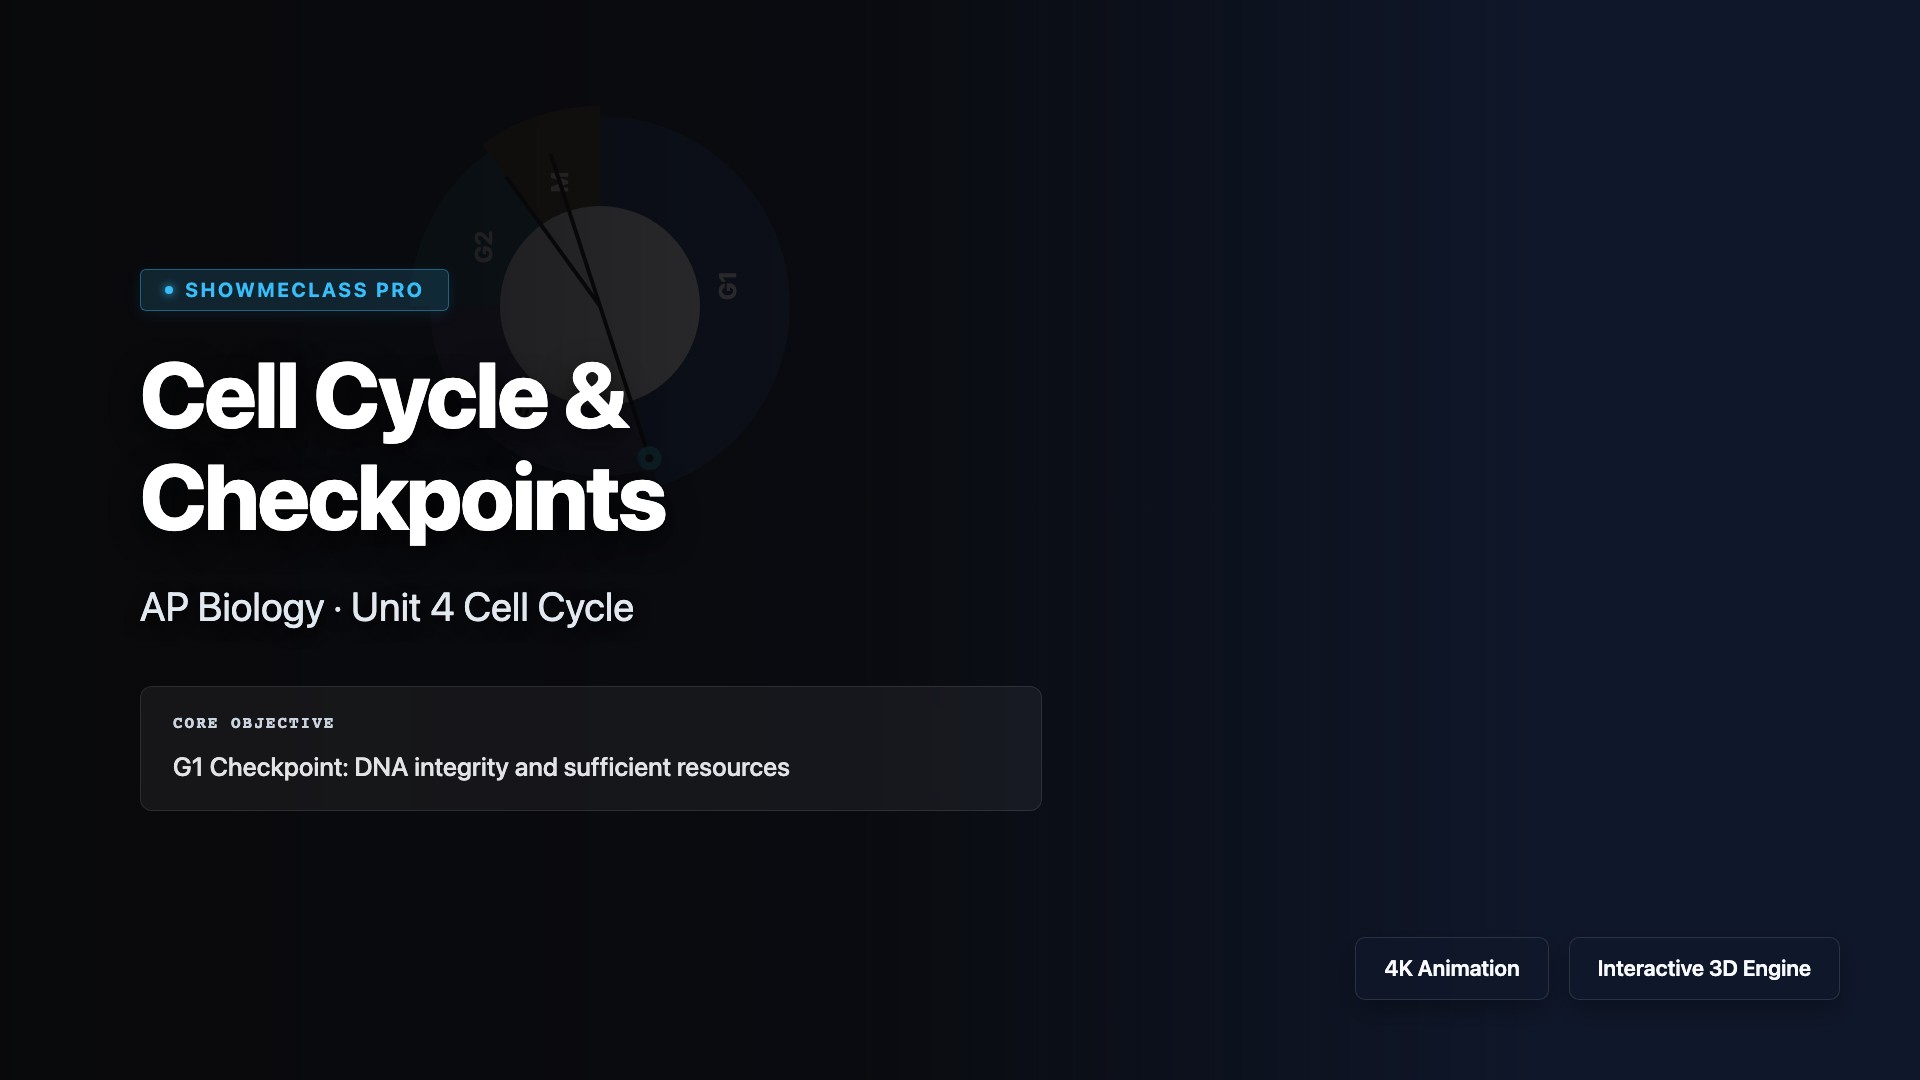
Cell Cycle & Checkpoints
Trace the cell cycle through Interphase and Mitosis. Mutate p53 tumor suppressors to bypass checkpoints, visualizing how unregulated division leads directly to cancer.
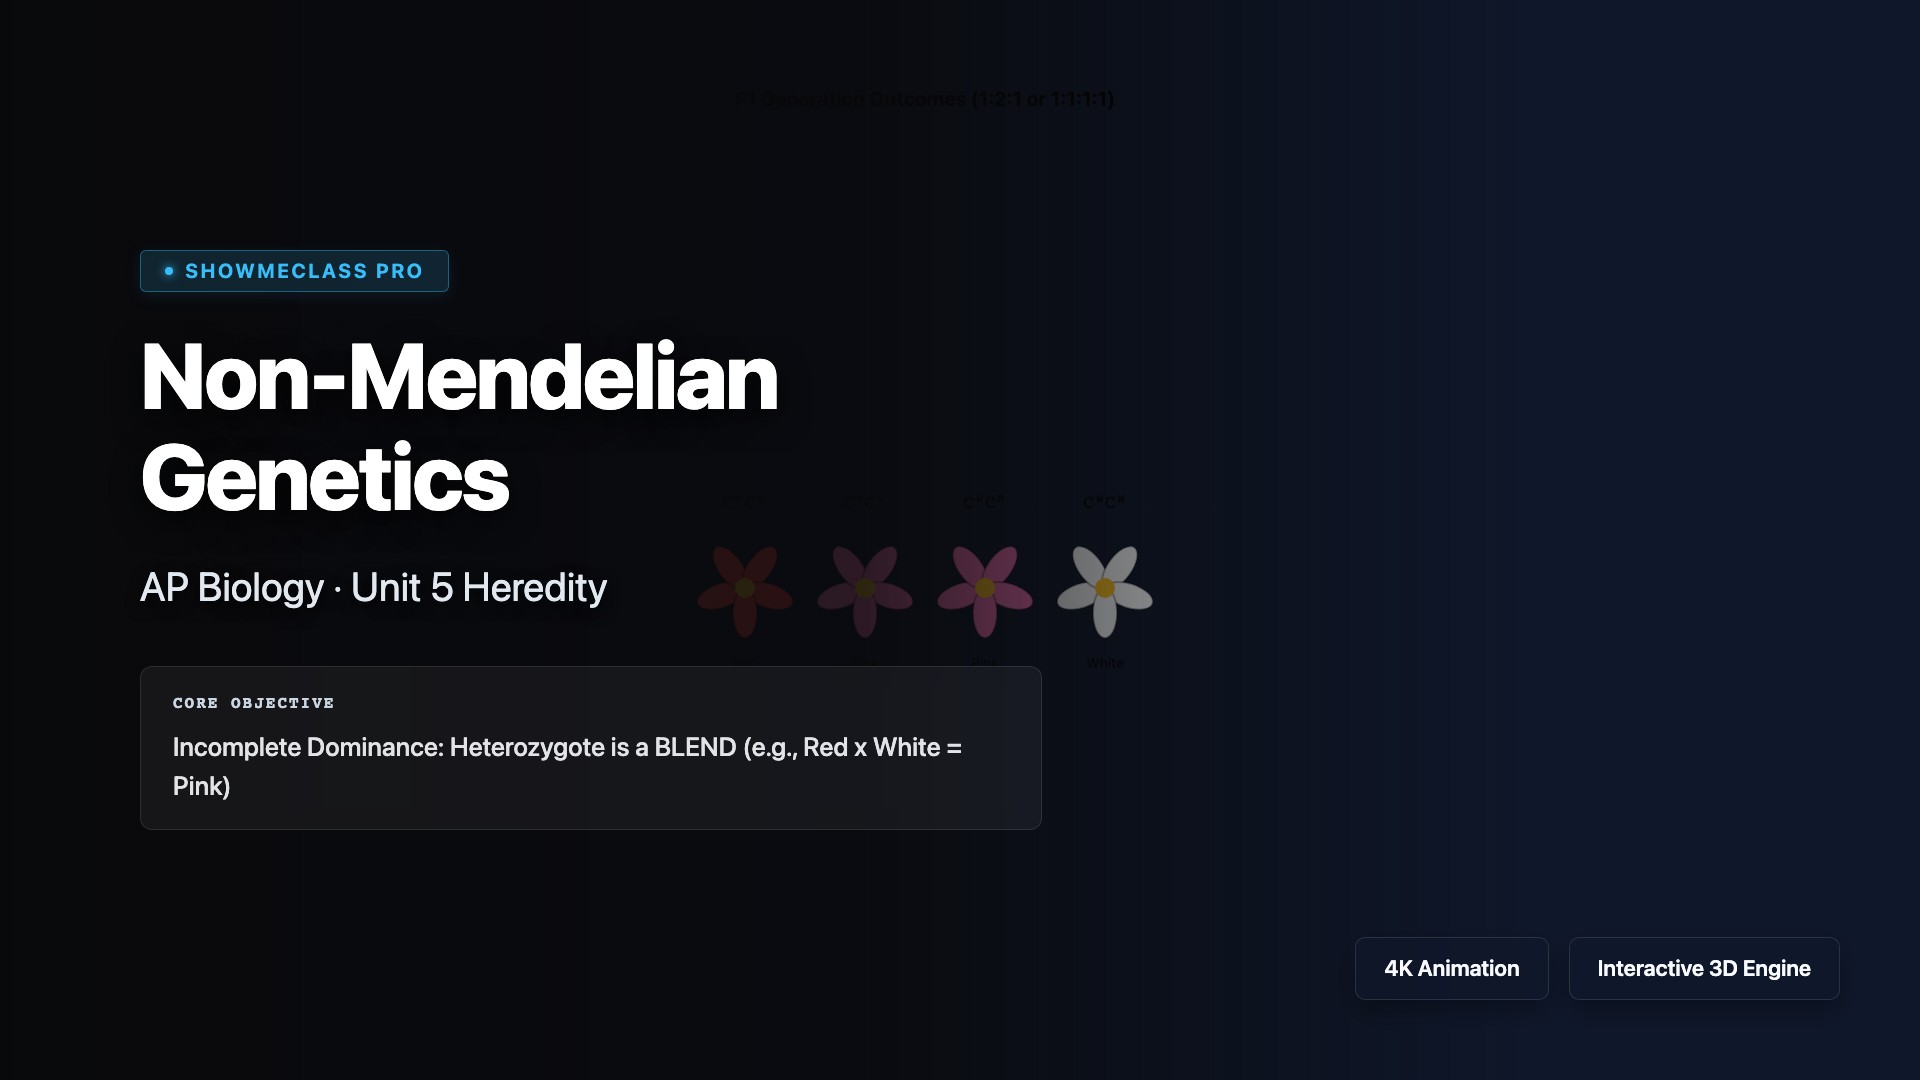
Non-Mendelian Genetics
Interactive Punnett Squares detailing Incomplete Dominance (Pink Flowers), Codominance (Roan Cattle), and Multiple Alleles (ABO Blood Types).
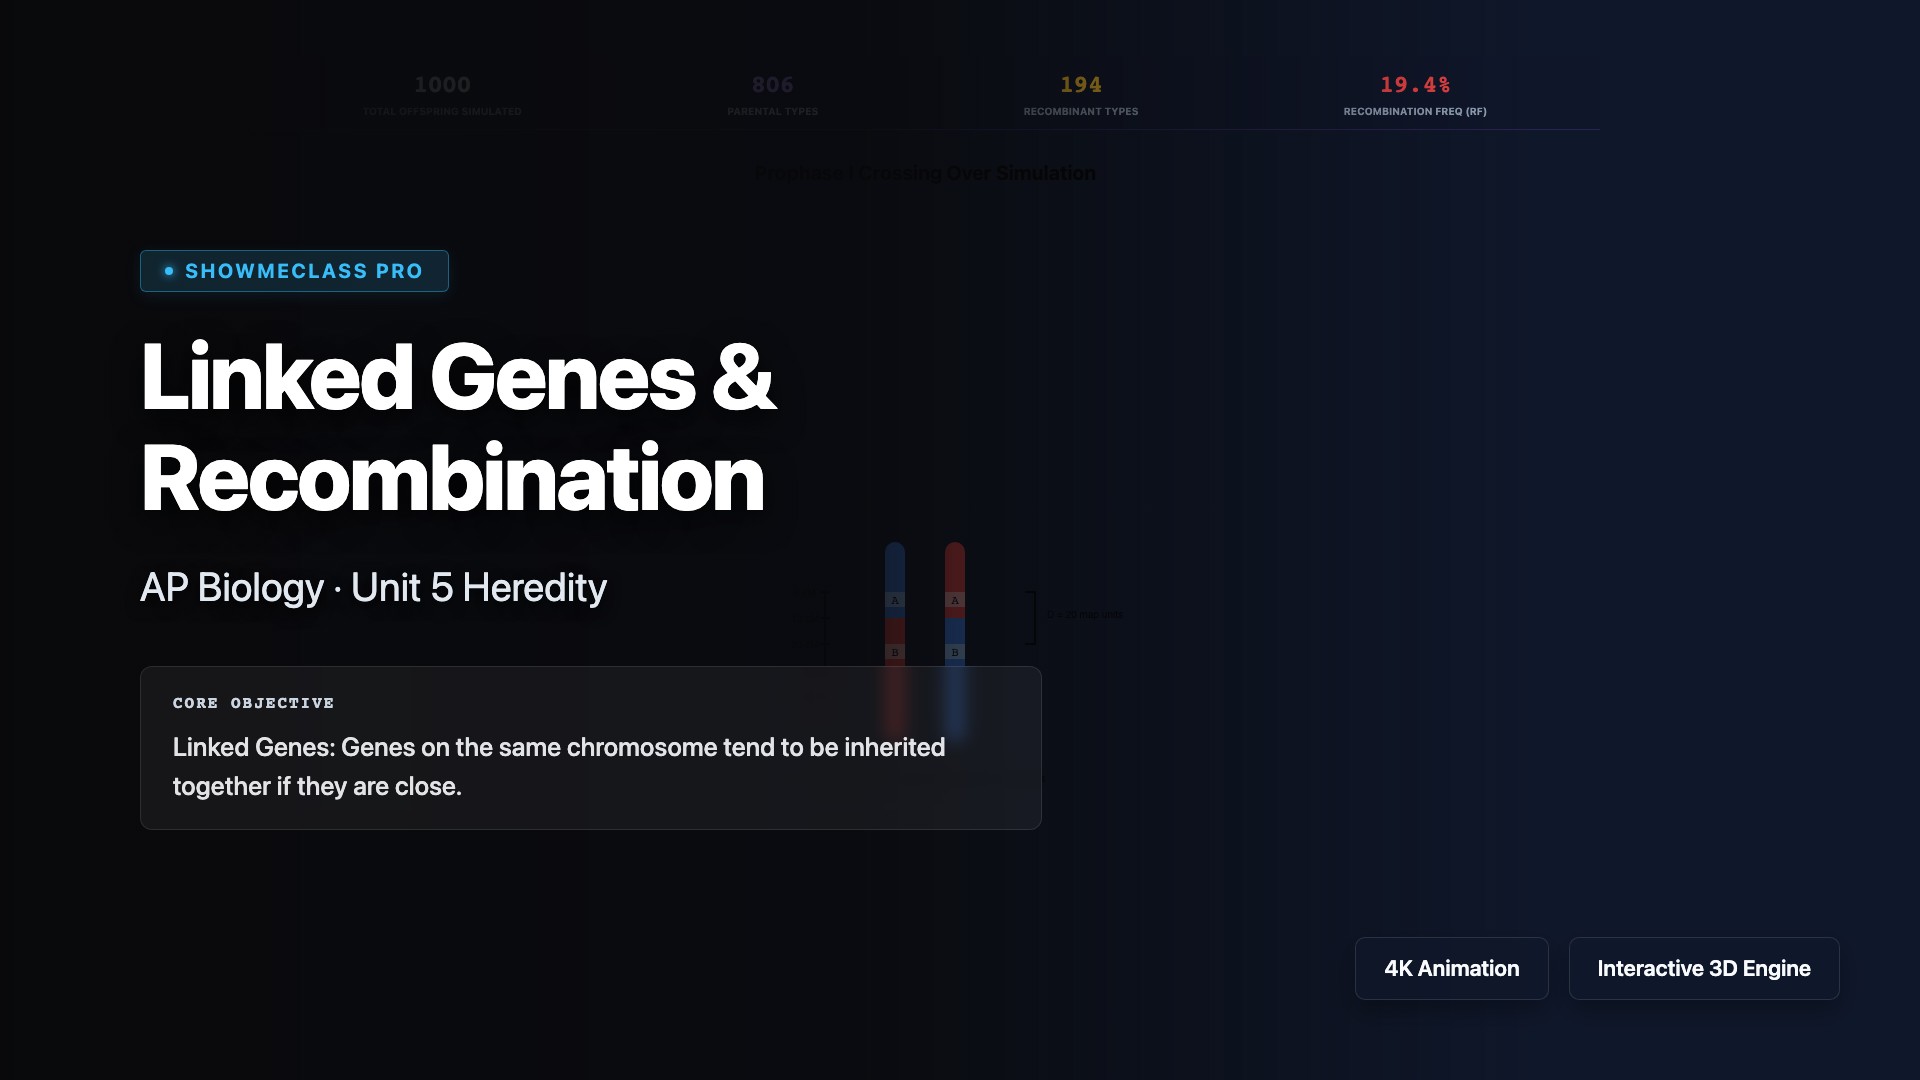
Linked Genes & Recombination
Adjust the physical map units between two genes to observe the dynamic probability of Prophase I crossing over and mathematically predict offspring Recombination Frequency.
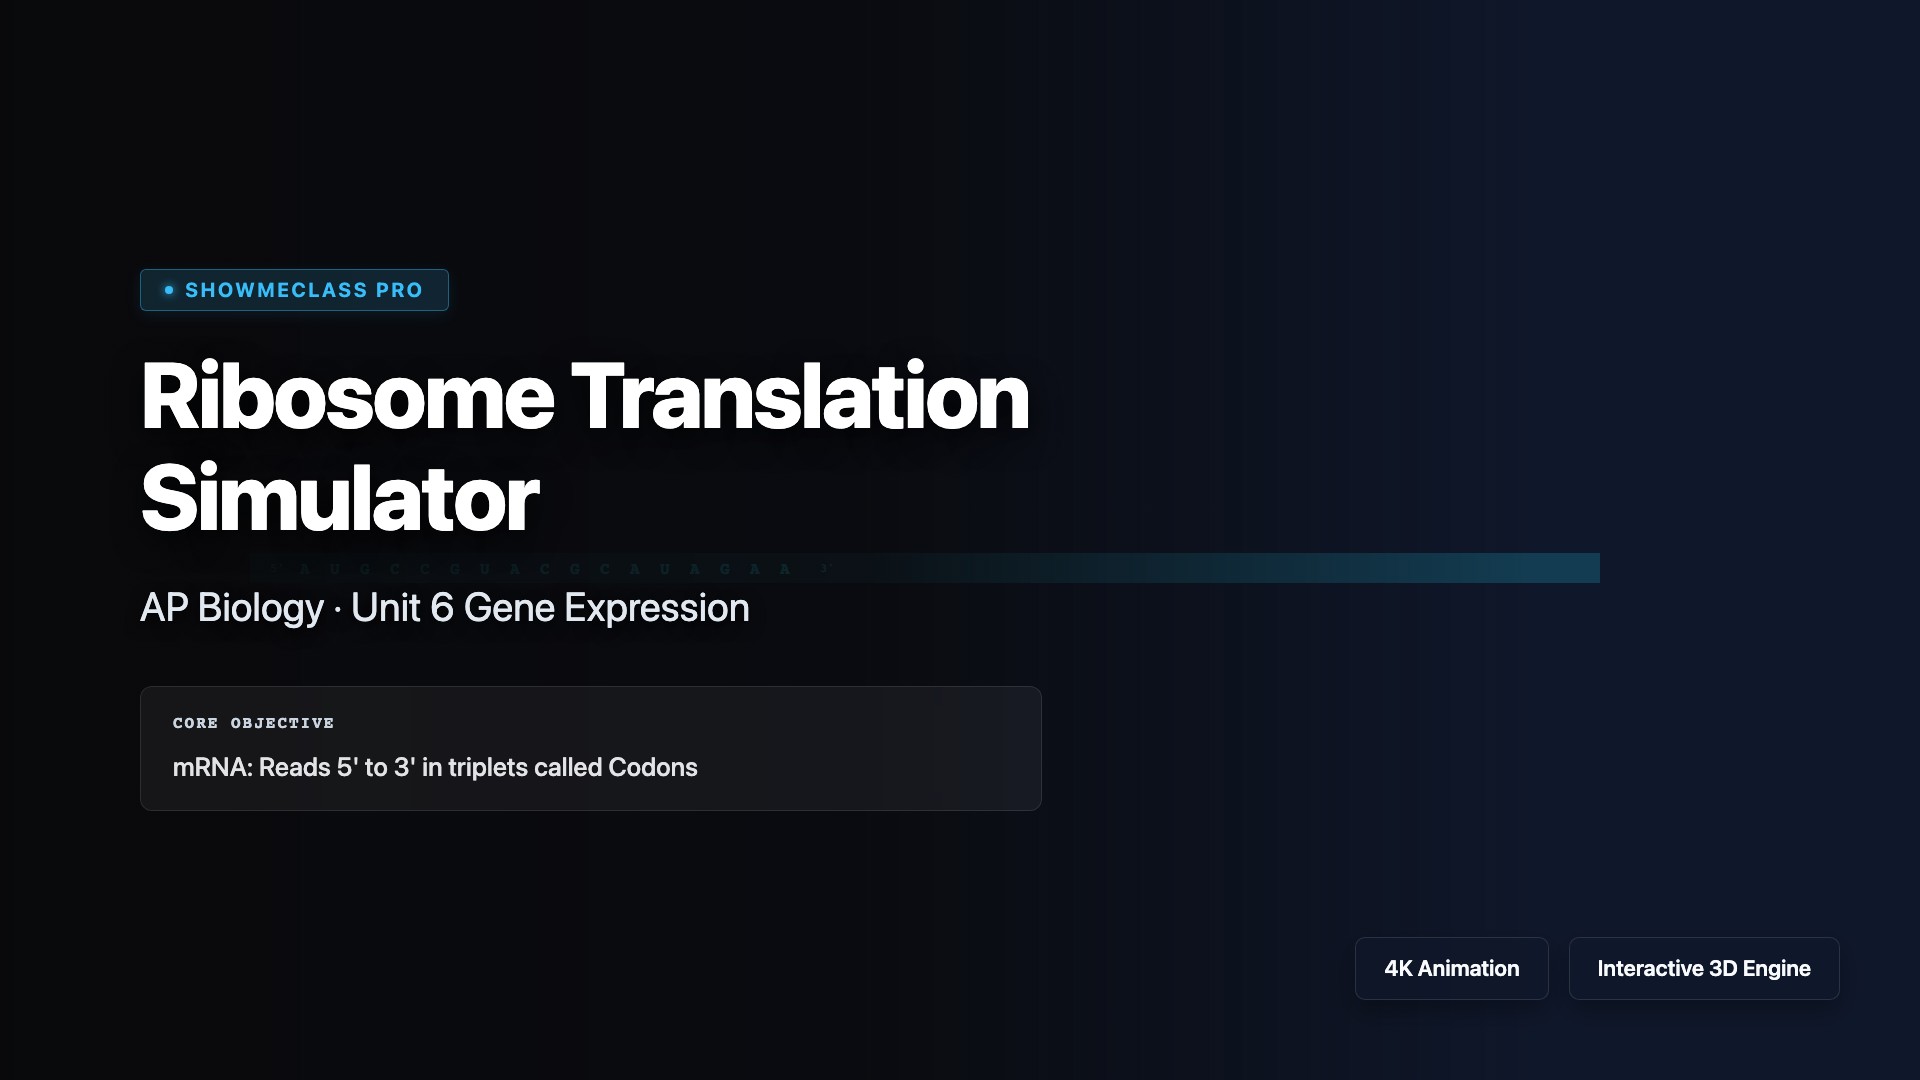
Ribosome Translation Simulator
Step through translation: Small/Large ribosomal subunit assembly, A/P/E site tRNA translocation, peptide bond formation, and termination at a STOP codon.
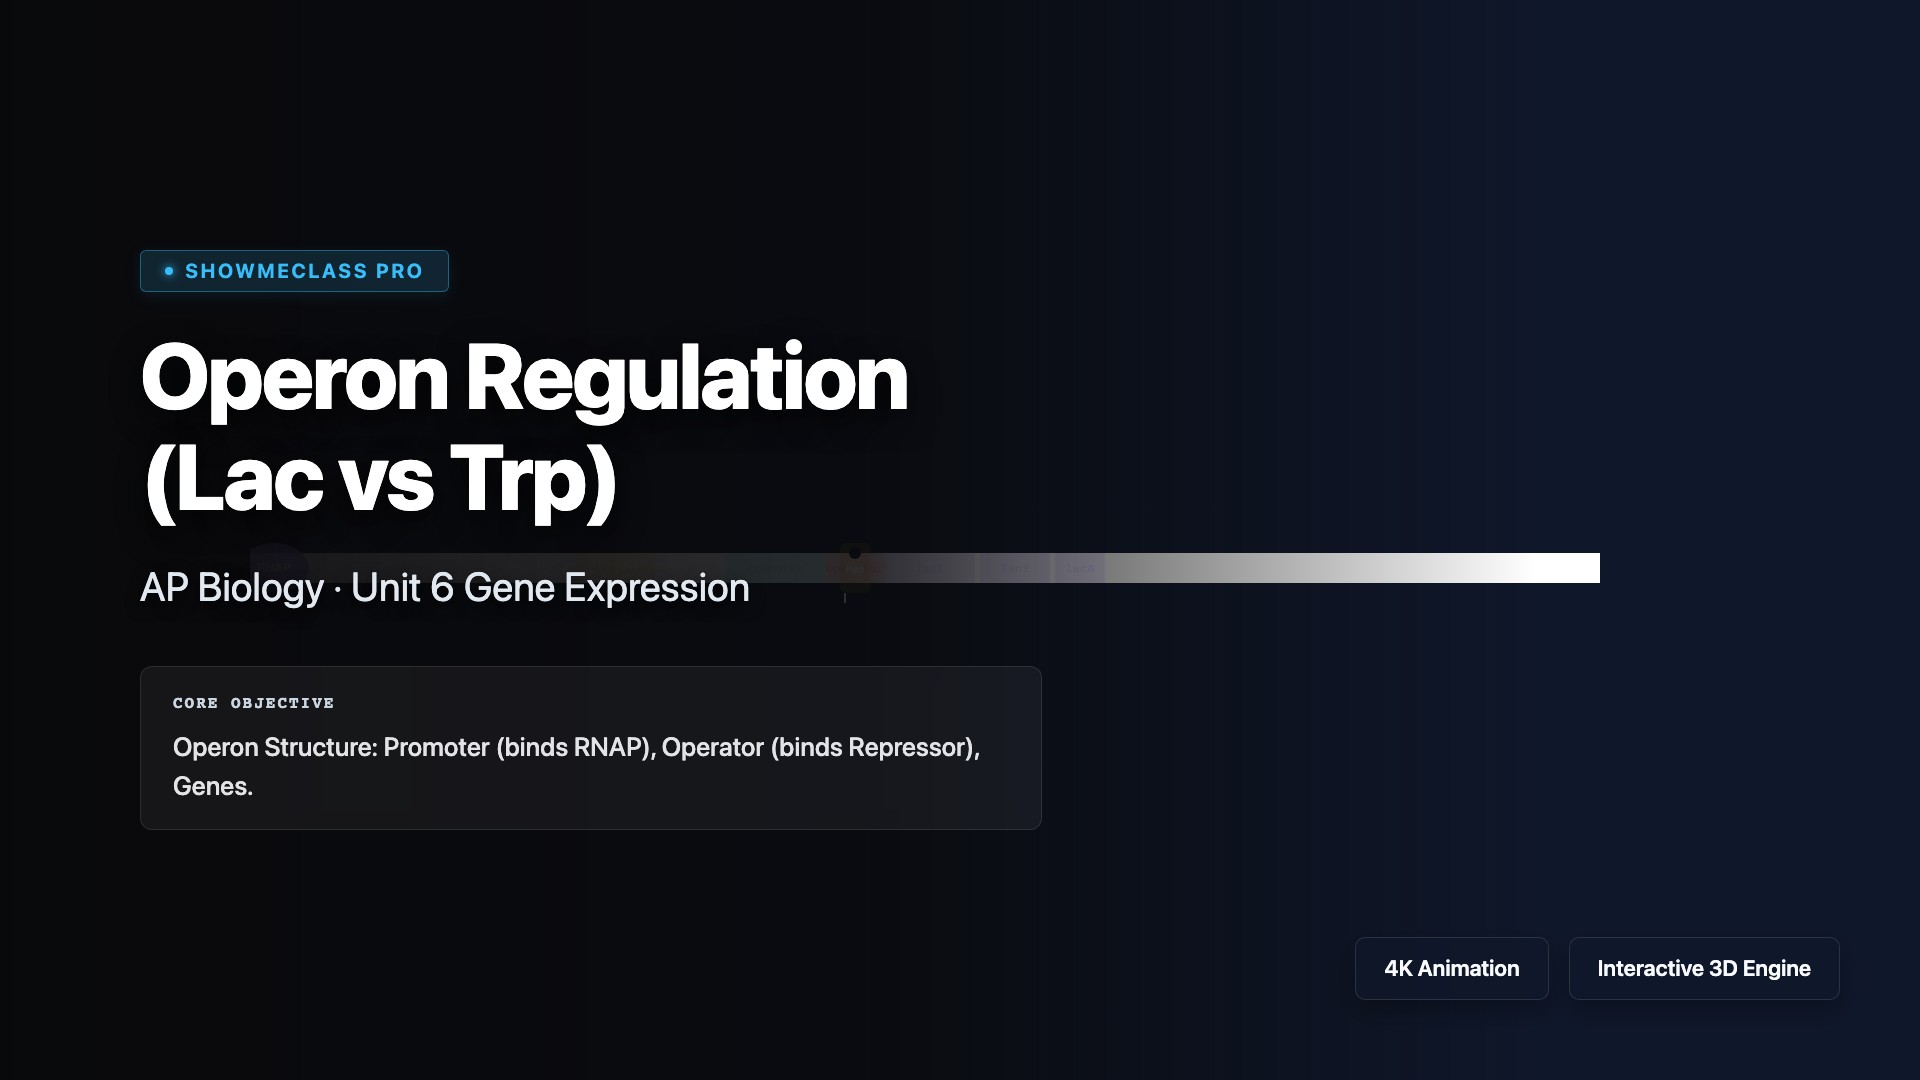
Operon Regulation (Lac vs Trp)
Compare Inducible (Lac) vs Repressible (Trp) bacterial operons. Toggle inducer/corepressor presence to observe immediate repressor conformational changes and RNAP blockage.
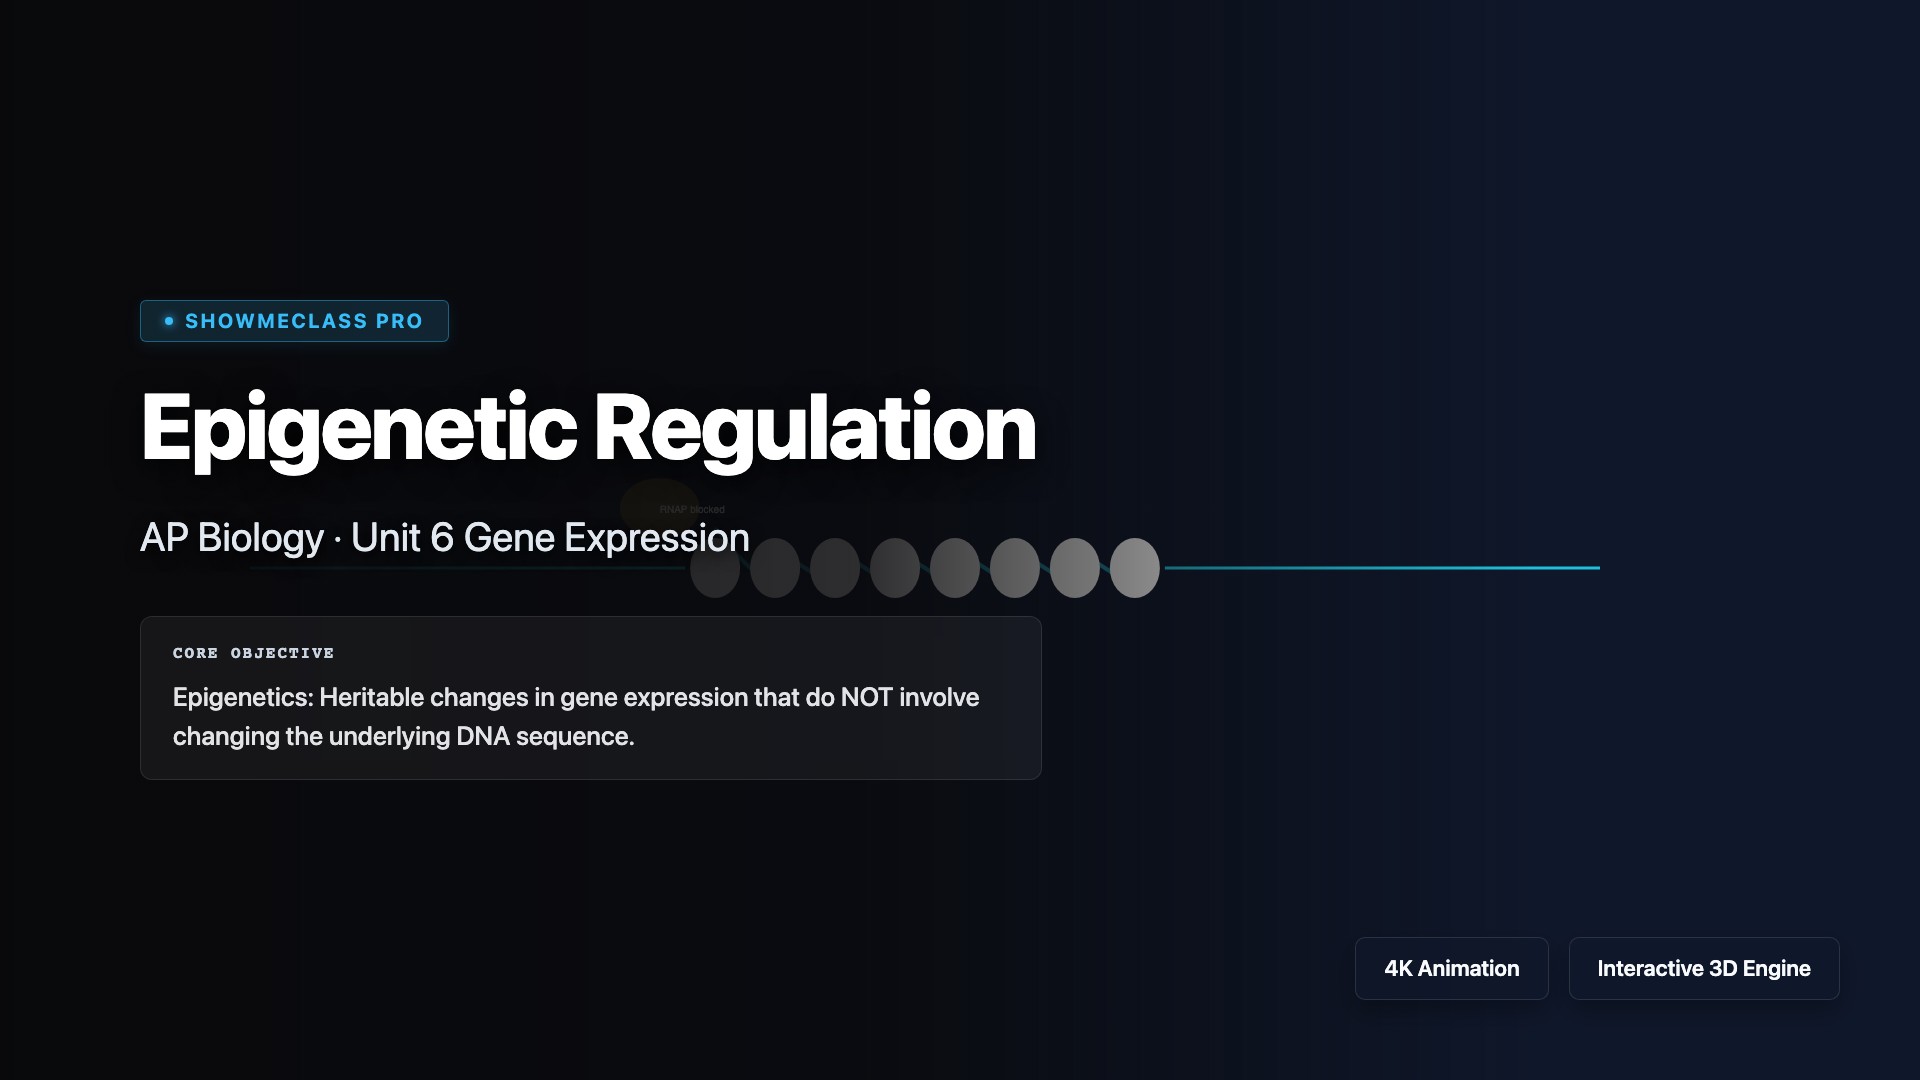
Epigenetic Regulation
Visualize how DNA Methylation tightly coils chromatin (turning genes OFF) and Histone Acetylation loosens chromatin (turning genes ON), bypassing the underlying DNA sequence.
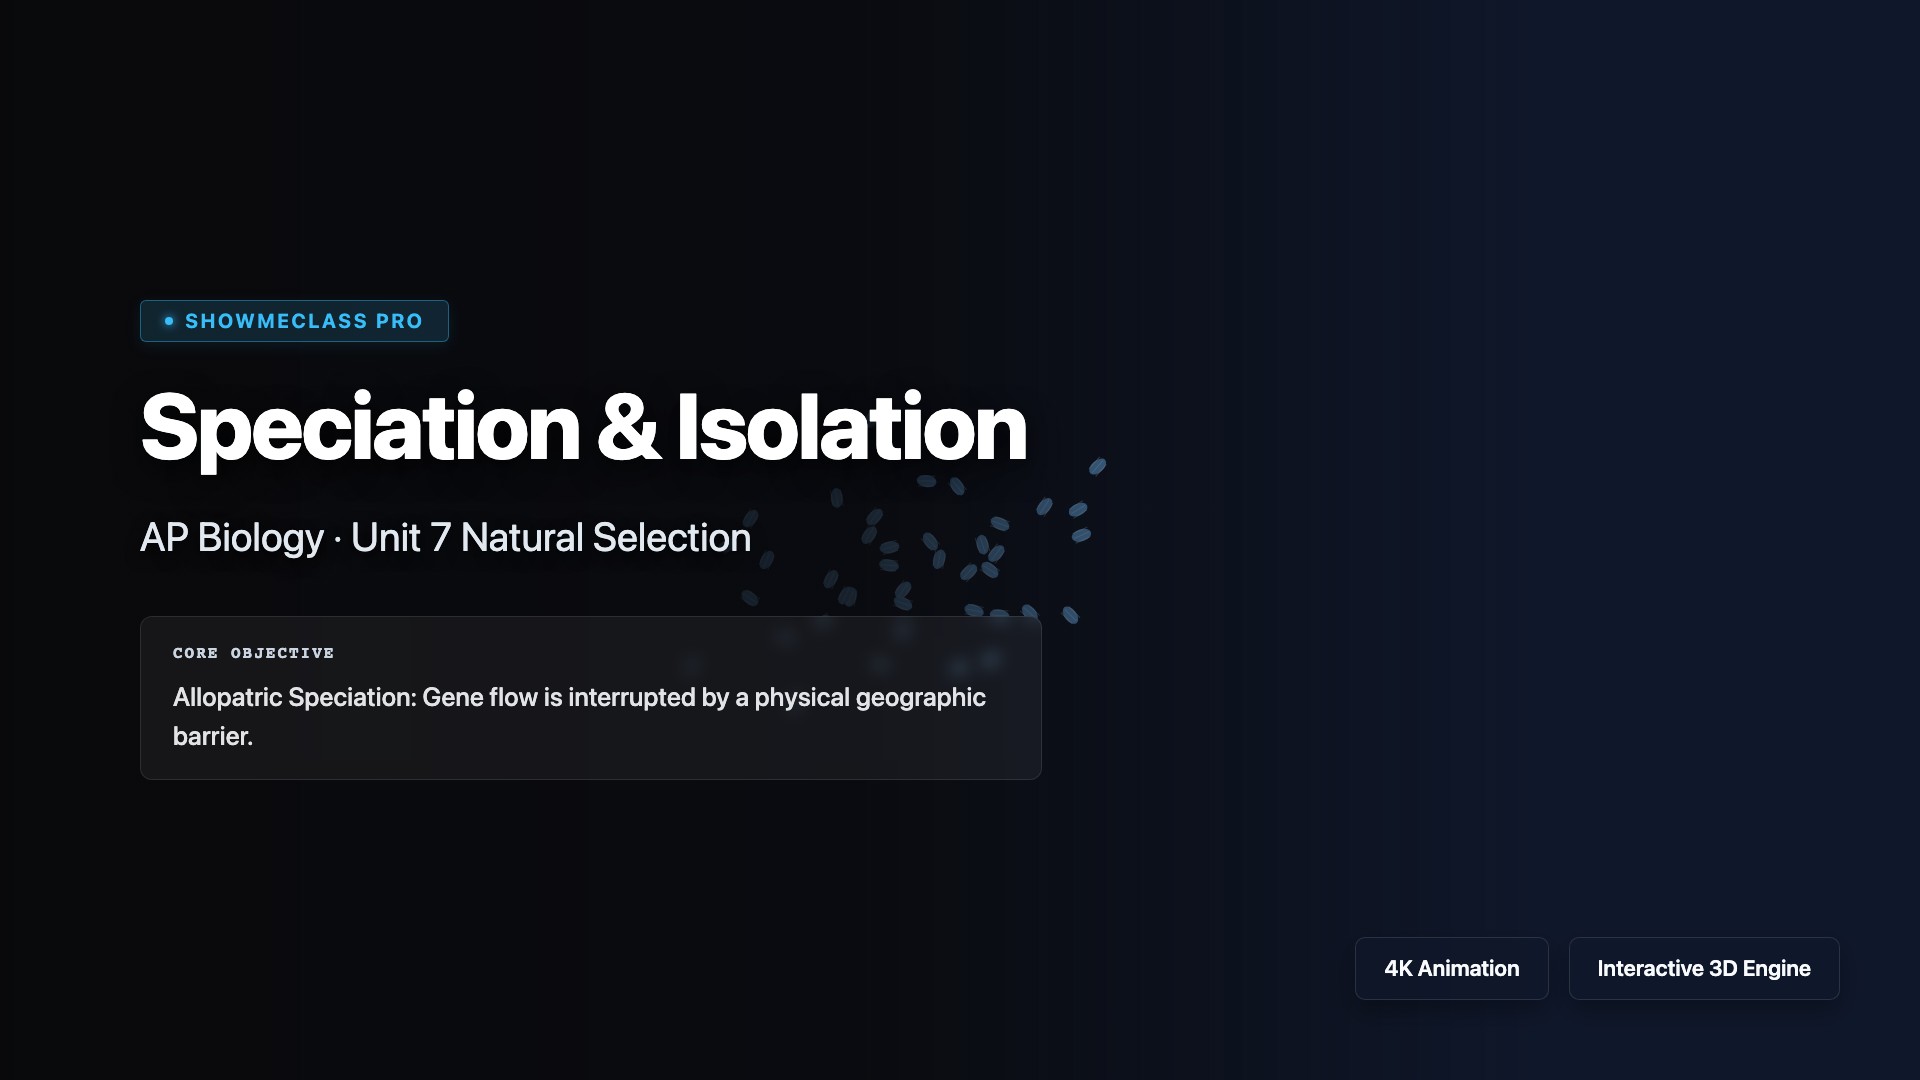
Speciation & Reproductive Isolation
Simulate populations diverging into distinct species by interrupting gene flow through Allopatric (Geographic River) or Sympatric (Polyploidy/Behavioral) isolating mechanisms.
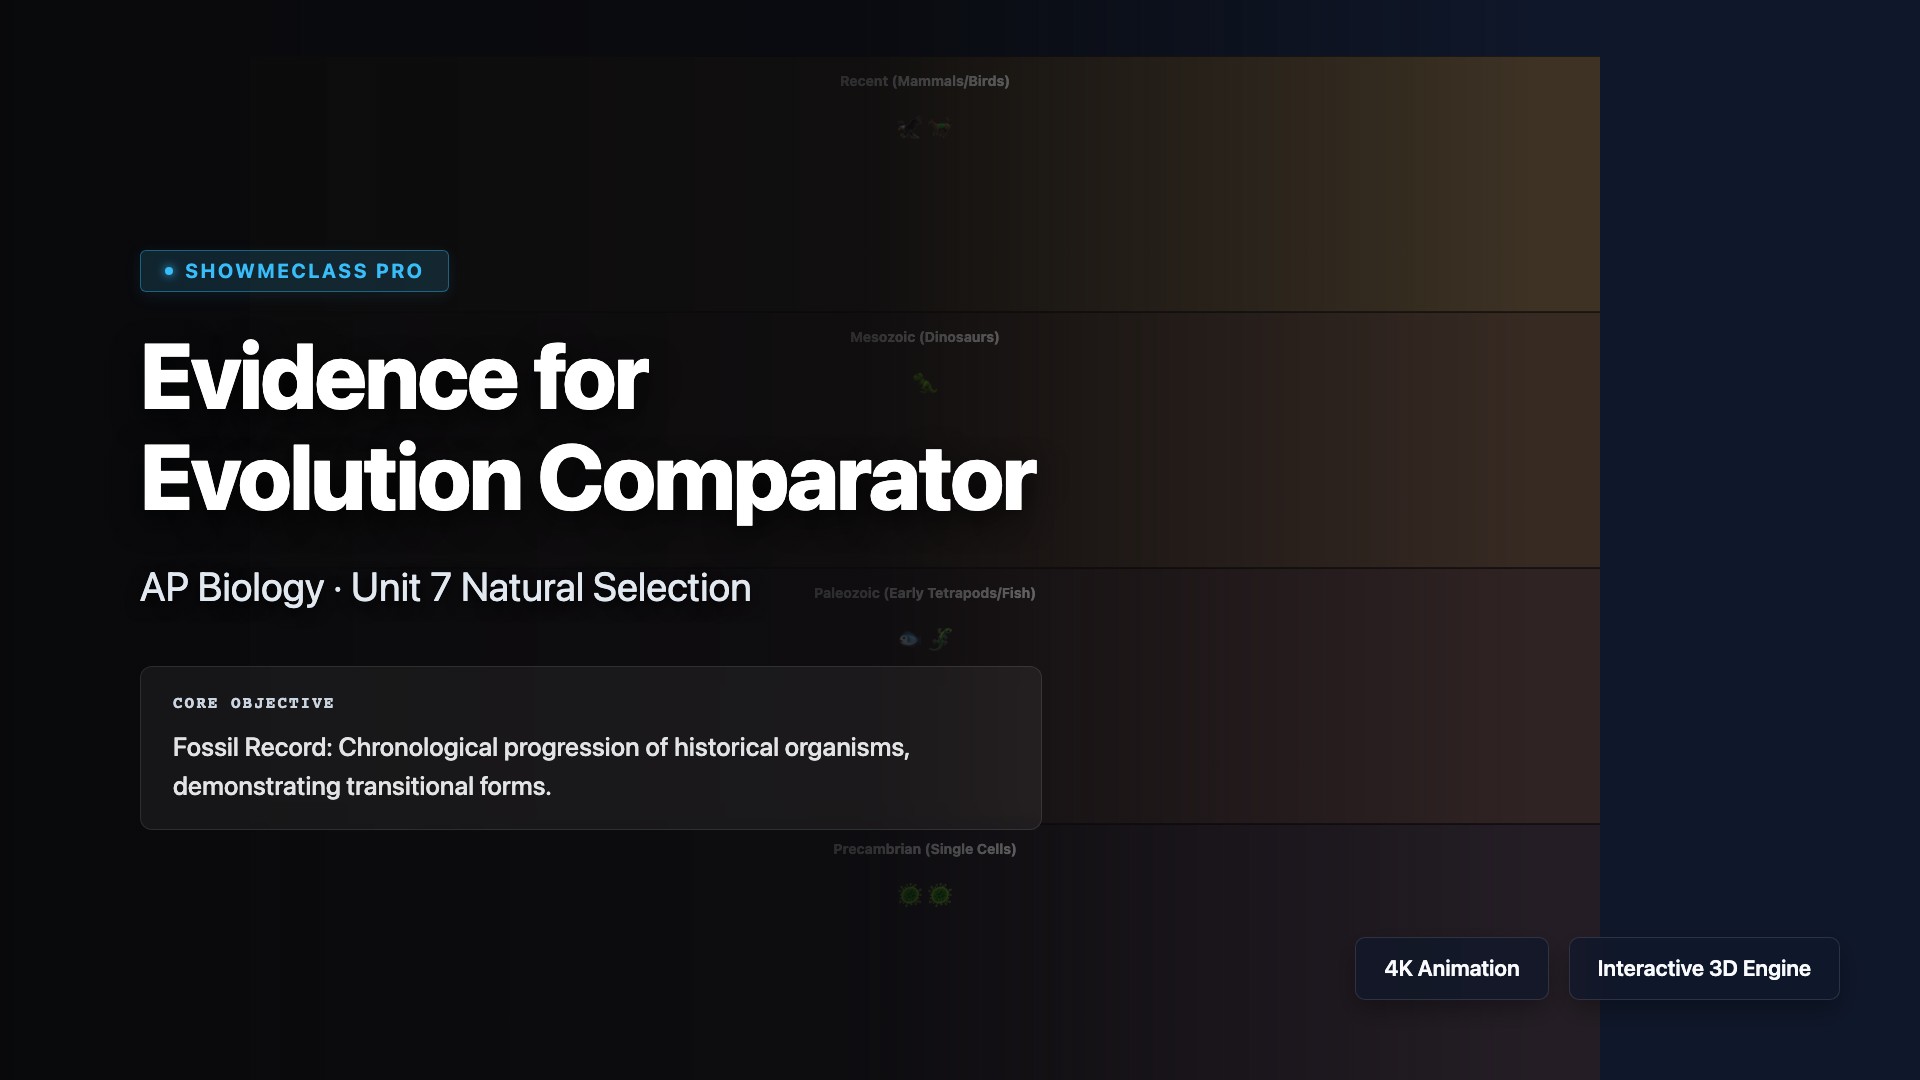
Evidence for Evolution Comparator
Compare the 3 main pillars of evolutionary evidence: Stratigraphic Fossil Progression, Bone Mapping of Homologous Structures, and Cytochrome c Amino Acid divergence.
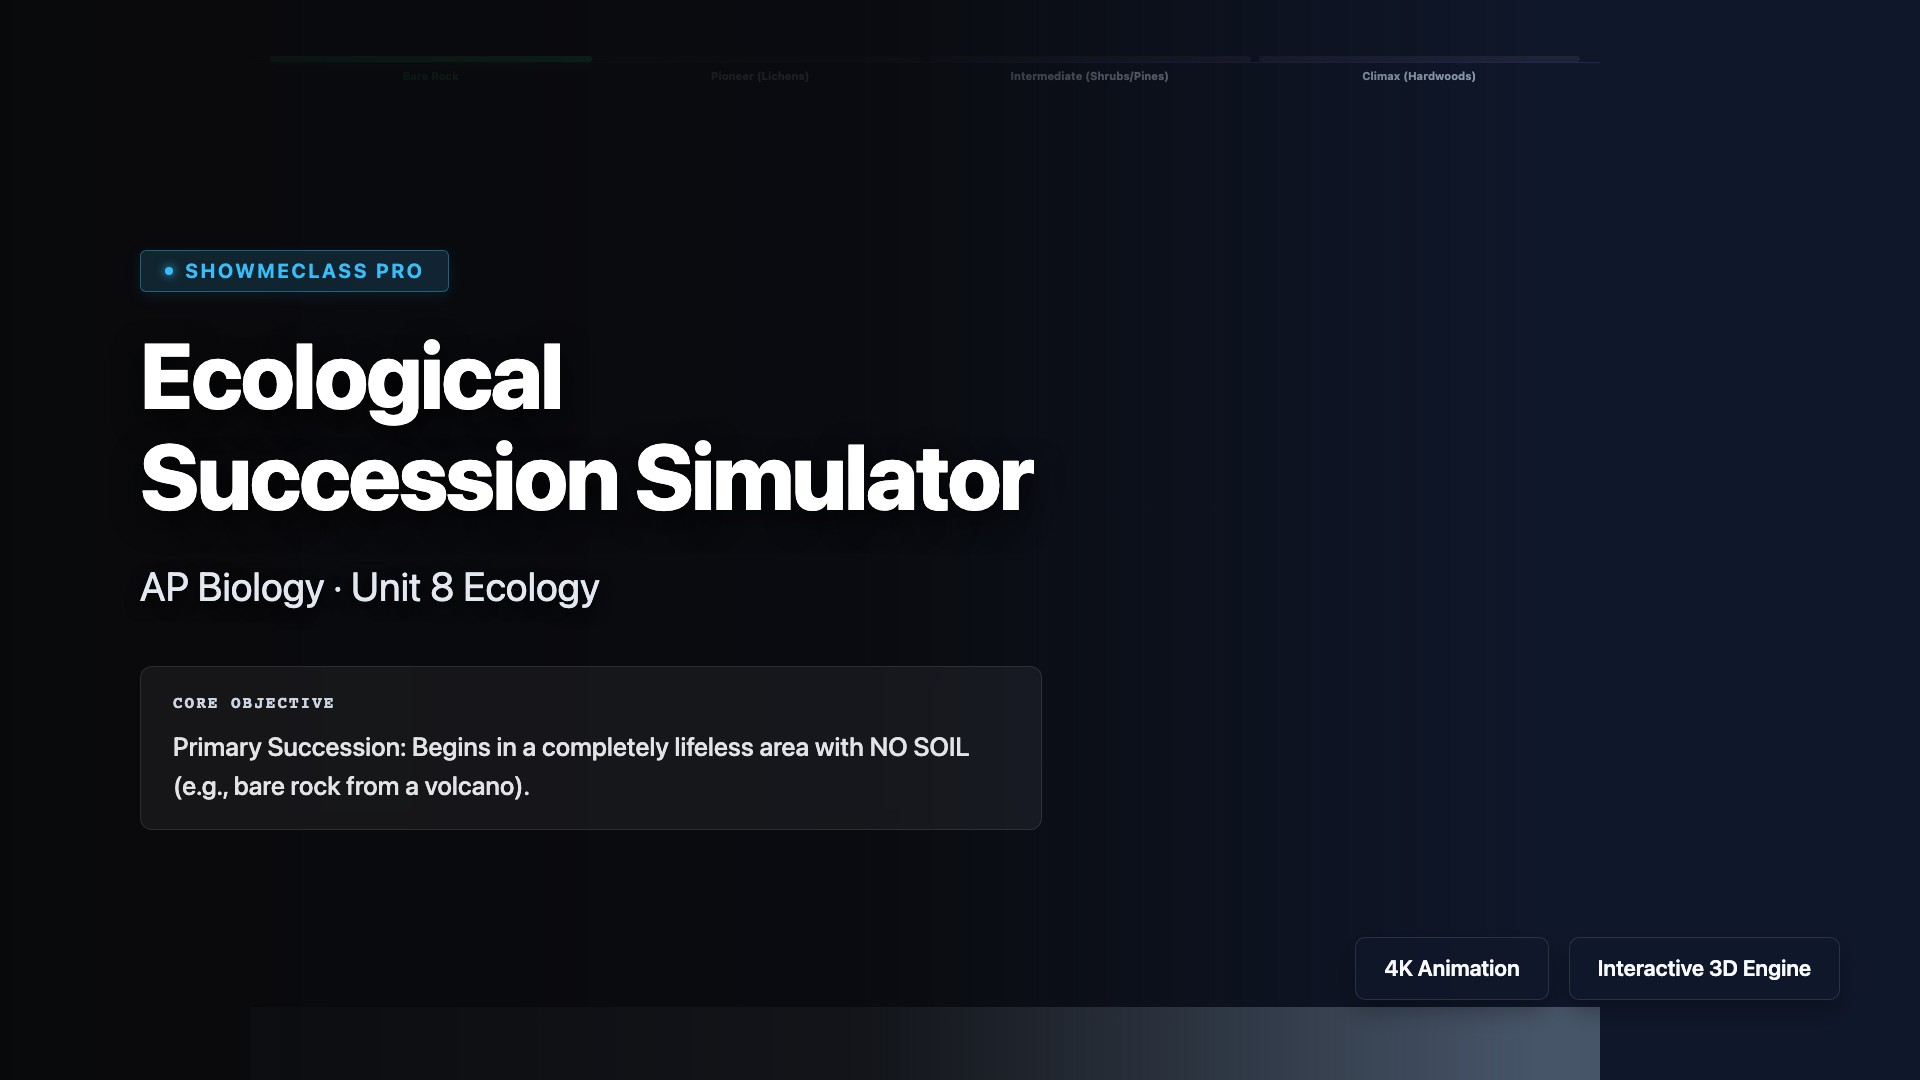
Ecological Succession Simulator
Advance a lifeless rocky landscape through Primary Succession using lichen pioneers. Trigger a catastrophic fire to demonstrate the much faster, soil-rich process of Secondary Succession.
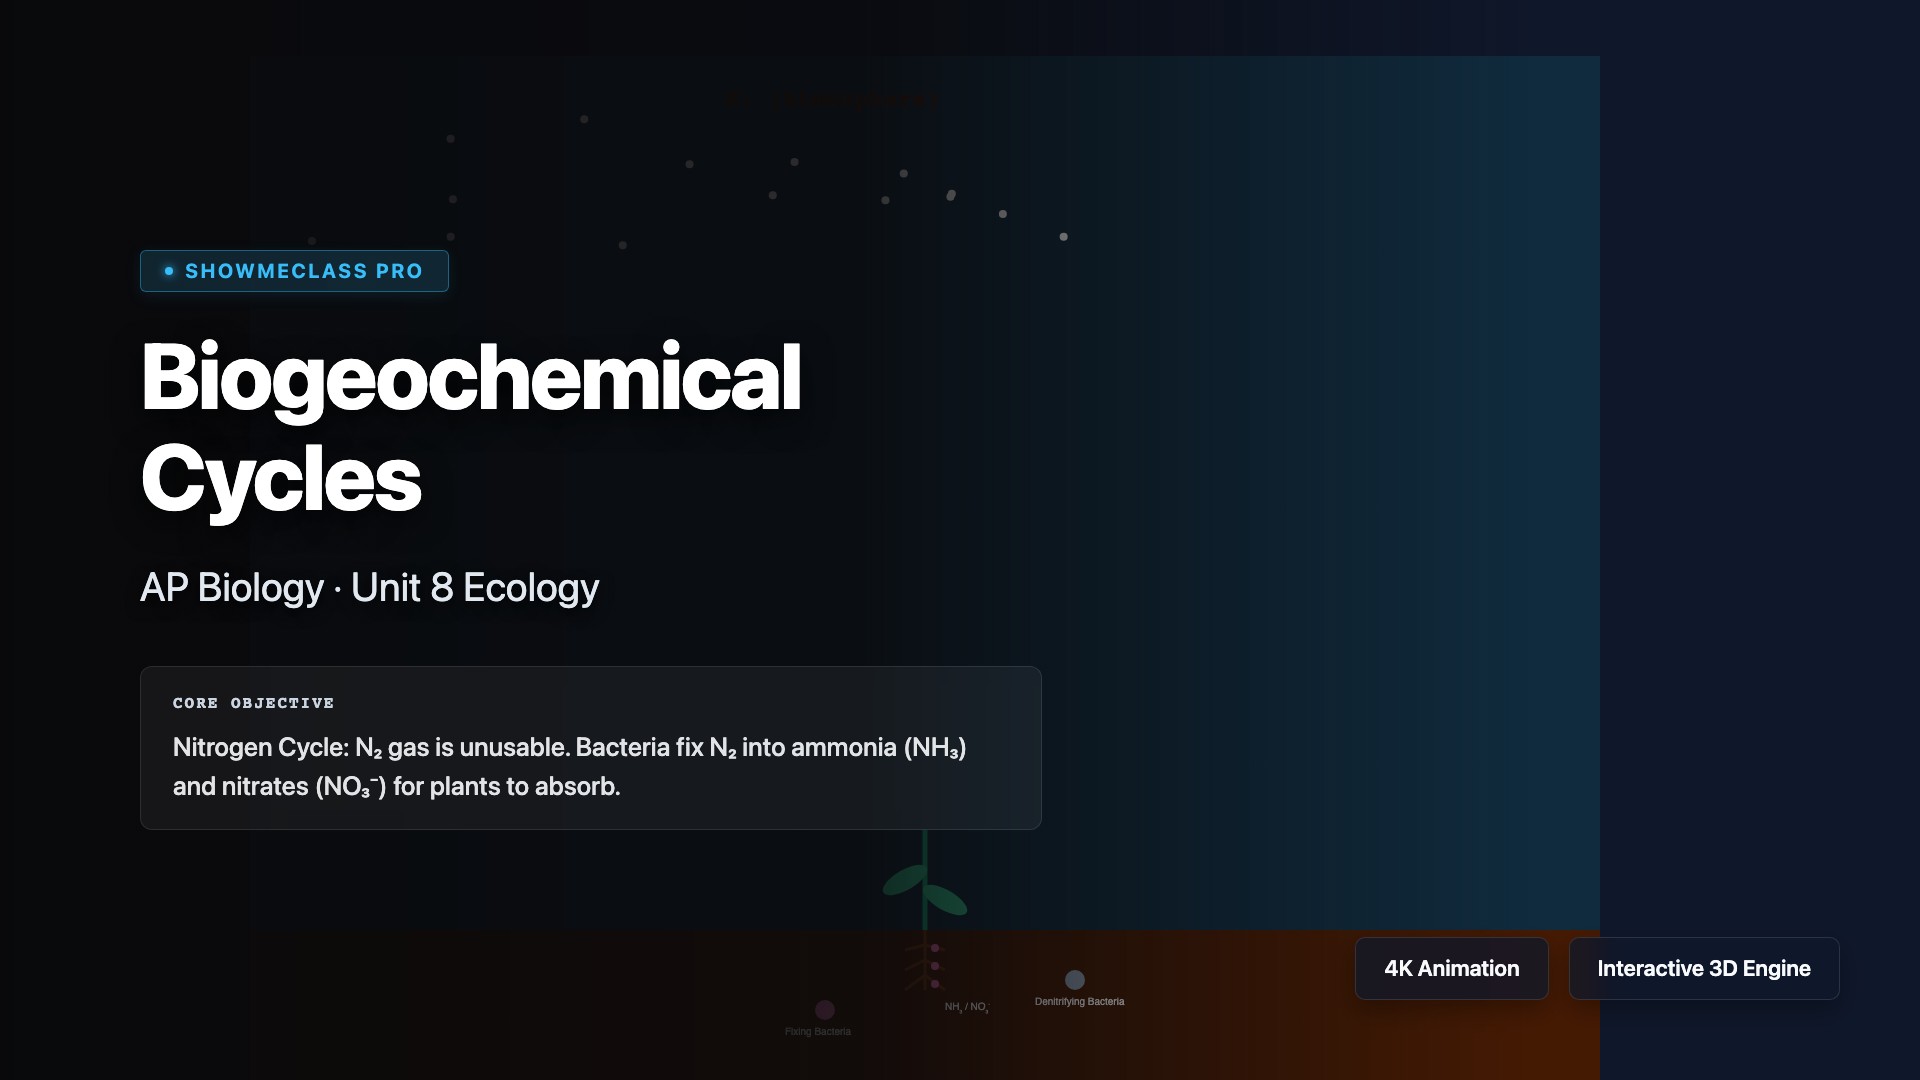
Biogeochemical Cycles (N & P)
Contrast the Nitrogen Cycle (relying entirely on root/soil bacteria to fix atmospheric N₂) against the Phosphorus Cycle (which lacks a gas phase and relies entirely on rock weathering).
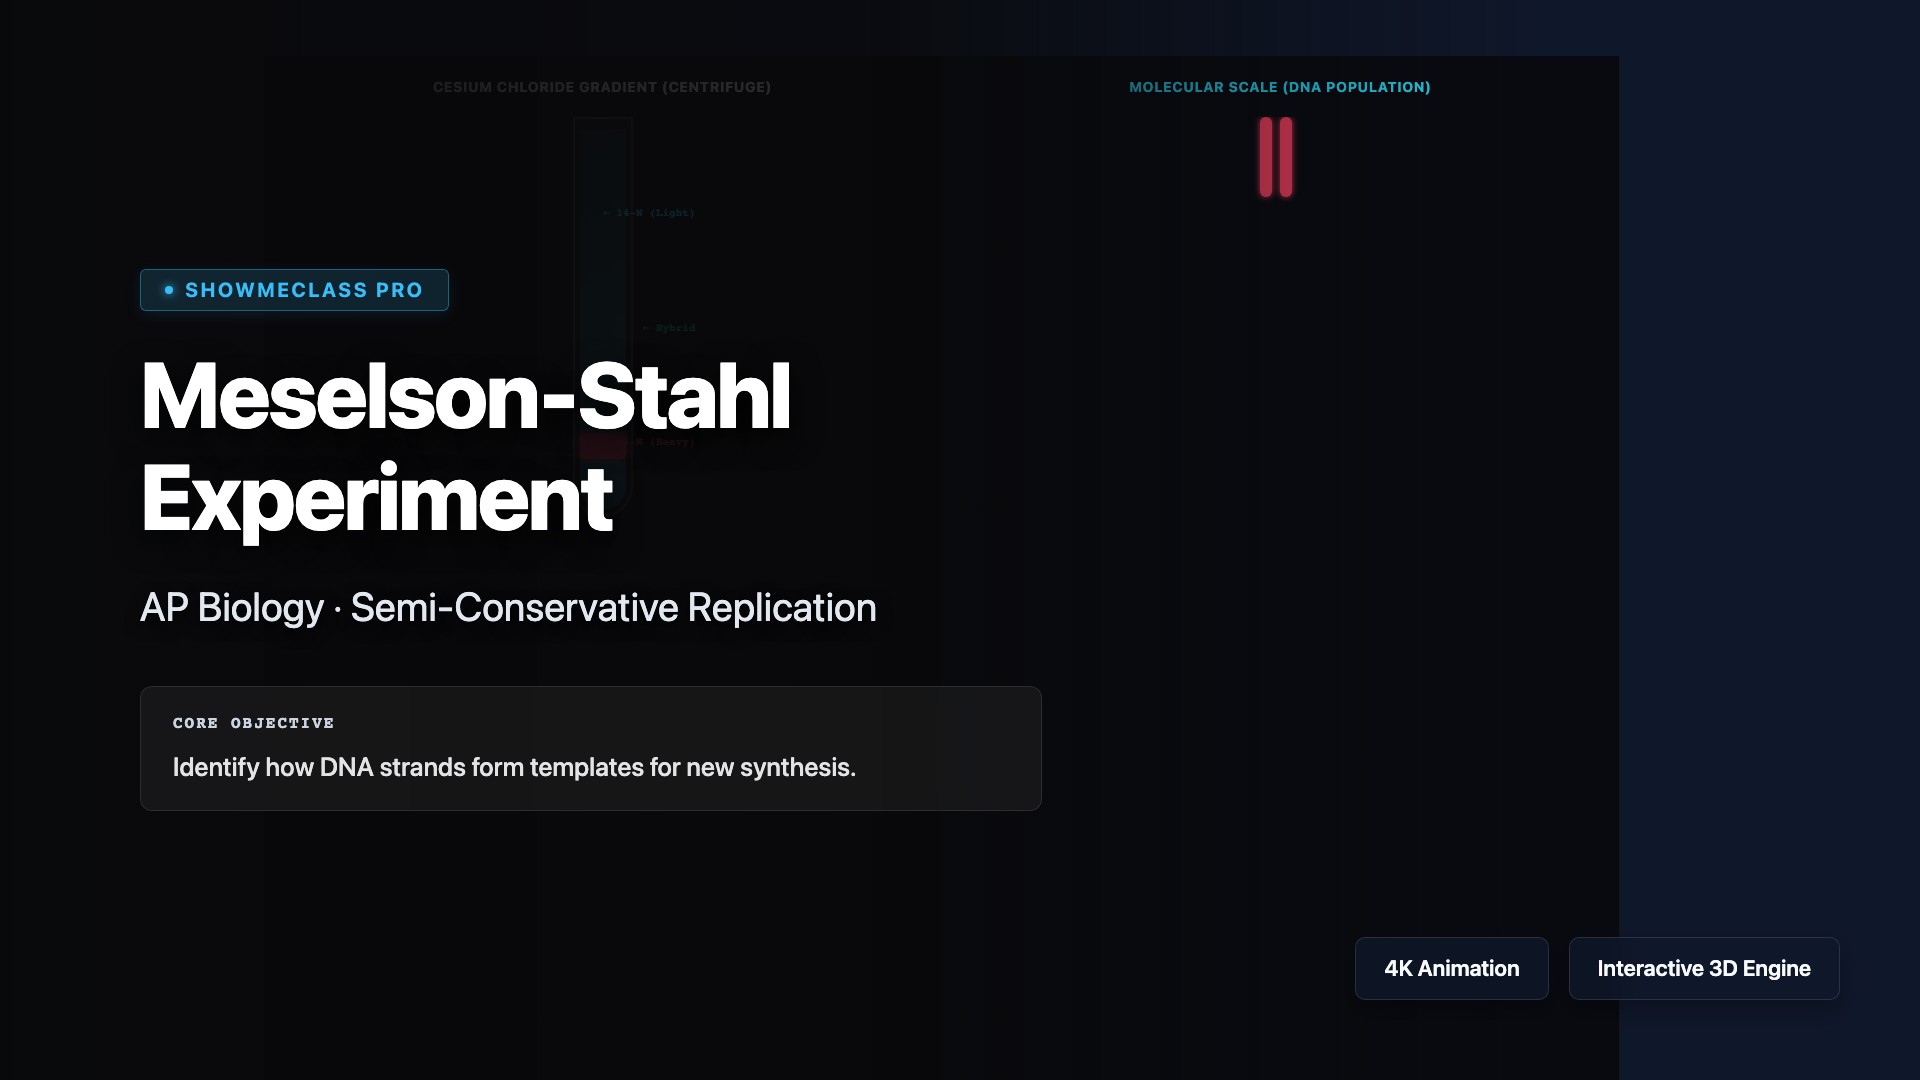
Meselson-Stahl DNA Replication
Replicate the most beautiful experiment in biology. Centrifuge radioactive nitrogen isotopes (15N vs 14N) across bacterial generations to generate heavy, hybrid, and light DNA bands proving semi-conservative replication.
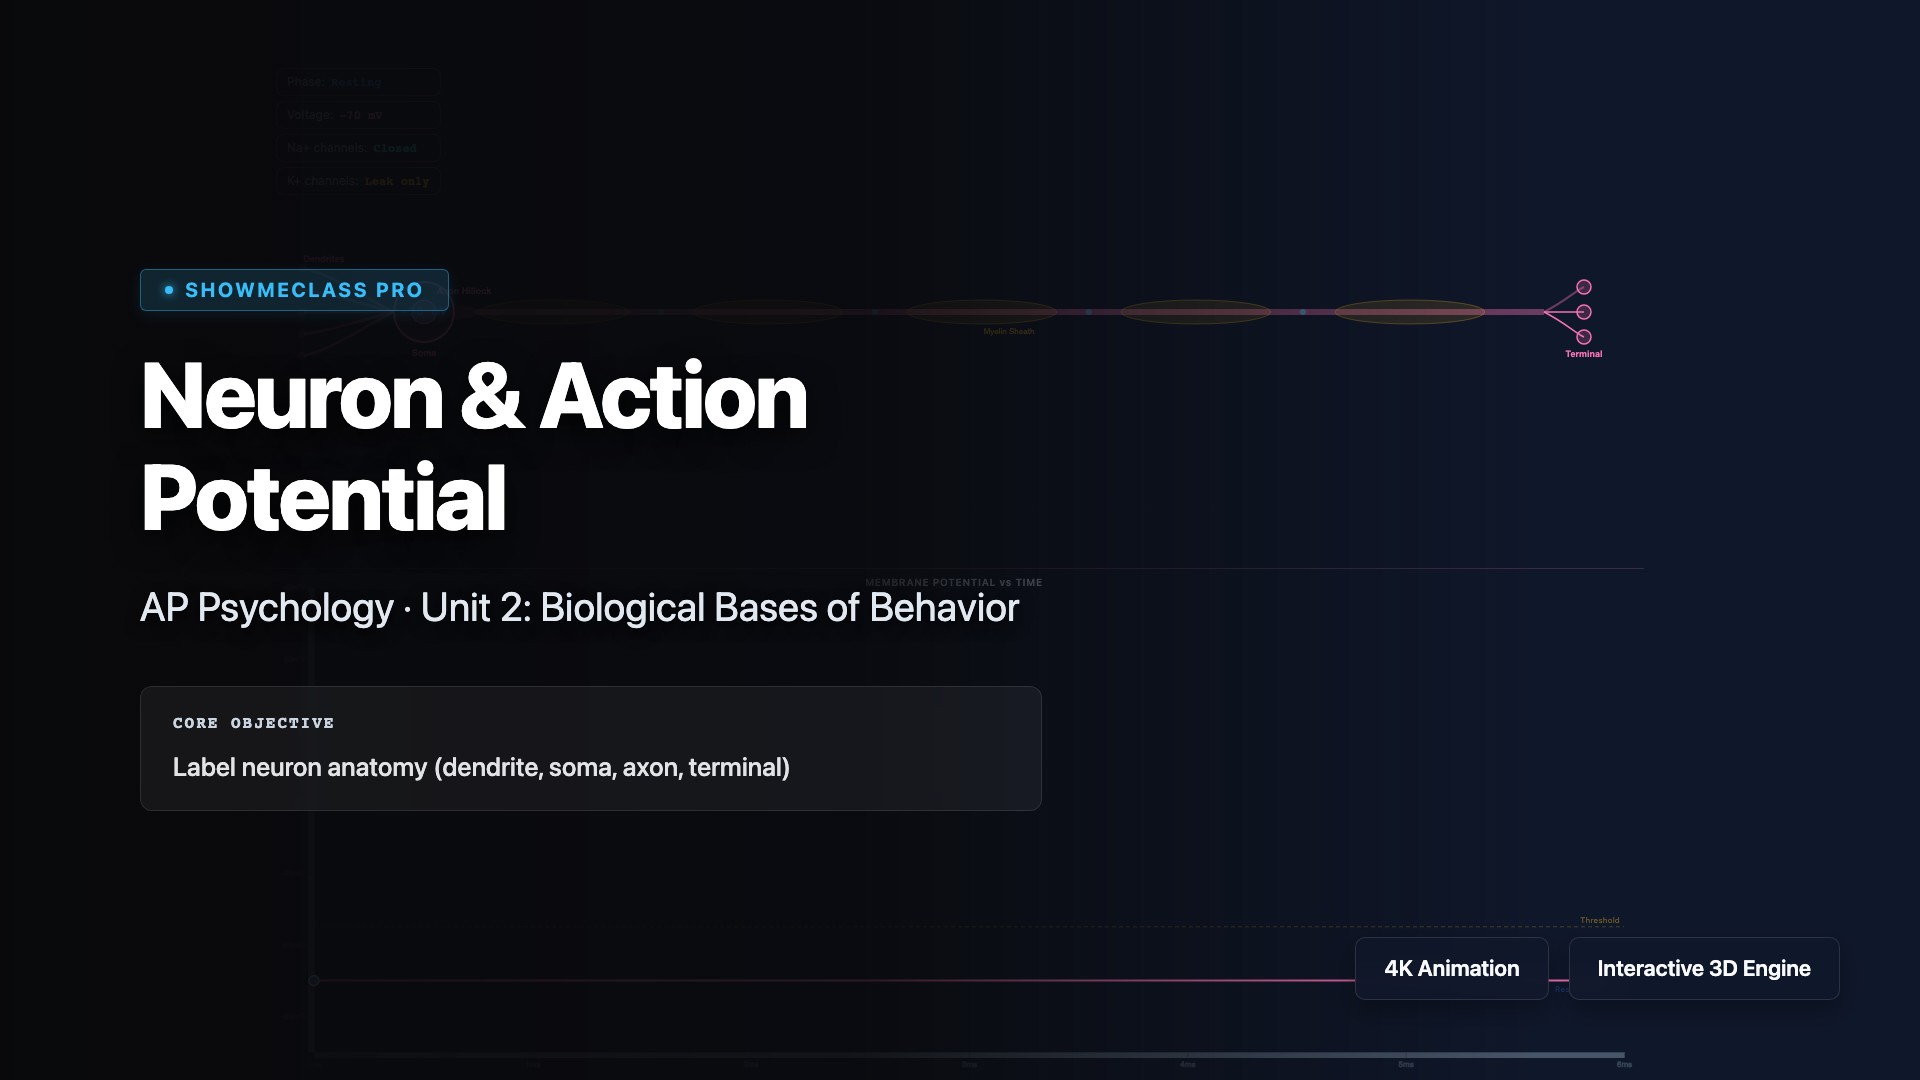
Neuron Action Potential Simulator
Trigger an electrical stimulus on a neuron and watch the membrane potential graph trace typical Depolarization, Repolarization, and Hyperpolarization phases. Track the live states of Na+ and K+ ion channels.

CRISPR-Cas9 Mechanism 3D Visualizer
Visualizes the complete CRISPR-Cas9 genome editing process, tracking PAM recognition, DNA unwinding, gRNA matching, and the double-strand break in 3D.

Lotka-Volterra Predator-Prey Dynamics
Mathematical ecology simulator charting the cyclic phase space between predators and prey. Manipulate birth/death rates to find stable orbits or extinction events.
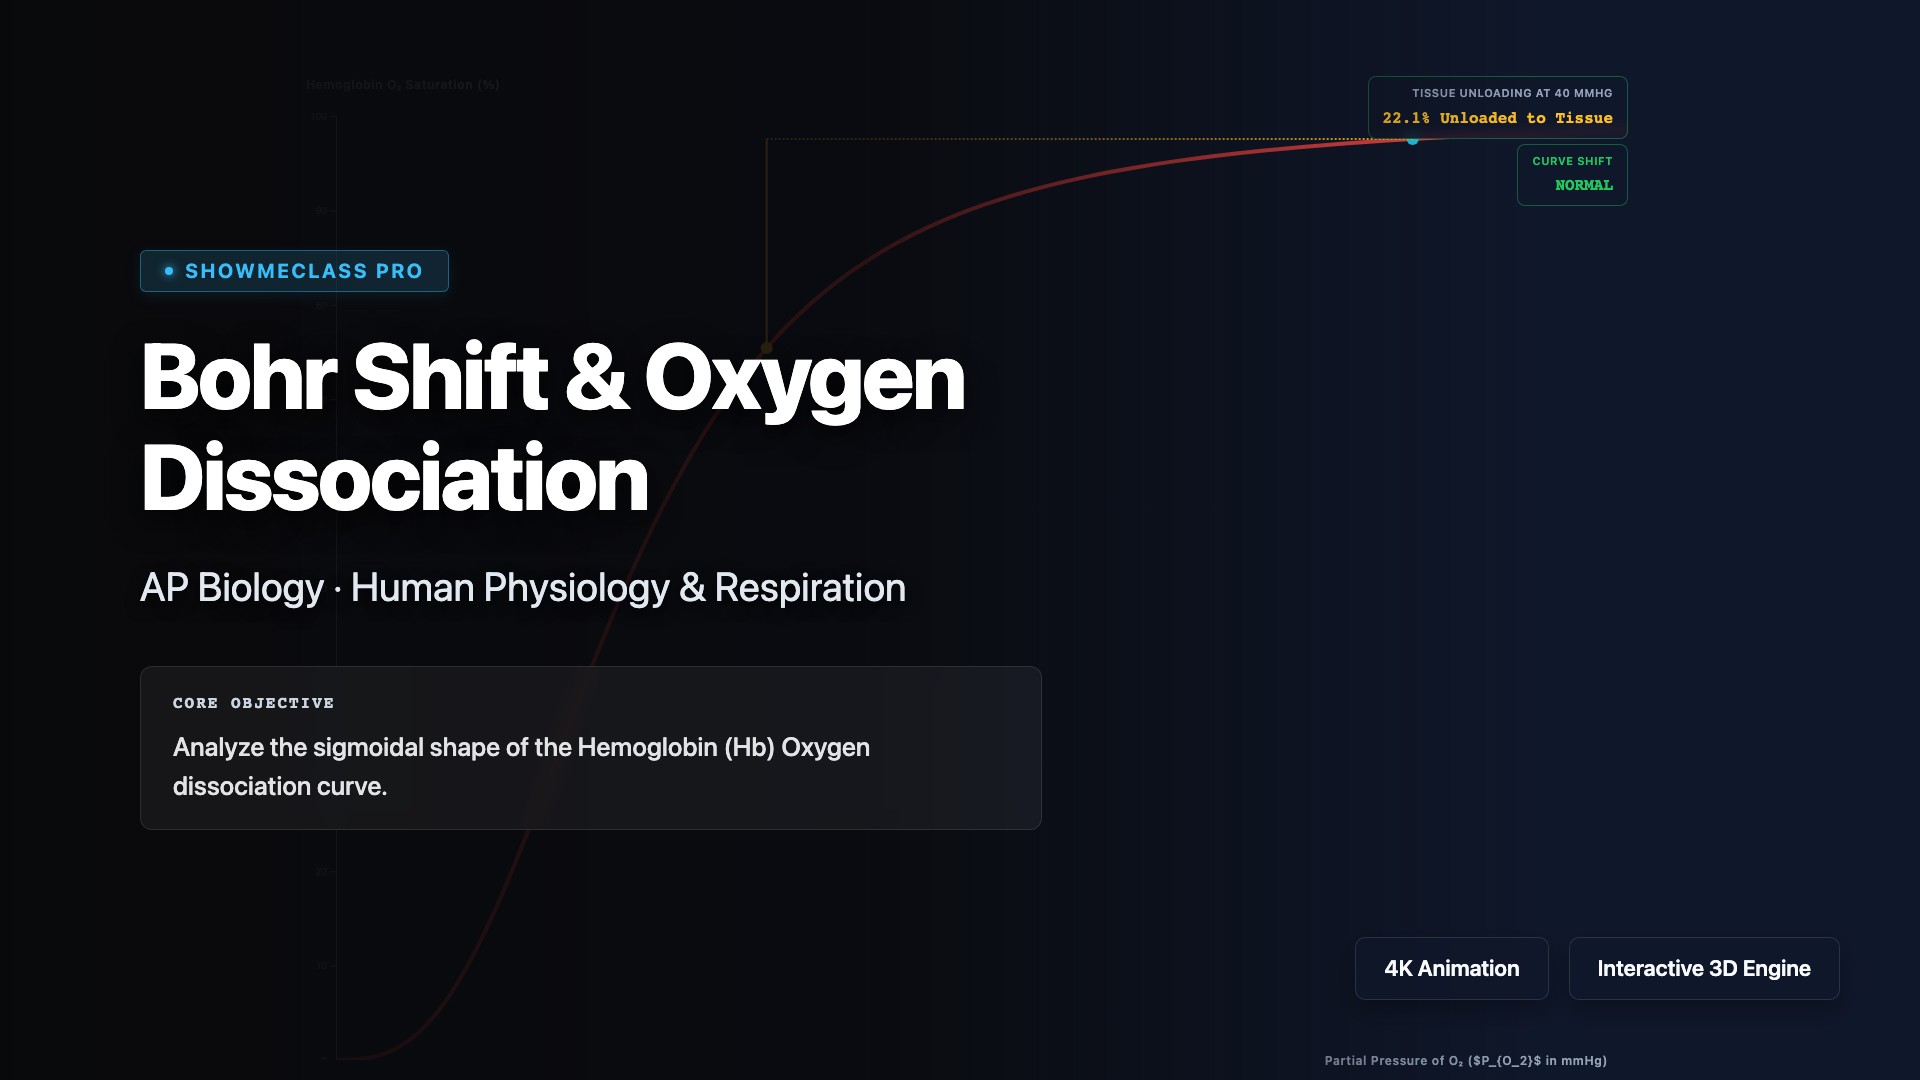
Bohr Shift & Hemoglobin Oxygen Dissociation
Chart the sigmoidal oxygen binding curve of hemoglobin. Discover how lower pH, higher $CO_2$, and elevated temperatures cause a Right Shift in active muscle tissues.
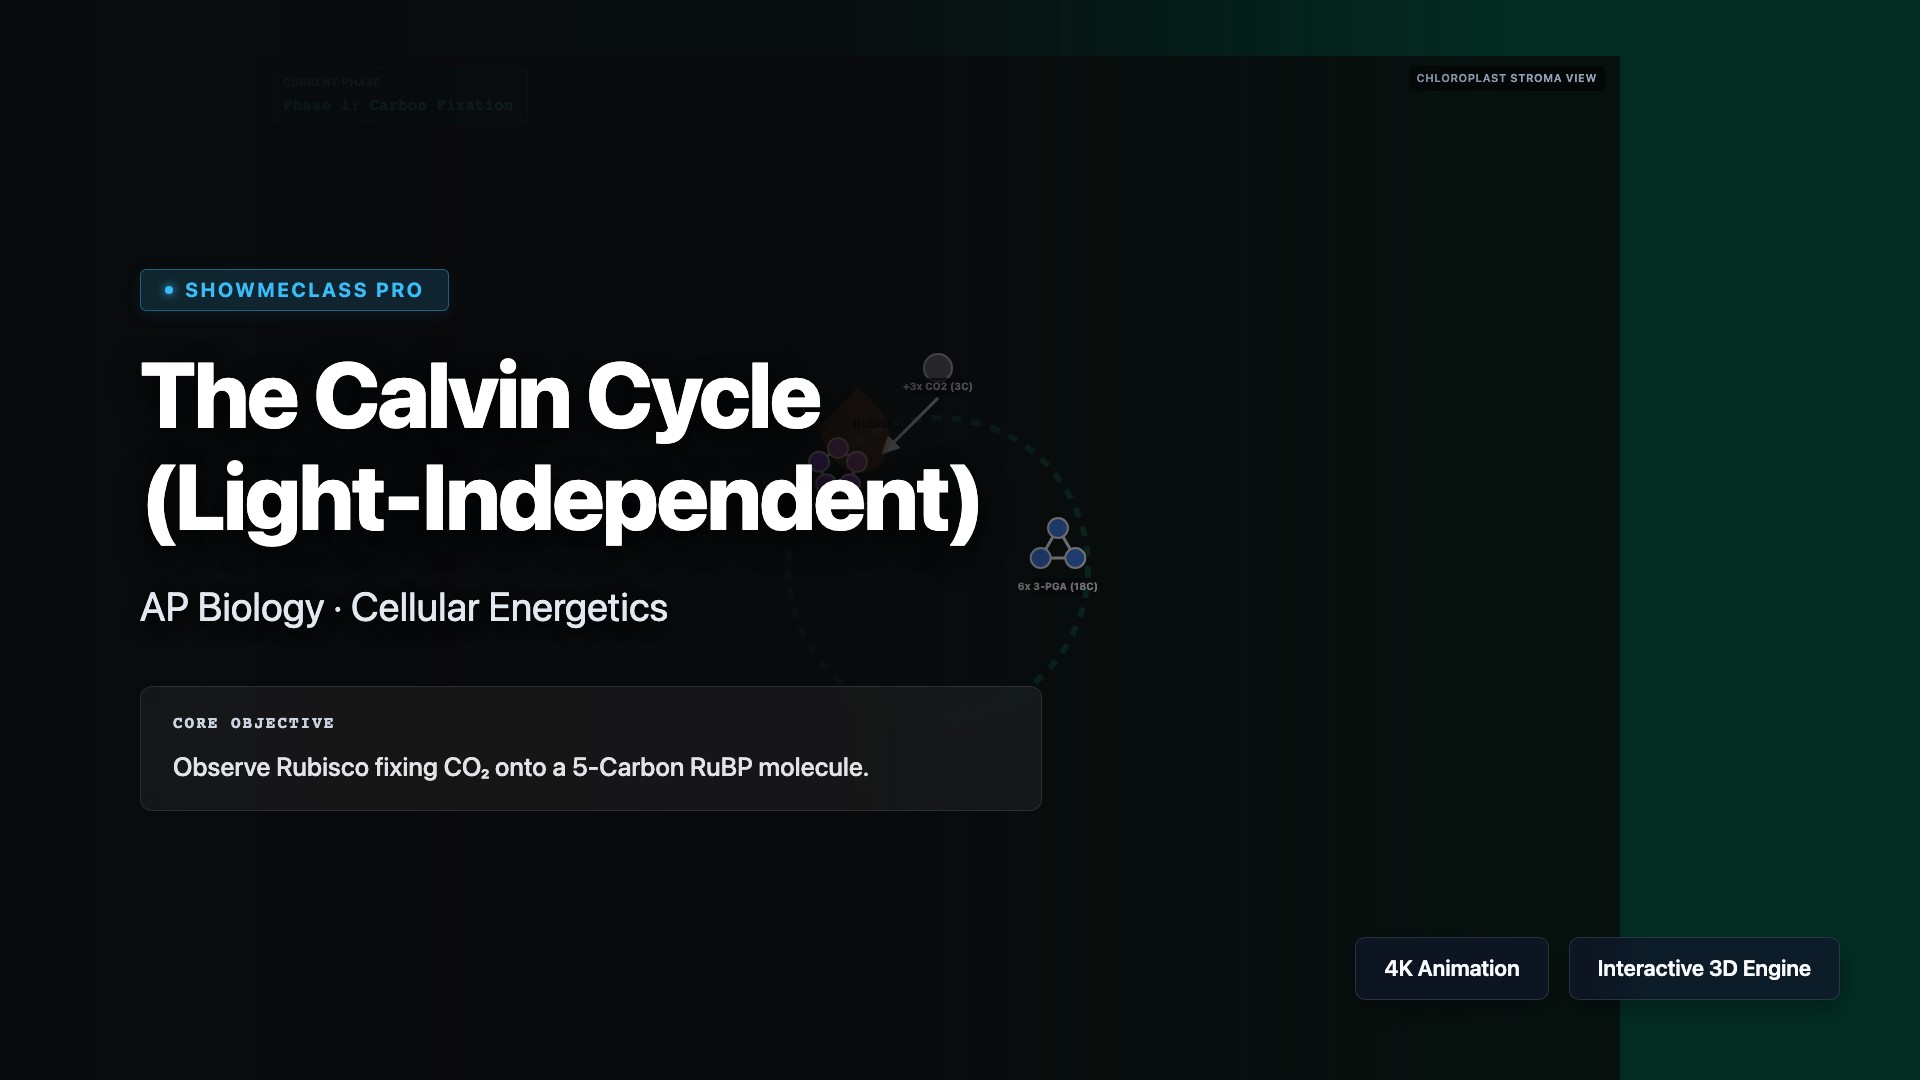
The Calvin Cycle
Track the fixation of Carbon Dioxide by Rubisco and the energy transfer from Light-Dependent ATP/NADPH to synthesize G3P.