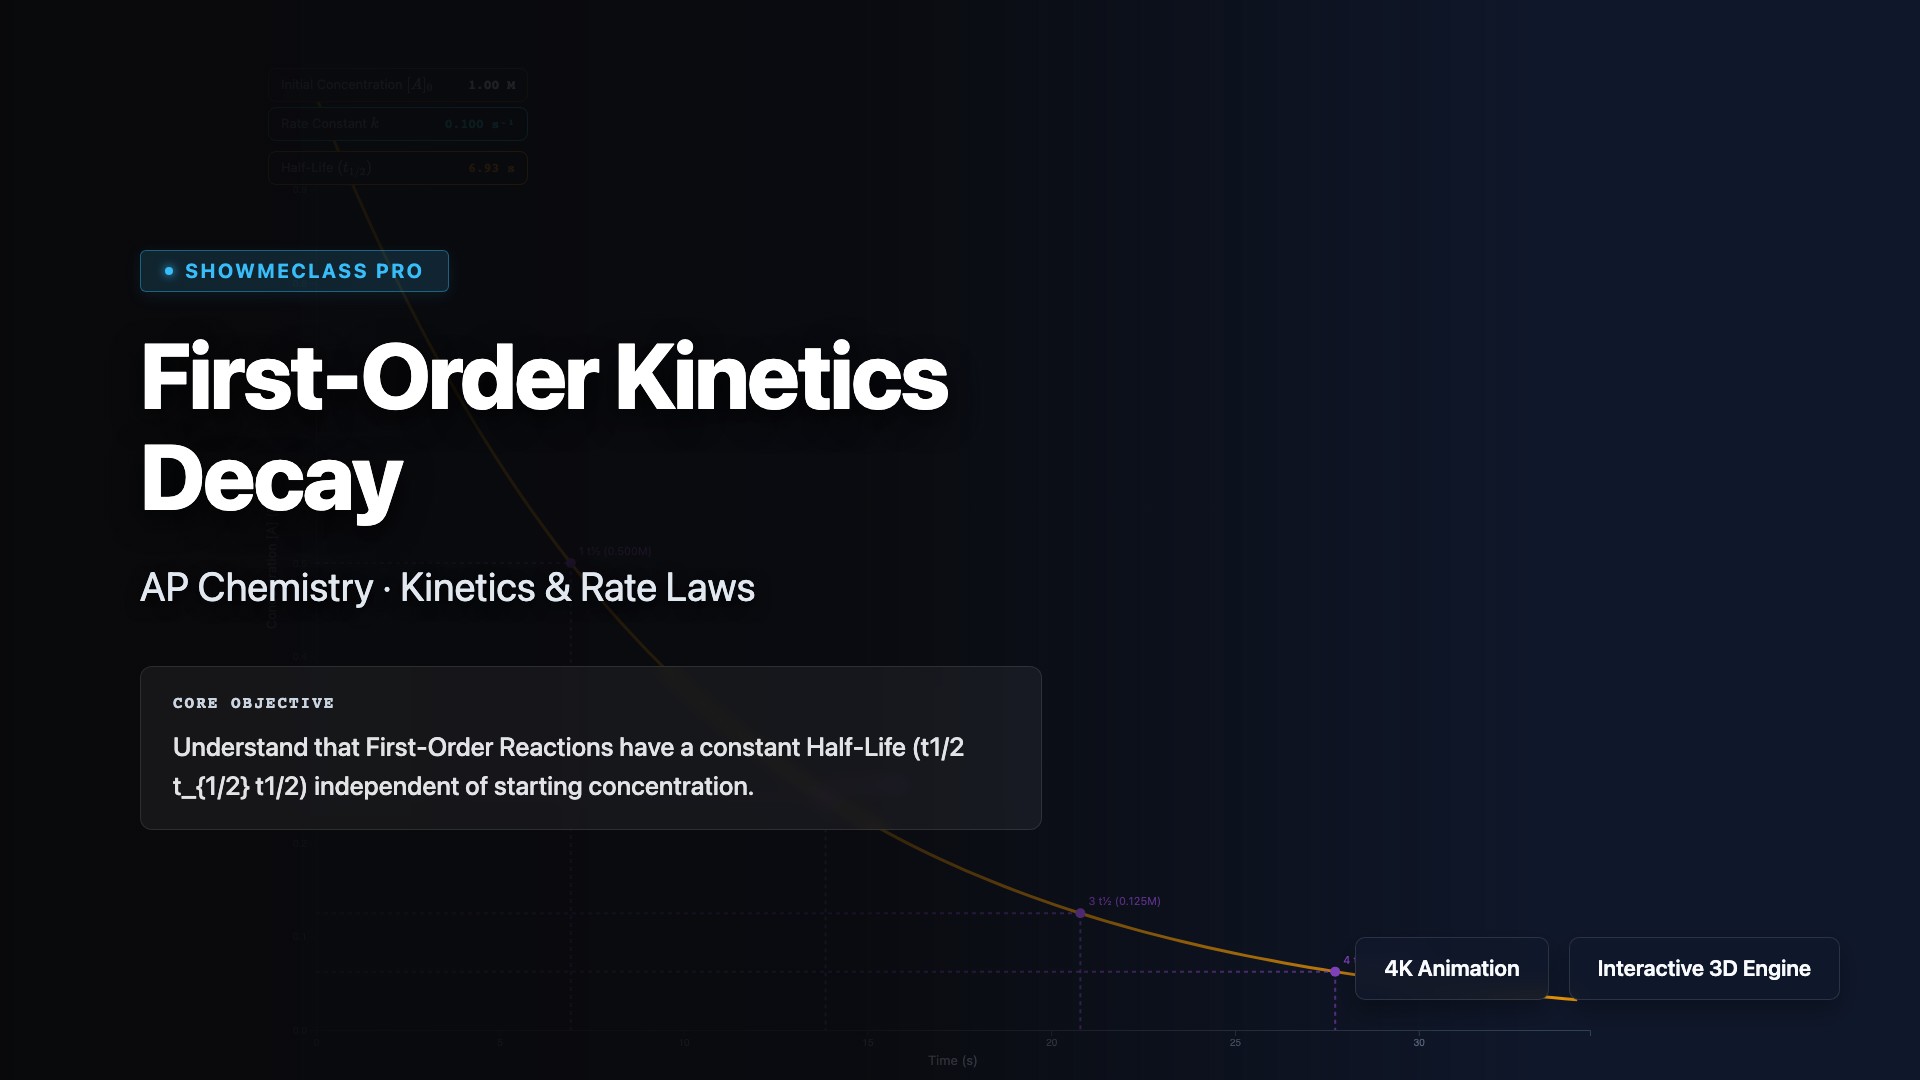
First-Order Kinetics Decay
Analyze first-order reactions where the rate depends linearly on one reactant concentration: rate = k[A]. Visualize exponential decay using the integrated rate law ln[A]t = ln[A]₀ - kt, and understand that first-order reactions have constant half-life t₁/₂ = 0.693/k independent of initial concentration. Explore applications in radioactive decay, drug metabolism, and chemical decomposition reactions.
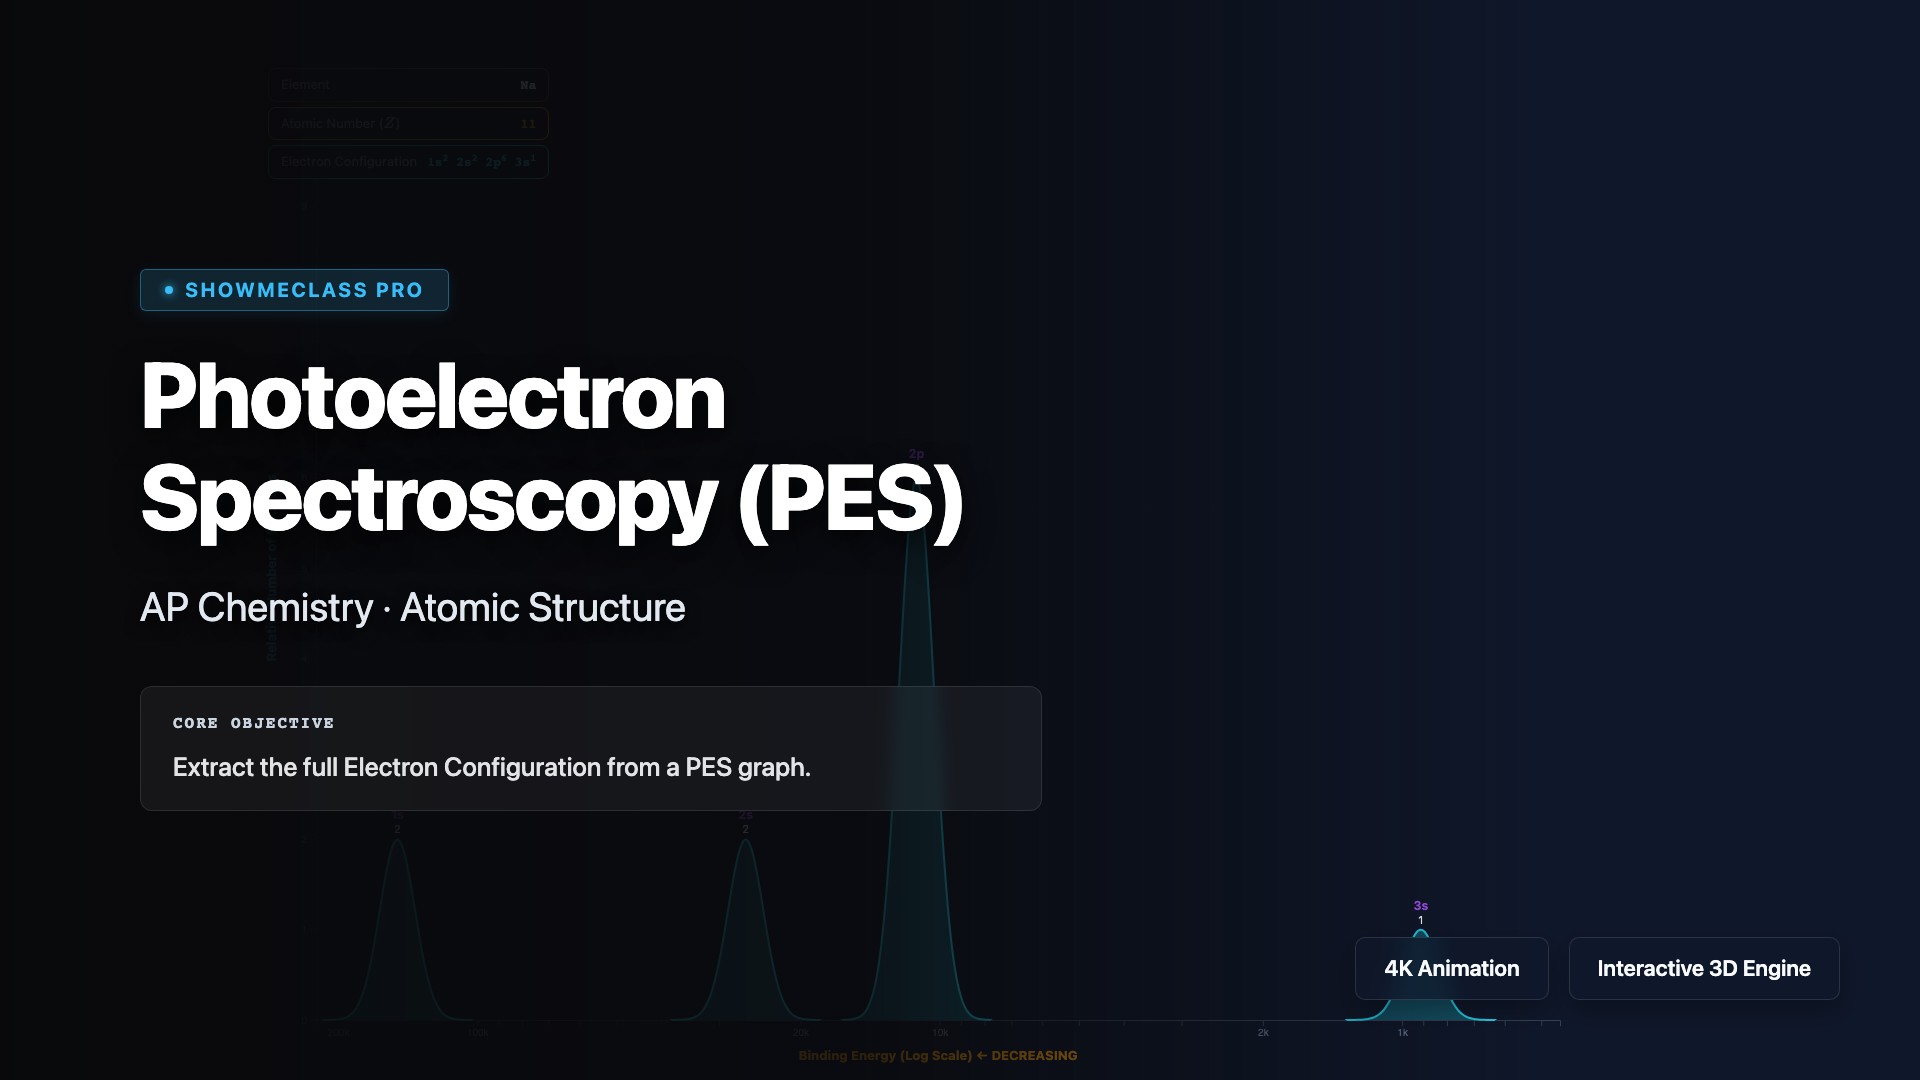
Photoelectron Spectroscopy (PES)
Interpret photoelectron spectroscopy (PES) data to determine electron configuration and relative energies of electrons in different orbitals. Analyze PES spectra where peak position indicates binding energy (related to Coulomb's law and effective nuclear charge) and peak height represents the number of electrons. Practice identifying elements from their PES spectra and understanding how core versus valence electrons produce distinct peaks.
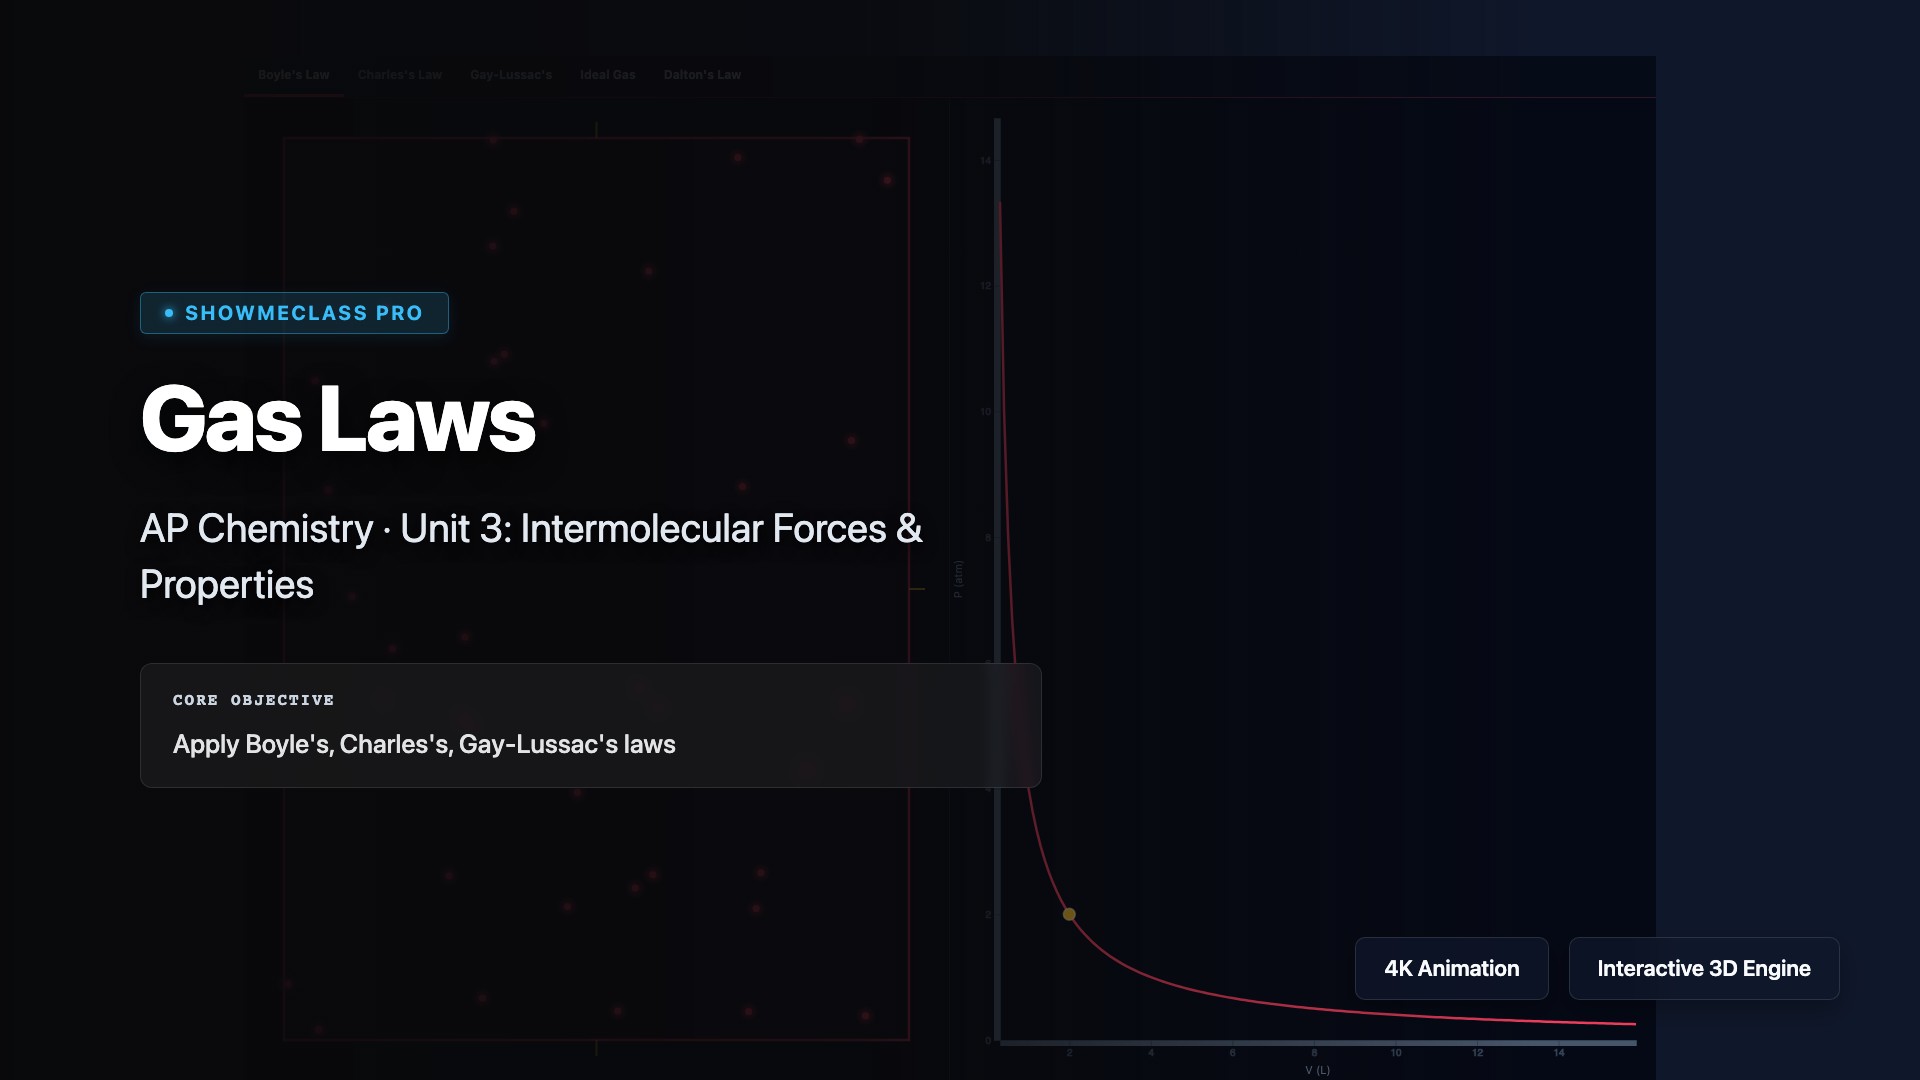
Gas Laws
Explore the fundamental gas laws that describe relationships between pressure, volume, temperature, and amount of gas. Visualize Boyle's Law (P₁V₁ = P₂V₂), Charles's Law (V₁/T₁ = V₂/T₂), Gay-Lussac's Law (P₁/T₁ = P₂/T₂), Avogadro's Law (V₁/n₁ = V₂/n₂), and the Combined Gas Law. Understand how these individual laws combine to form the Ideal Gas Law PV = nRT.
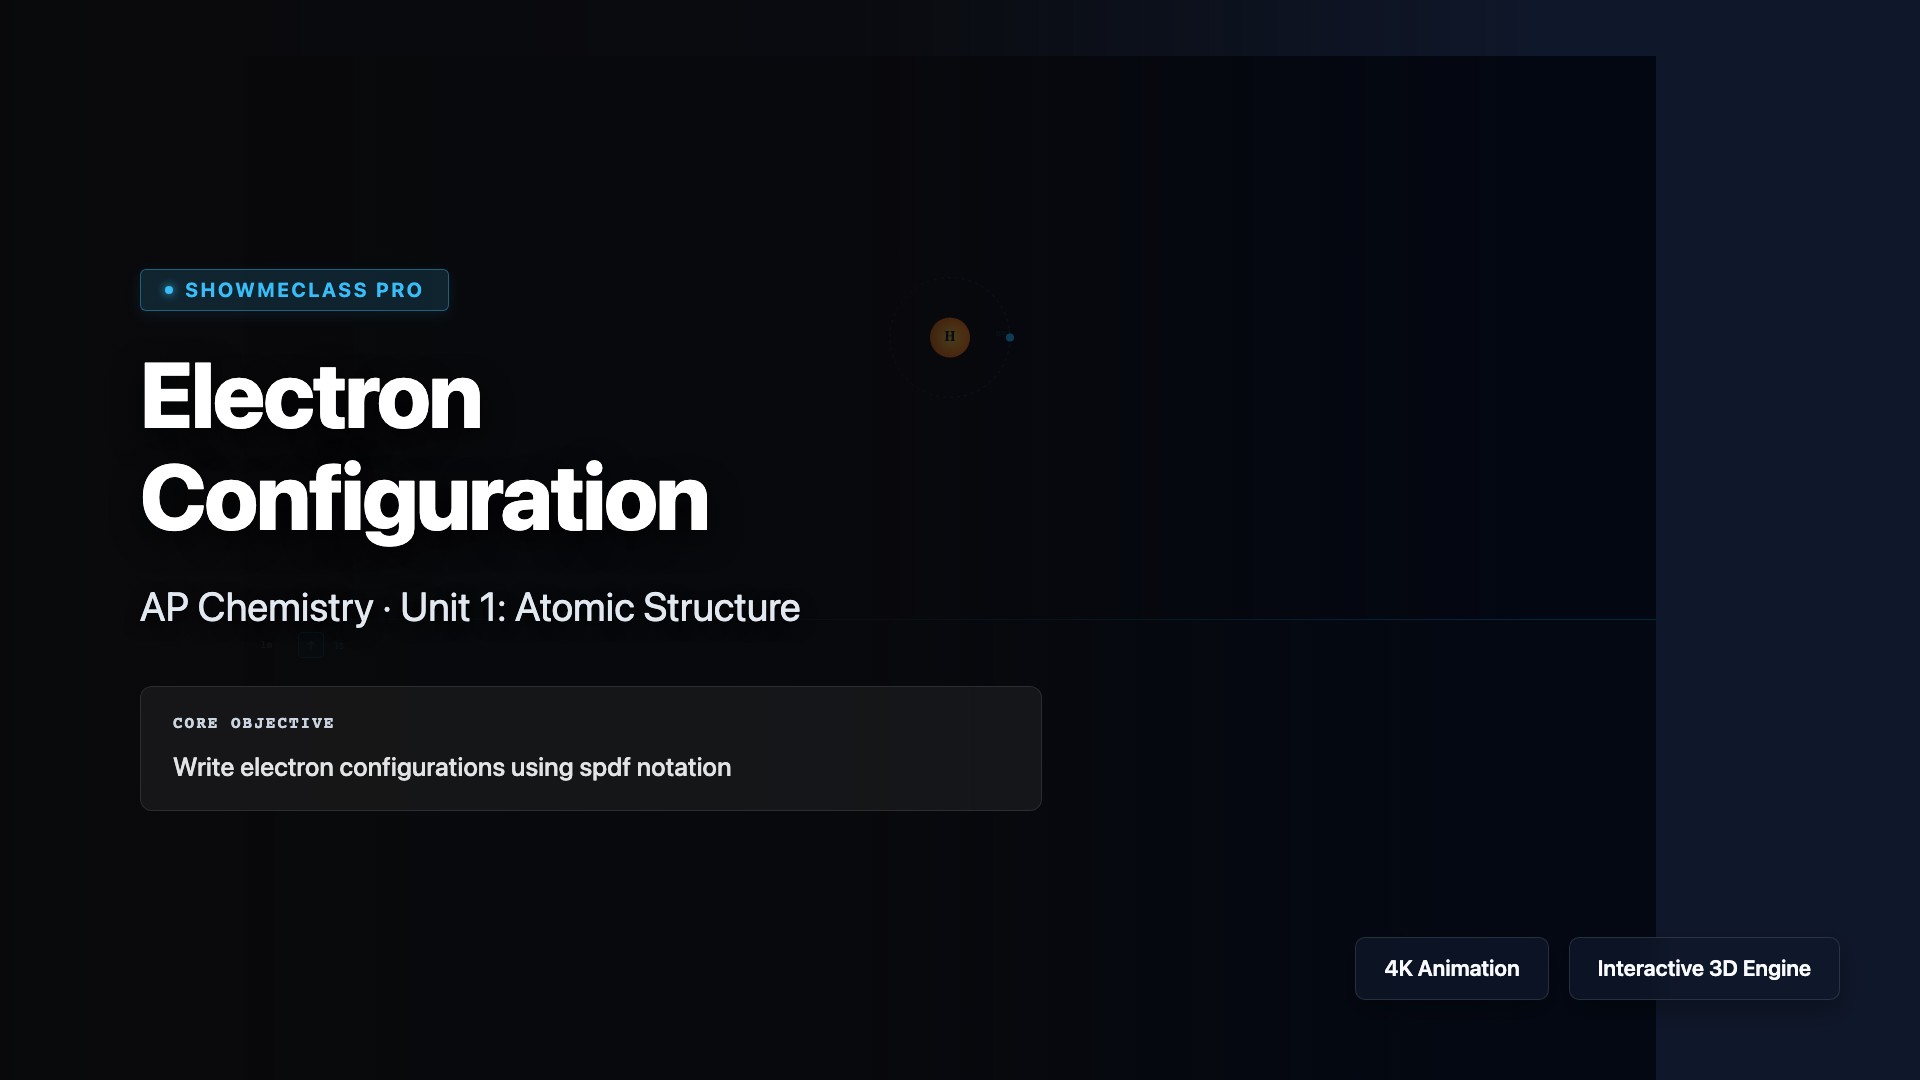
Electron Configuration
Build electron configurations for atoms and ions using the Aufbau principle, Hund's rule, and the Pauli exclusion principle. Visualize how electrons fill orbitals in order of increasing energy (1s, 2s, 2p, 3s, 3p, 4s, 3d...), understand noble gas notation shortcuts, and identify valence electrons. Explore exceptions like chromium and copper, and connect electron configuration to periodic trends and chemical reactivity.
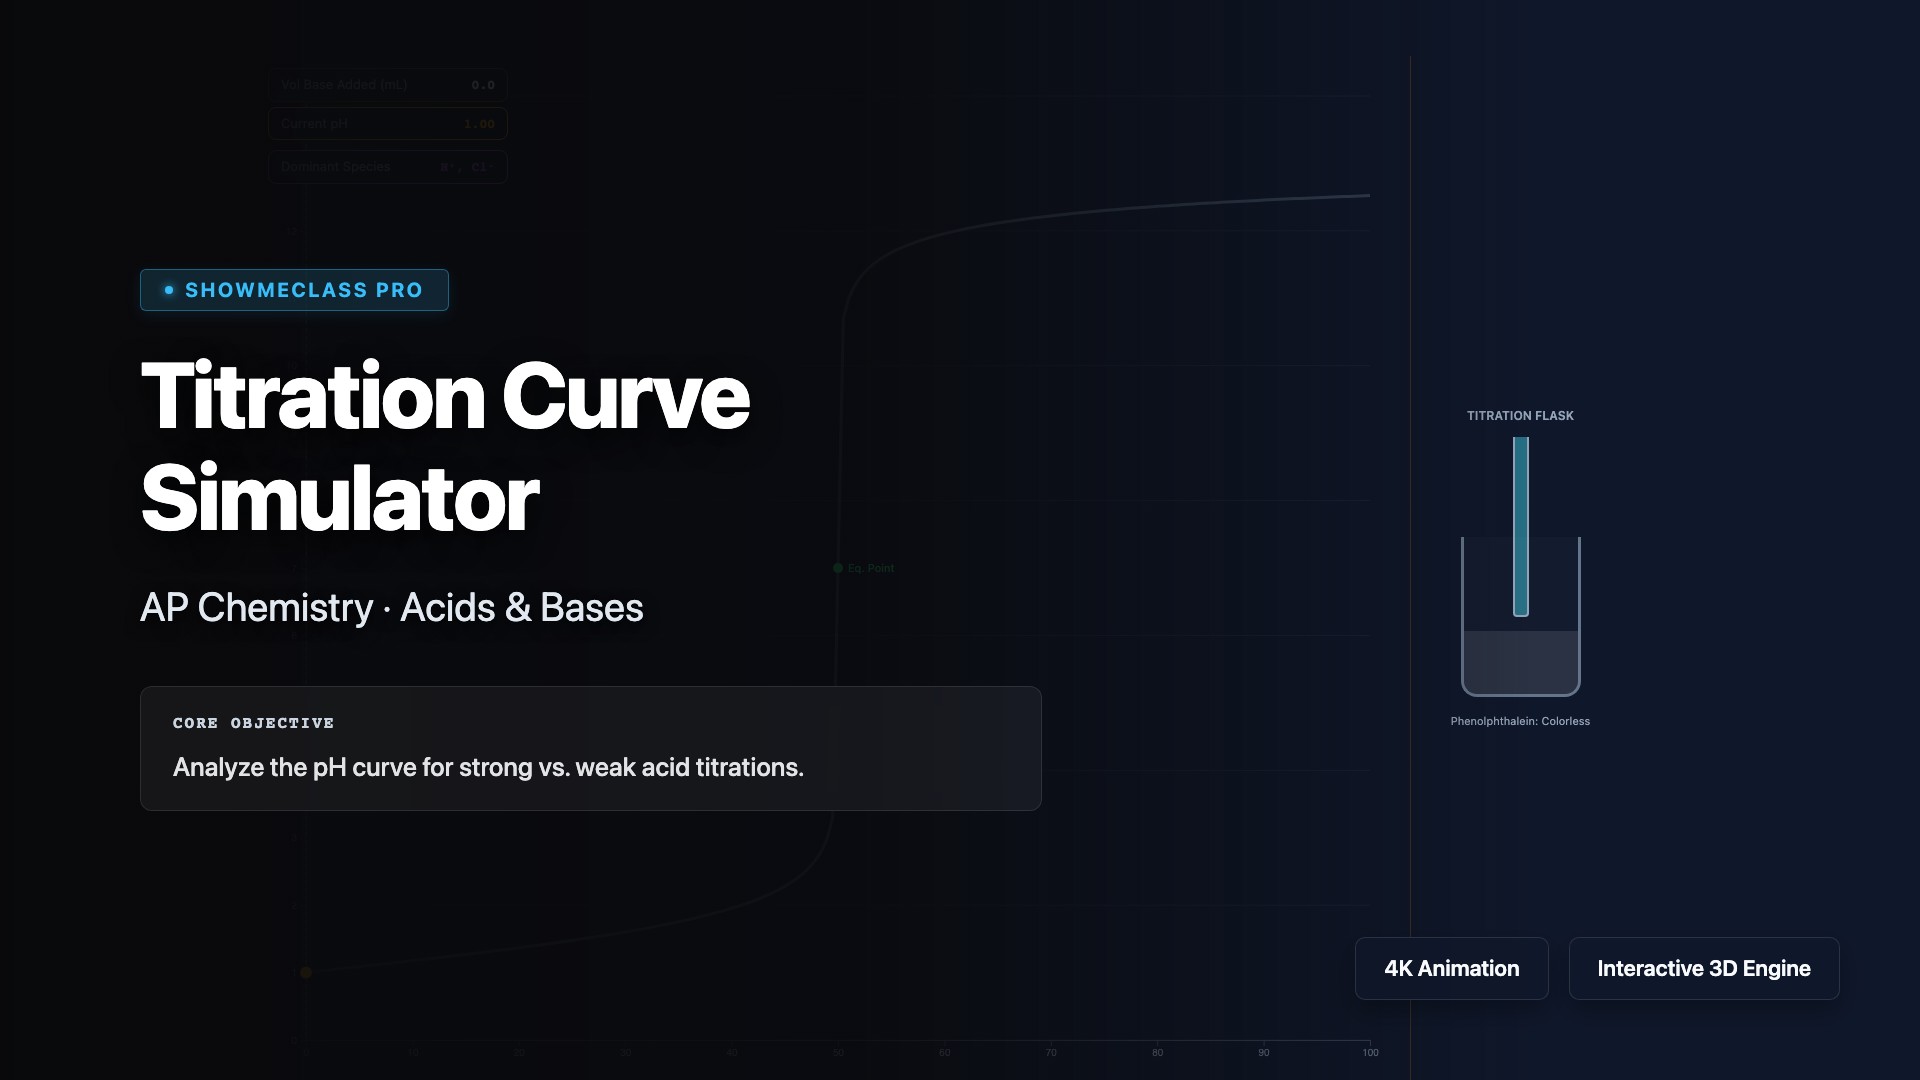
Titration Curve Simulator
Simulate acid-base titrations and analyze pH curves for strong-strong, weak-strong, and polyprotic titrations. Visualize how pH changes as titrant is added, identify equivalence points, buffer regions, and half-equivalence points where pH = pKa. Understand the Henderson-Hasselbalch equation, calculate buffer capacity, and select appropriate indicators based on their pKa values and the pH at equivalence.
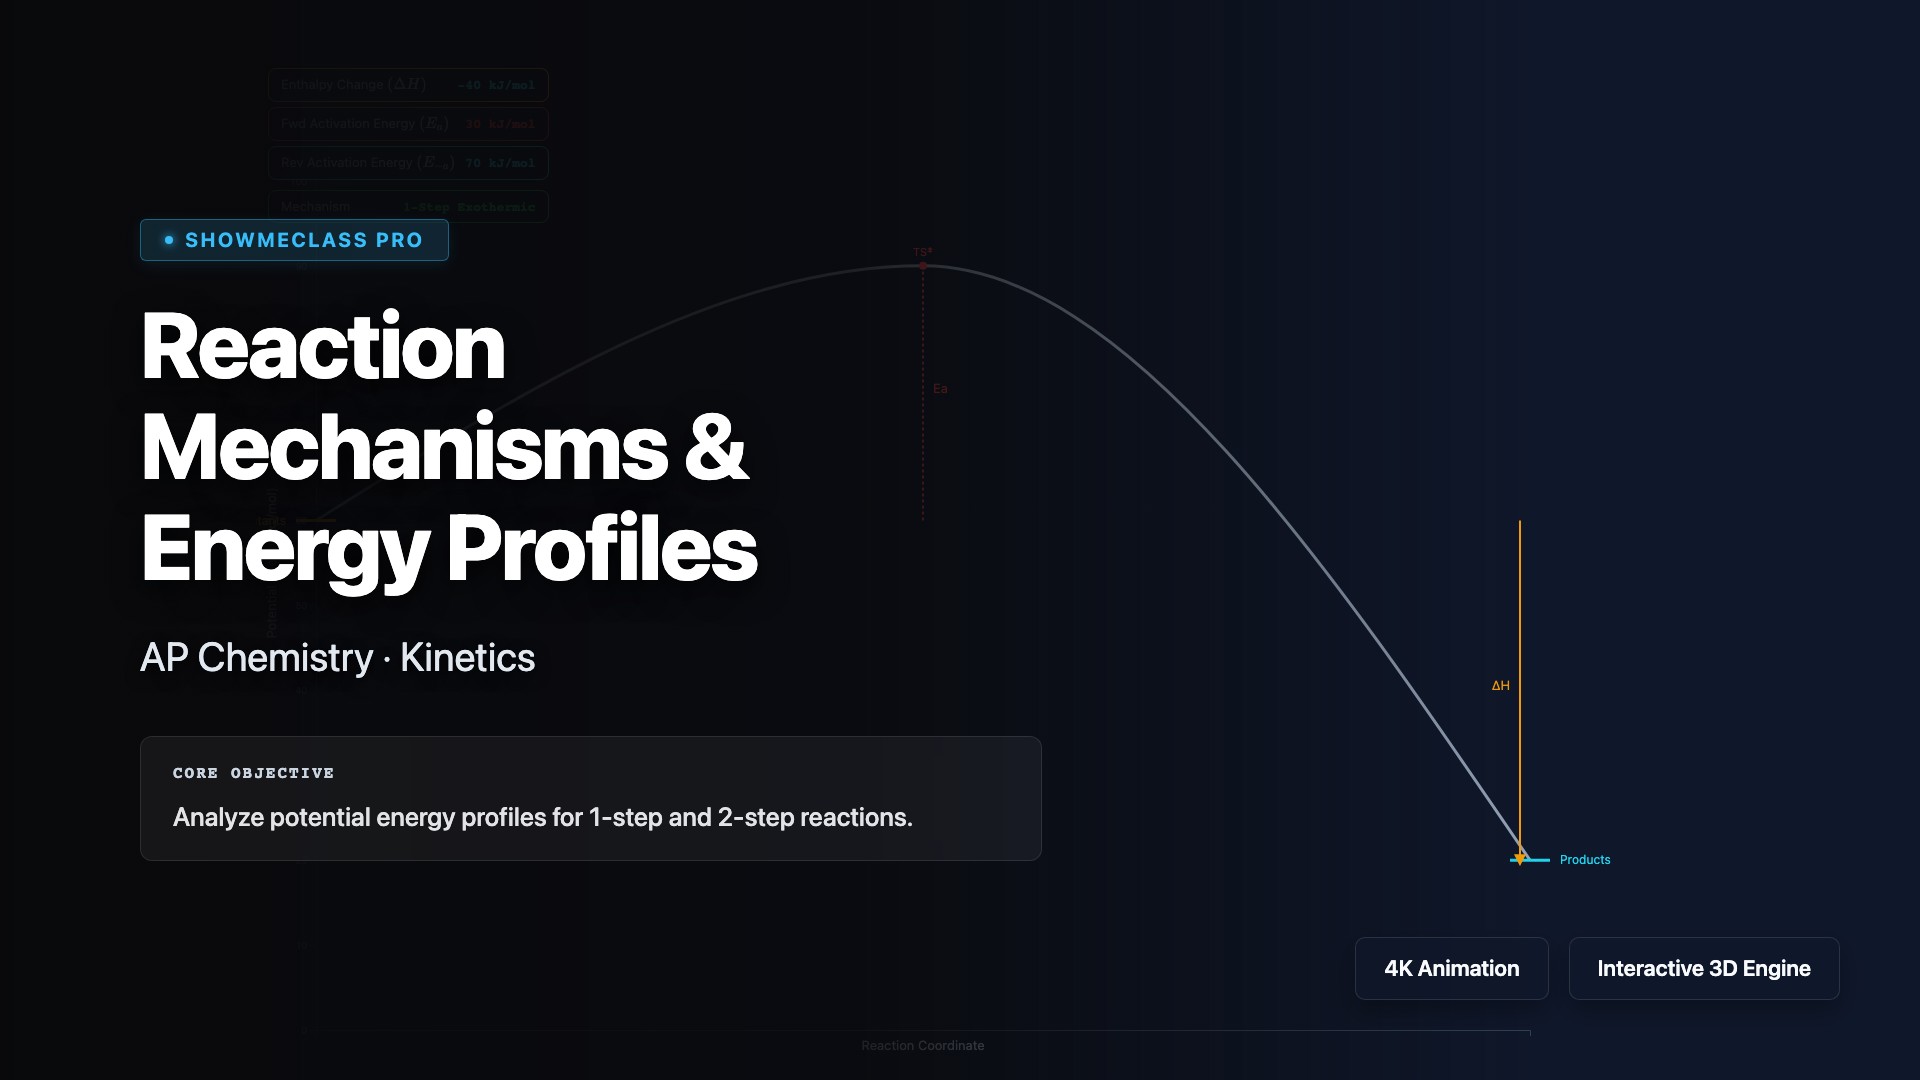
Reaction Mechanisms & Energy Profiles
Explore multi-step reaction mechanisms where elementary steps combine to give the overall reaction. Identify intermediates (produced then consumed), catalysts (consumed then regenerated), and the rate-determining step (slowest step with highest activation energy). Visualize energy profiles showing multiple transition states and understand how the mechanism must match the experimentally determined rate law.
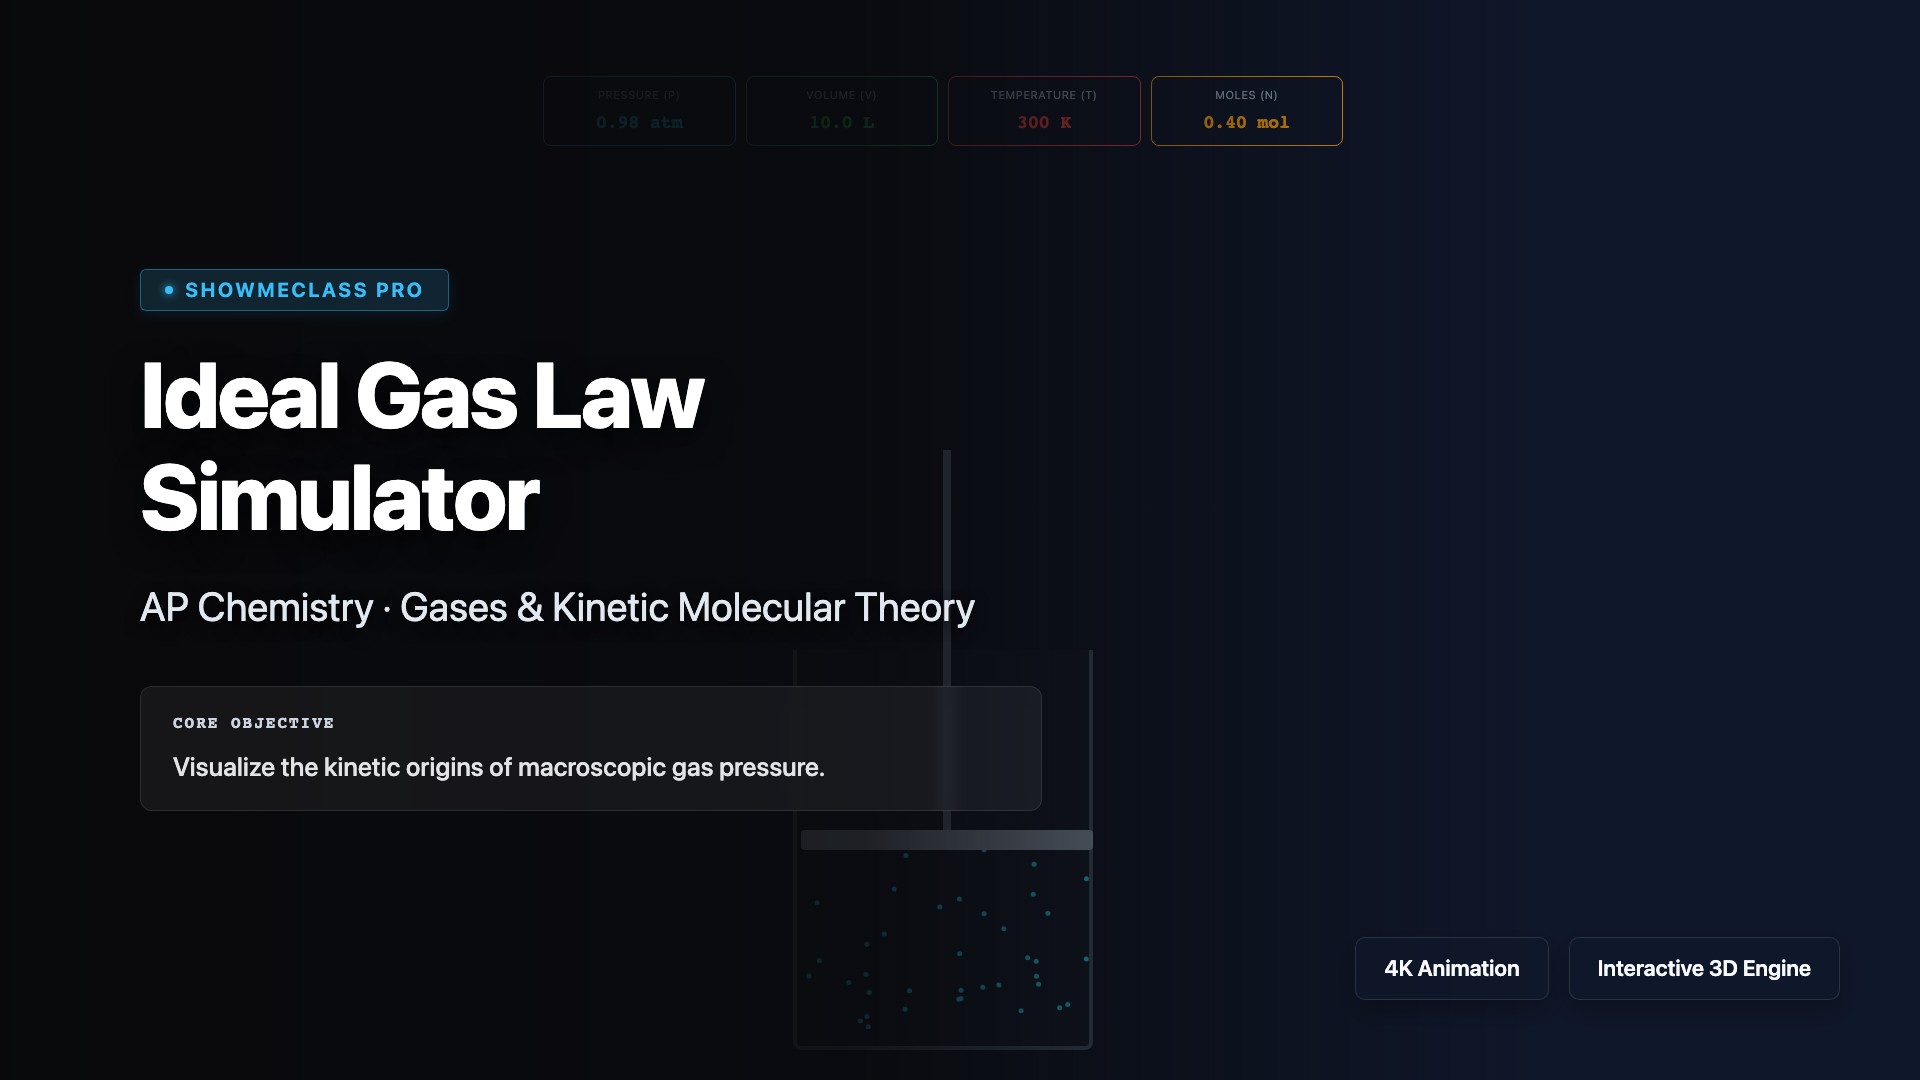
Ideal Gas Law Simulator
Simulate the Ideal Gas Law PV = nRT to explore how pressure, volume, temperature, and moles of gas are related. Manipulate variables to see real-time effects on gas behavior, calculate unknown quantities using R = 0.0821 L·atm/(mol·K), and understand the assumptions of ideal gas behavior. Explore deviations from ideality at high pressure and low temperature where real gases exhibit intermolecular forces and molecular volume.
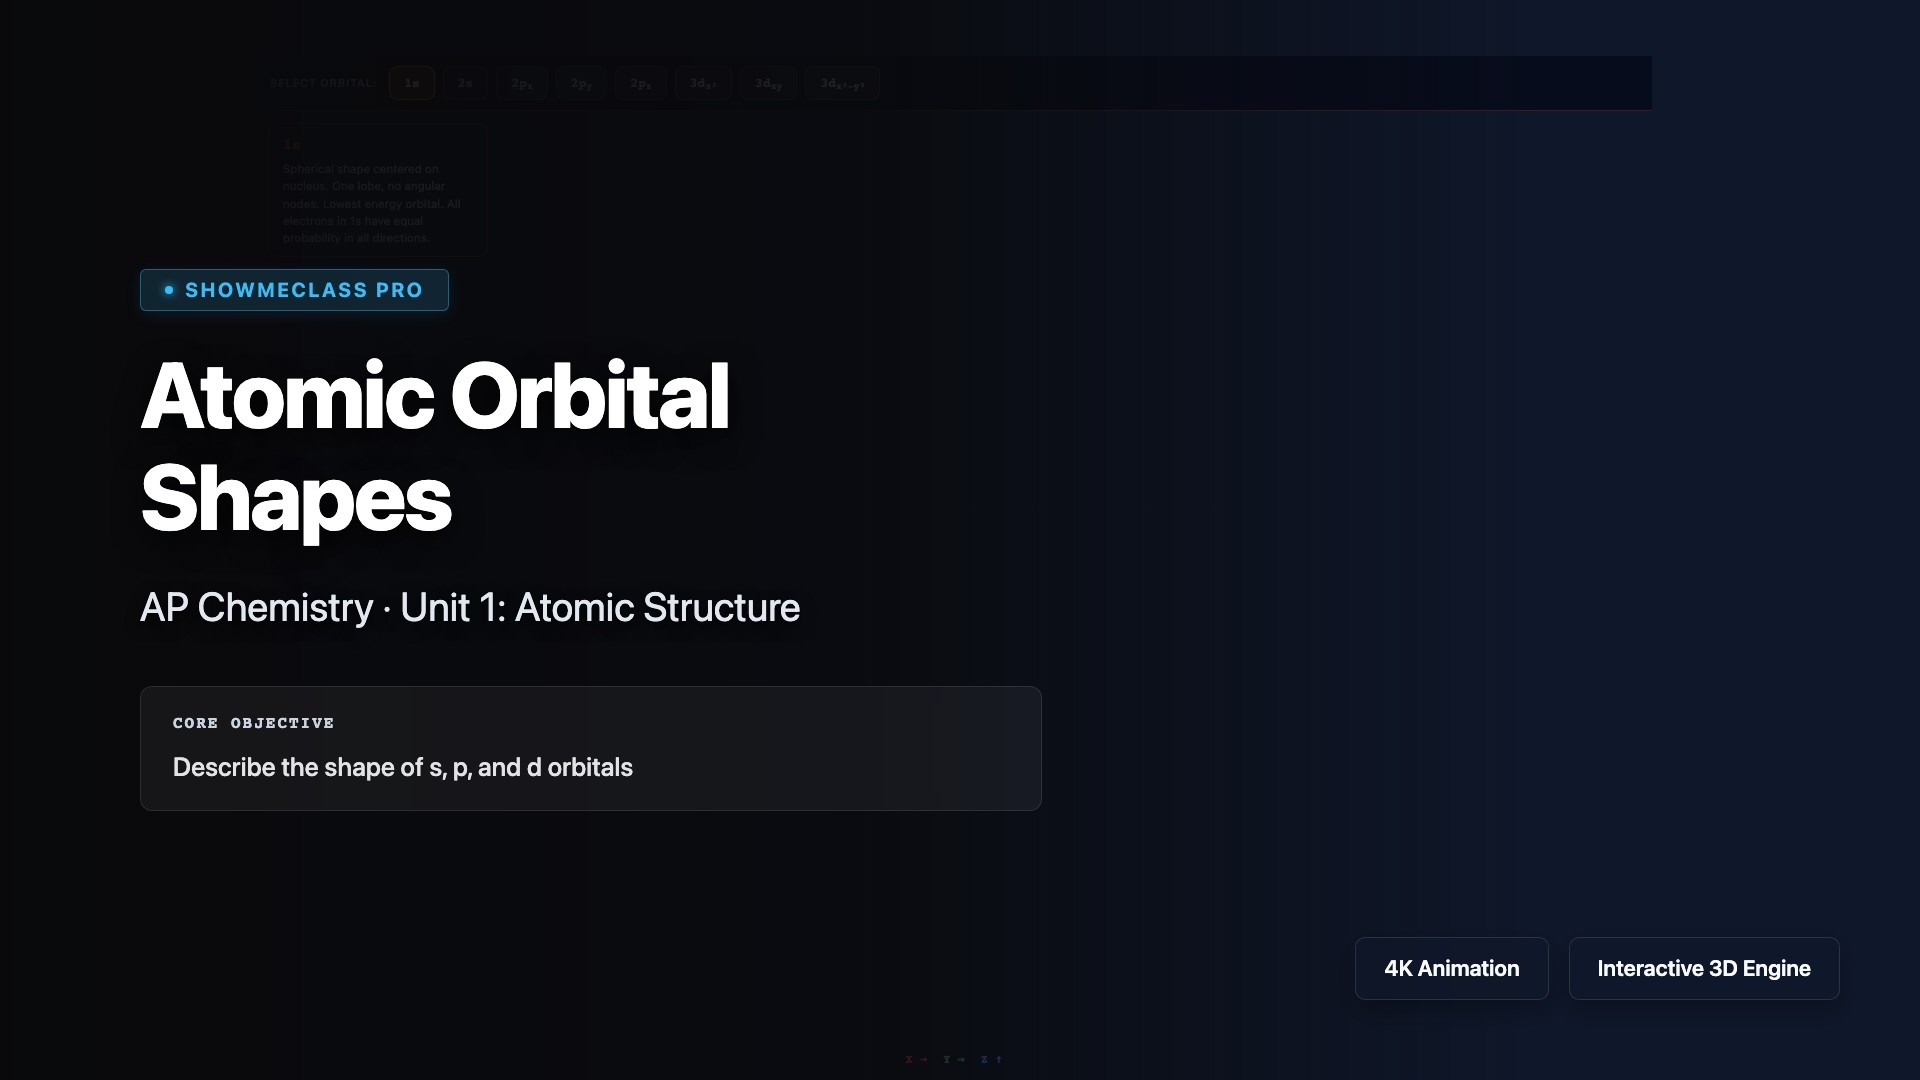
Atomic Orbital Shapes
Visualize the three-dimensional shapes of atomic orbitals (s, p, d, and f) that describe the probability distribution of electrons around the nucleus. Explore how quantum numbers (n, l, mₗ, mₛ) define orbital characteristics including energy level, shape, orientation, and electron spin. Understand the relationship between orbital shapes and chemical bonding, electron configuration, and the periodic table structure.
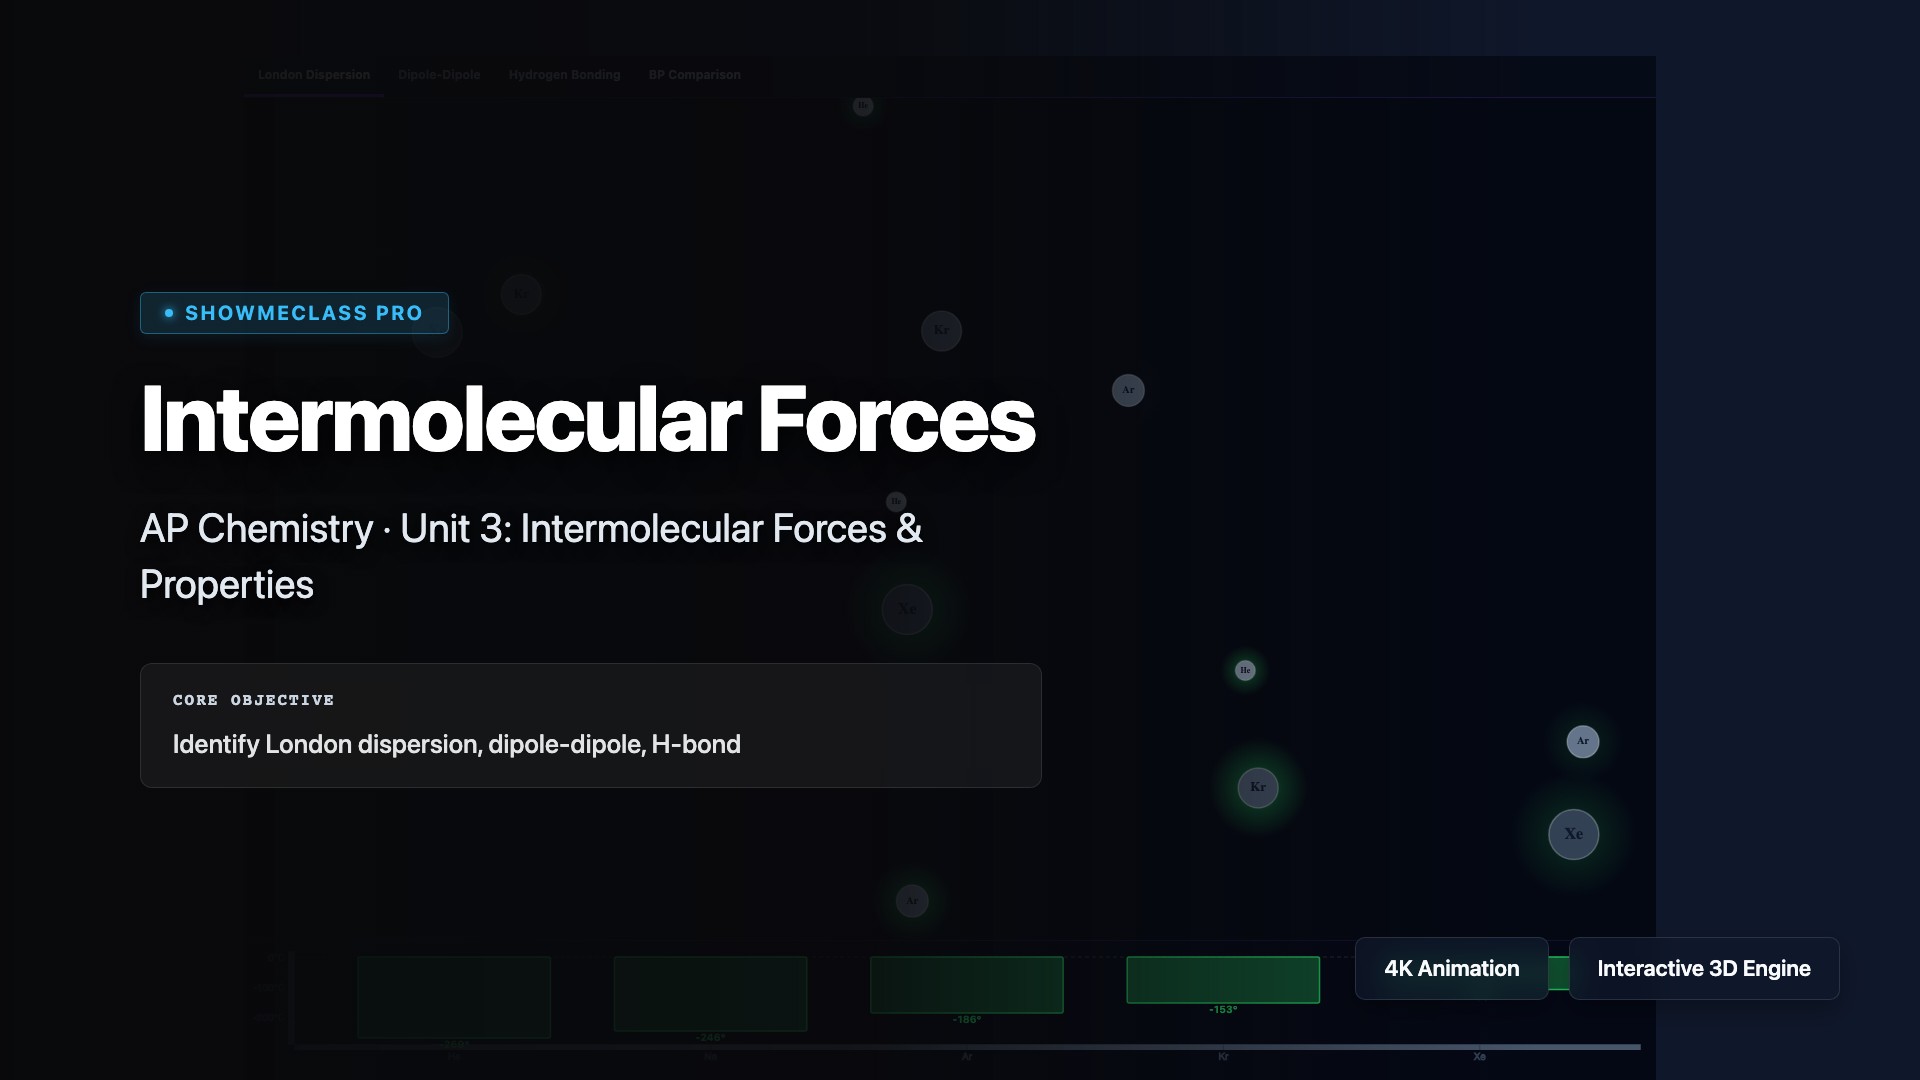
Intermolecular Forces
Explore the attractive forces between molecules that determine physical properties like boiling point, melting point, and solubility. Compare London dispersion forces (weakest, present in all molecules), dipole-dipole interactions (polar molecules), and hydrogen bonding (strongest IMF, requires H bonded to N, O, or F). Understand how molecular structure, polarity, and molecular weight affect IMF strength and predict relative boiling points.
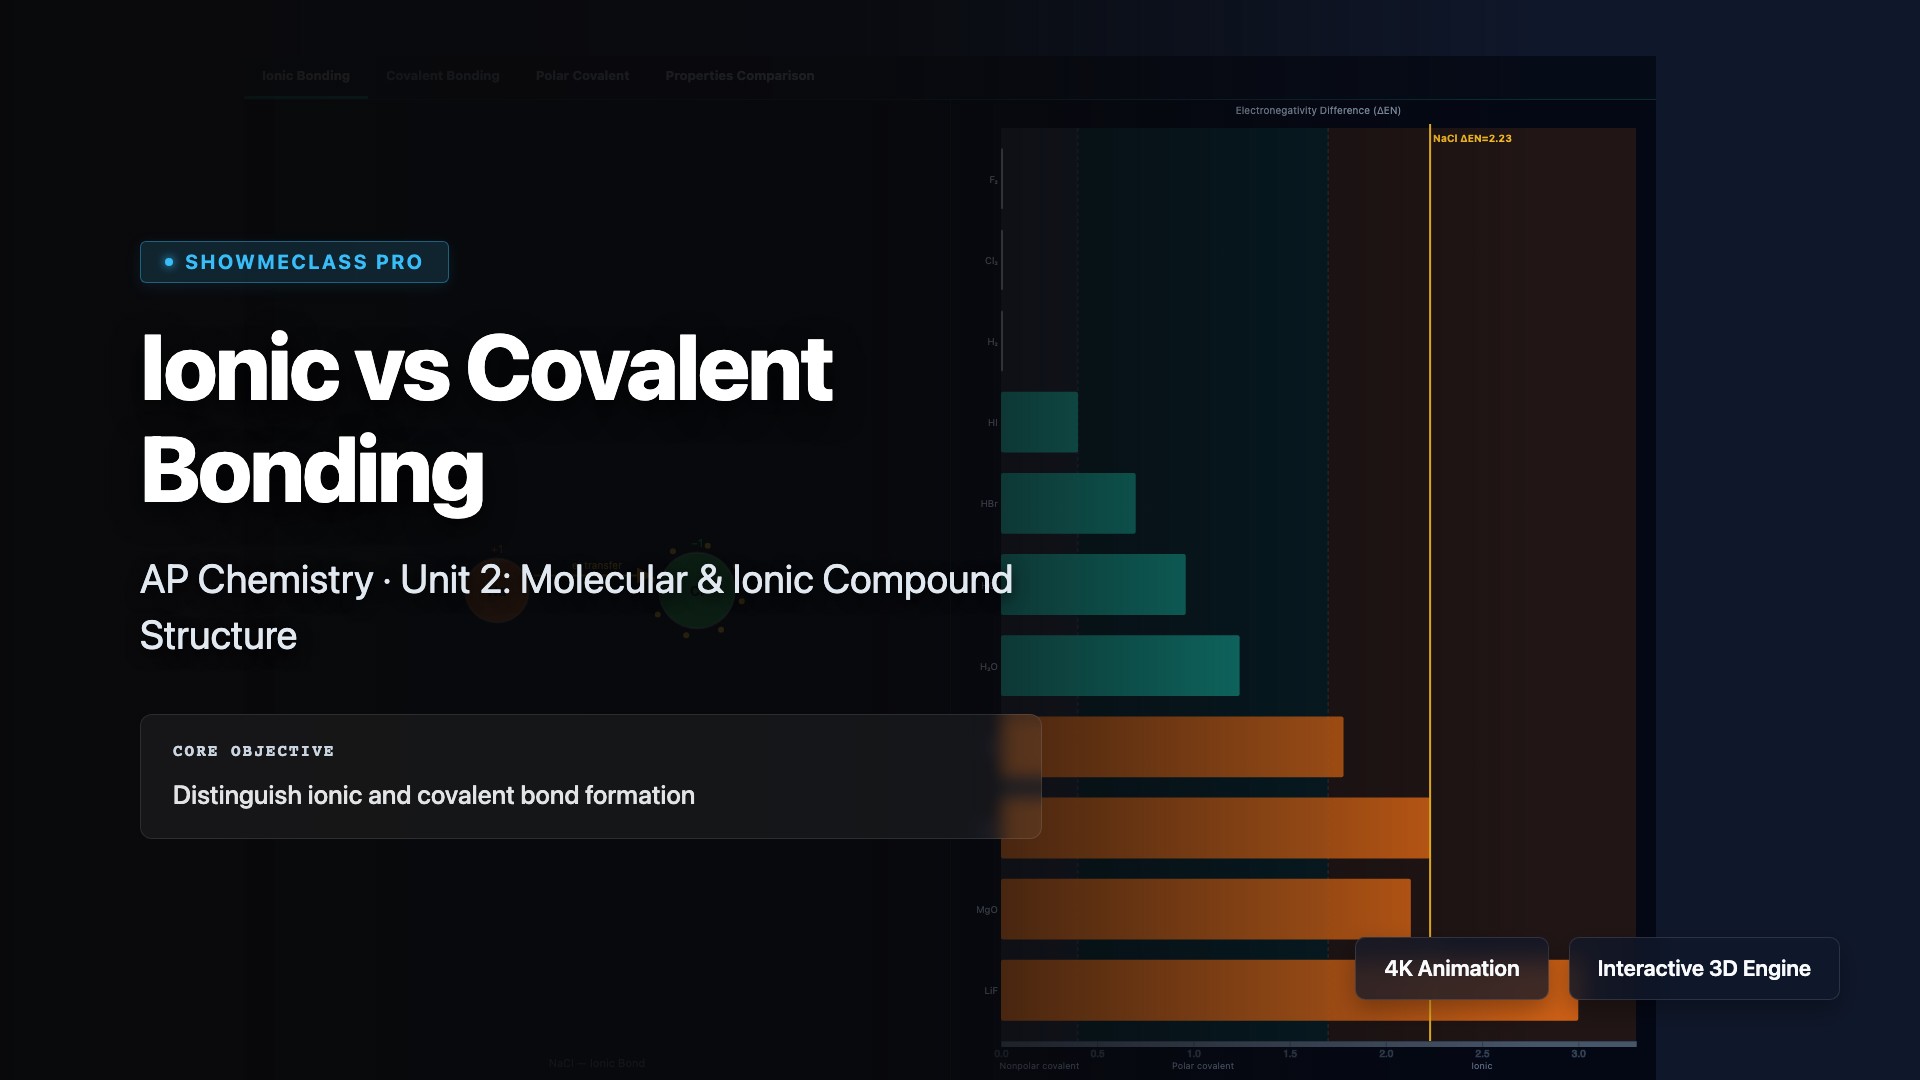
Ionic vs Covalent Bonding
Compare ionic bonding (electron transfer between metals and nonmetals forming electrostatic attractions) with covalent bonding (electron sharing between nonmetals). Visualize how electronegativity differences determine bond type: ΔEN > 1.7 indicates ionic, ΔEN < 0.4 indicates nonpolar covalent, and intermediate values indicate polar covalent bonds. Understand how bond type affects properties like melting point, electrical conductivity, and solubility.
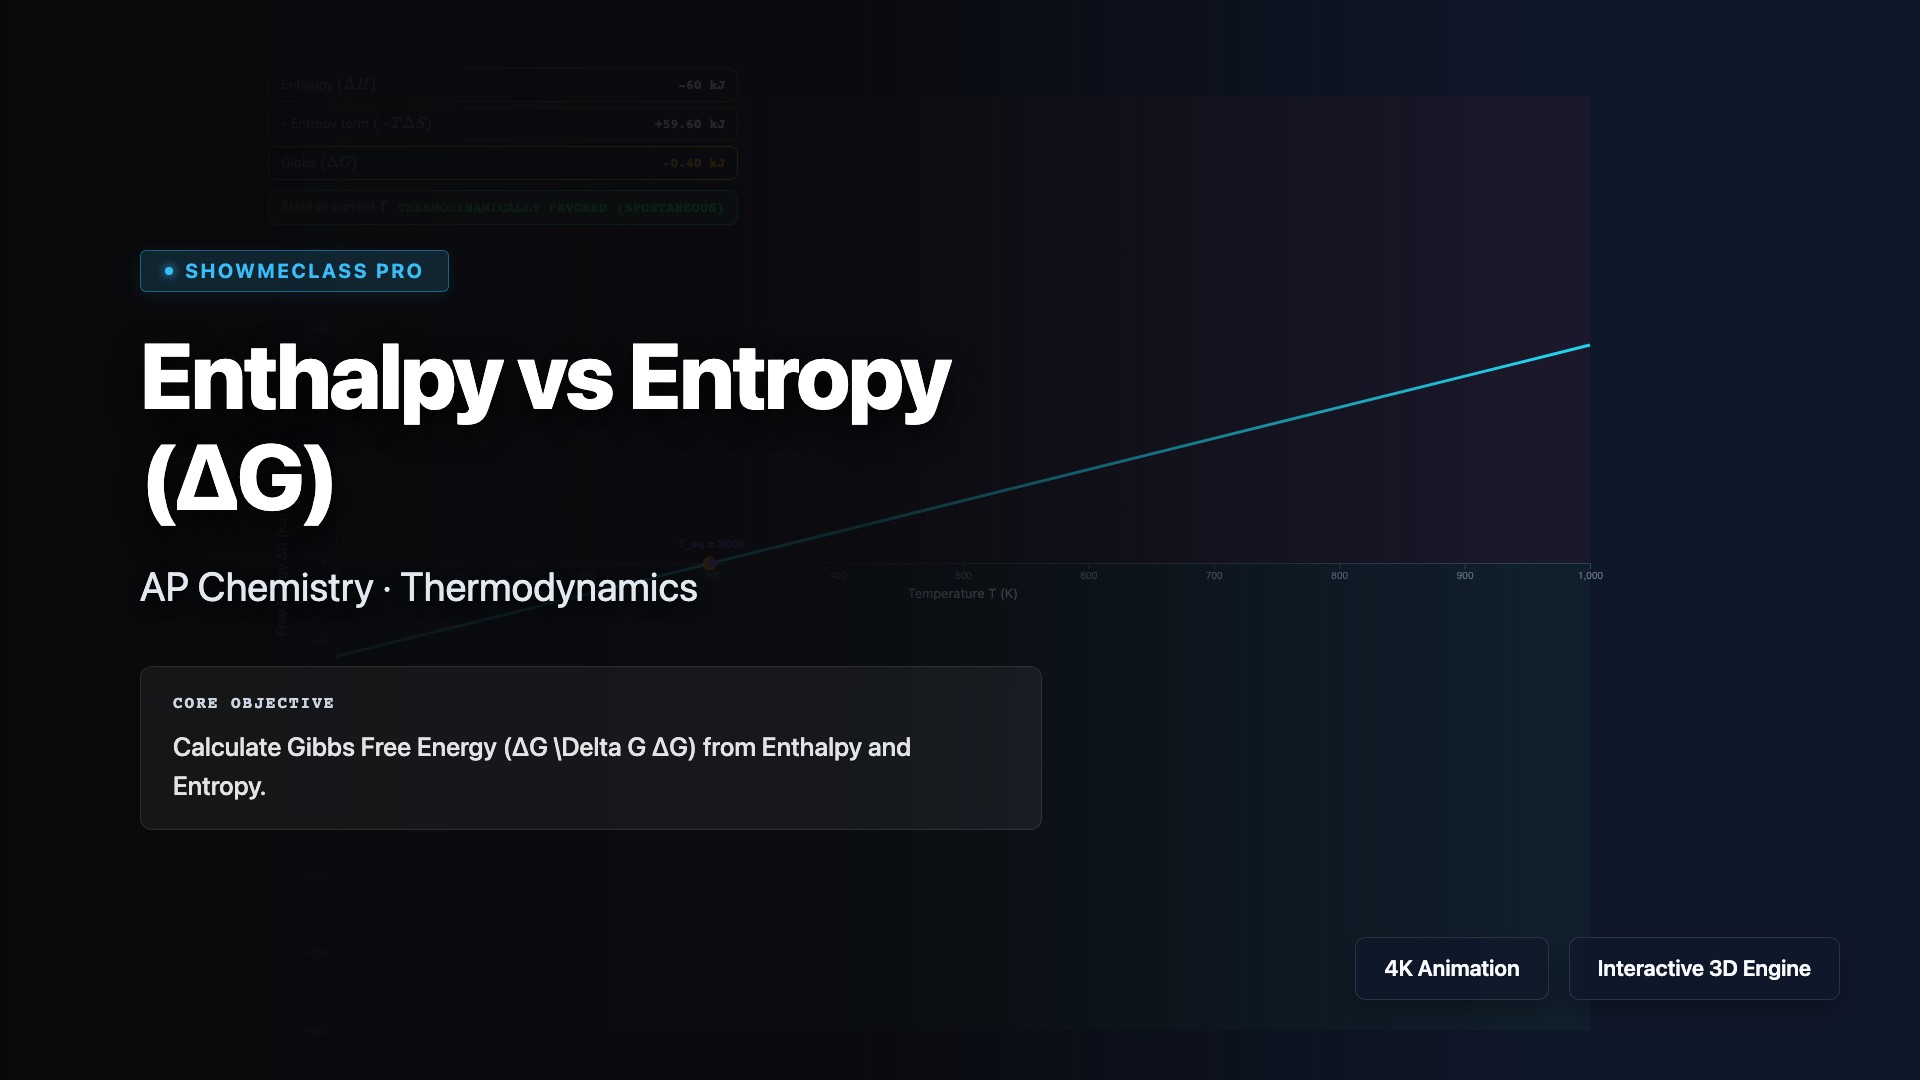
Enthalpy vs Entropy (ΔG)
Explore the relationship between enthalpy (ΔH), entropy (ΔS), and Gibbs free energy (ΔG) using the equation ΔG = ΔH - TΔS. Understand how temperature affects spontaneity: exothermic reactions with increasing entropy are always spontaneous, while endothermic reactions with decreasing entropy are never spontaneous. Visualize how ΔG < 0 indicates spontaneous processes, ΔG = 0 represents equilibrium, and ΔG > 0 means non-spontaneous reactions.
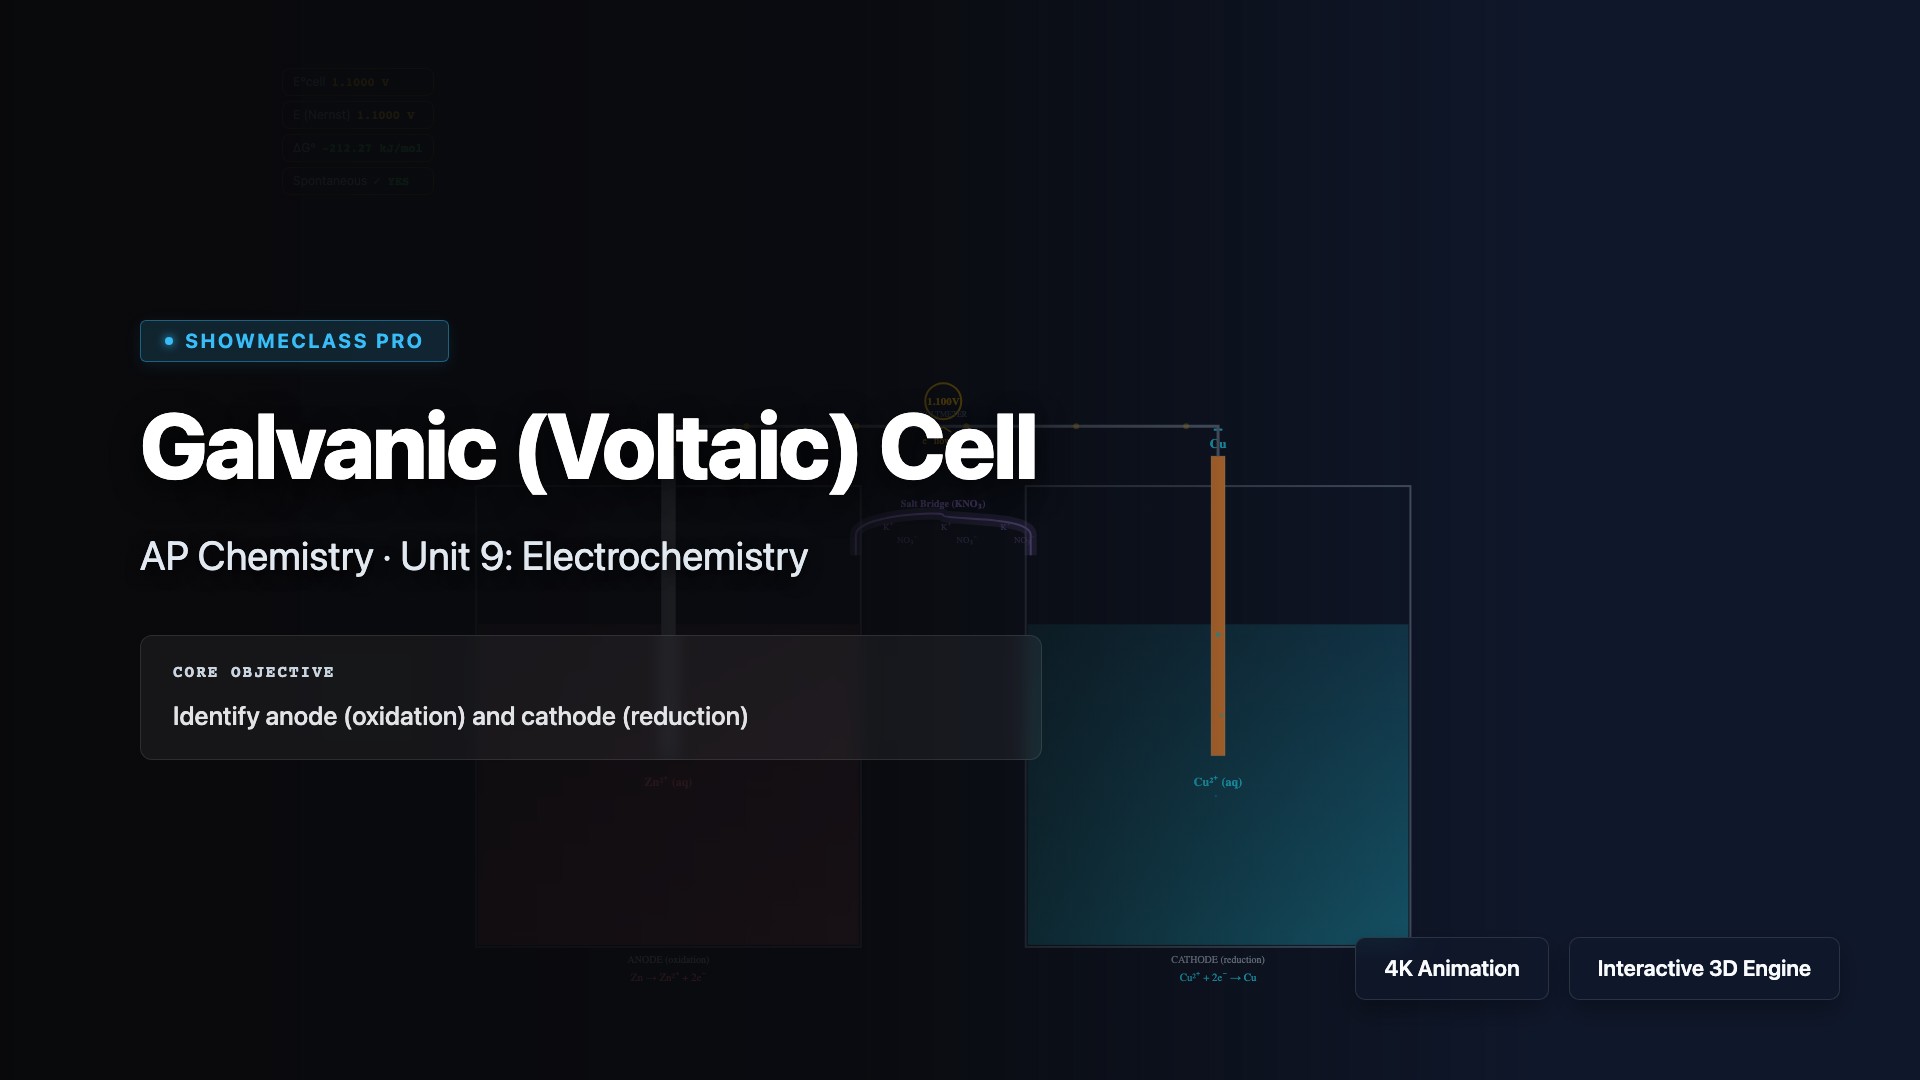
Galvanic (Voltaic) Cell
Explore galvanic (voltaic) cells that convert chemical energy into electrical energy through spontaneous redox reactions. Visualize electron flow from anode (oxidation) to cathode (reduction), ion movement through the salt bridge, and calculate cell potential using E°cell = E°cathode - E°anode. Understand the Nernst equation, concentration effects on voltage, and applications in batteries and fuel cells.
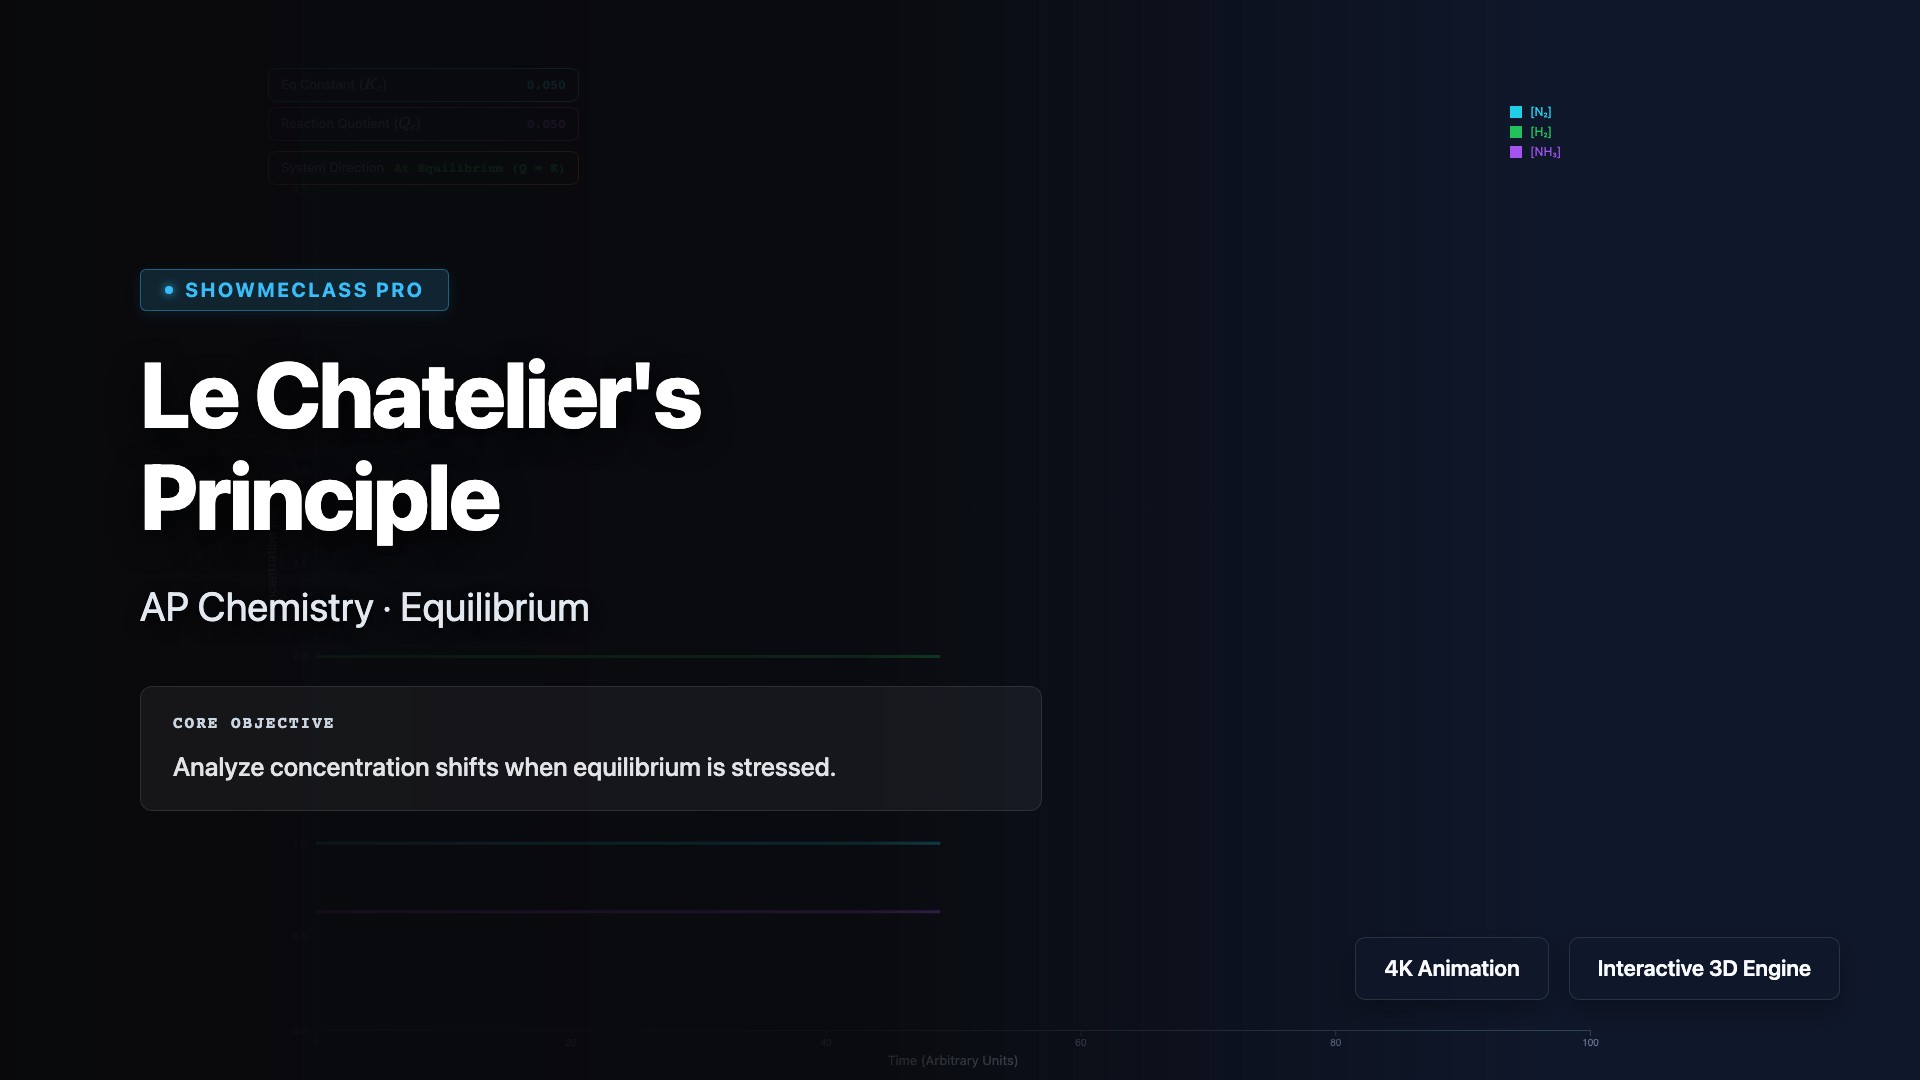
Le Chatelier's Principle
Apply Le Chatelier's Principle to predict how chemical equilibria shift in response to stress. Visualize how changes in concentration, pressure, volume, or temperature cause the system to counteract the disturbance and establish a new equilibrium. Explore the Haber Process for ammonia synthesis, understand why increasing pressure favors fewer moles of gas, and learn how catalysts speed up equilibrium attainment without shifting position.
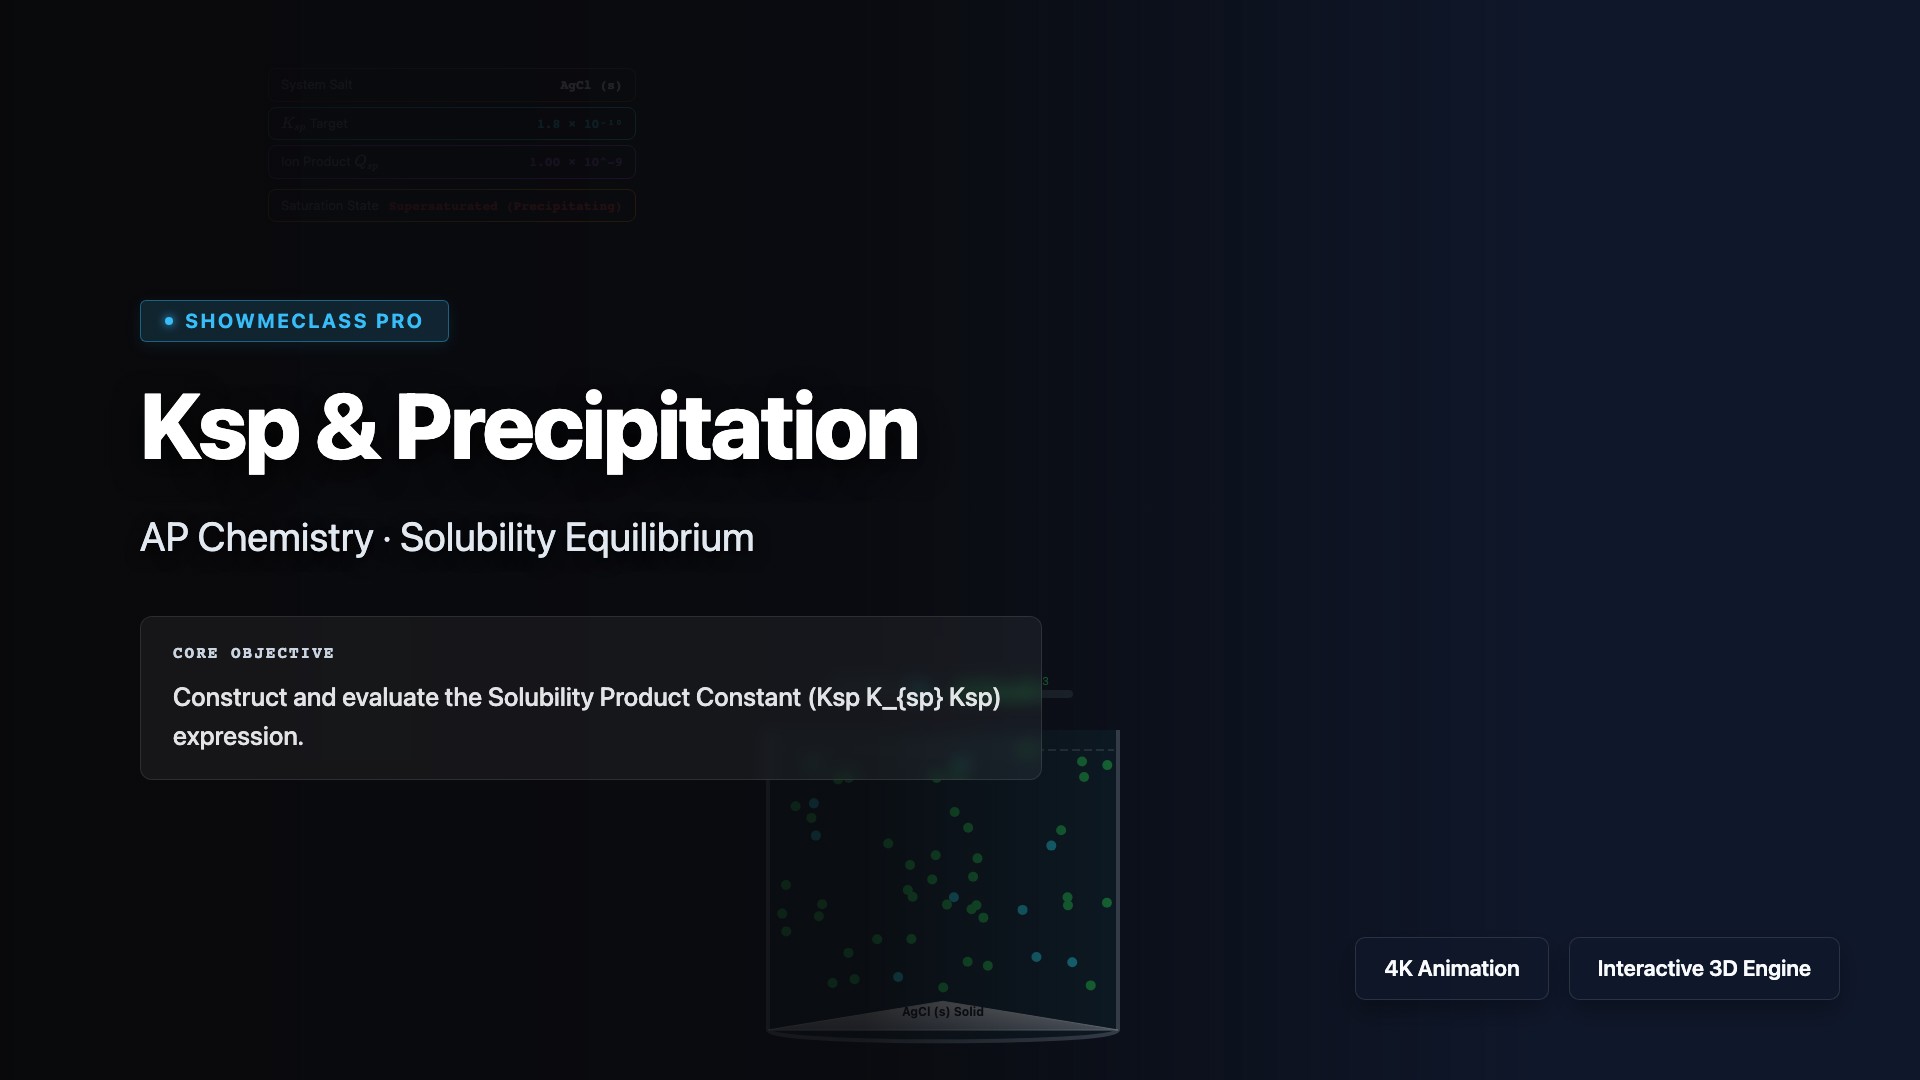
Ksp & Precipitation
Explore the solubility product constant (Ksp) that describes the equilibrium between a solid ionic compound and its dissolved ions. Calculate ion concentrations, predict precipitation using the reaction quotient Q (if Q > Ksp, precipitation occurs), and understand the common ion effect that decreases solubility. Practice solving Ksp problems for various stoichiometries and applying Le Chatelier's principle to solubility equilibria.
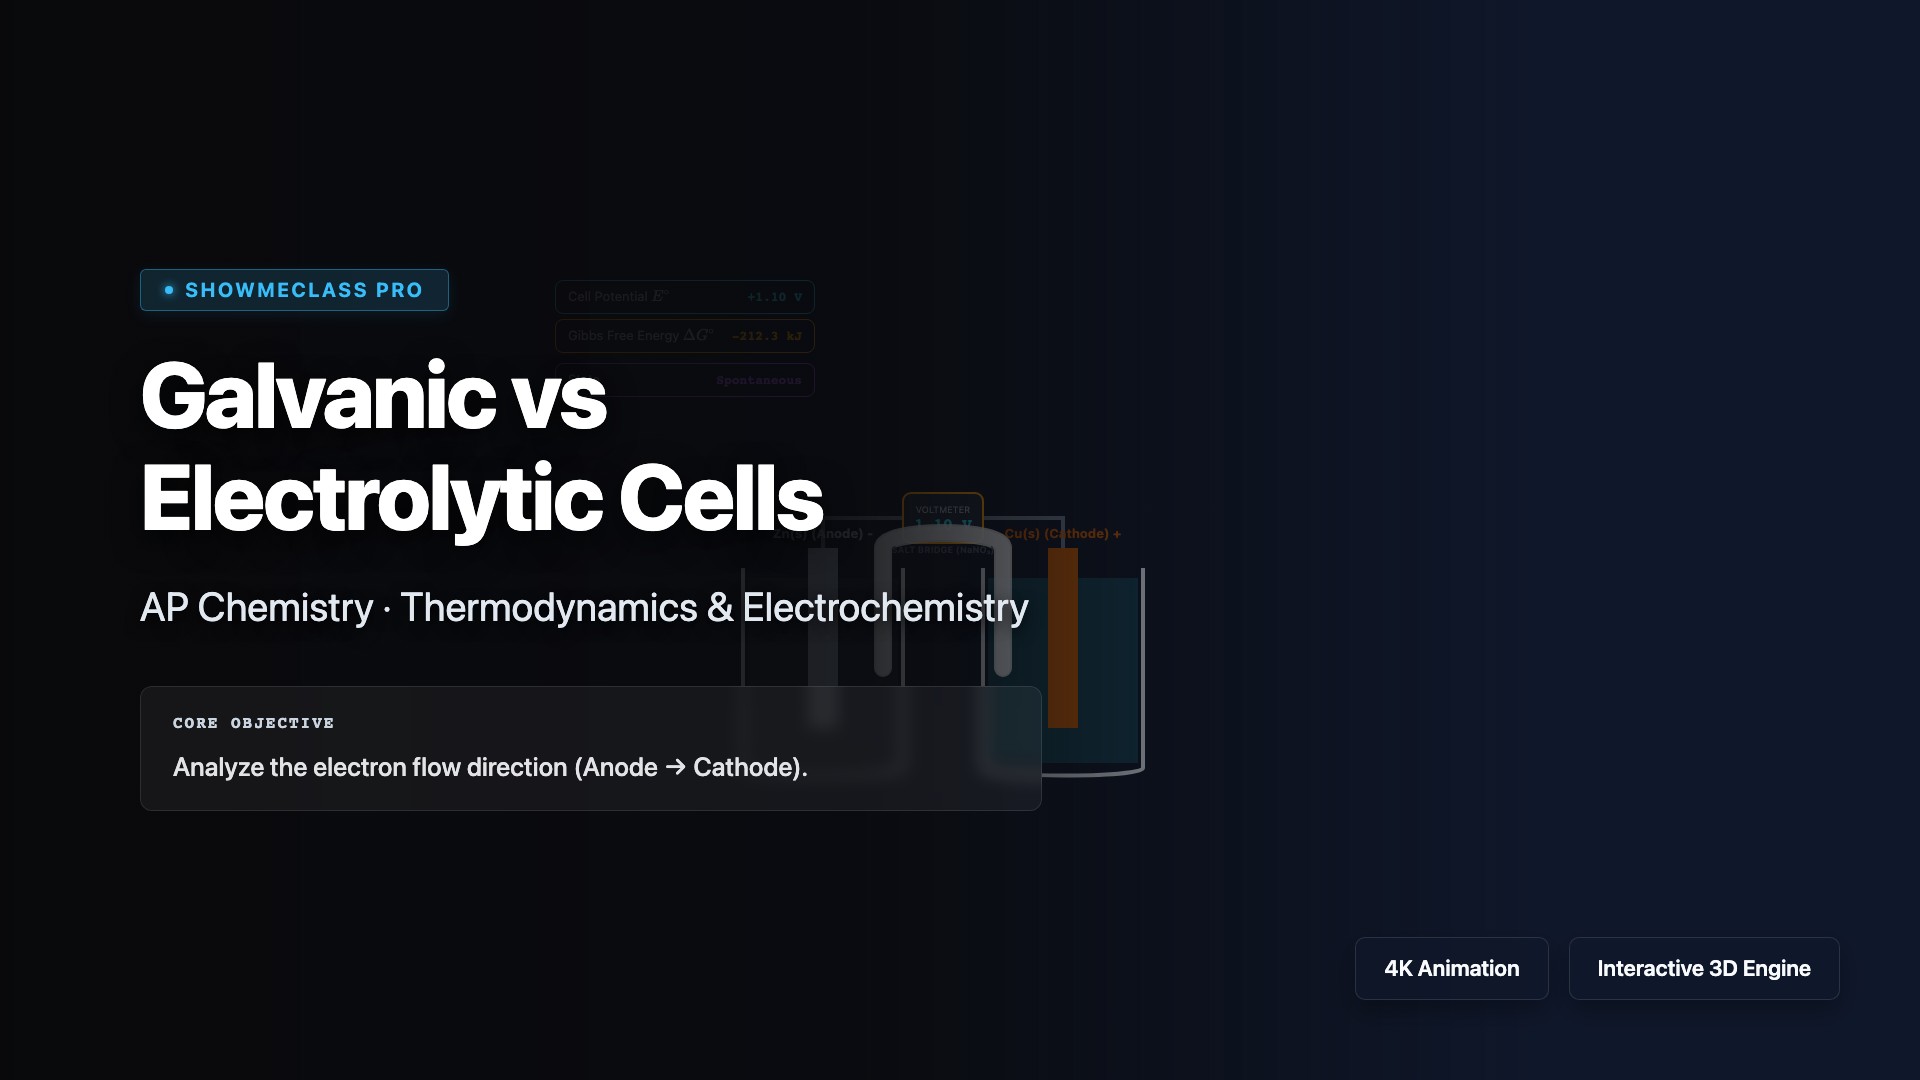
Galvanic vs Electrolytic Cells
Compare galvanic cells (spontaneous, ΔG < 0, generate electricity) with electrolytic cells (non-spontaneous, ΔG > 0, require external voltage). Visualize how galvanic cells convert chemical energy to electrical energy in batteries, while electrolytic cells use electrical energy to drive non-spontaneous reactions in electroplating, electrolysis, and metal purification. Understand electrode polarity differences and the role of external power sources.
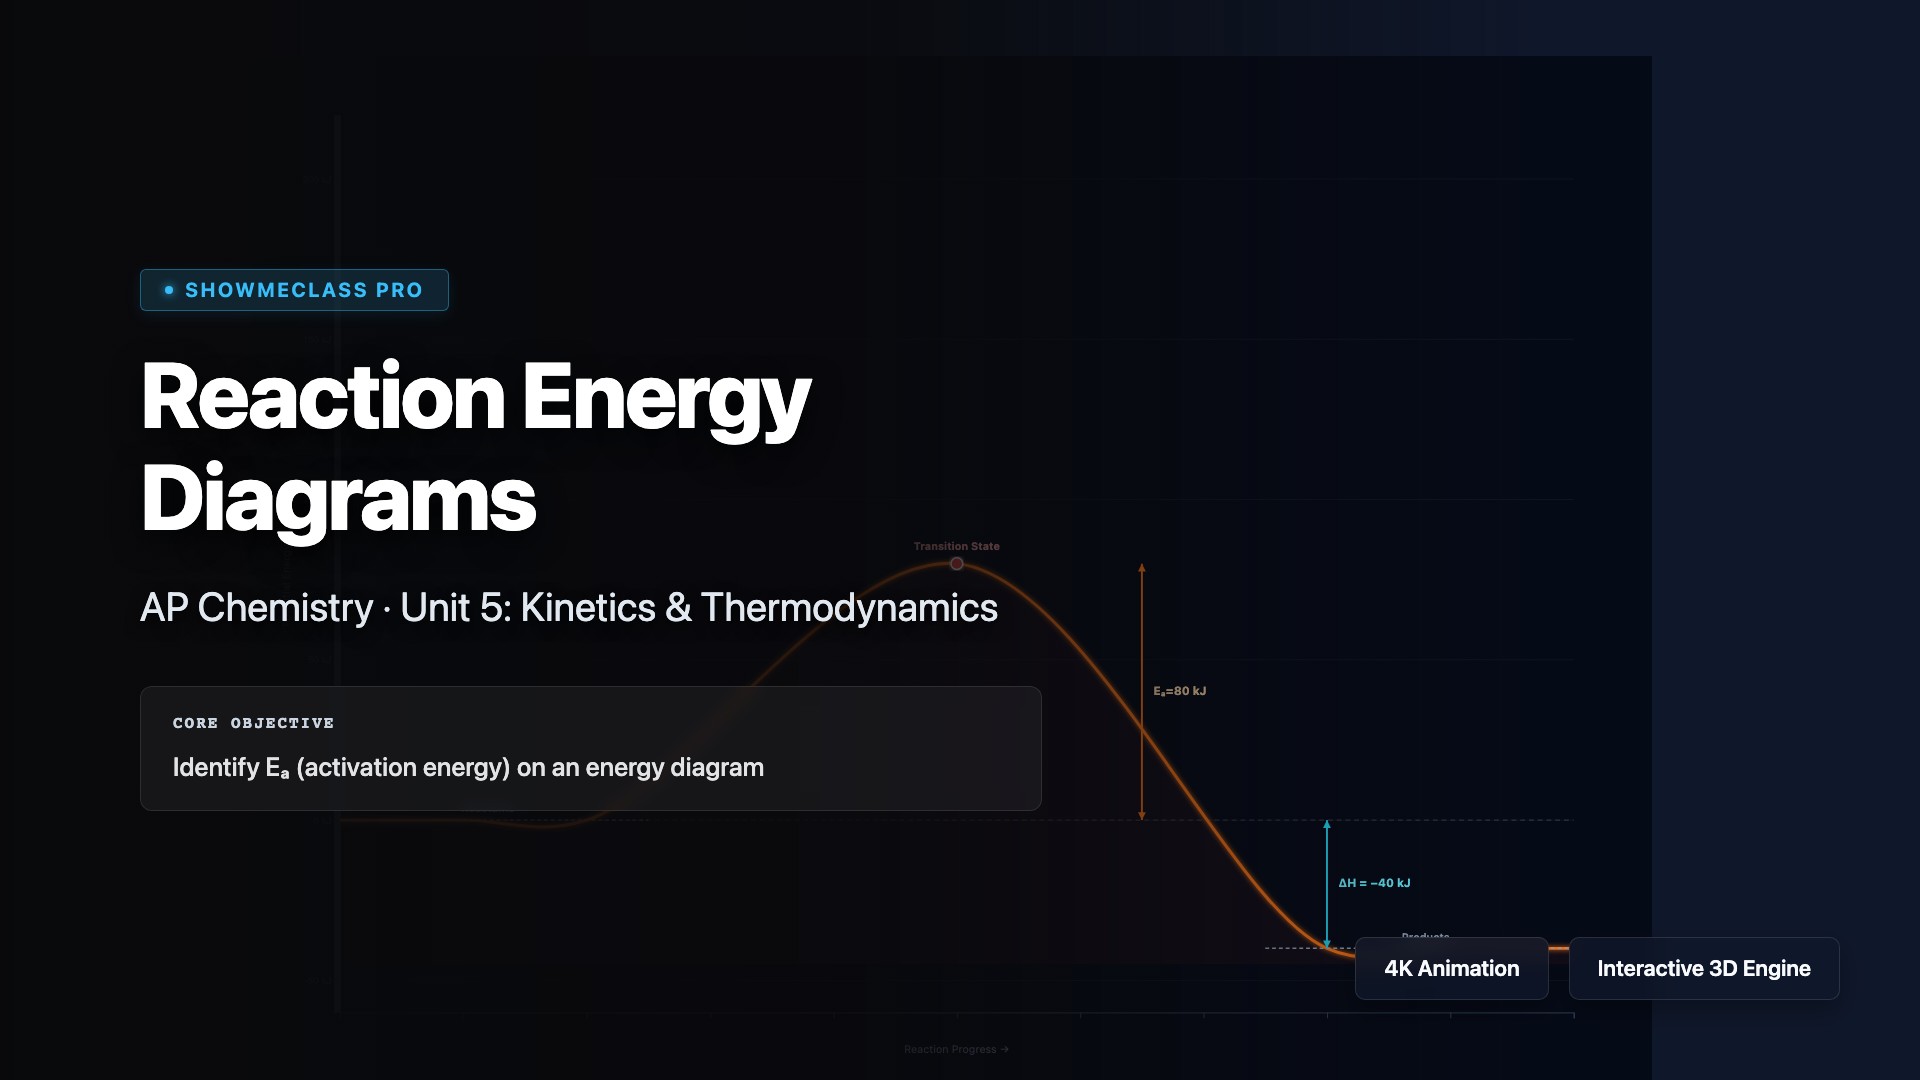
Reaction Energy Diagrams
Visualize reaction energy diagrams that plot potential energy versus reaction progress. Identify reactants, products, transition states, activation energy (Ea), and enthalpy change (ΔH). Understand how exothermic reactions release energy (ΔH < 0) while endothermic reactions absorb energy (ΔH > 0), and how catalysts lower activation energy without changing ΔH, thereby increasing reaction rate.
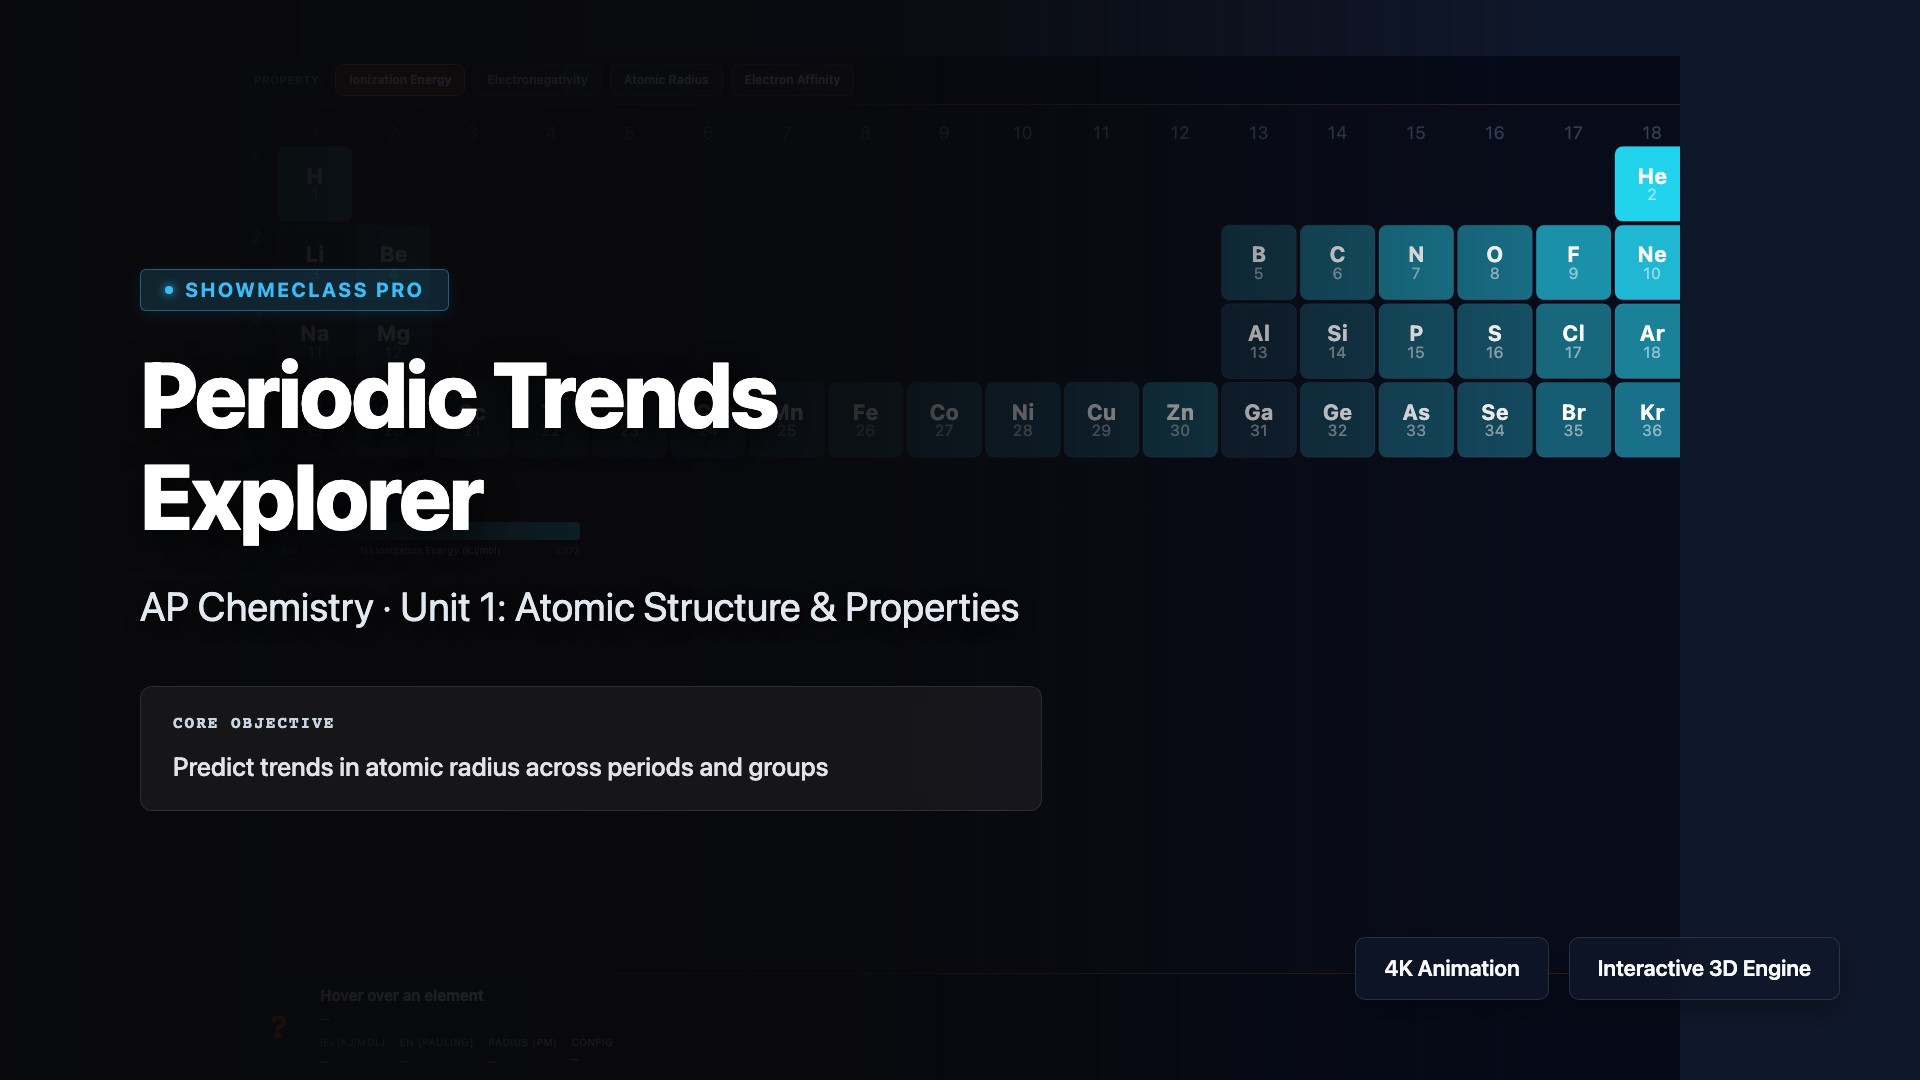
Periodic Trends Explorer
Explore periodic trends including atomic radius, ionic radius, ionization energy, electron affinity, and electronegativity across periods and down groups. Understand how effective nuclear charge (Zeff) and shielding explain why atomic radius decreases across a period but increases down a group, why ionization energy increases across a period, and how these trends predict chemical reactivity and bonding behavior.

VSEPR Molecular Geometry
Explore 3D molecular geometries for common electron-domain configurations. Rotate and inspect tetrahedral, trigonal planar, linear, octahedral, and bent structures. Understand how lone pairs distort ideal bond angles.
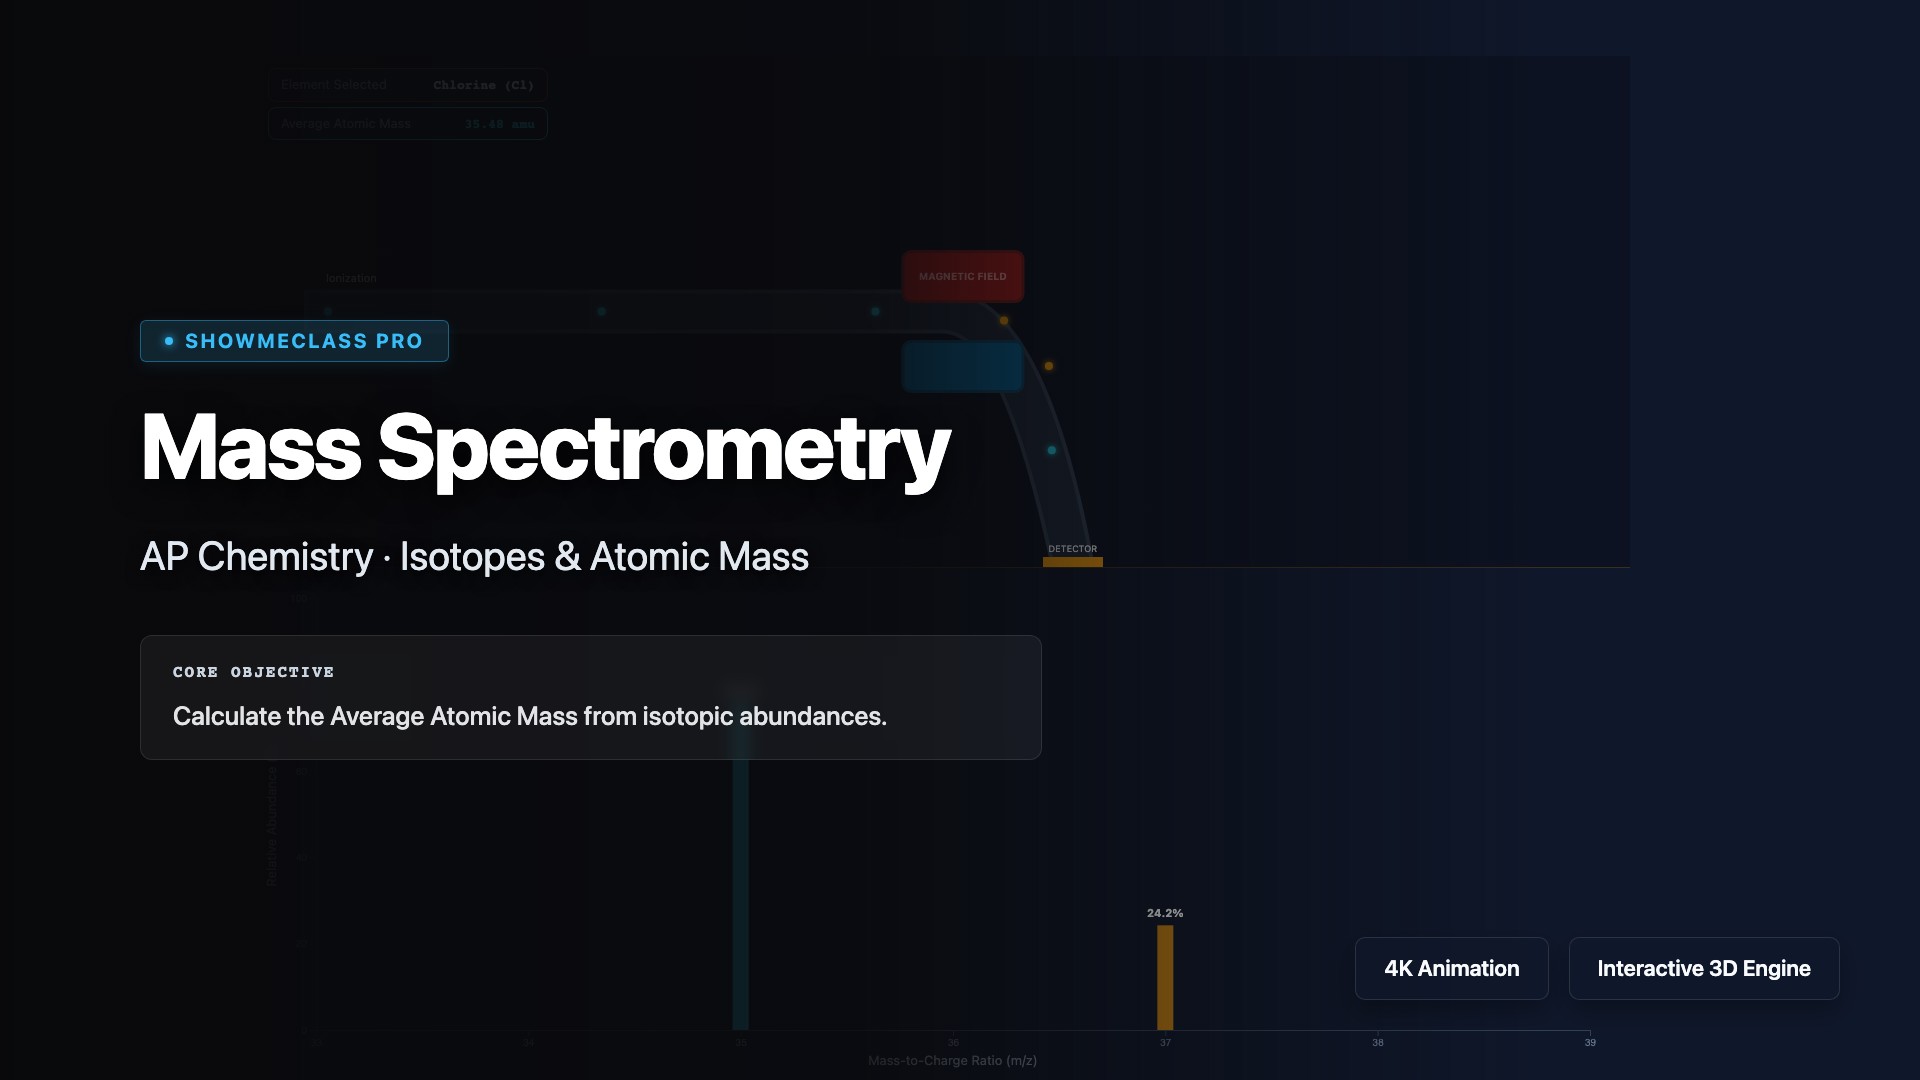
Mass Spectrometry
Analyze mass spectra to determine isotopic composition and calculate average atomic mass. Visualize how mass spectrometry ionizes atoms, separates ions by mass-to-charge ratio (m/z), and detects relative abundances. Practice interpreting mass spectrum peaks to identify isotopes, calculate weighted average atomic mass using (mass × abundance) for each isotope, and understand applications in identifying unknown compounds and determining molecular formulas.
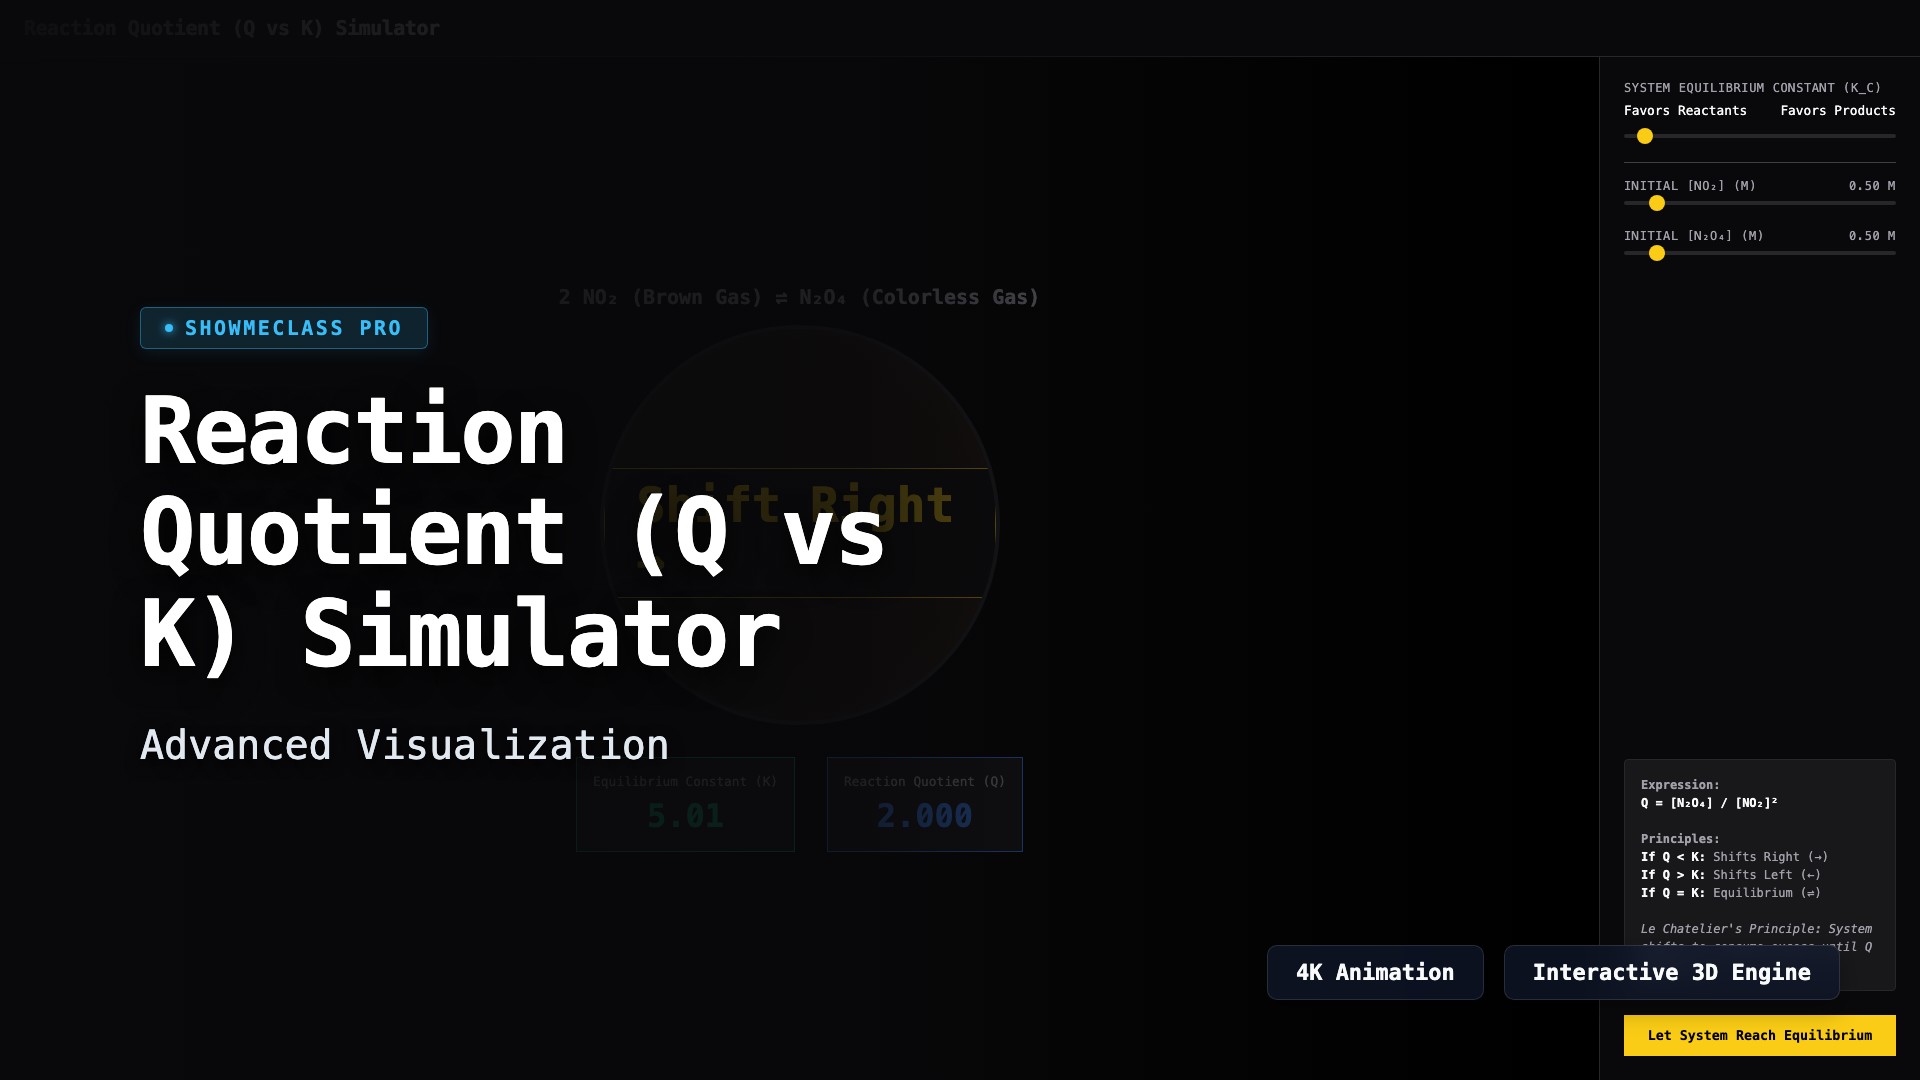
Reaction Quotient (Q vs K) Simulator
Determine the direction of equilibrium shifts using Le Chatelier's Principle. Visualize the theoretical NO2/N2O4 system and click to solve for roots to snap directly into theoretical dynamic equilibrium.
Intermolecular Forces & Phase Changes
Visually compare London Dispersion, Dipole-Dipole, and Hydrogen Bonding. Manipulate kinetic thermal energy to watch how differences in IMF strength determine exact melting and boiling point thresholds.
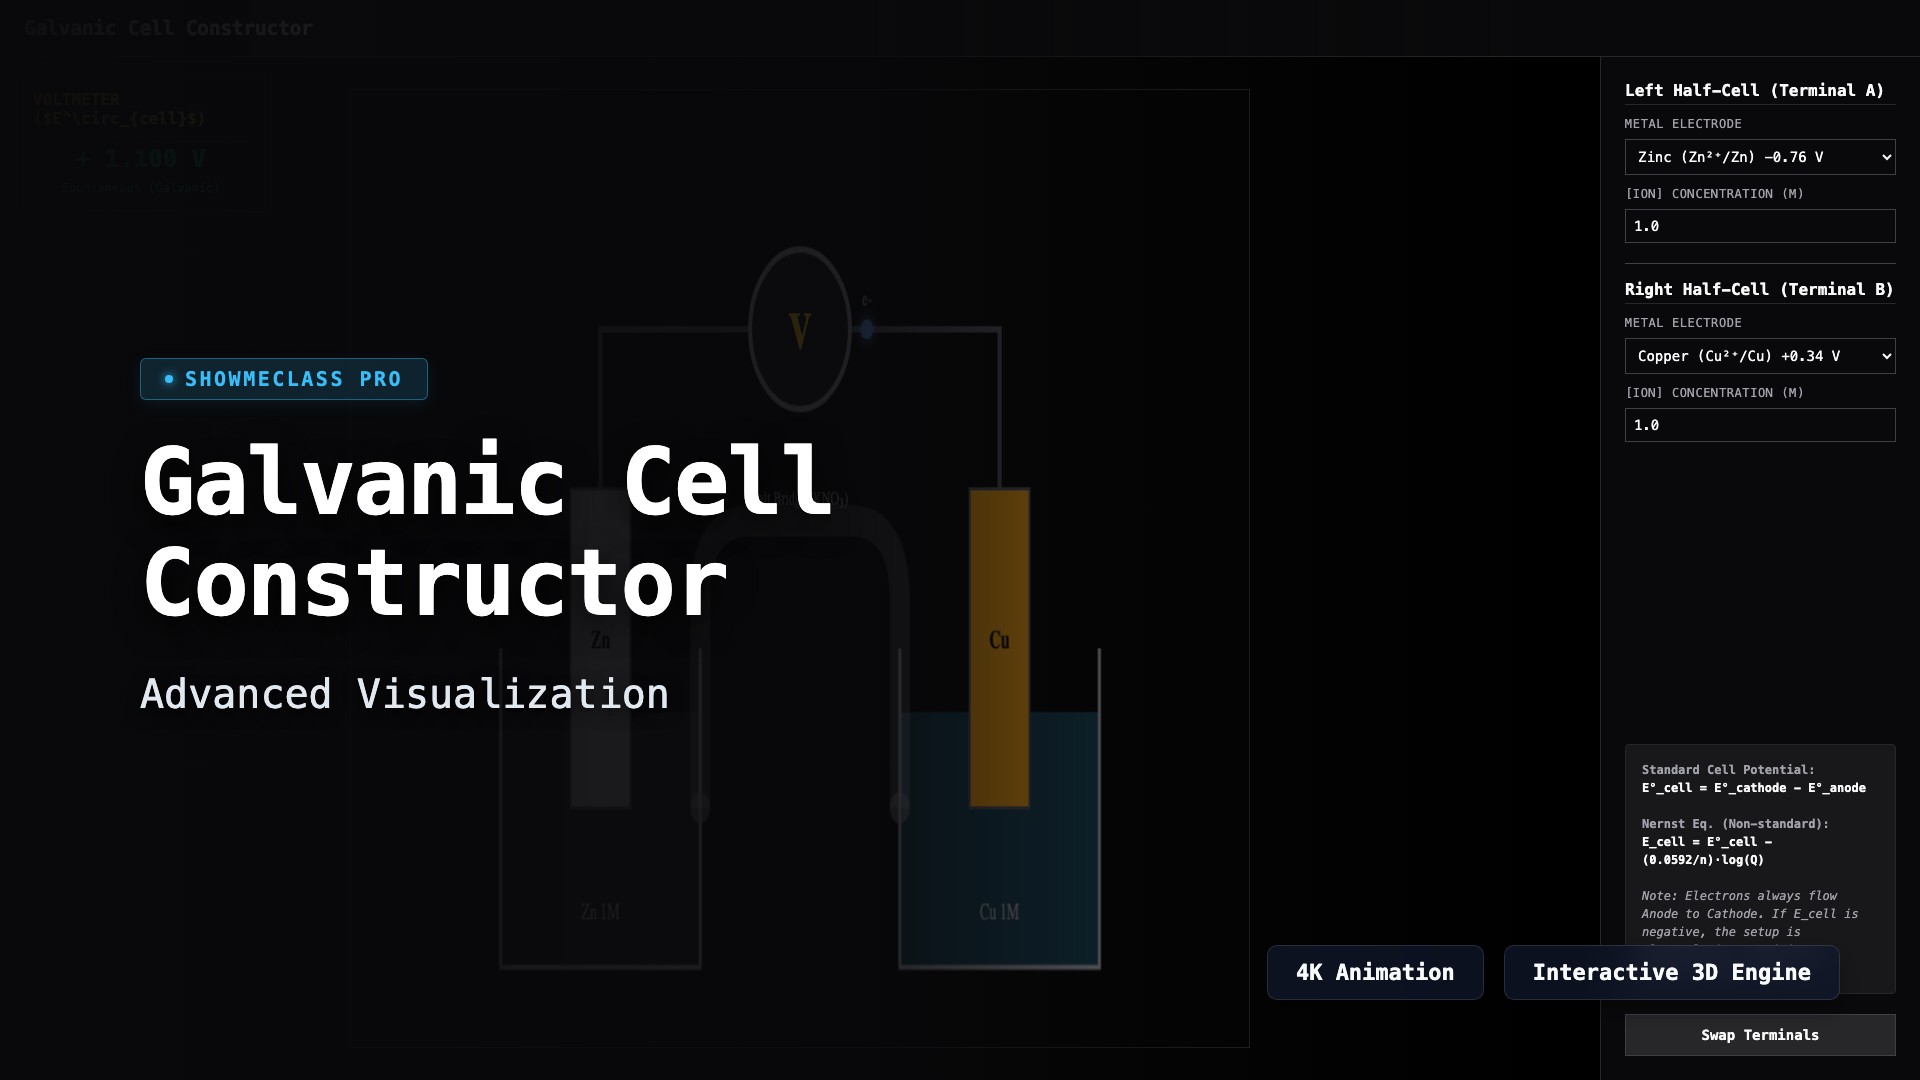
Galvanic Cell Constructor
Construct custom voltaic circuits using Zn, Cu, and Ag half-cells. The simulator utilizes real Standard Reduction Potentials and applies the Nernst Equation to calculate cell potential dynamically across varying molarities.
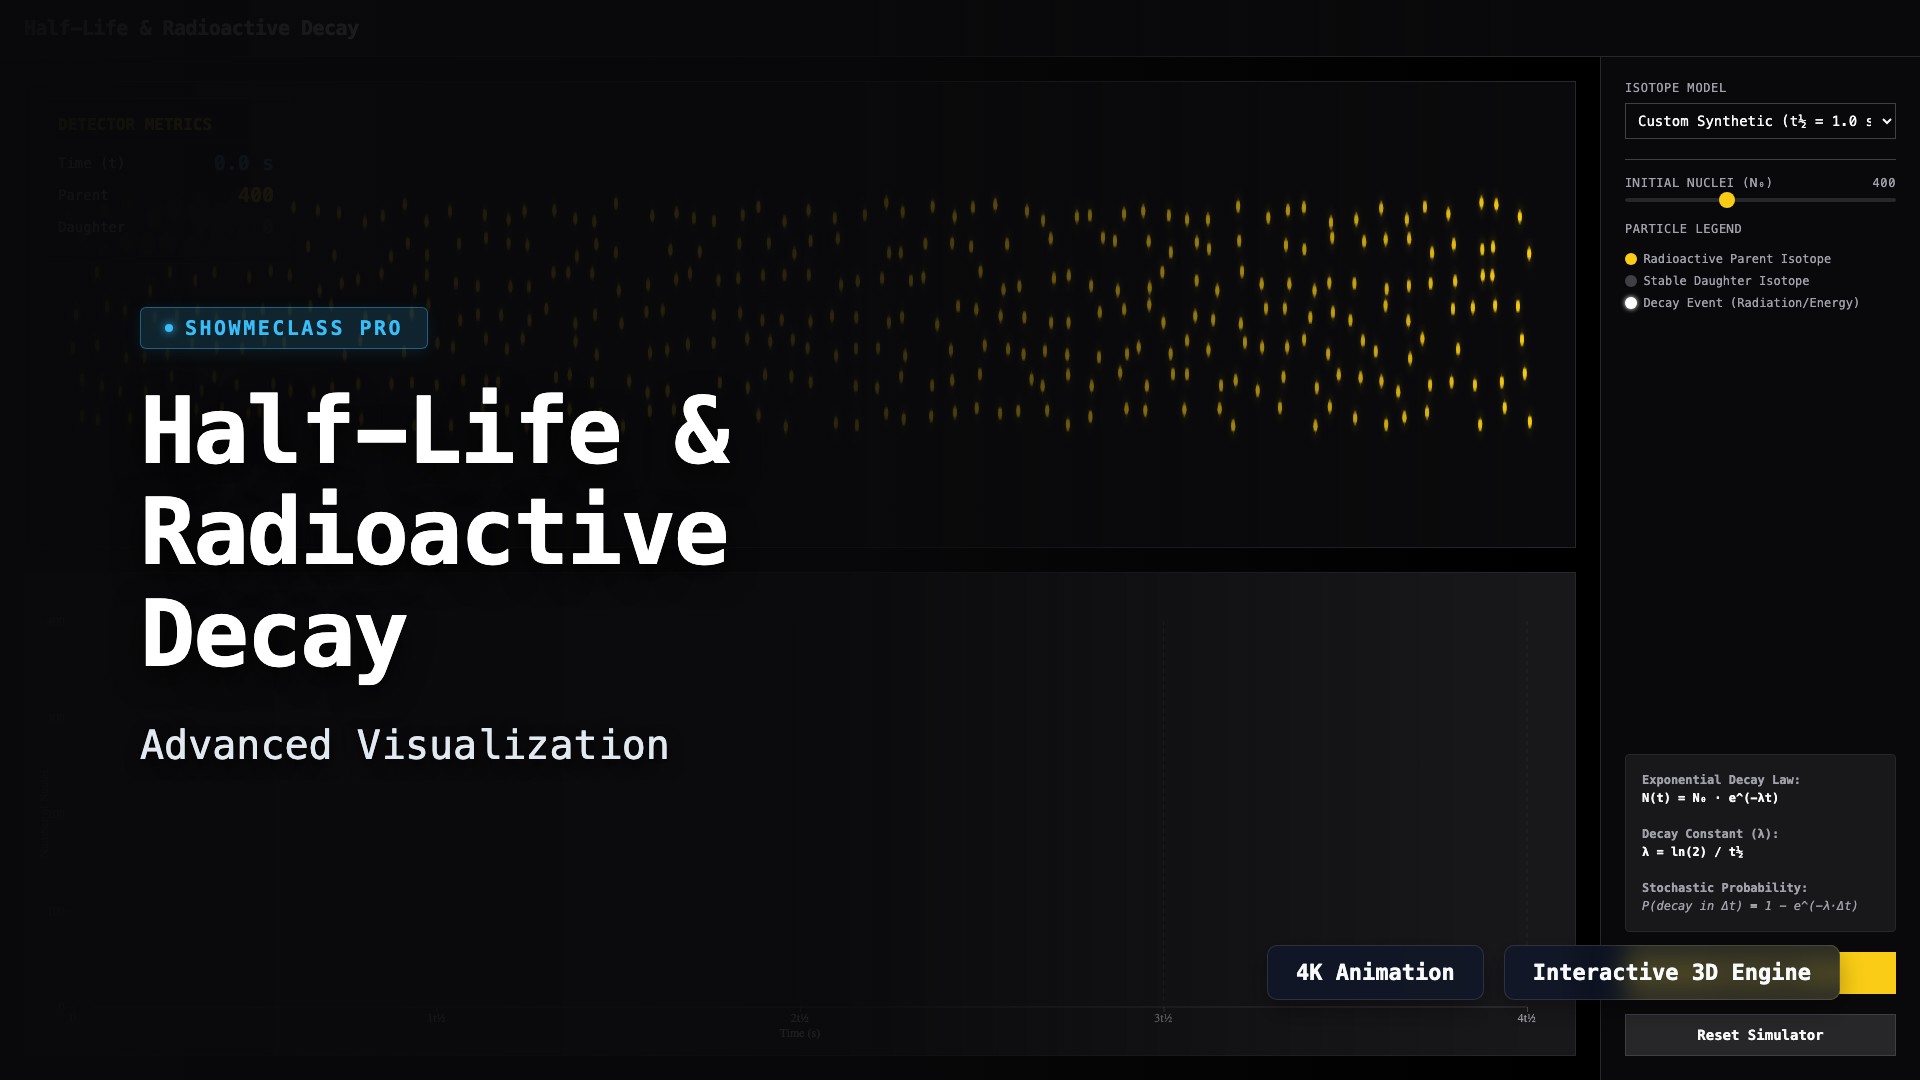
Half-Life & Radioactive Decay
Visualize stochastic exponential decay mapped against N(t) mathematical algorithms. Track Parent and Daughter isotope accumulation across customized half-lives in a real-time flashing particle engine.
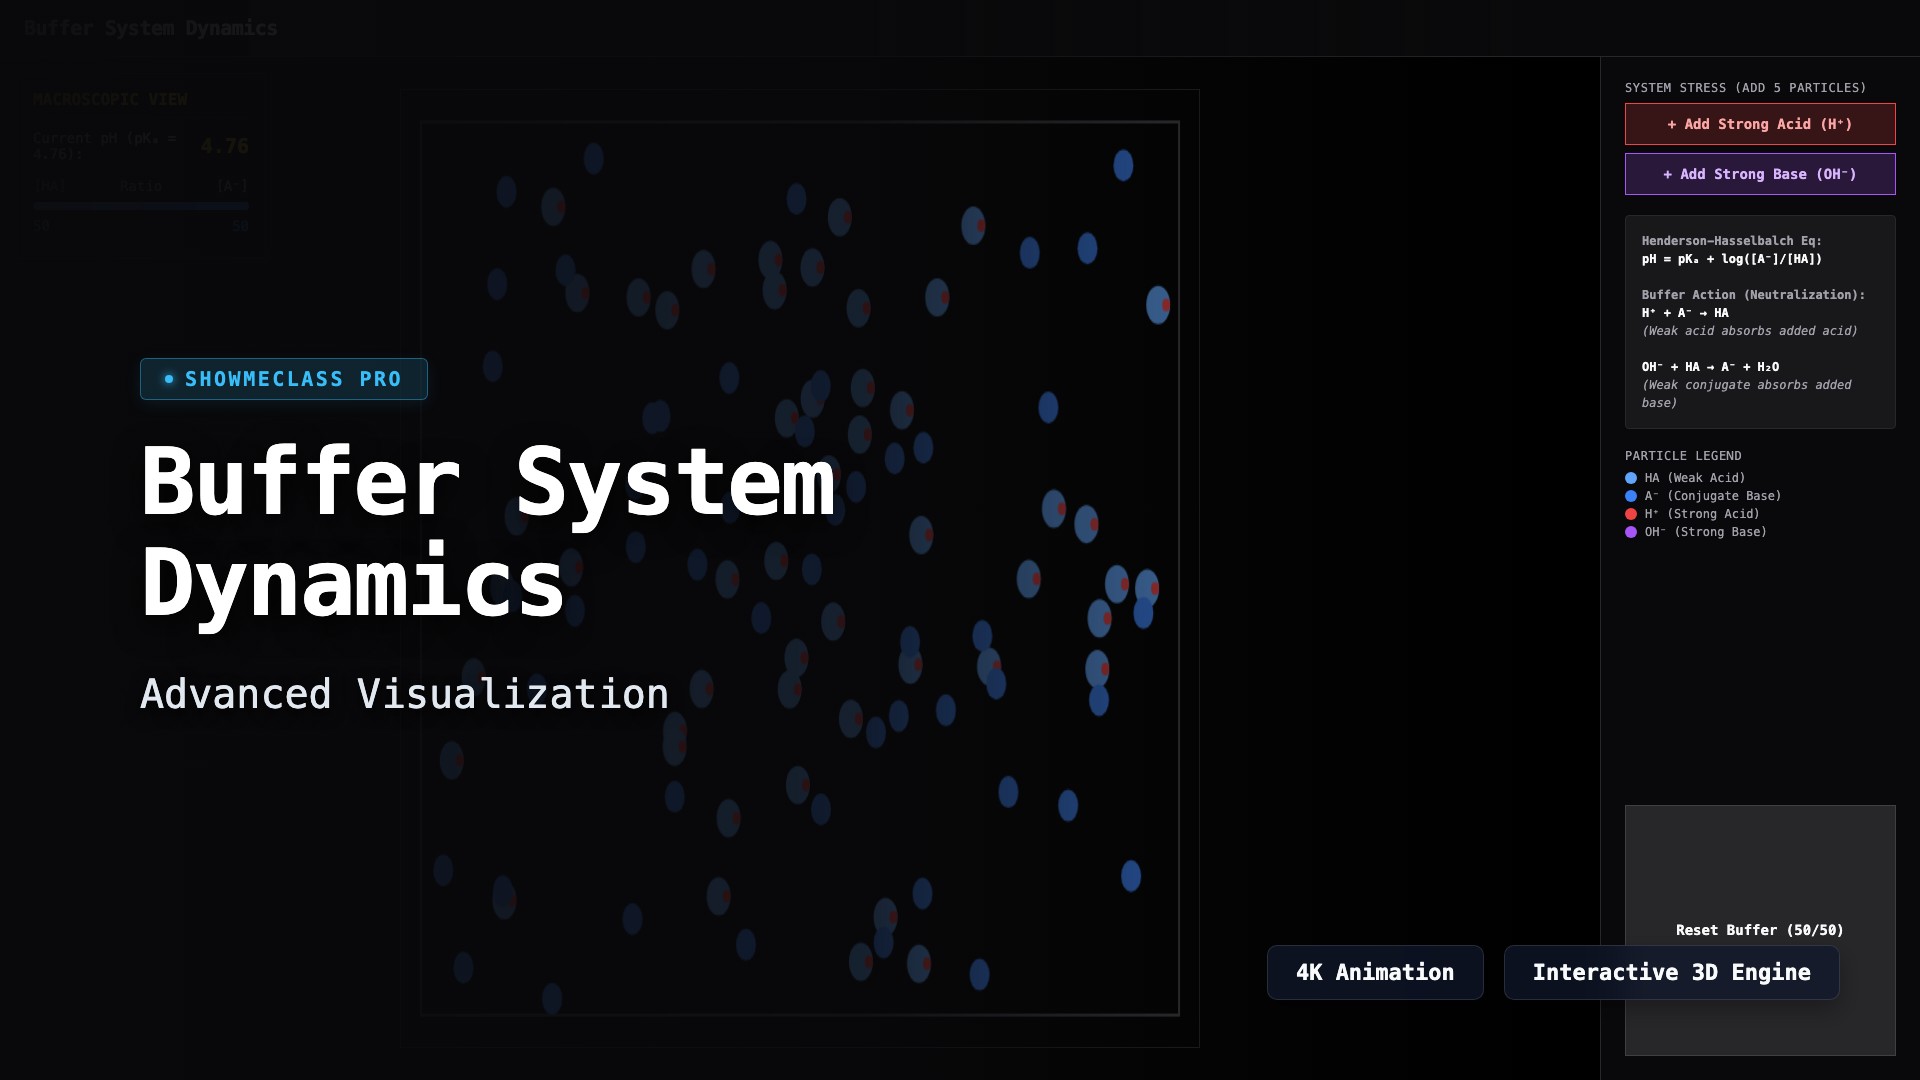
Buffer System Dynamics
Visualize a macroscopic particle-level buffer system reacting to the influx of strong acids (H⁺) or strong bases (OH⁻). Observe Henderson-Hasselbalch equations dynamically adapt as the buffer capacity successfully resists dramatic pH changes.
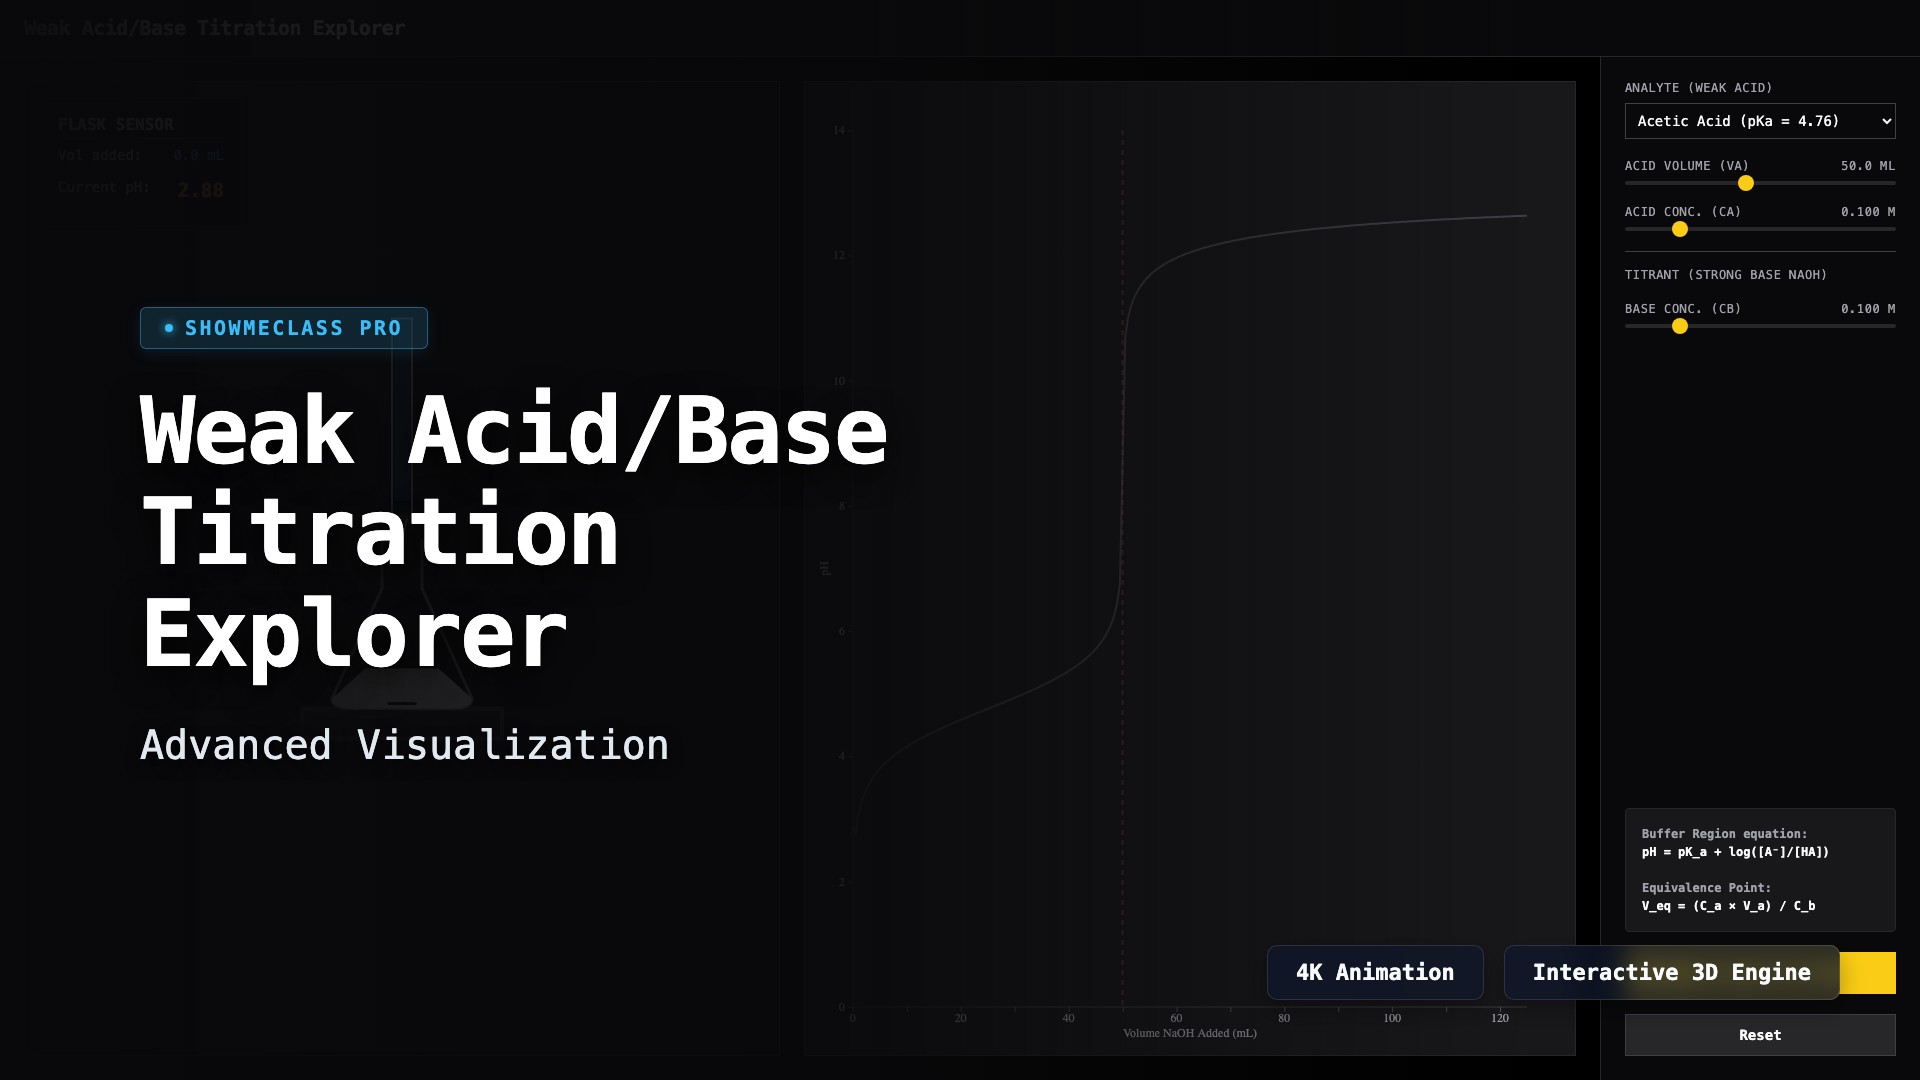
Weak Acid/Base Titration Explorer
Perform a simulated titration dropping strong base into a weak acid. The simulator mathematically calculates real-time buffer regions, half-equivalence points, and post-equivalence spikes dynamically, plotting the exact sigmoidal pH titration curve.
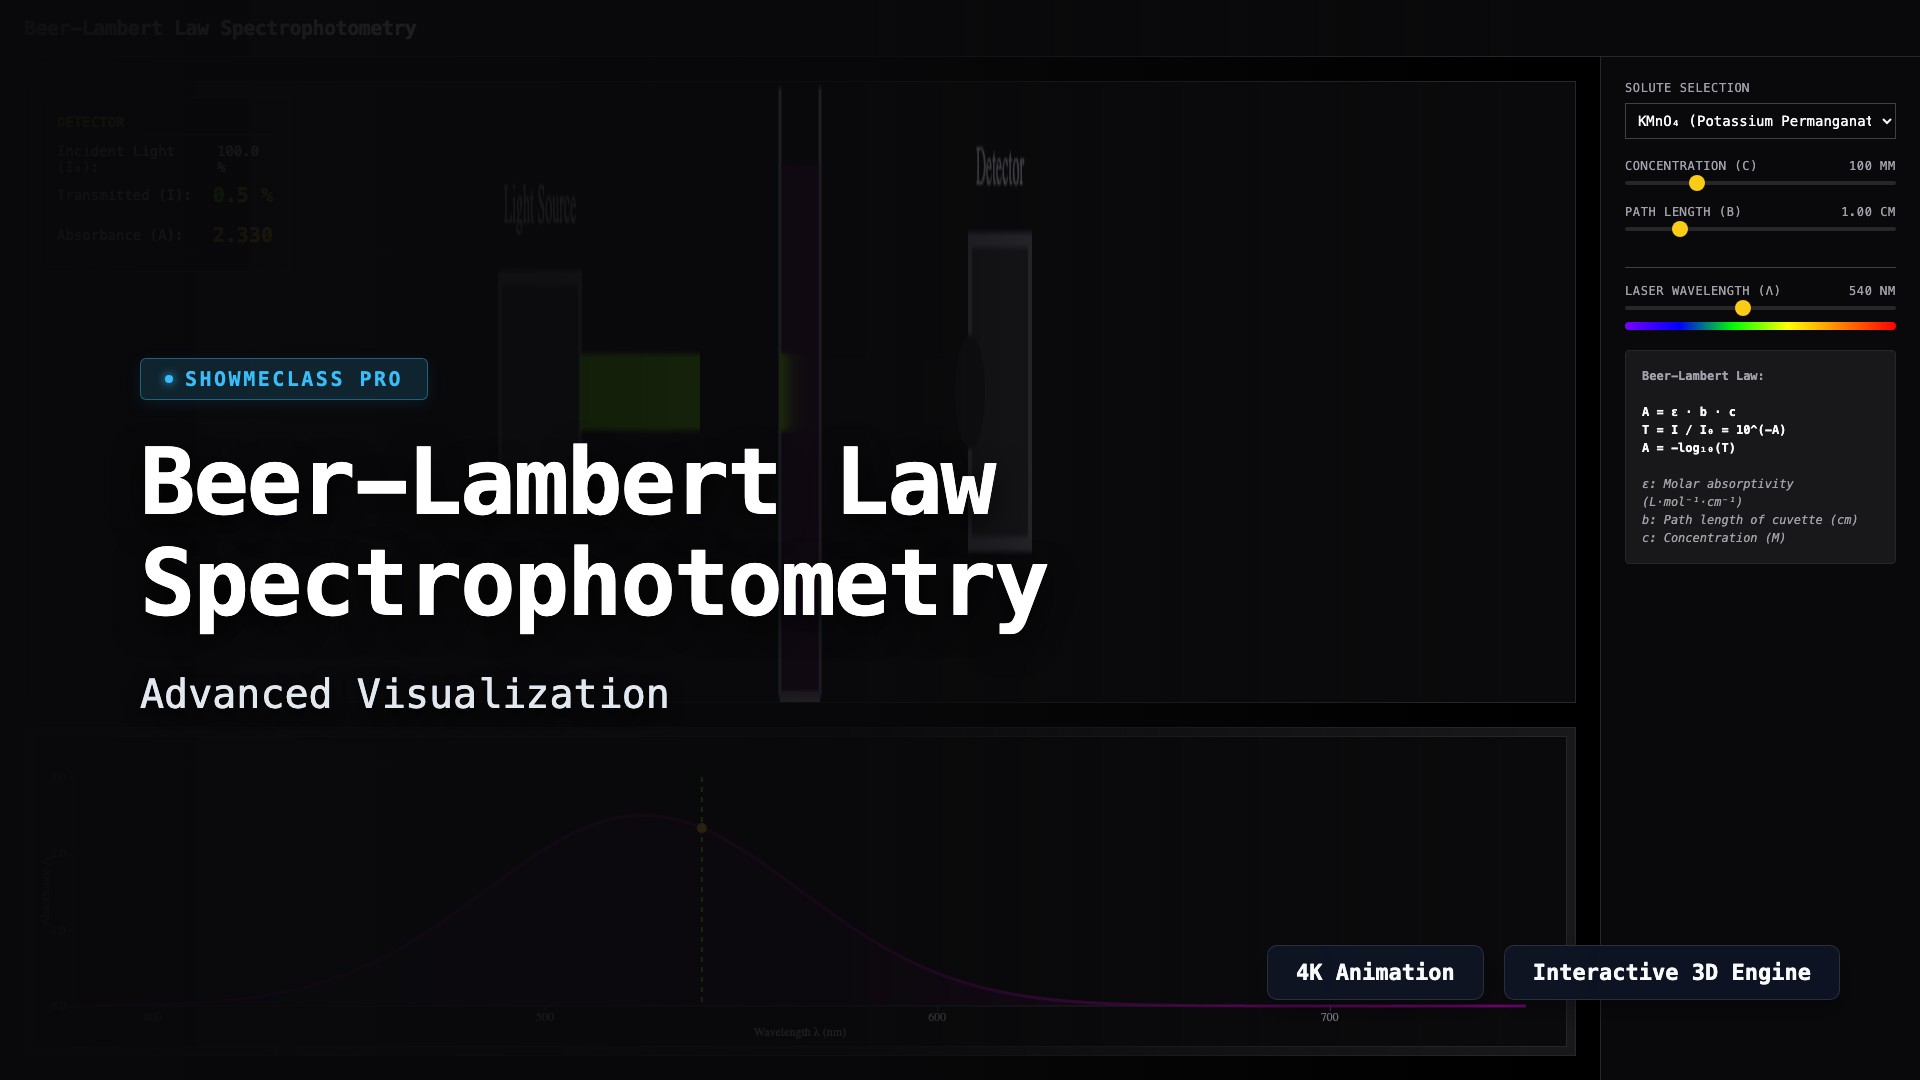
Beer-Lambert Law Spectrophotometry
Visualize the principles of spectrophotometry. Adjust wavelength, concentration, and cuvette path length to observe how light absorption changes dynamically according to the Beer-Lambert Law.
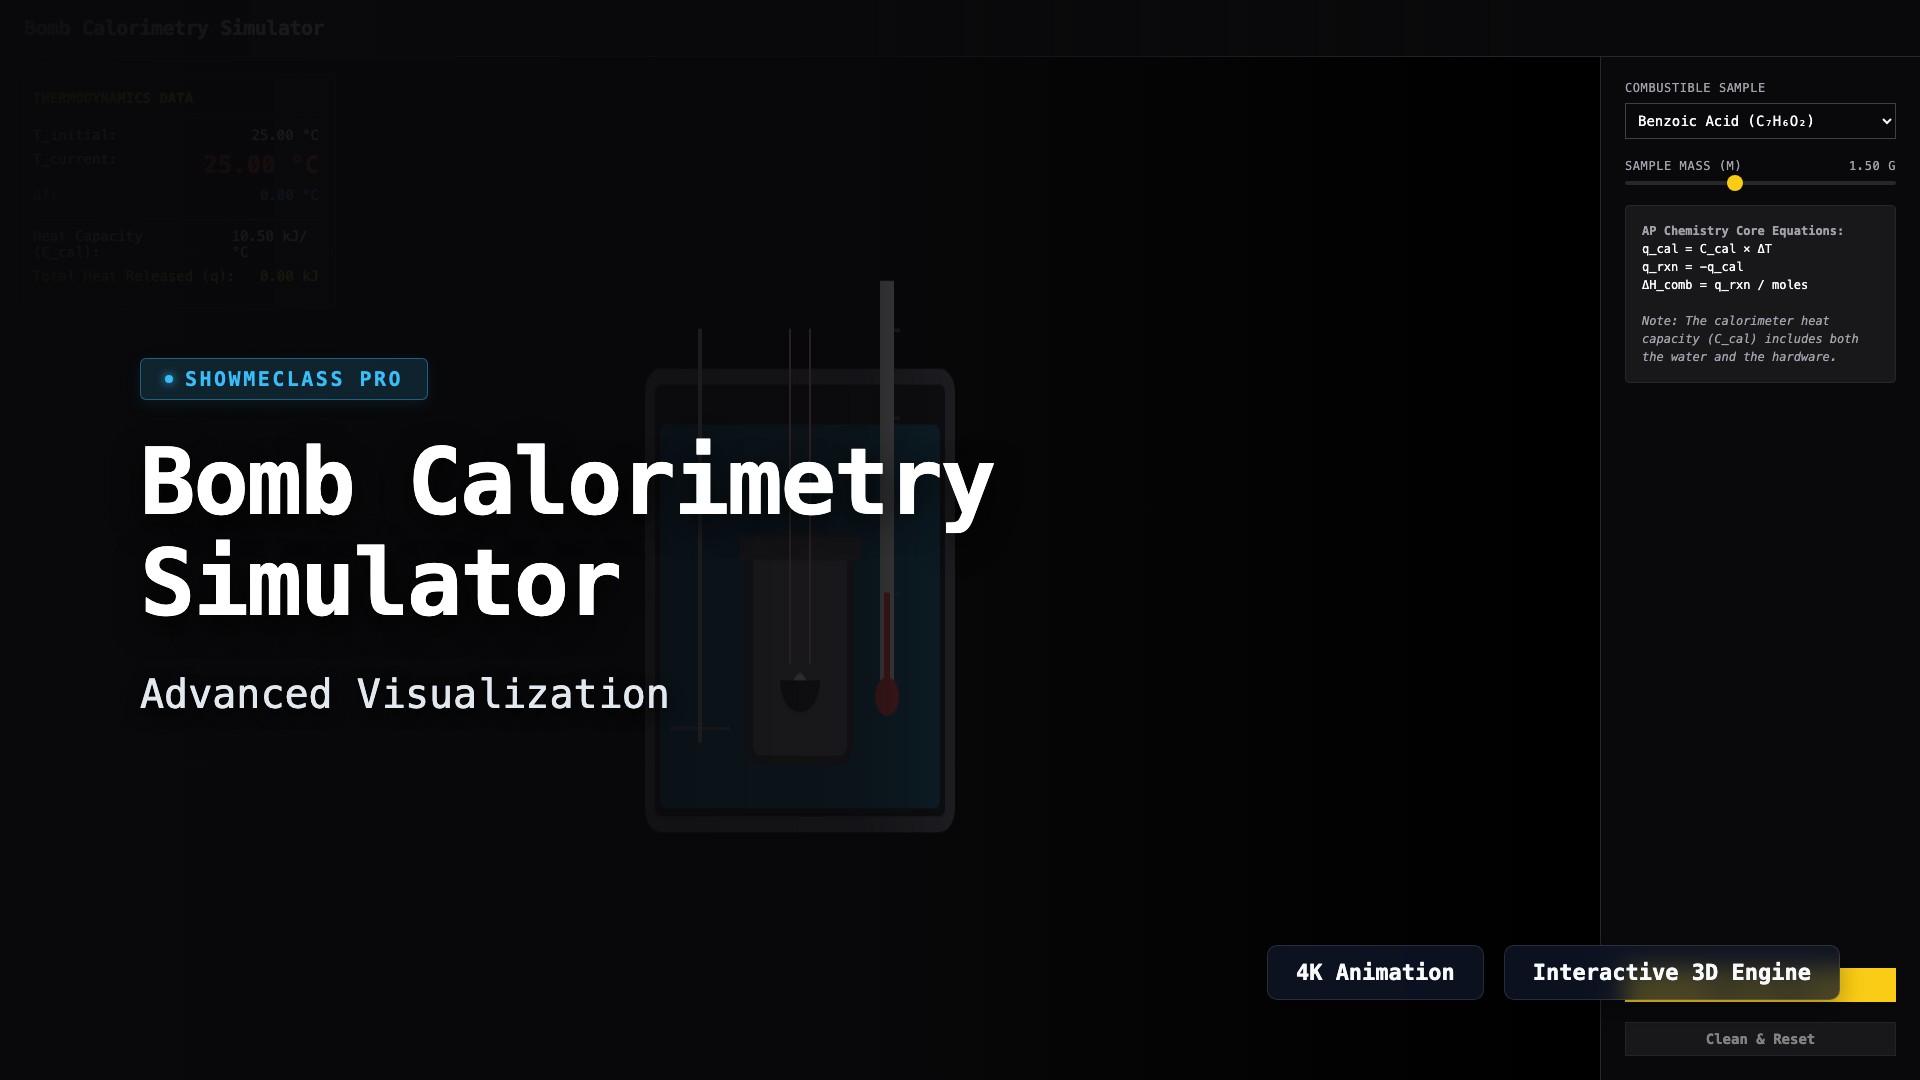
Bomb Calorimetry Simulator
Simulate a constant-volume bomb calorimeter to compute the molar heat of combustion (ΔH_comb). Ignite different organic samples and dynamically measure the highly precise temperature rise to calculate the heat absorbed by the system.
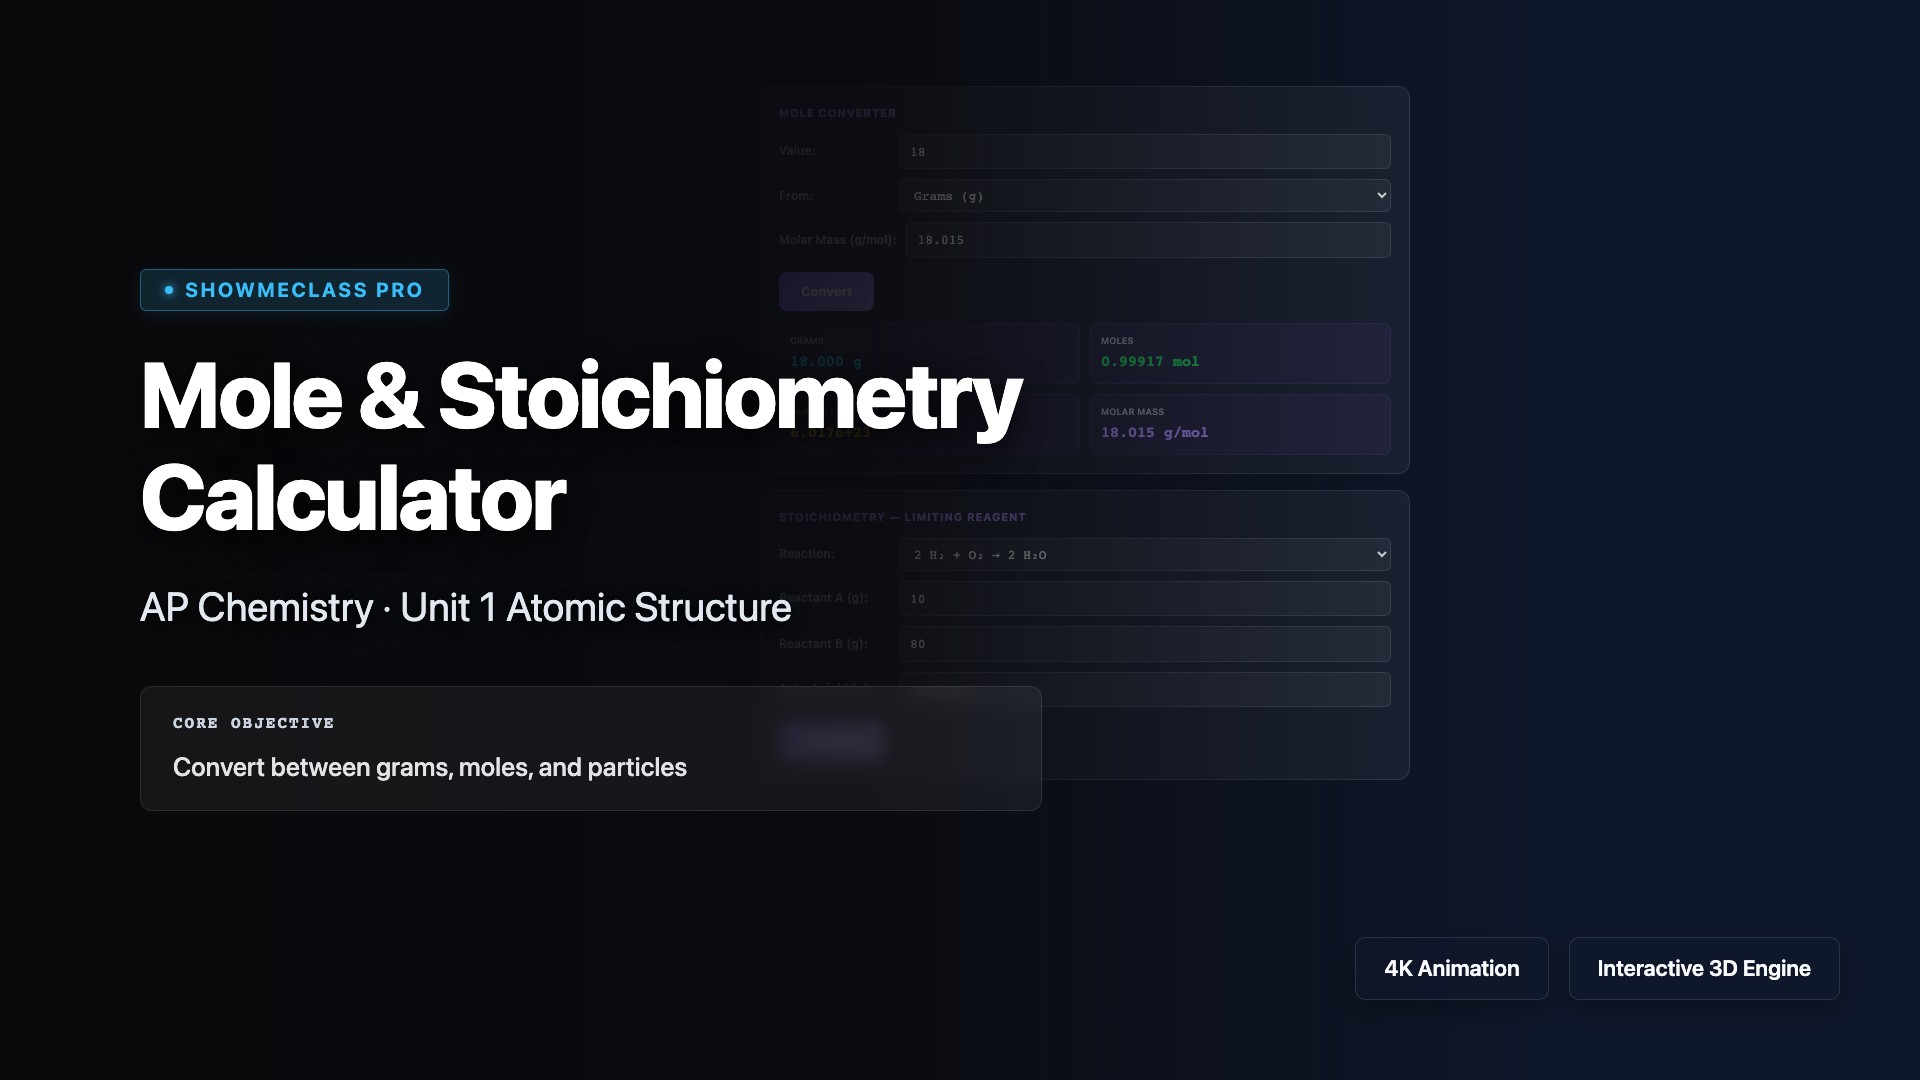
Mole Concept & Stoichiometry Calculator
Convert between grams, moles, and particles. Determine limiting/excess reagents with 4 preset reactions. Calculate theoretical yield and percent yield.
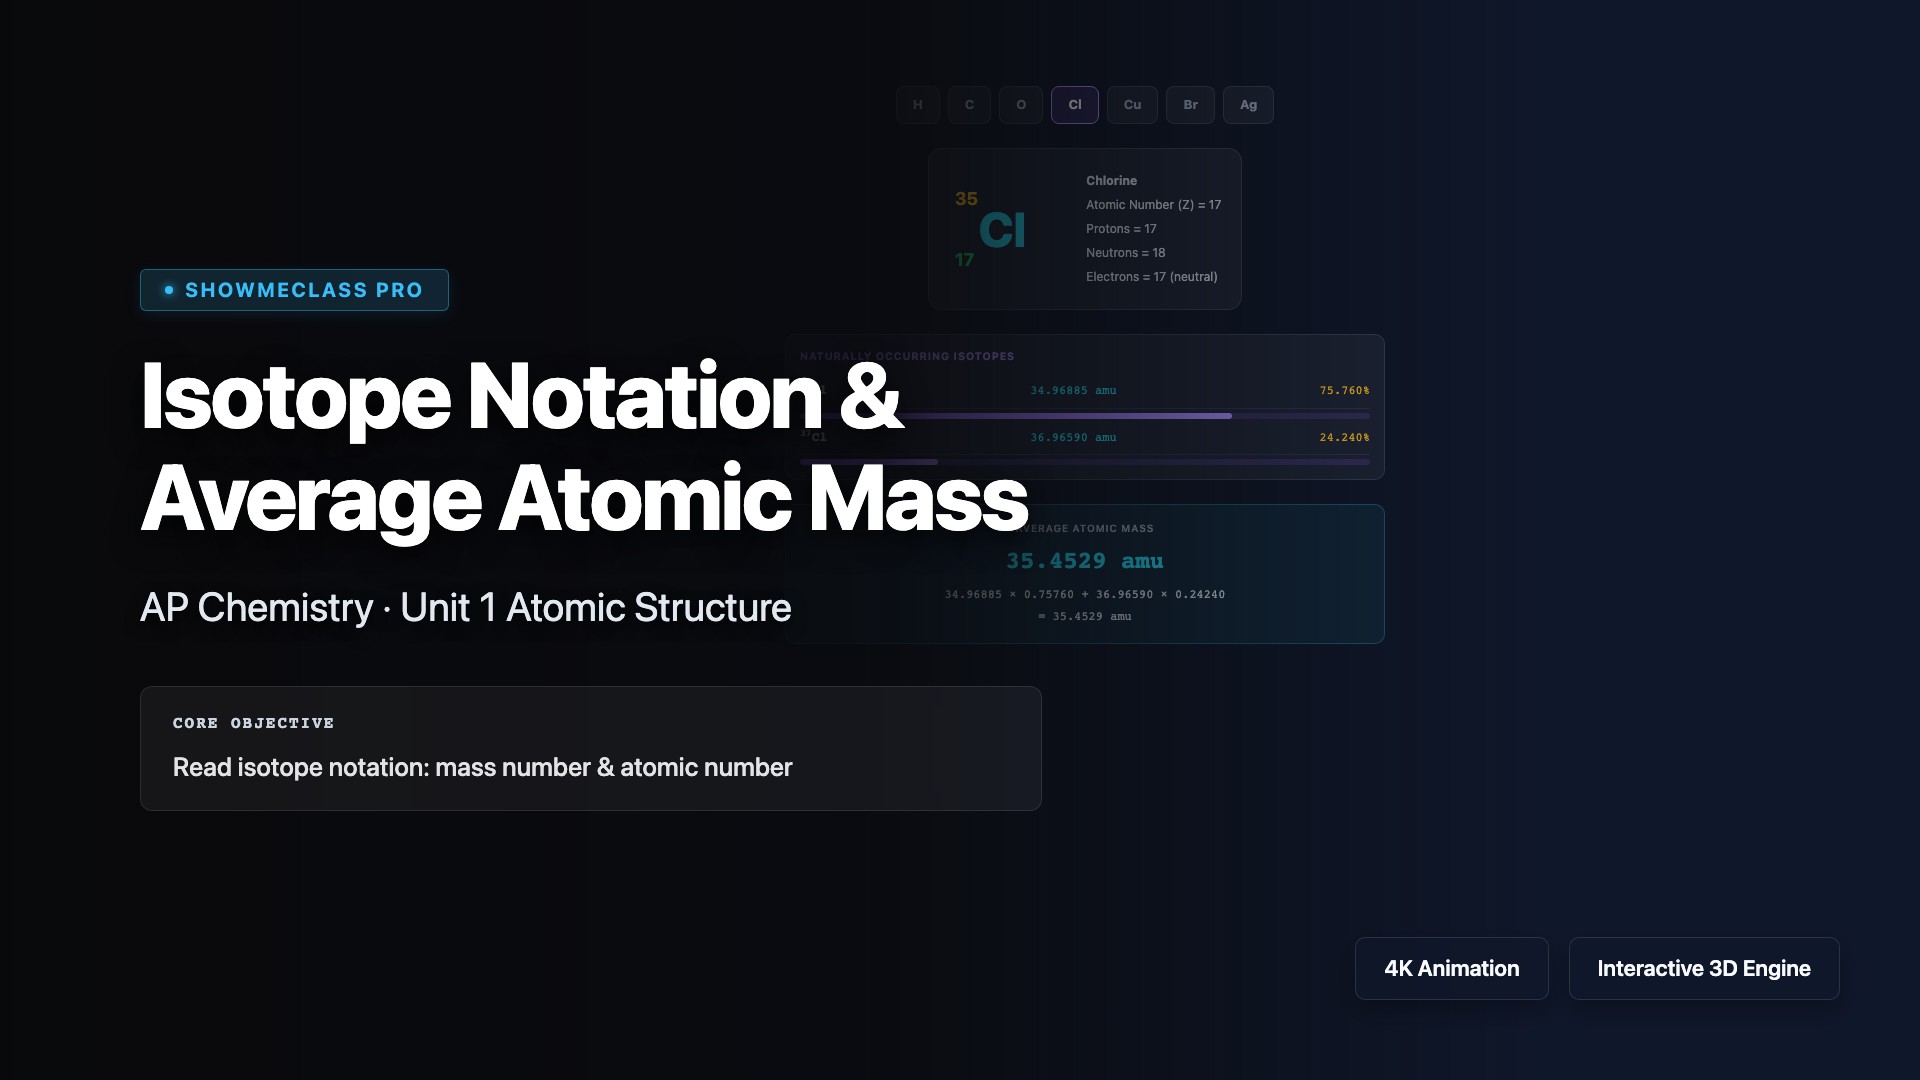
Isotope Notation & Average Atomic Mass
Explore isotope notation for 7 elements. See mass number, atomic number, proton/neutron counts, and calculate weighted average atomic mass from natural abundances.
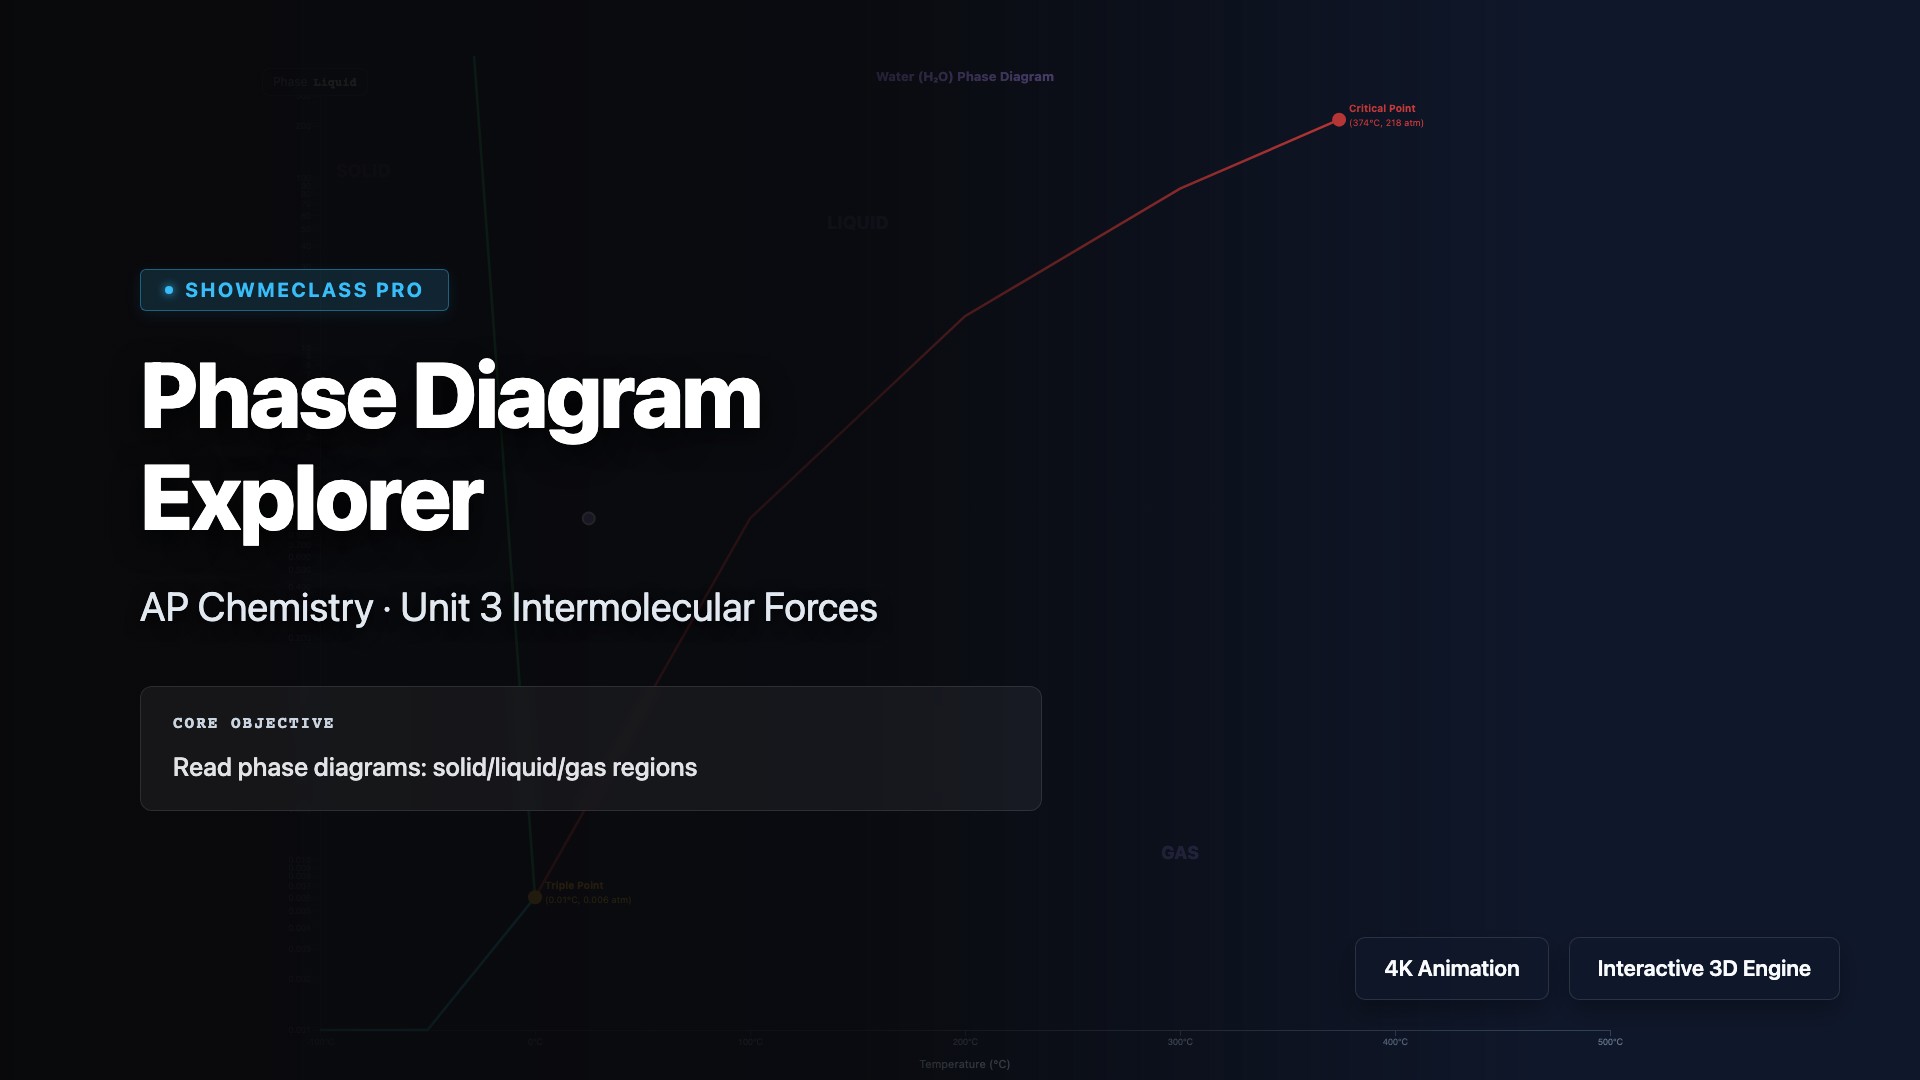
Phase Diagram Explorer
Interactive phase diagrams for H₂O and CO₂. Explore triple points, critical points, and supercritical fluid regions. Identify the phase at any T,P coordinate.
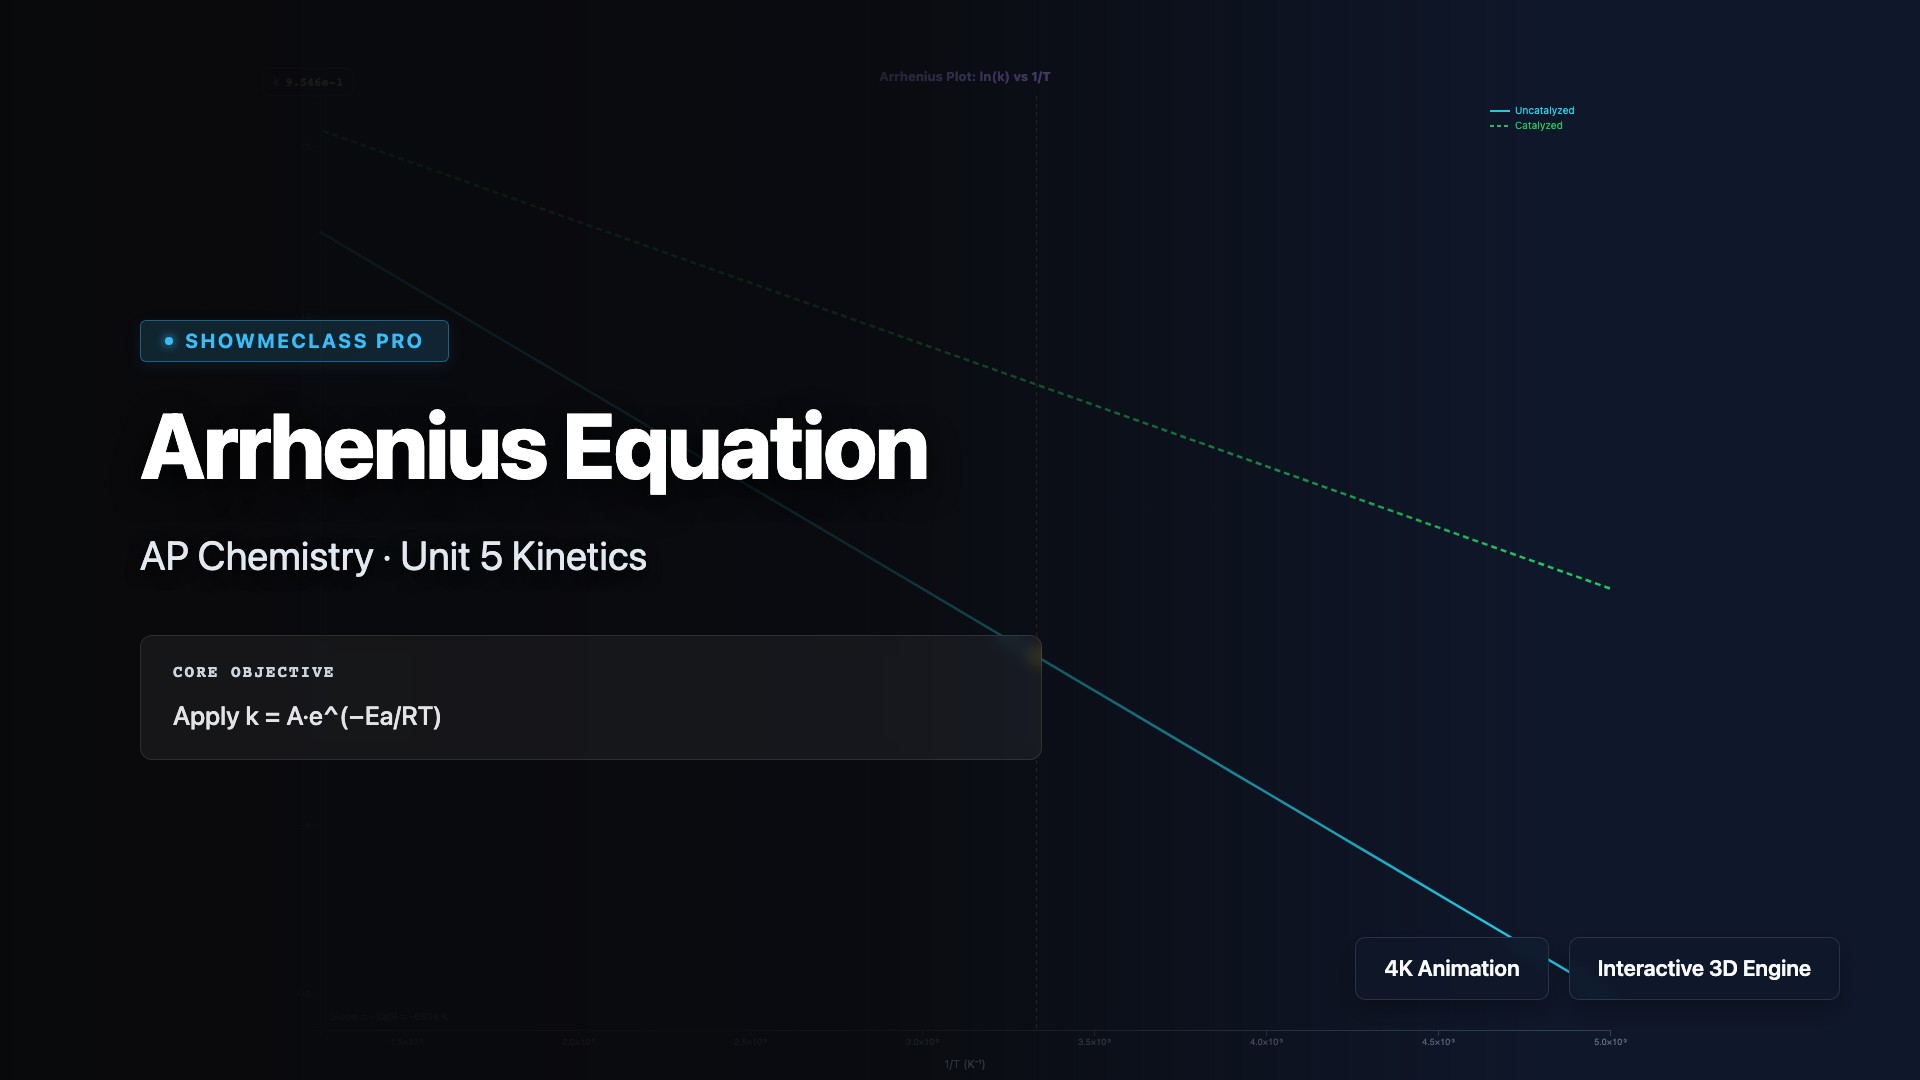
Arrhenius Equation (Rate vs Temperature)
Visualize the Arrhenius equation k = Ae^(−Ea/RT) with adjustable Ea and temperature. Compare catalyzed vs uncatalyzed reactions on a ln(k) vs 1/T plot.
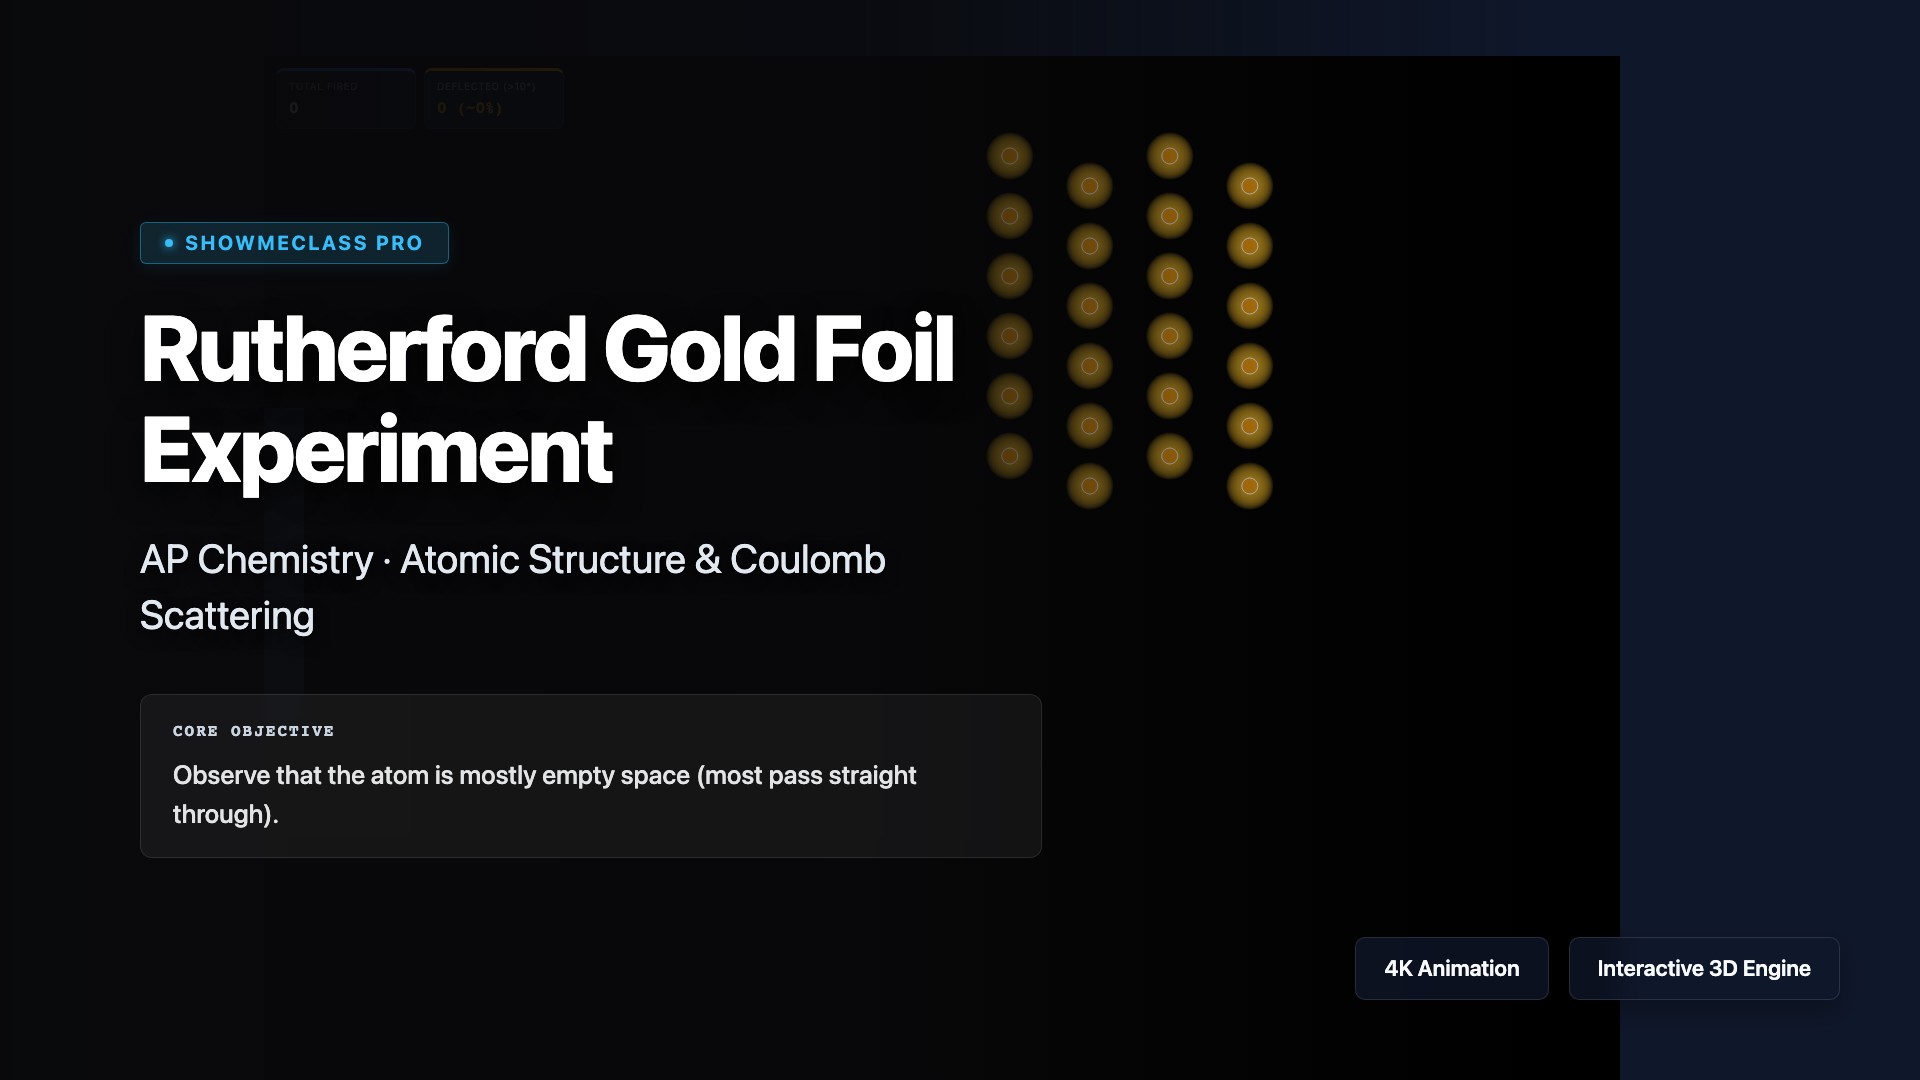
Rutherford Gold Foil Scattering
Fire a continuous stream of alpha particles at a dense lattice of Gold nuclei (Au-79). Watch how the inverse-square Coulomb law dictates violent scattering trajectories, proving that atoms are mostly empty space harboring microscopic dense positive cores.
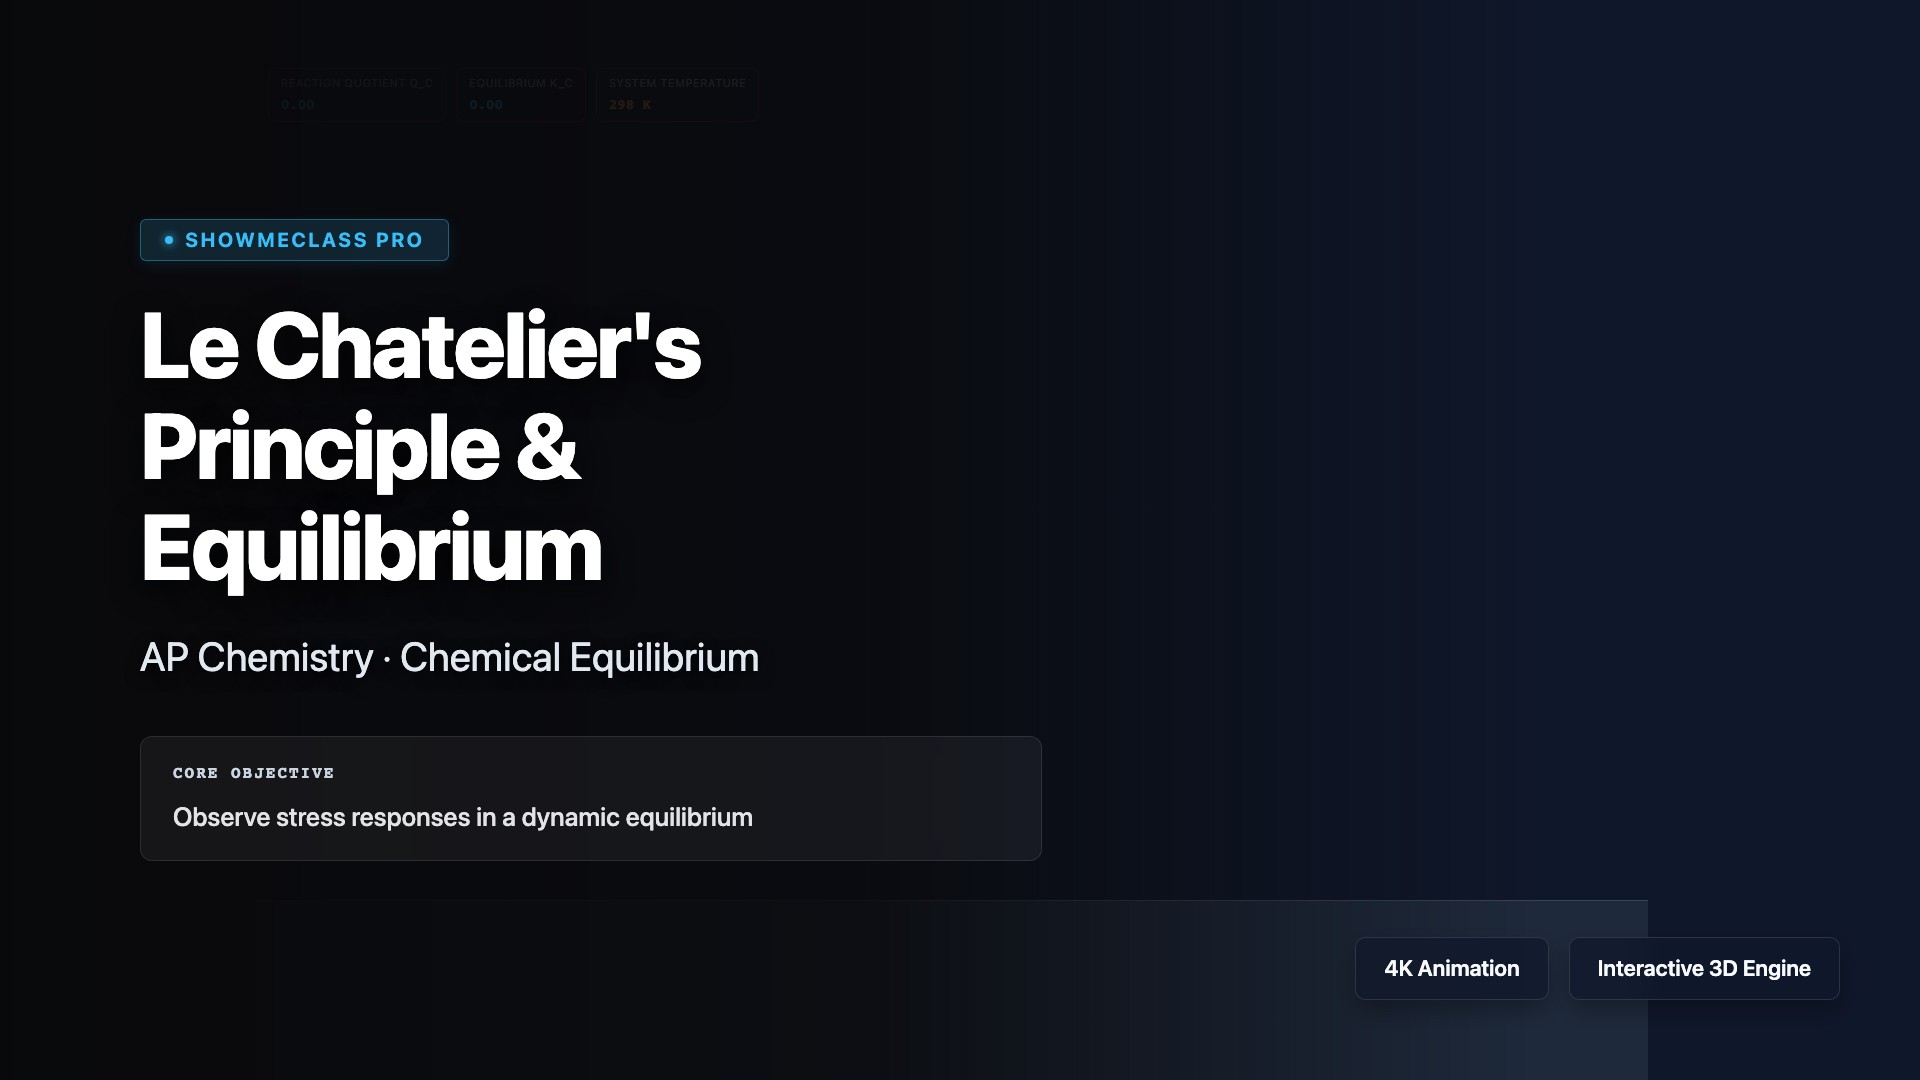
Le Chatelier's Principle & Equilibrium
Simulates Le Chatelier's Principle allowing users to inject molecules, change volume/pressure, and shift temperature to observe real-time equilibrium shifts (N2O4 \u21CC 2NO2).

Clausius-Clapeyron Vapor Pressure Plotter
Explores the exponential relationship between temperature and vapor pressure, generating real-time linear ln(P) vs 1/T plots based on intermolecular forces.
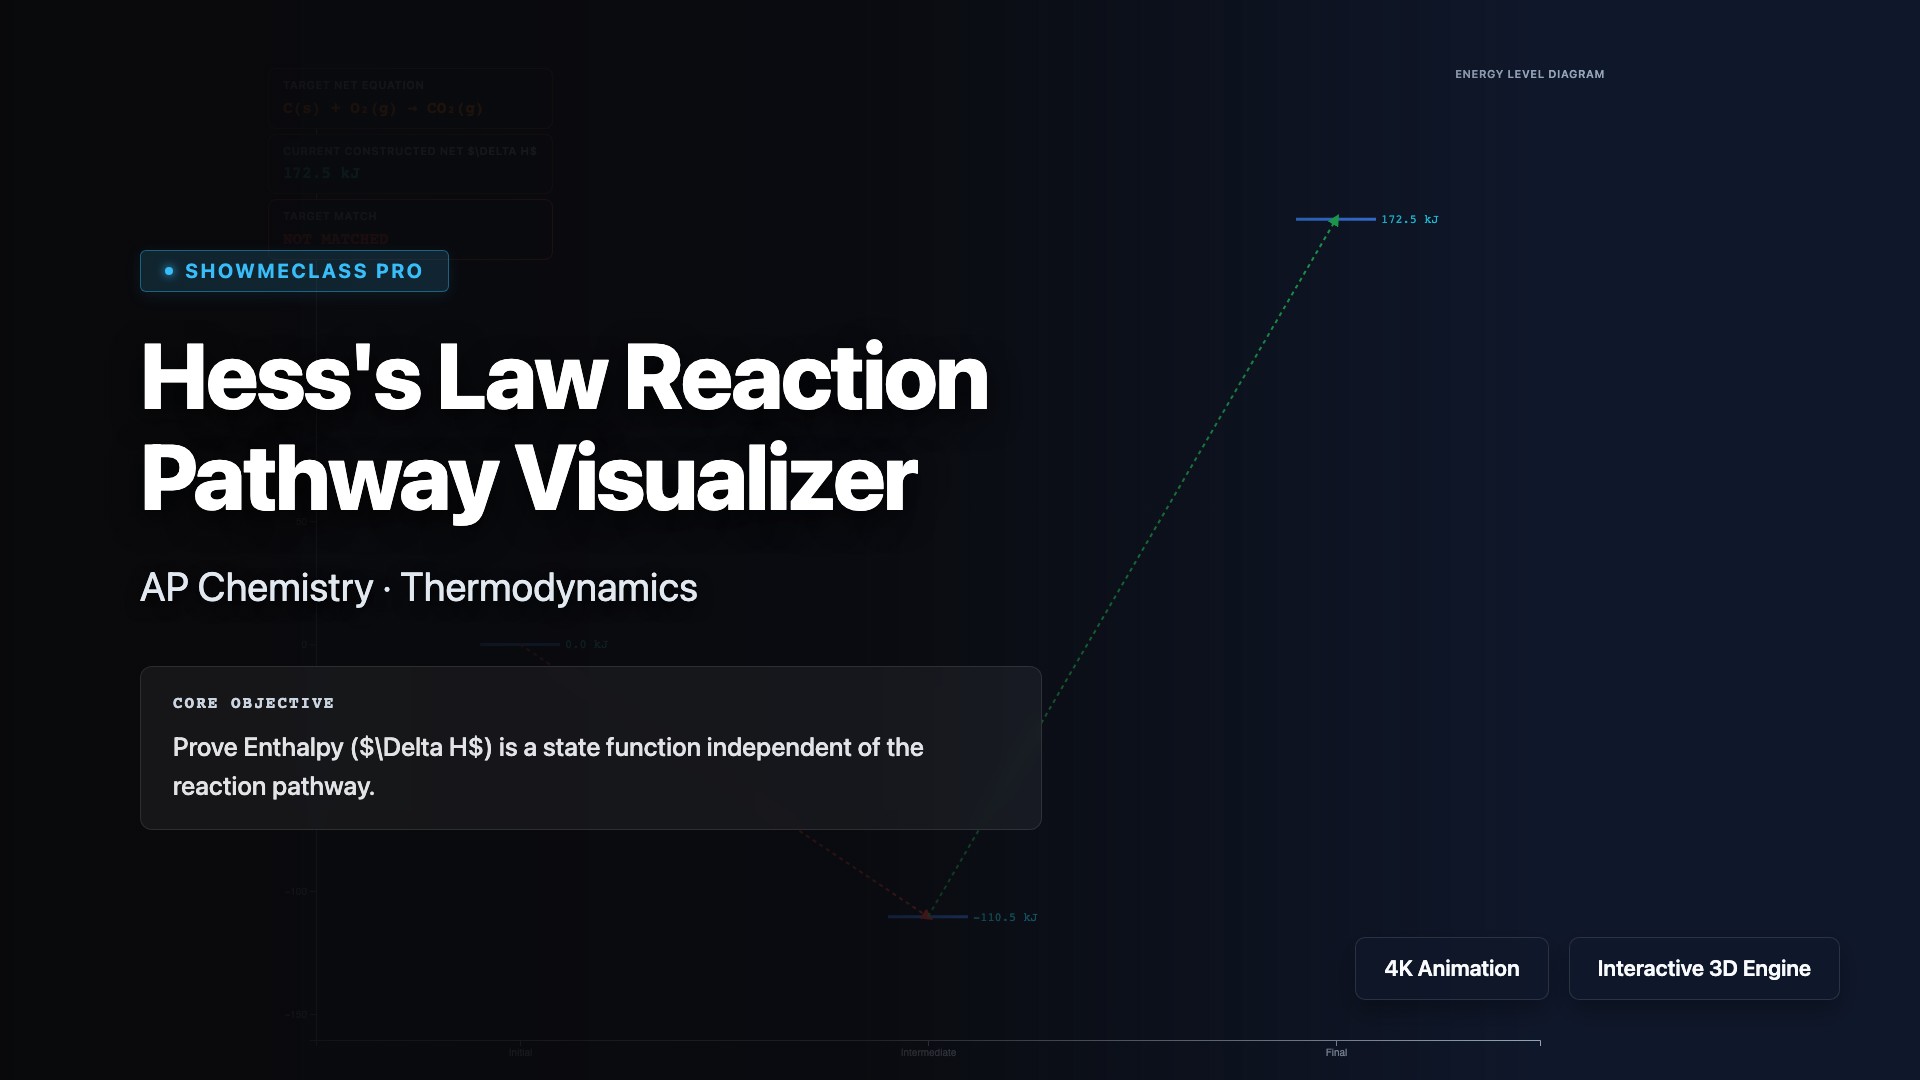
Hess's Law Reaction Pathway Visualizer
Build an algebraic pathway for enthalpy by reversing reactions, scaling stoichiometric coefficients, and adding step energies to find the net reaction.
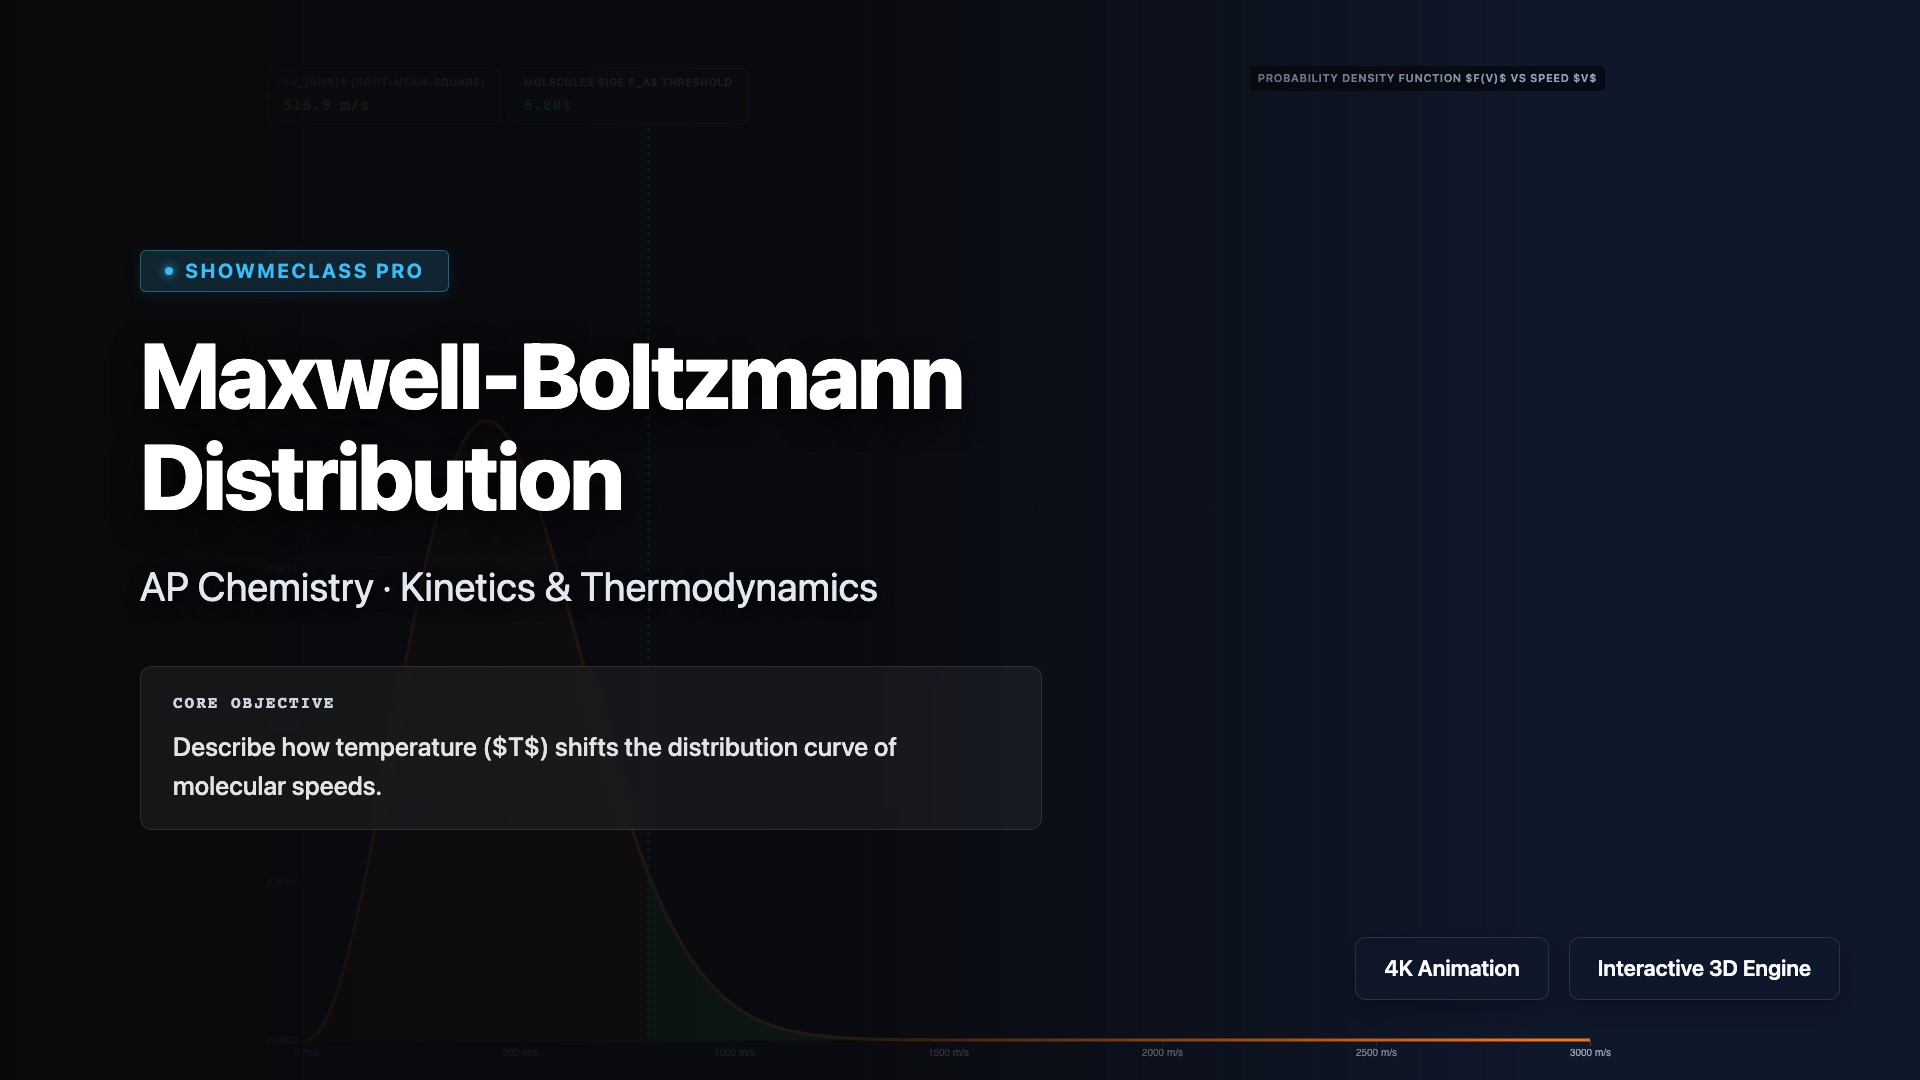
Maxwell-Boltzmann Distribution
Visualize how temperature and molar mass shift the kinetic energy distribution of particles, affecting the proportion that overcome the Activation Energy.
Crystal Lattice Structures (FCC/BCC/HCP)
3D rotatable crystal lattice visualizer for SC/BCC/FCC/HCP unit cells. Demonstrates atom-sharing fractions (corner ×1/8, face ×1/2, body ×1), packing efficiency percentages, coordination numbers, and edge-to-radius geometric relationships interactively.
Metallic Bonding & Electron Sea Model
Animated electron sea model showing delocalized valence electrons flowing randomly through a vibrating cation lattice. Applying voltage reveals directional drift current emerging from thermal chaos, explaining metallic conductivity at the atomic level.
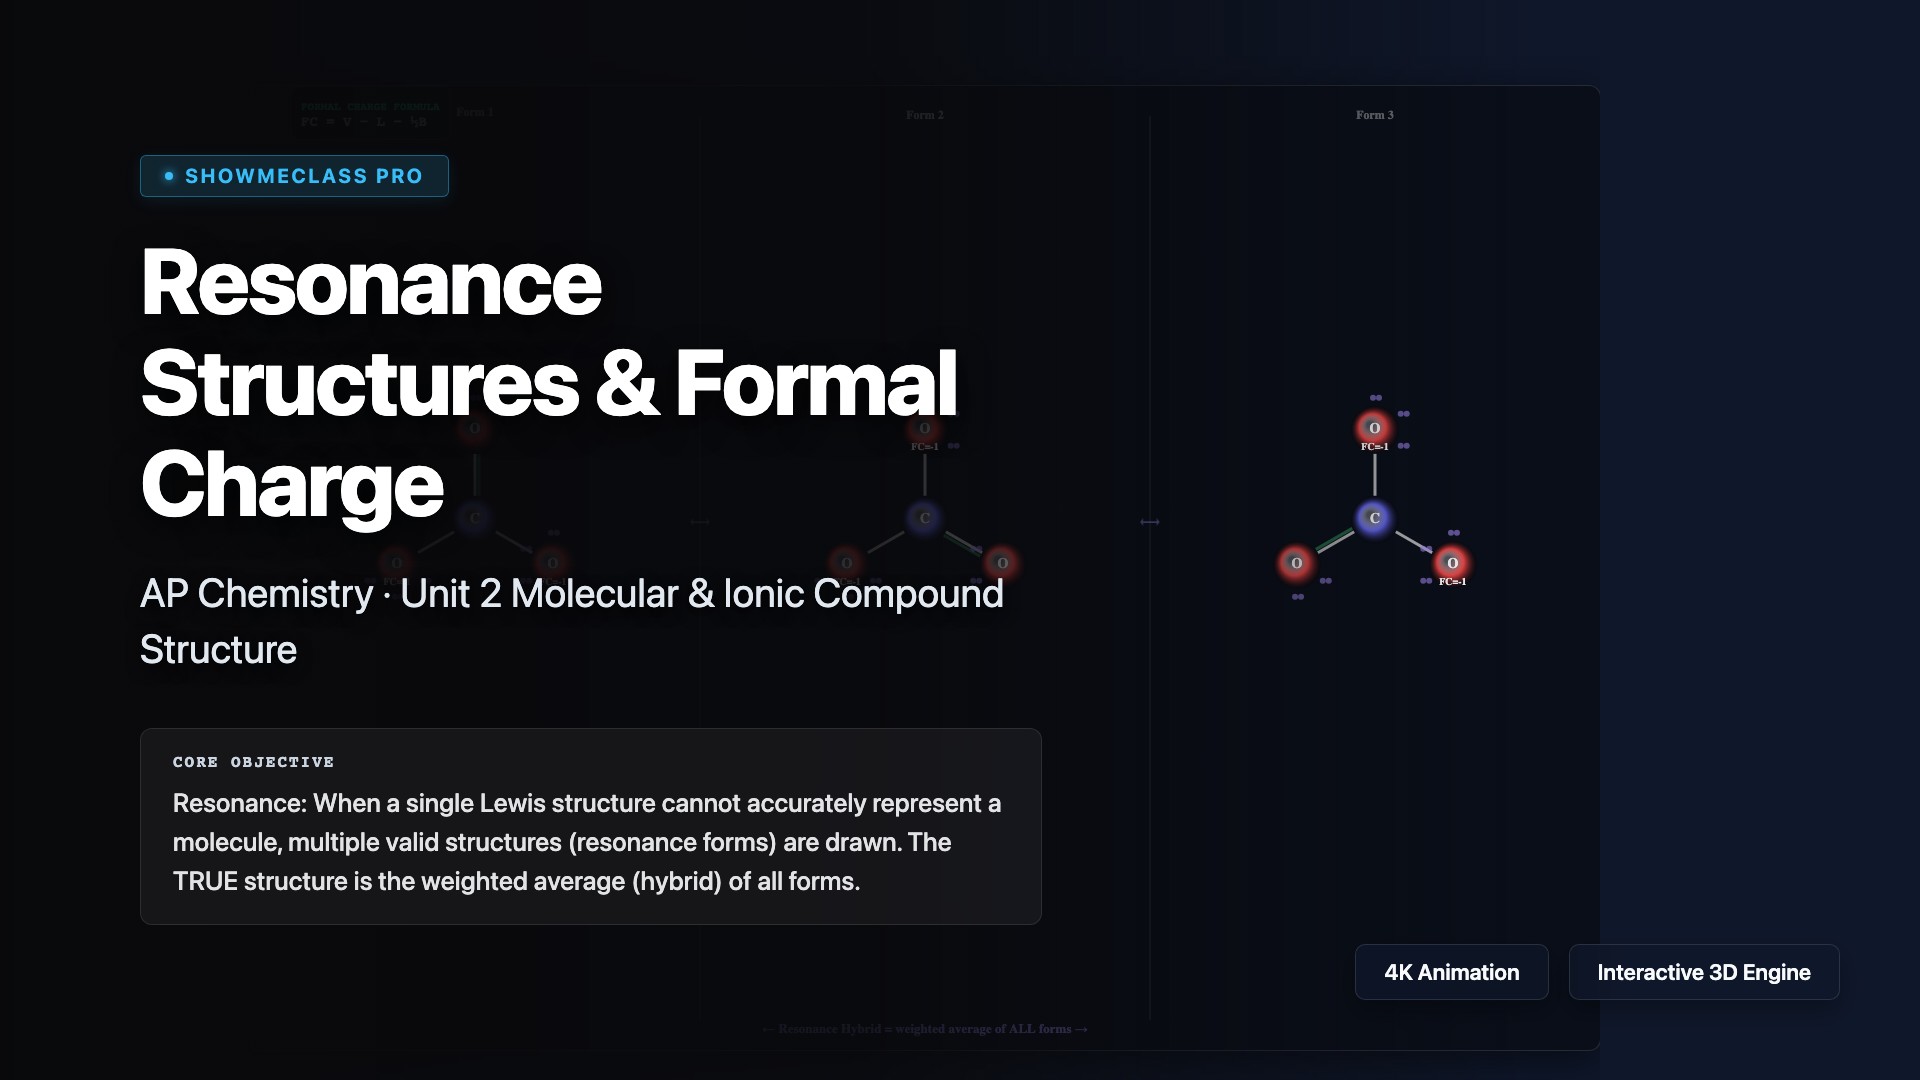
Resonance Structures & Formal Charge
Interactive resonance structure visualizer for CO₃²⁻, NO₃⁻, O₃, benzene, and SO₄²⁻. Displays formal charge calculations (FC = V − L − ½B), fractional bond orders, and electron delocalization across multiple equivalent resonance forms simultaneously.

Hybridization & Orbital Overlap
Interactive visualization of sp, sp², sp³, sp³d, sp³d² hybridization with orbital lobe diagrams, sigma/pi bond distinction, bond angles, and molecular geometry examples. Select hybridization types to see electron domain arrangement and unhybridized p orbitals available for pi bonding.
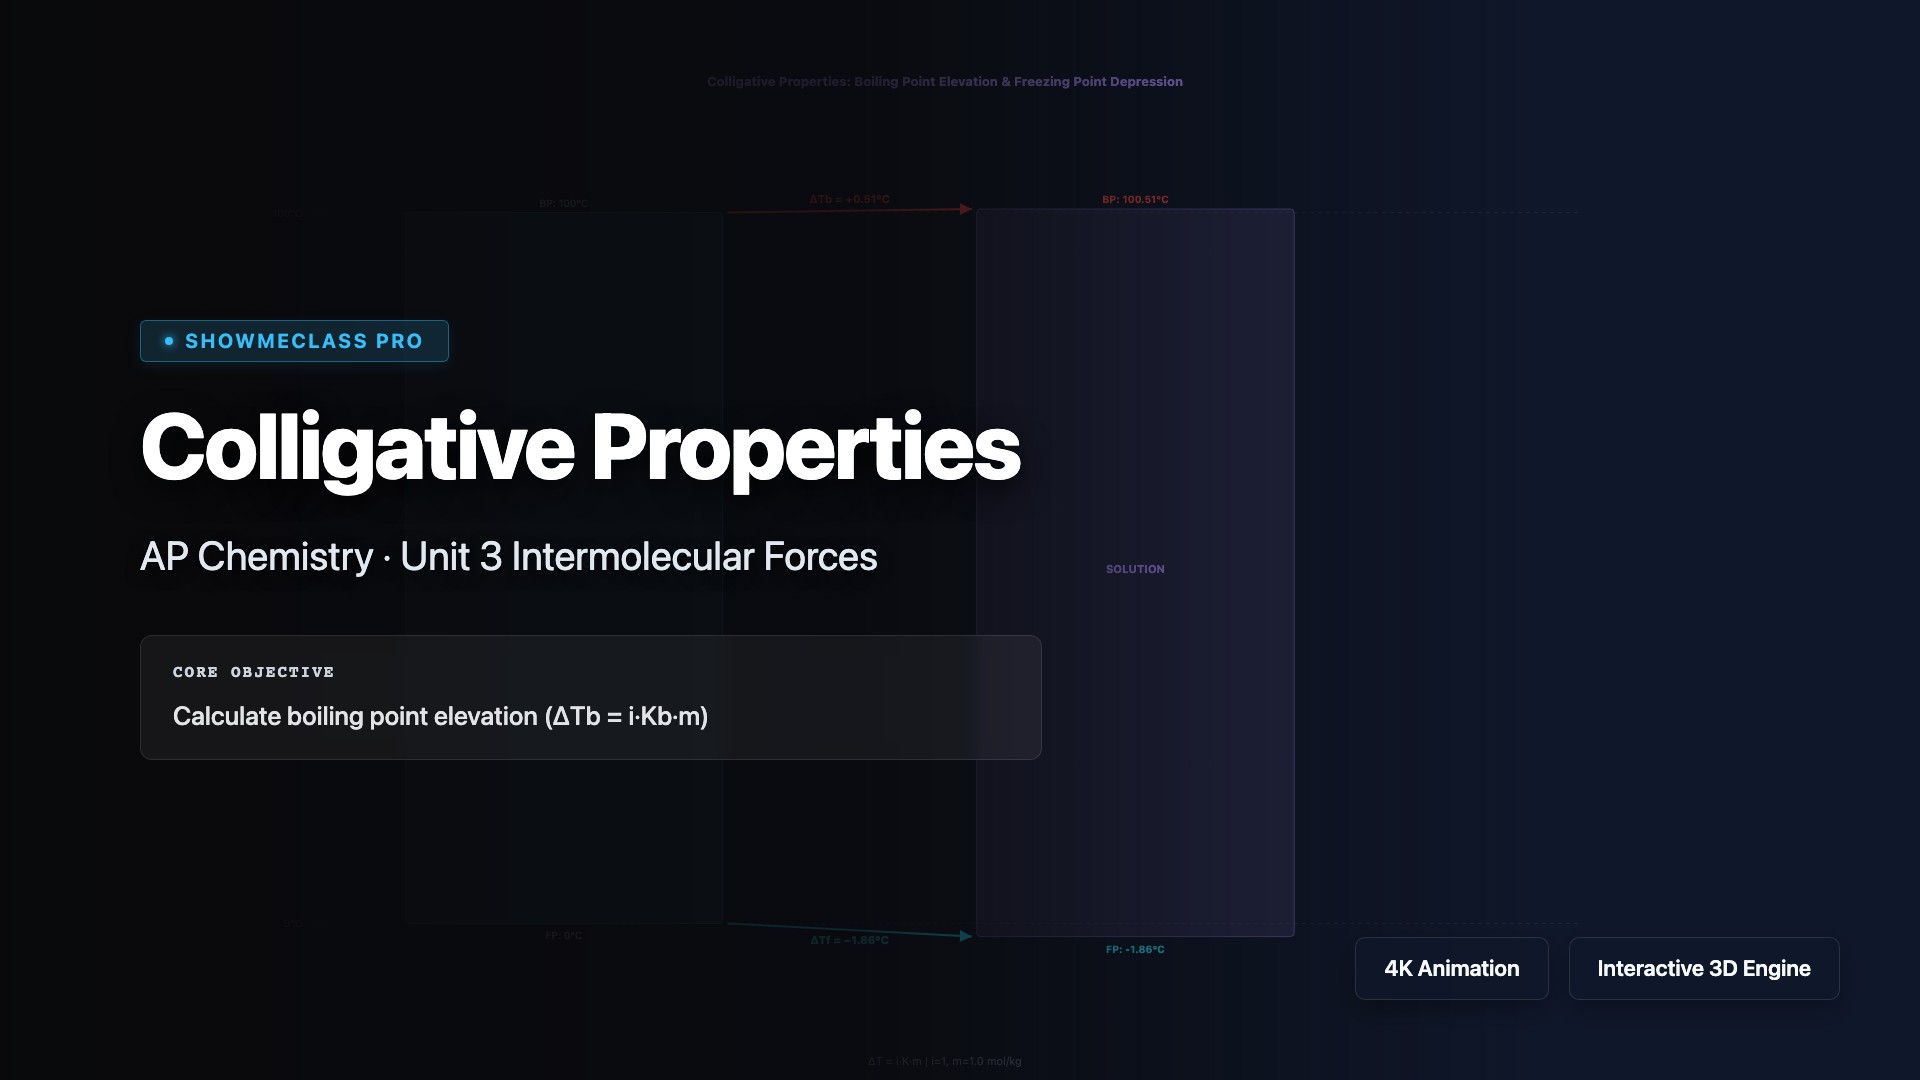
Colligative Properties Calculator
Calculate boiling point elevation (ΔTb = iKbm) and freezing point depression (ΔTf = iKfm) with interactive sliders. Visualize the temperature range expansion of solutions versus pure solvent. Adjustable van't Hoff factor for electrolytes and osmotic pressure calculation.
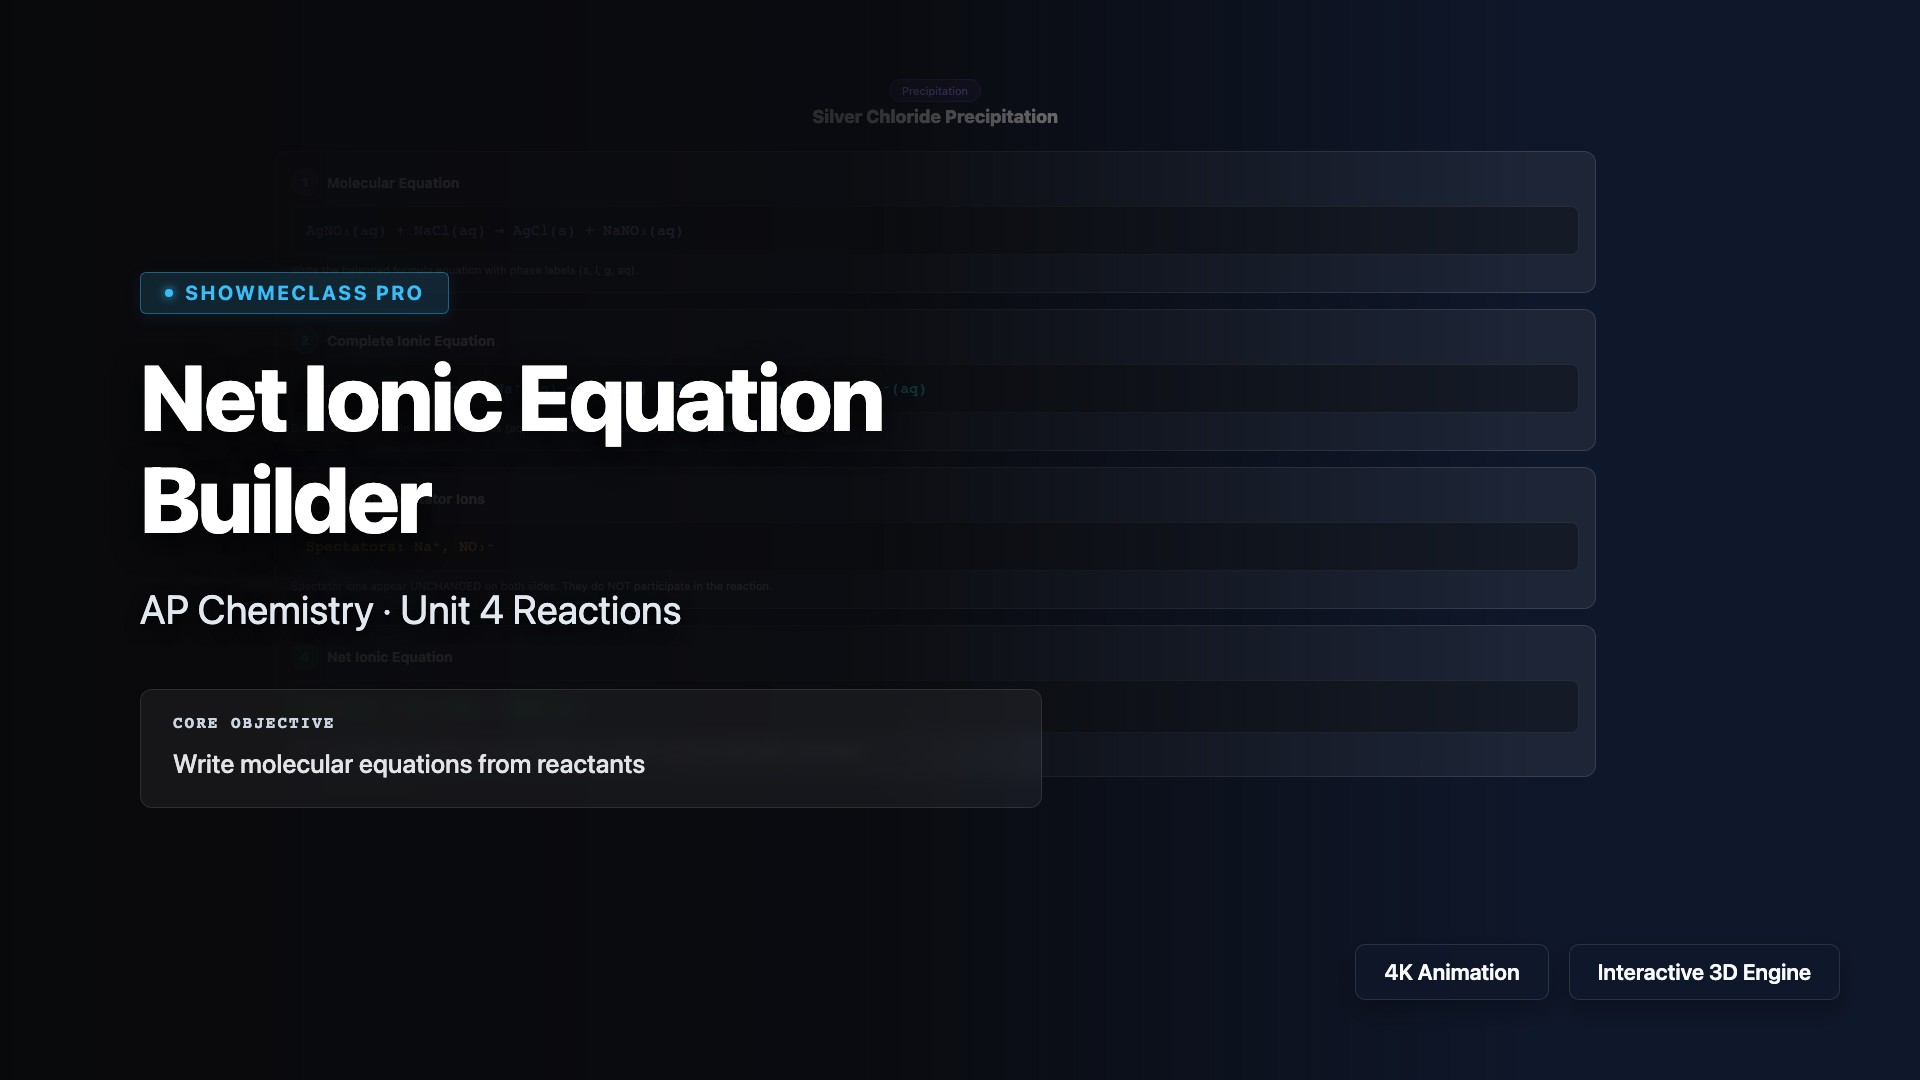
Net Ionic Equation Builder
Step-by-step builder for net ionic equations from 6 reaction examples. Walk through molecular equation → complete ionic equation → identify spectator ions → net ionic equation. Covers precipitation, acid-base neutralization, and gas evolution reactions with solubility rules reference.
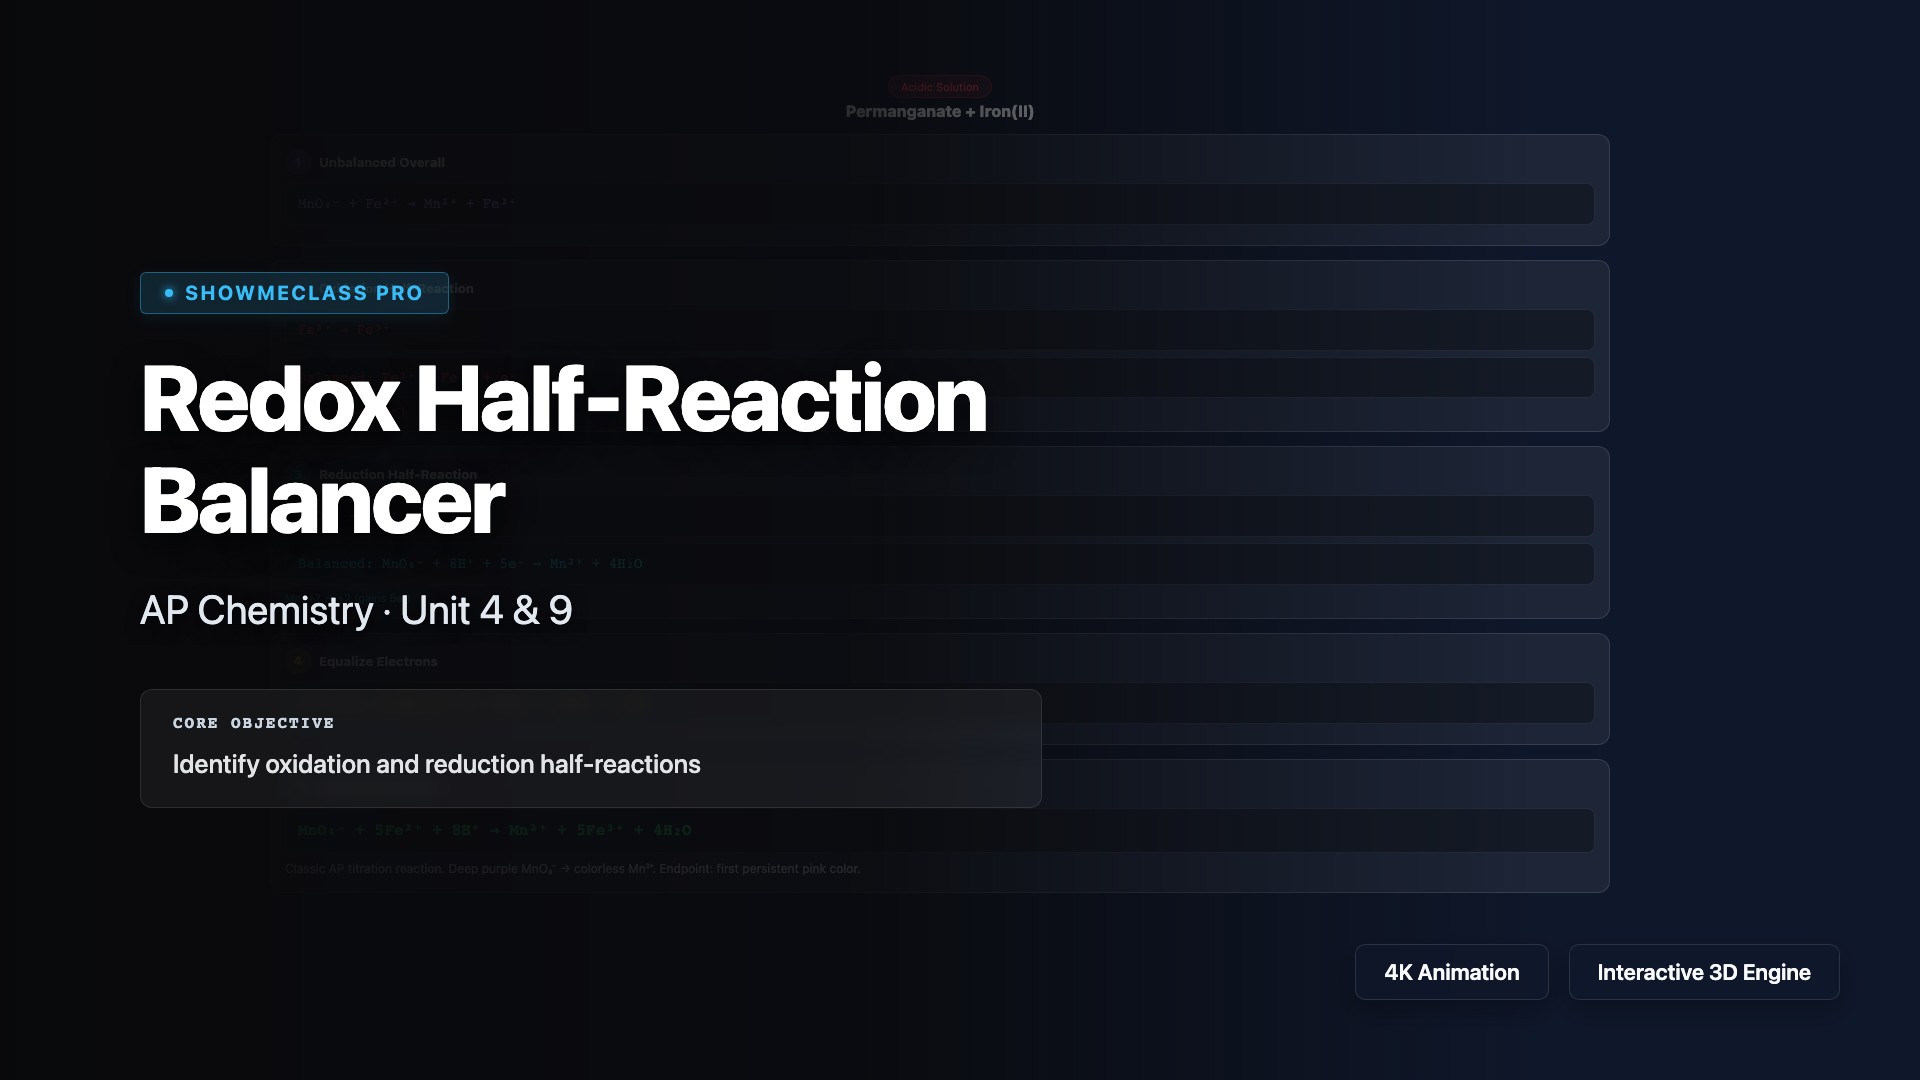
Redox Half-Reaction Balancer
Step-by-step balancing of redox half-reactions in acidic and basic solutions. Features 5 classic reactions (MnO₄⁻/Fe²⁺, Cr₂O₇²⁻/I⁻, Cu/NO₃⁻, Zn/MnO₄⁻, Sn²⁺/IO₃⁻) with oxidation state tracking, electron equalization, and detailed chemical explanations.
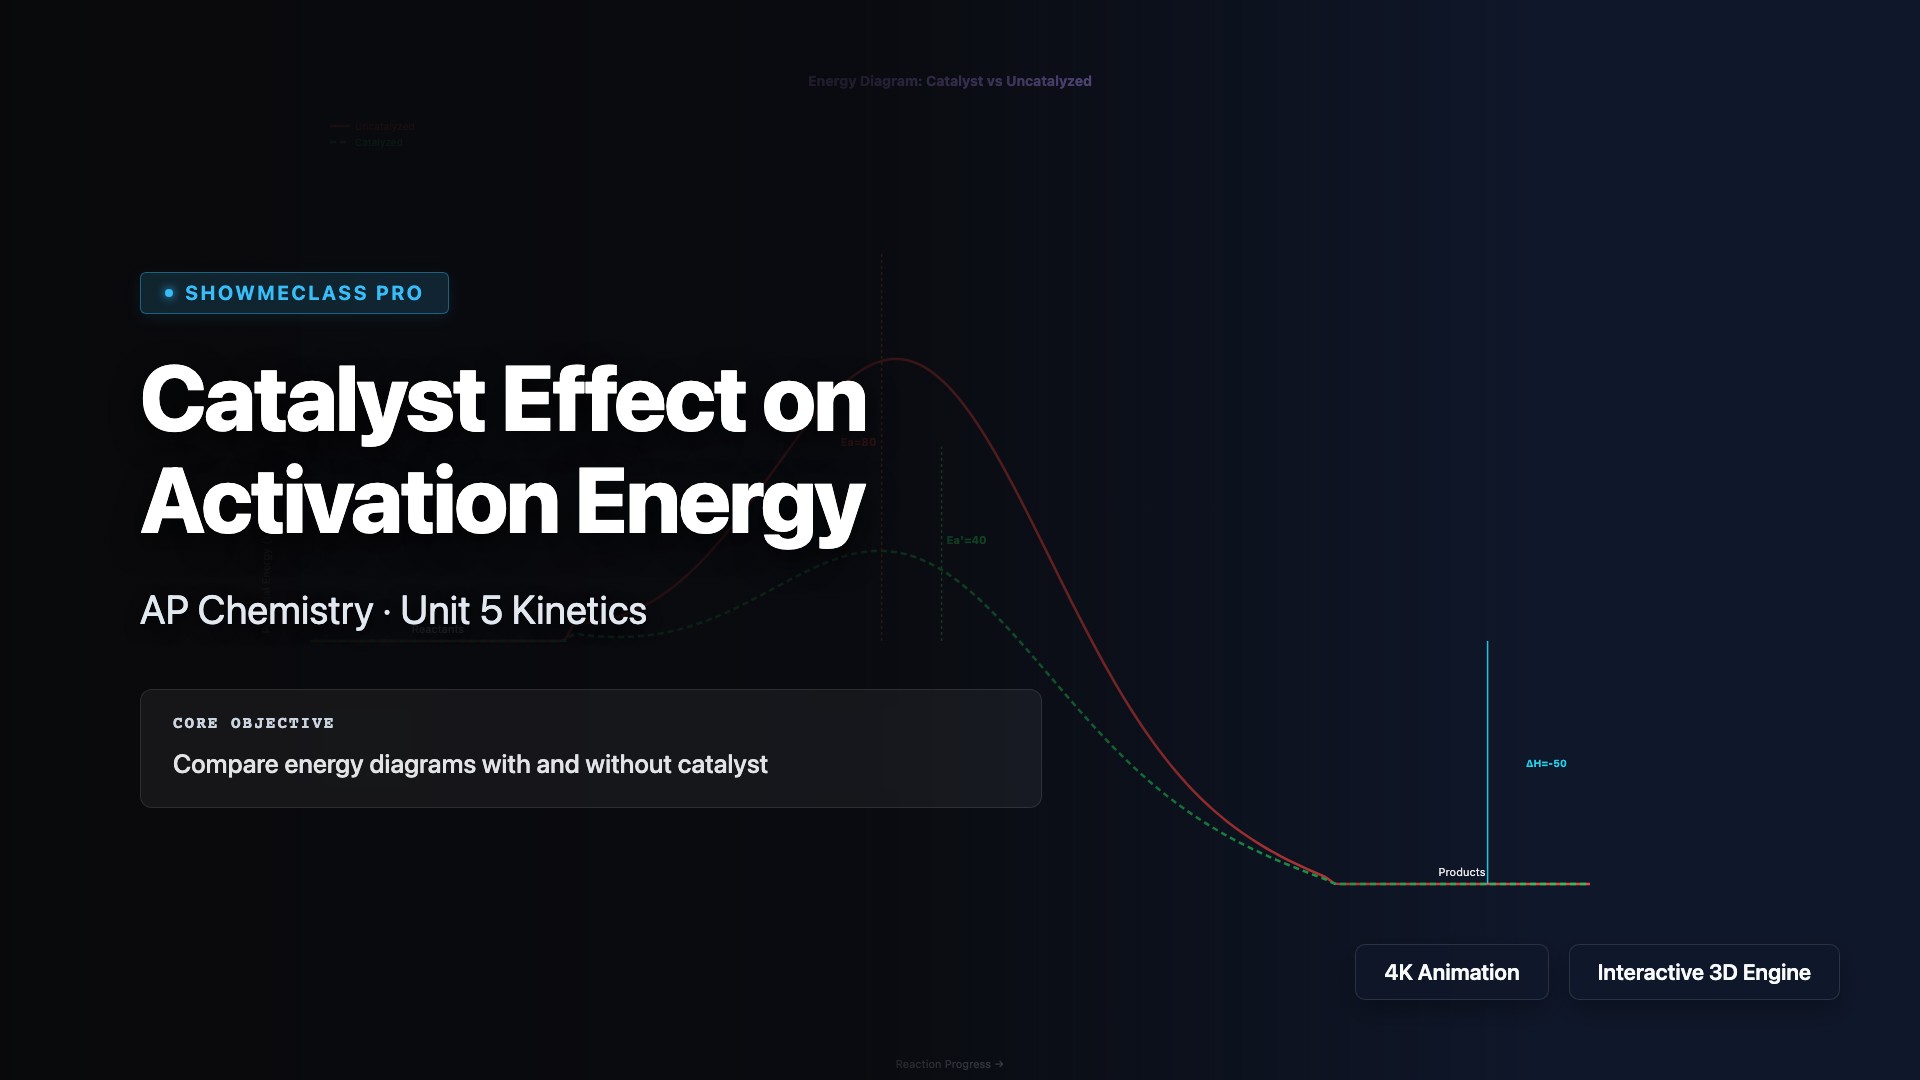
Catalyst Effect on Activation Energy
Interactive energy diagram comparing catalyzed vs uncatalyzed reaction pathways. Adjust activation energy, catalyzed Ea, and ΔH with real-time visualization. Calculates approximate speedup factor using Arrhenius equation. Covers homogeneous, heterogeneous, and enzyme catalysts.
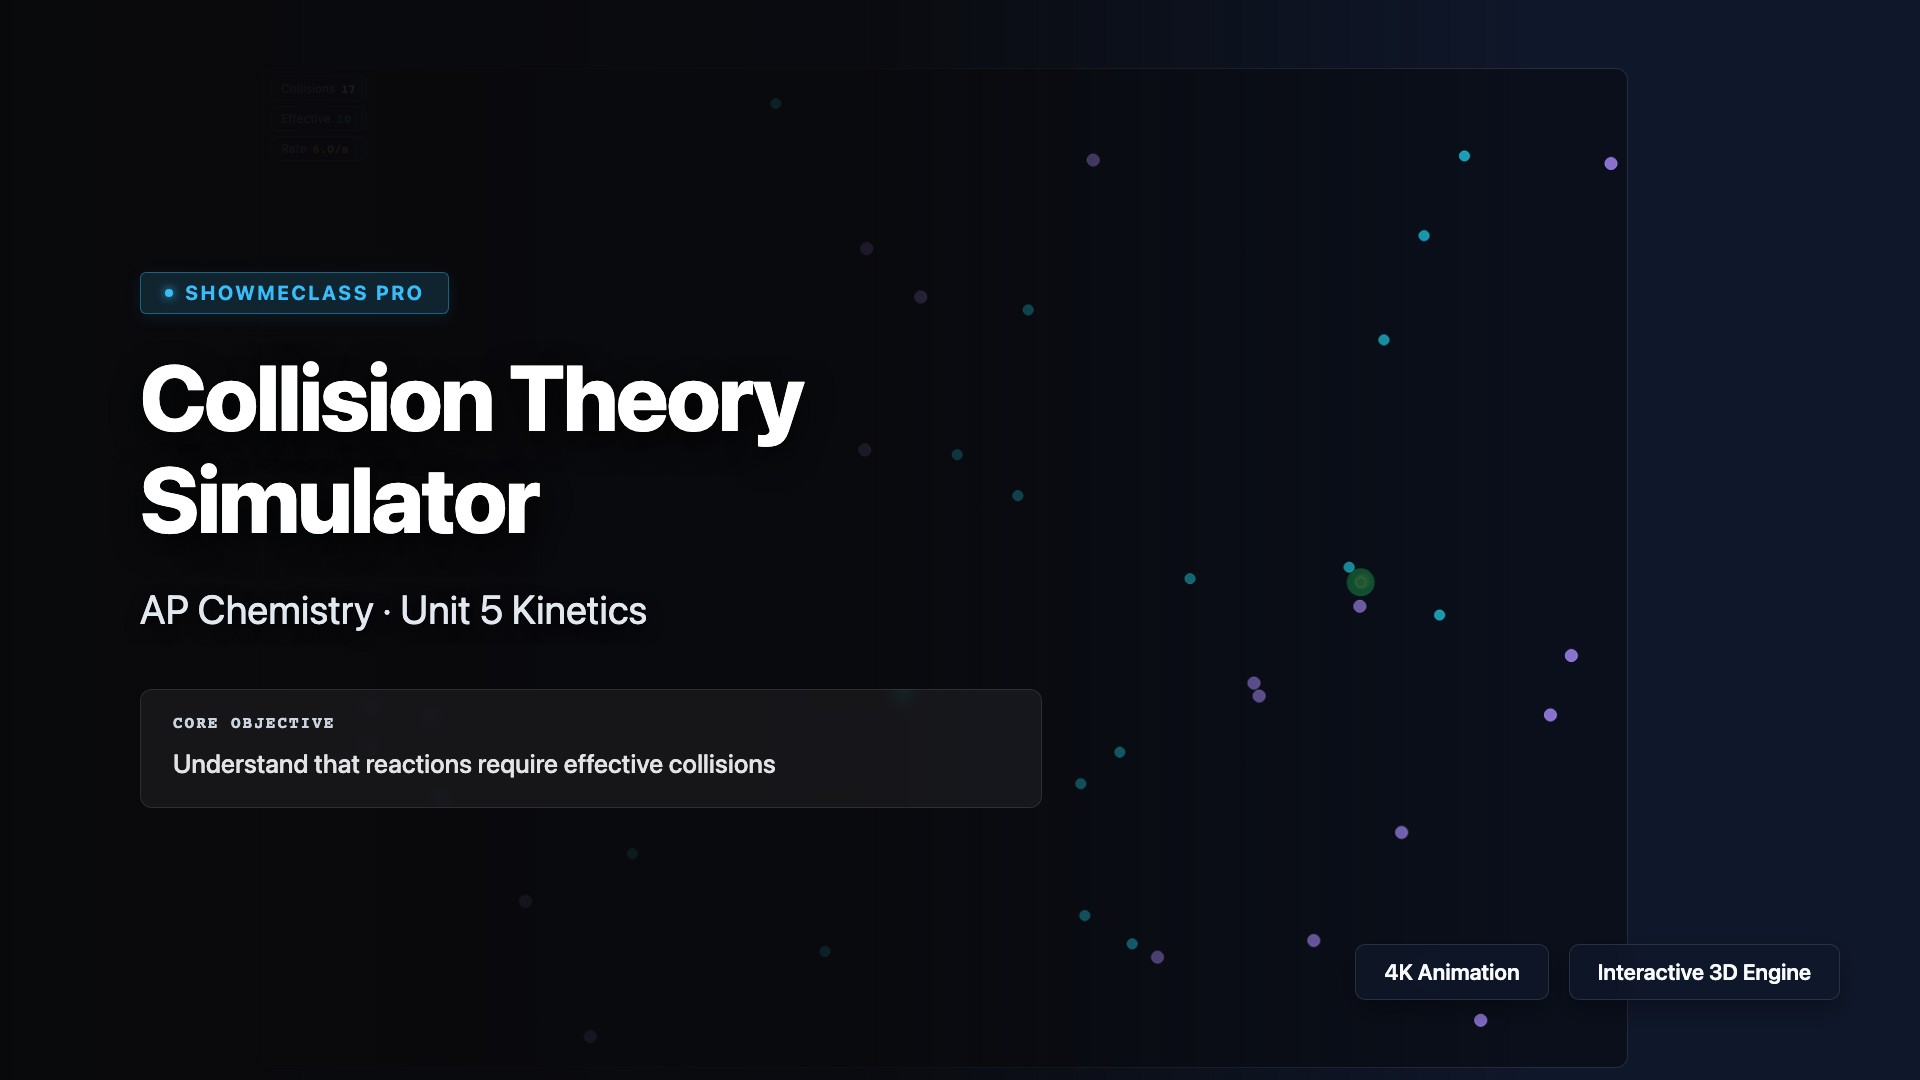
Collision Theory Particle Simulator
Animated particle simulation demonstrating collision theory. Particles of two types collide with visual feedback: green flashes for effective collisions (sufficient energy + correct orientation) and red flashes for ineffective ones. Adjustable temperature, particle count, and activation energy threshold.
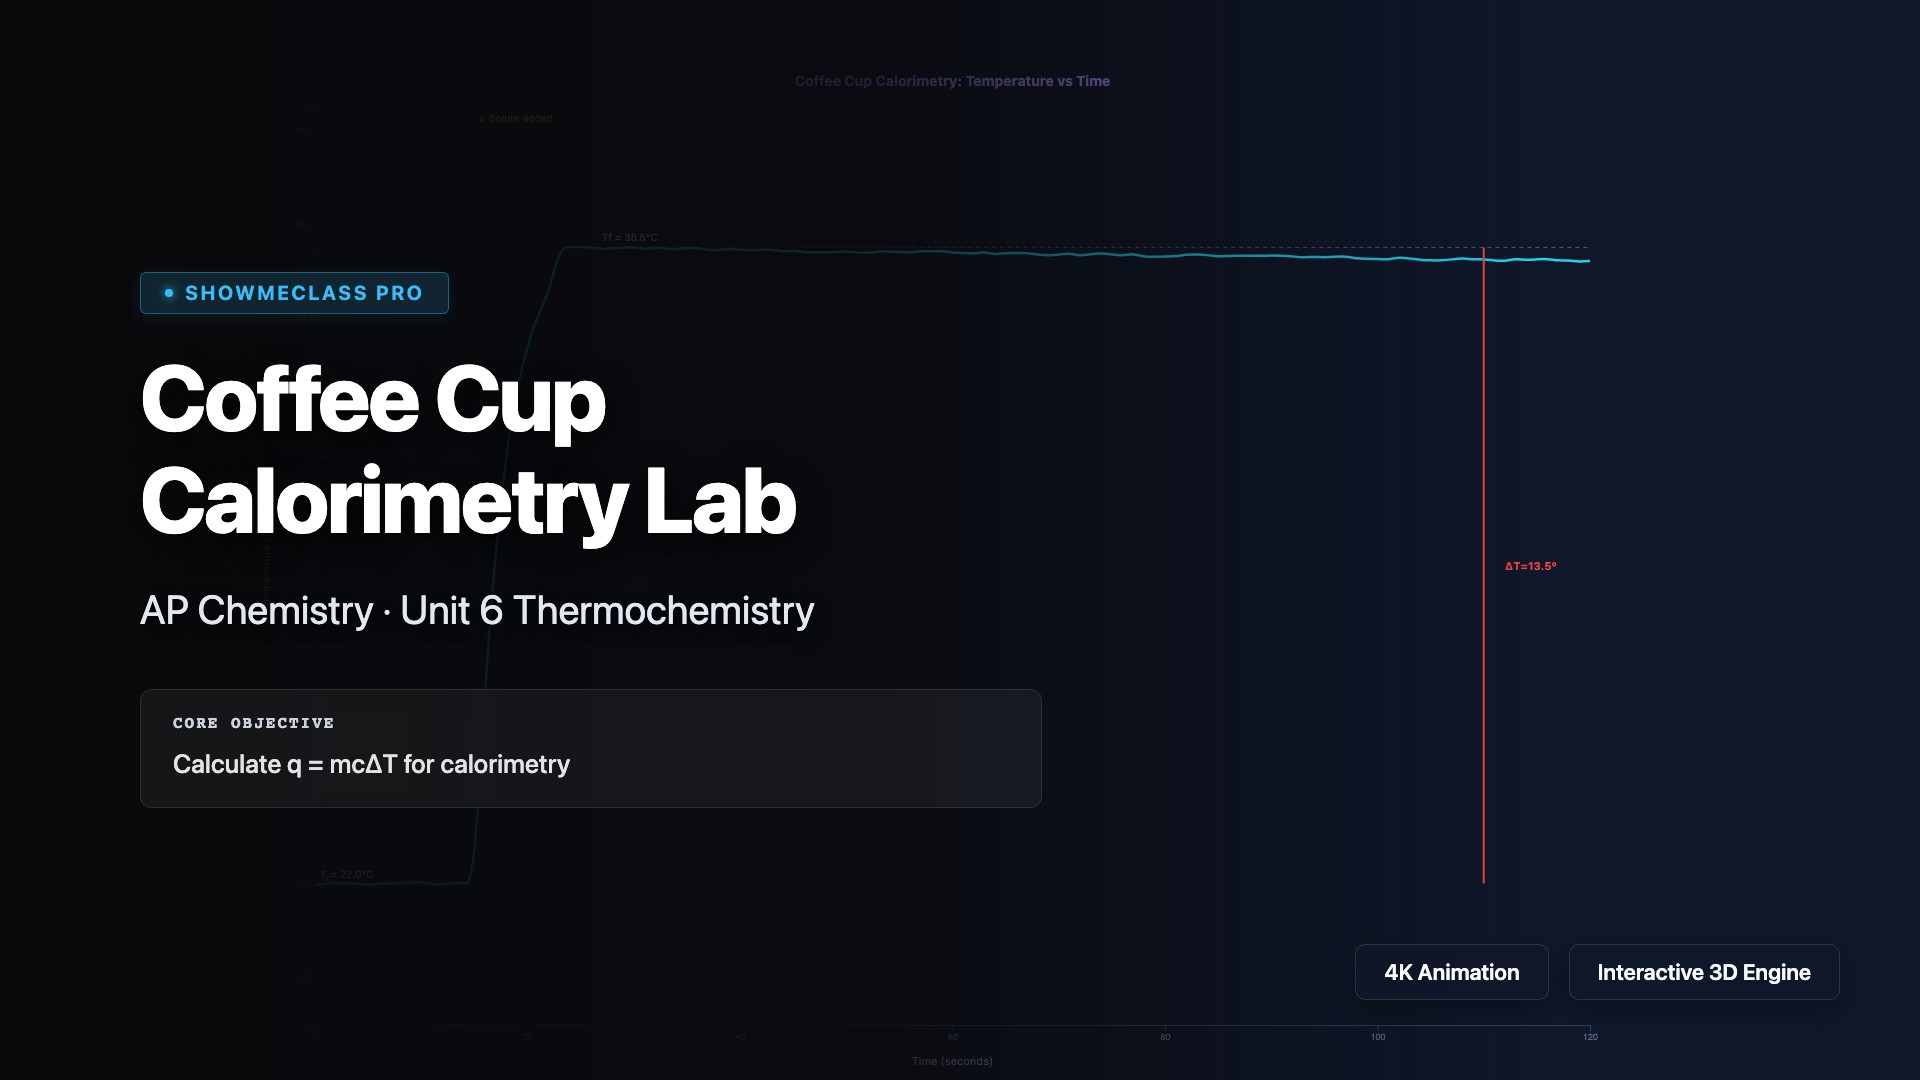
Coffee Cup Calorimetry Lab
Virtual coffee cup calorimetry lab with interactive temperature vs time graph. Calculate q=mcΔT, determine qrxn and ΔH from experimental data. Adjustable mass, initial/final temperature, and moles of solute. Automatically classifies reactions as exothermic or endothermic with step-by-step calculation display.
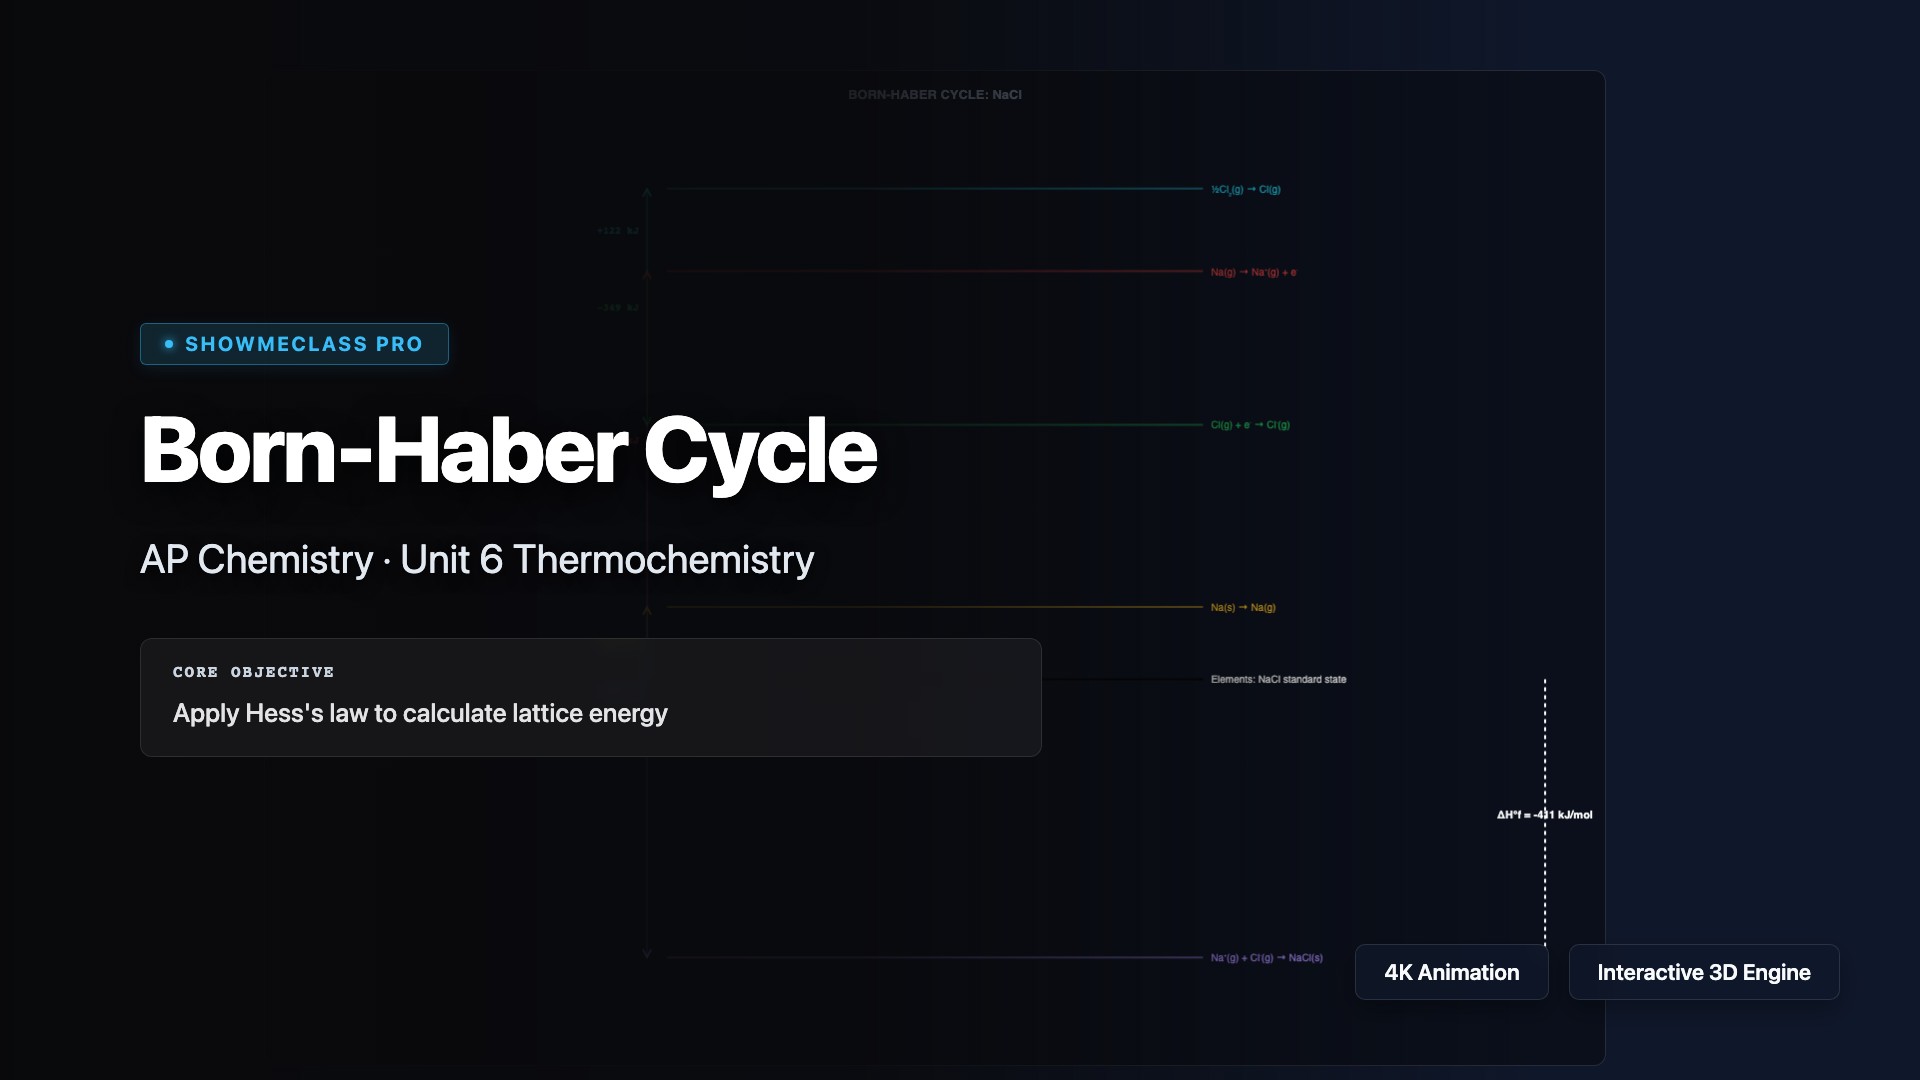
Born-Haber Cycle (Lattice Energy)
Visual energy level diagram for Born-Haber thermodynamic cycles. Explore 4 ionic compounds (NaCl, KBr, MgO, CaF₂) with verified thermodynamic data for each step: sublimation, ionization energy, bond dissociation, electron affinity, and lattice energy. Apply Hess's law to calculate lattice energy.
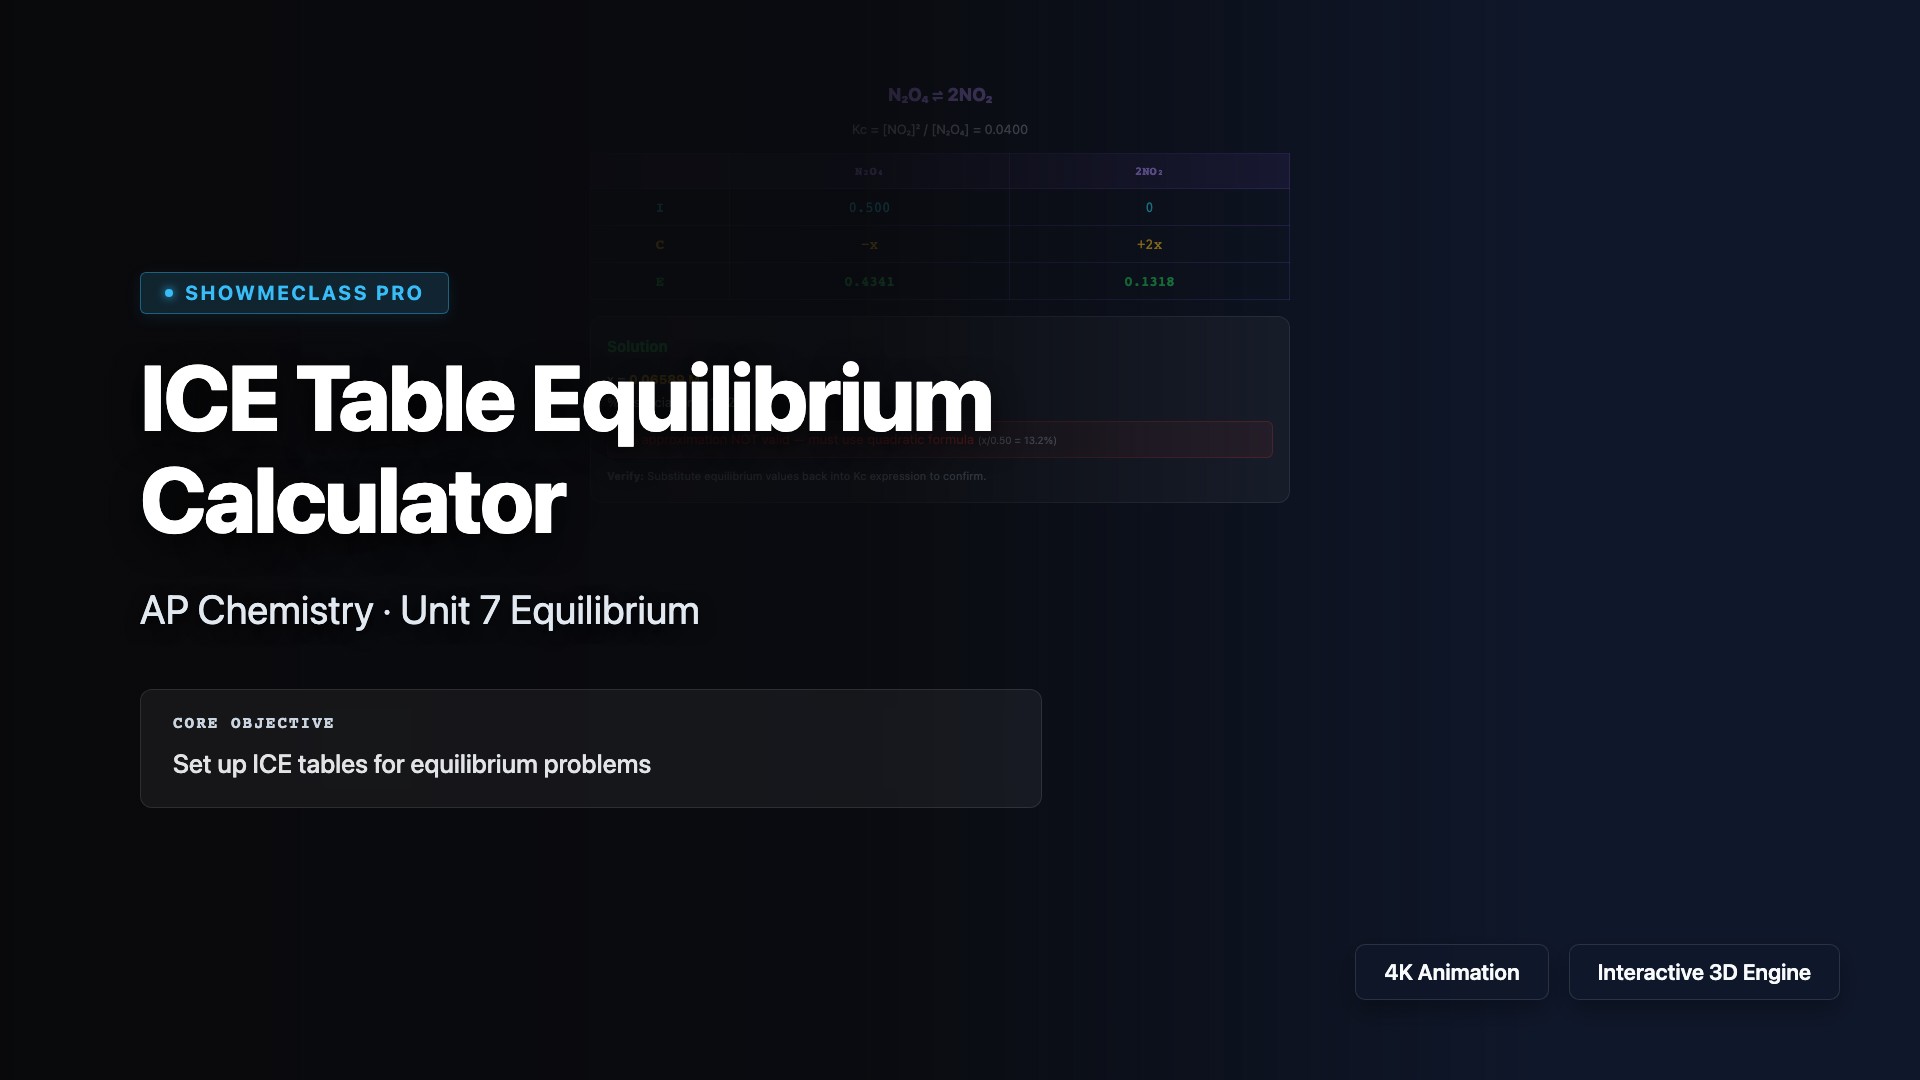
ICE Table Equilibrium Calculator
Step-by-step ICE table solver for 4 equilibrium reaction types (N₂O₄⇌2NO₂, H₂+I₂⇌2HI, PCl₅⇌PCl₃+Cl₂, CO+H₂O⇌CO₂+H₂). Adjustable Kc and initial concentration with automatic solving. Includes 5% approximation validity check and verification reminder.
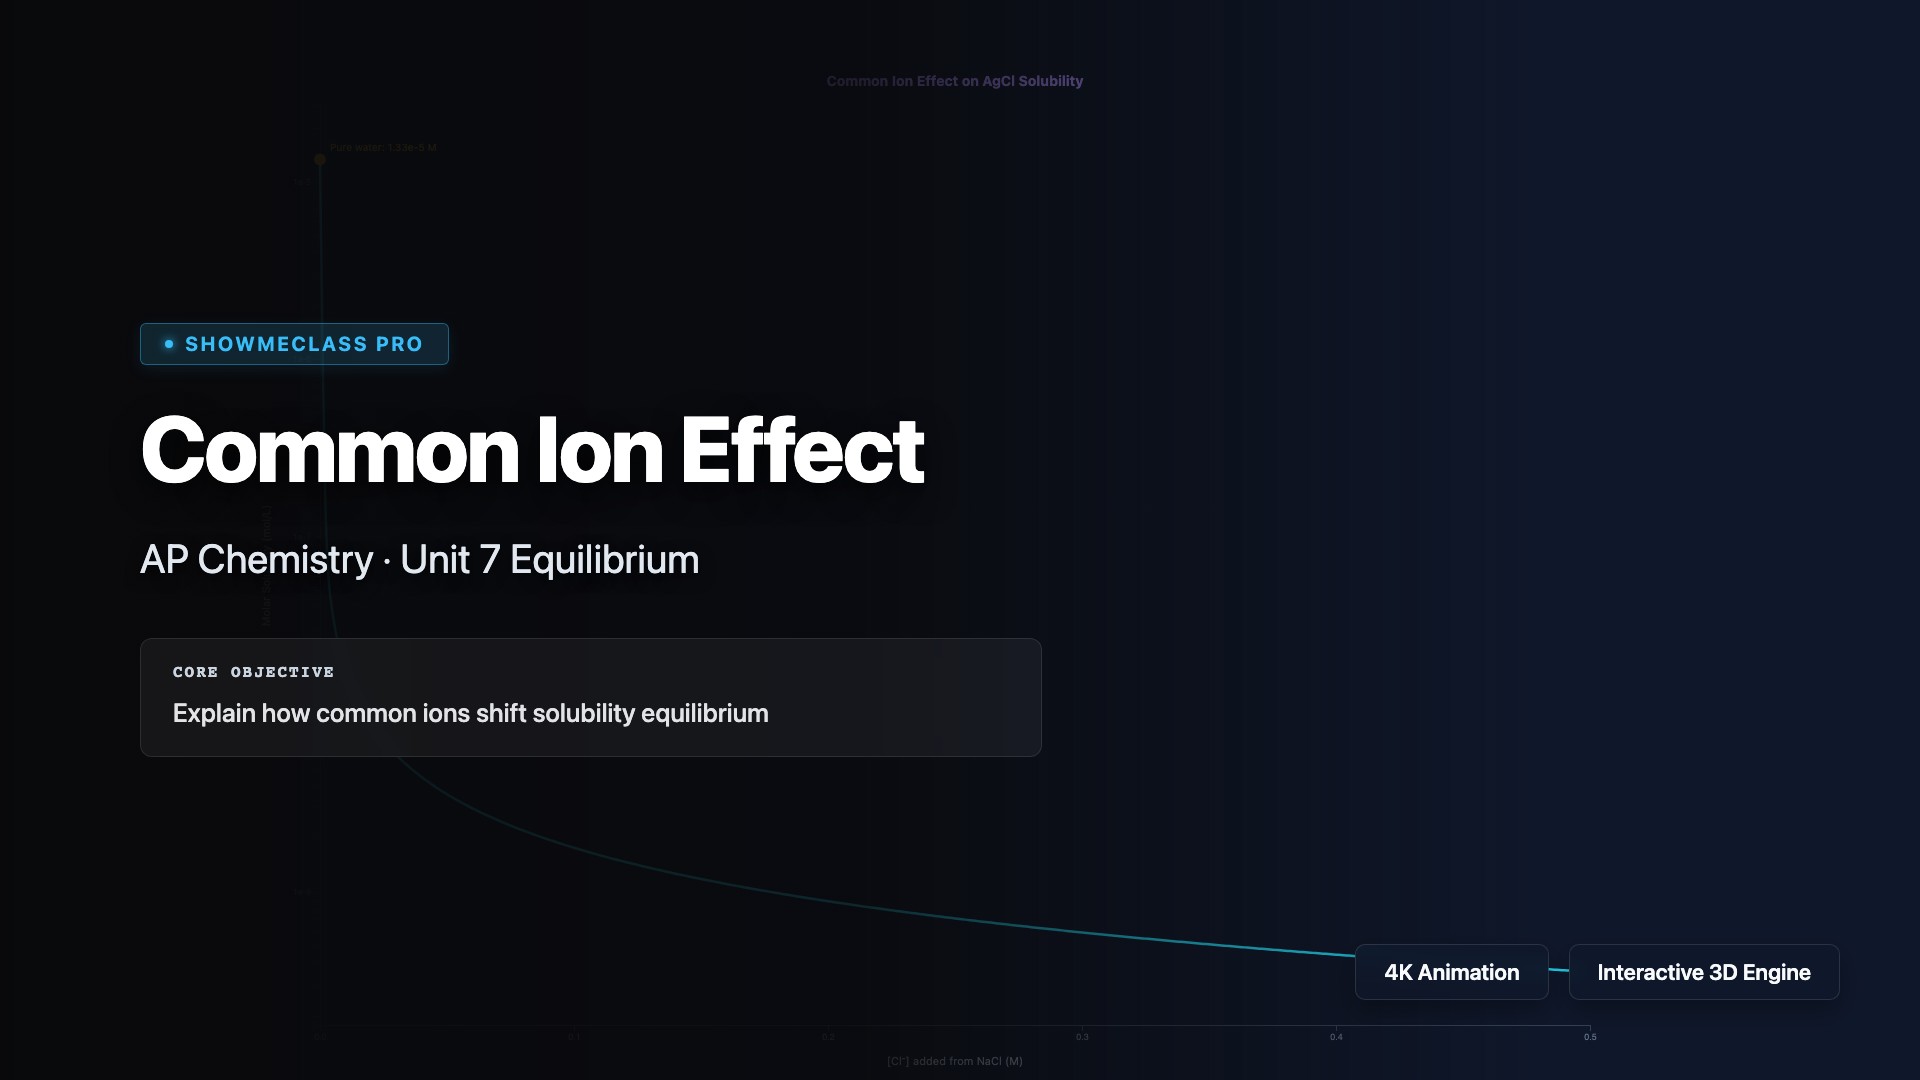
Common Ion Effect on Solubility
Interactive visualization of common ion effect on solubility for 4 salts (AgCl, PbCl₂, BaSO₄, CaF₂). Log-scale solubility vs common ion concentration graph with Le Chatelier's principle explanation. Shows dramatic solubility decrease with added common ion and percentage reduction calculation.
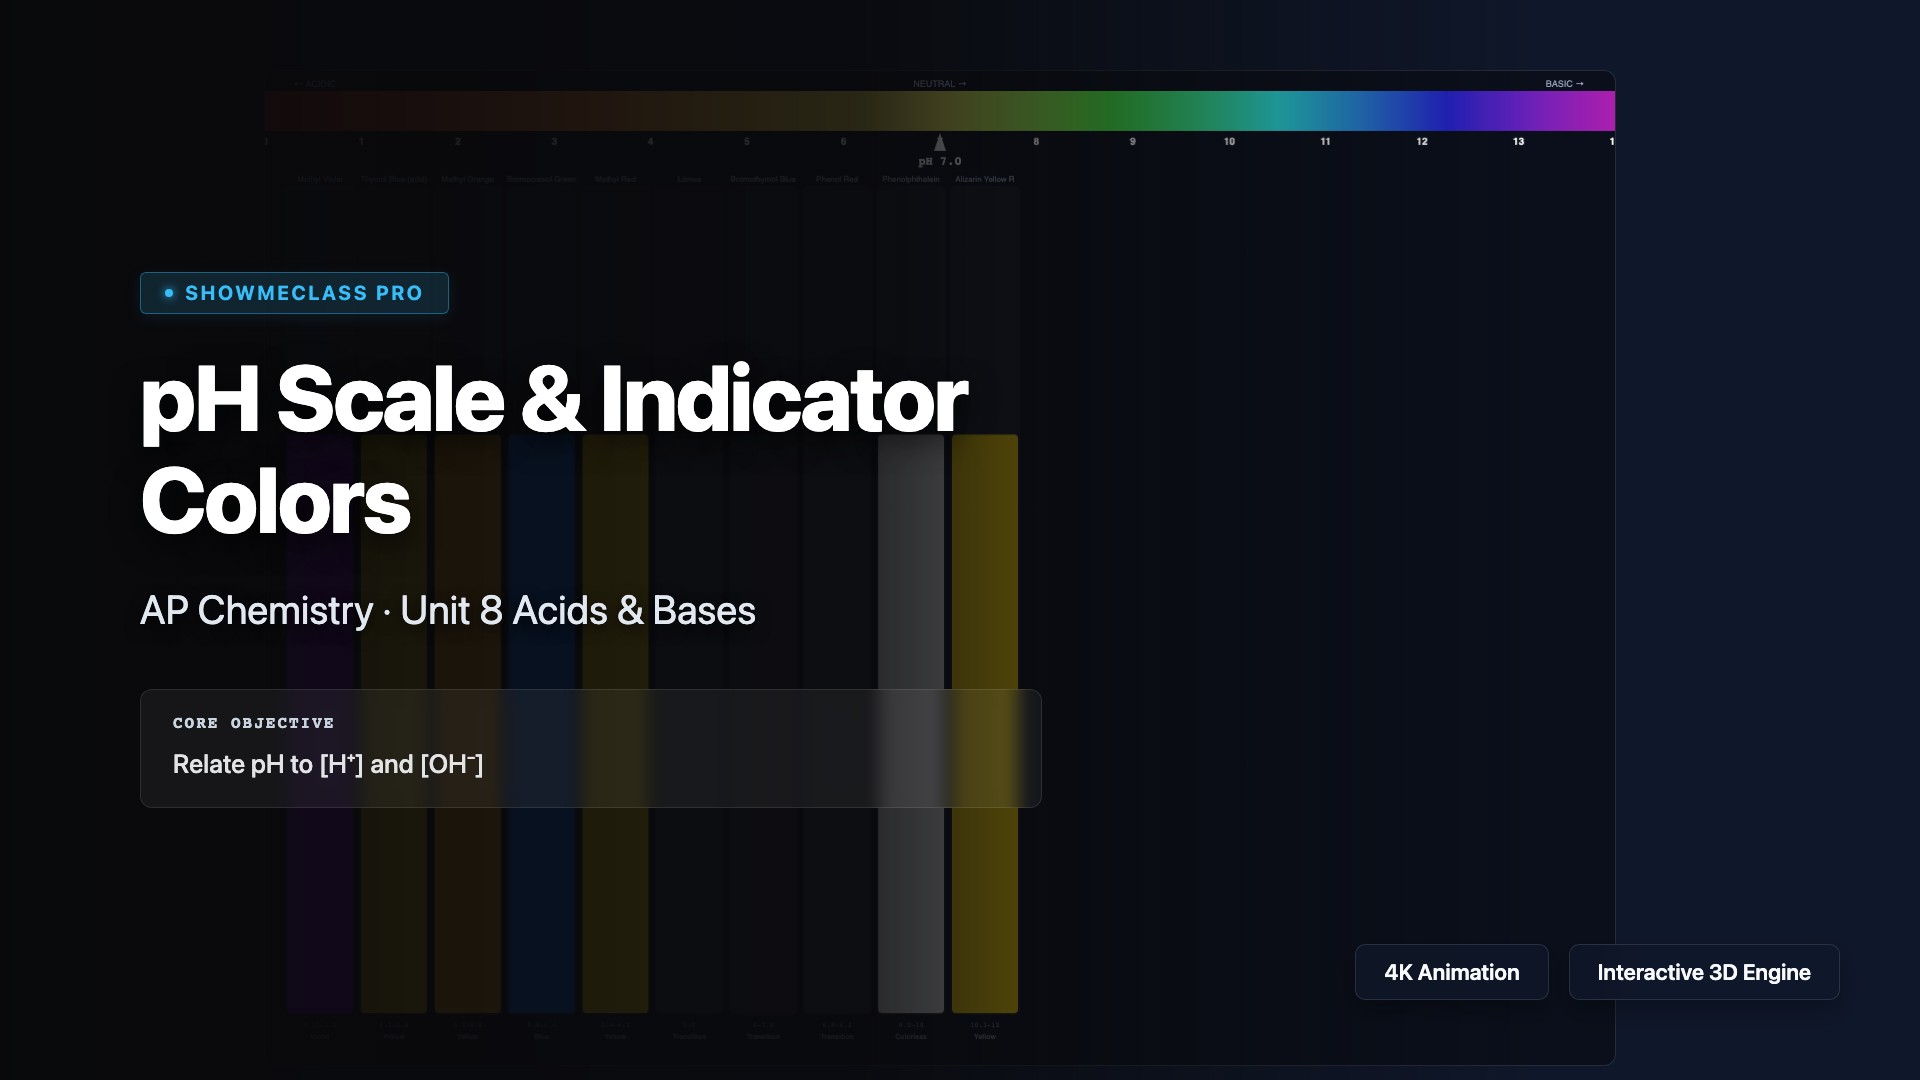
pH Scale & Indicator Color Simulator
Interactive pH scale with 10 common acid-base indicators displayed as color-changing test tubes. Slide pH from 0-14 to see real-time color transitions for methyl violet, thymol blue, methyl orange, bromocresol green, methyl red, litmus, bromothymol blue, phenol red, phenolphthalein, and alizarin yellow R. Calculates [H⁺], [OH⁻], and pOH.
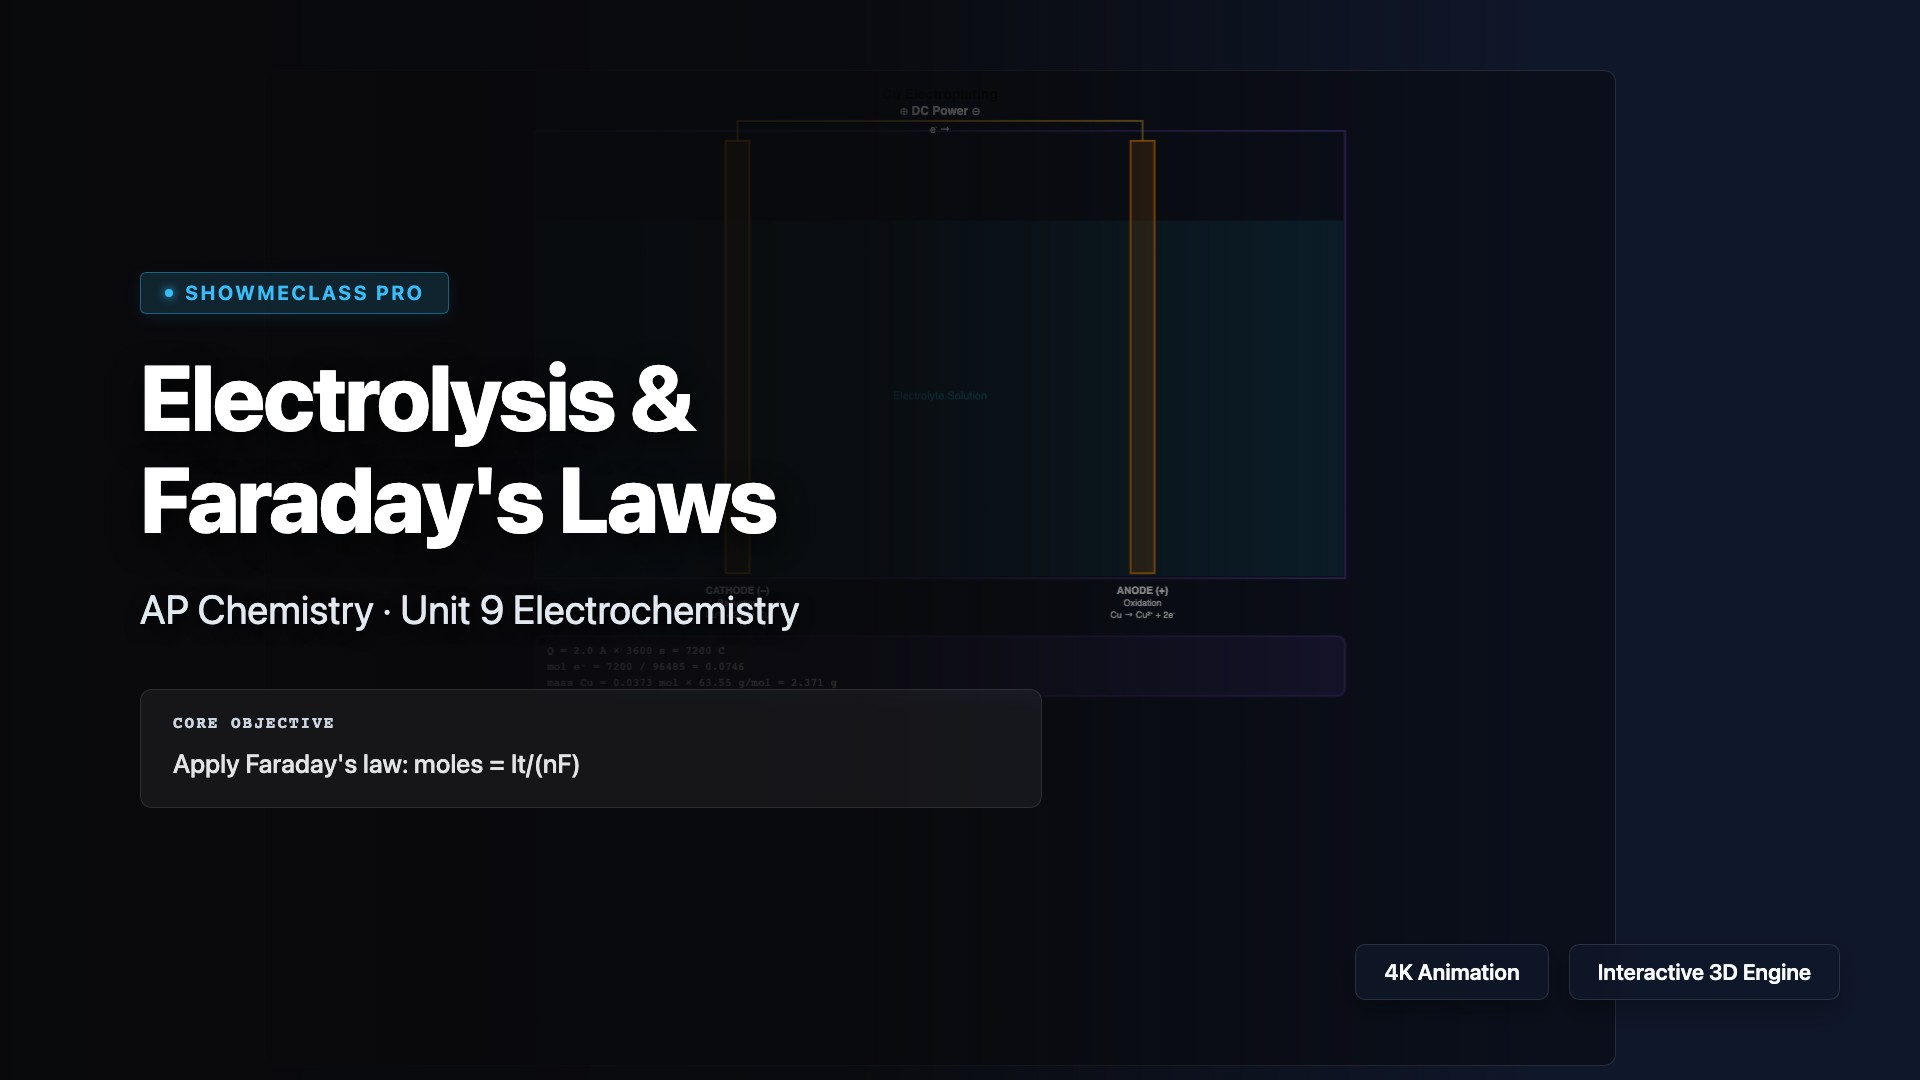
Electrolysis & Faraday's Laws
Interactive electrolysis cell simulator with Faraday's law calculations. Explore 4 electrolysis types (Cu plating, Ag plating, NaCl molten, Al smelting) with visual cell diagram showing cathode/anode reactions. Adjustable current and time with step-by-step Q→mol e⁻→mol product→mass calculation.
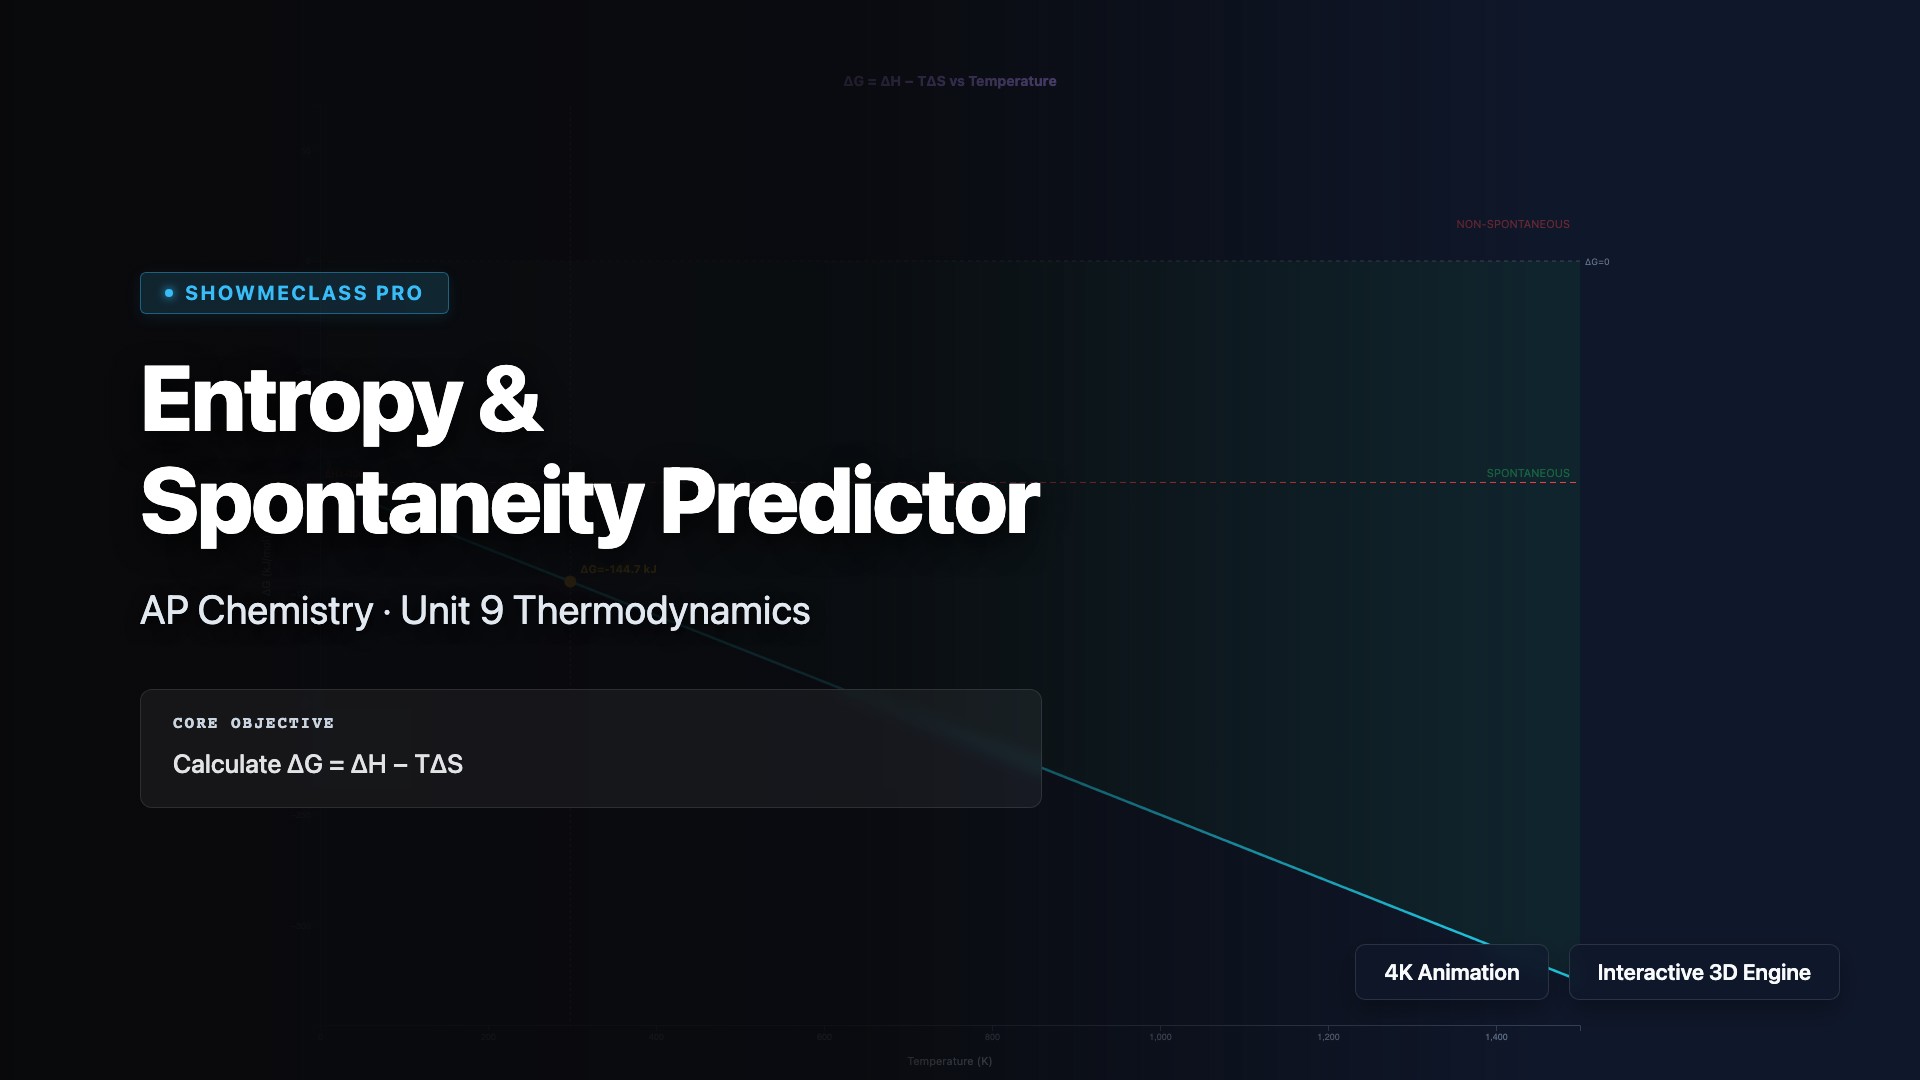
Entropy & Spontaneity Predictor
Interactive ΔG = ΔH − TΔS graph with adjustable enthalpy, entropy, and temperature. Visualizes Gibbs free energy vs temperature with spontaneous/non-spontaneous shading. Automatically determines crossover temperature and classifies into 4 ΔH/ΔS sign combinations with detailed explanations.