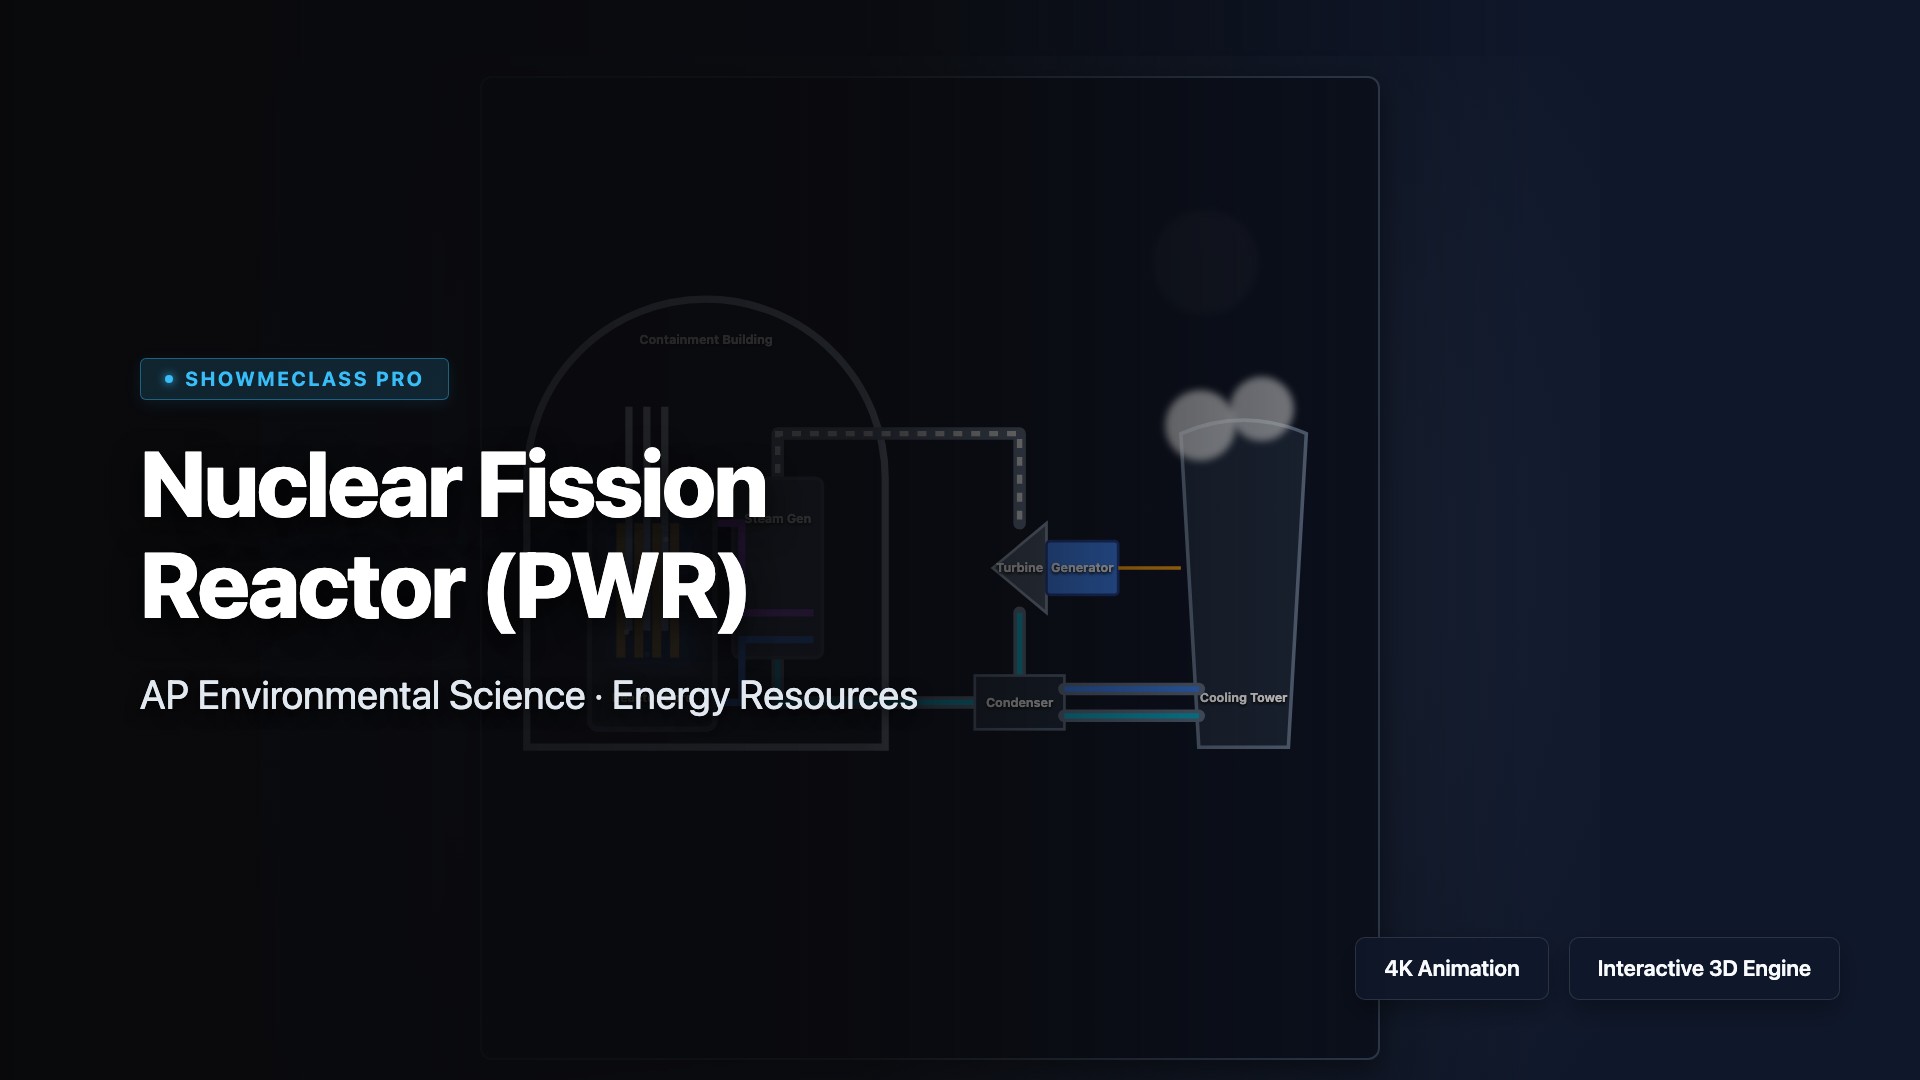
Nuclear Fission Reactor
Operate a Pressurized Water Reactor (PWR). Control the fission chain reaction using control rods and monitor core temperatures to prevent a nuclear meltdown.

Plate Tectonic Boundaries
Examine tectonic plate interactions. Select Divergent, Convergent, or Transform boundaries to visualize mantle convection driving lithospheric drift.
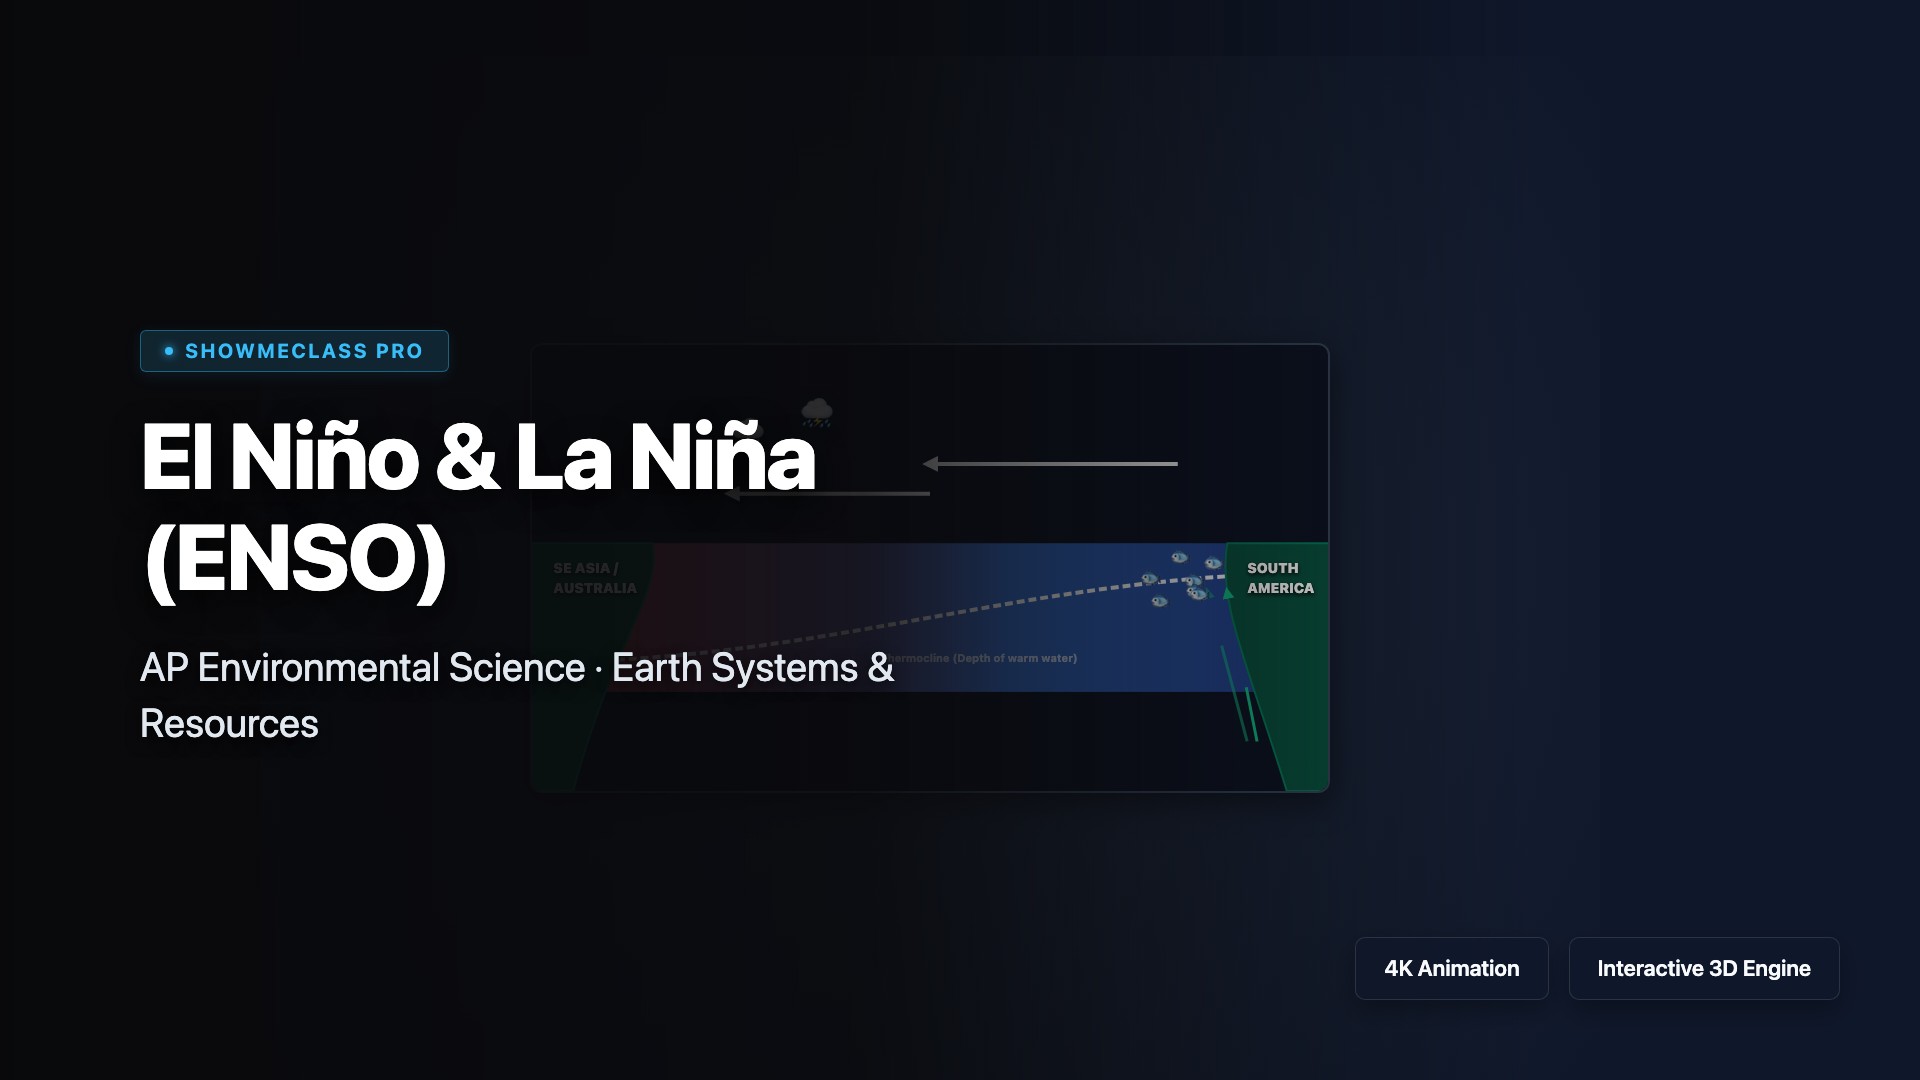
El Niño & La Niña (ENSO)
Analyze the El Niño-Southern Oscillation (ENSO). Toggle between Normal, El Niño, and La Niña phases to observe shifting trade winds, ocean temperatures, and upwelling.
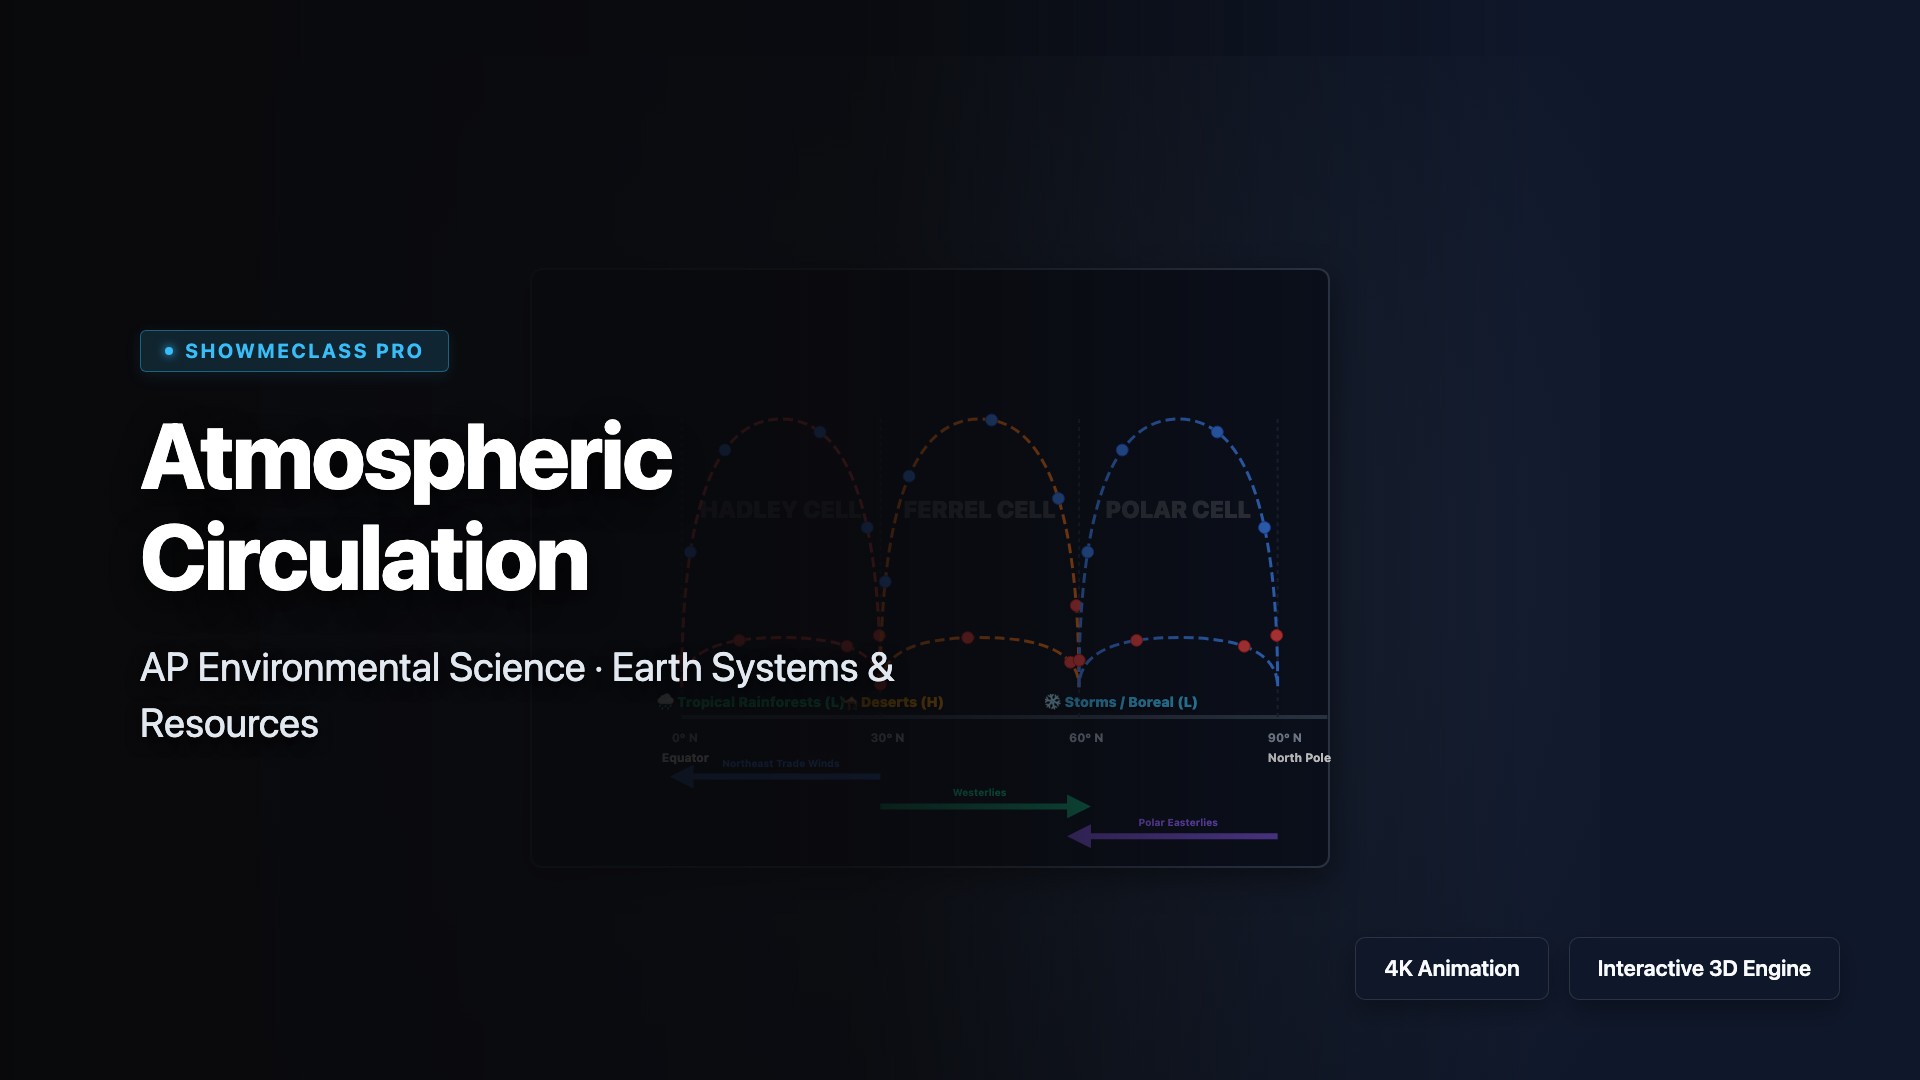
Atmospheric Circulation
Observe global wind patterns across the Earth's cross-section. Toggle the Coriolis effect to see how the Earth's rotation deflects the Trade Winds and Westerlies within the Hadley, Ferrel, and Polar cells.
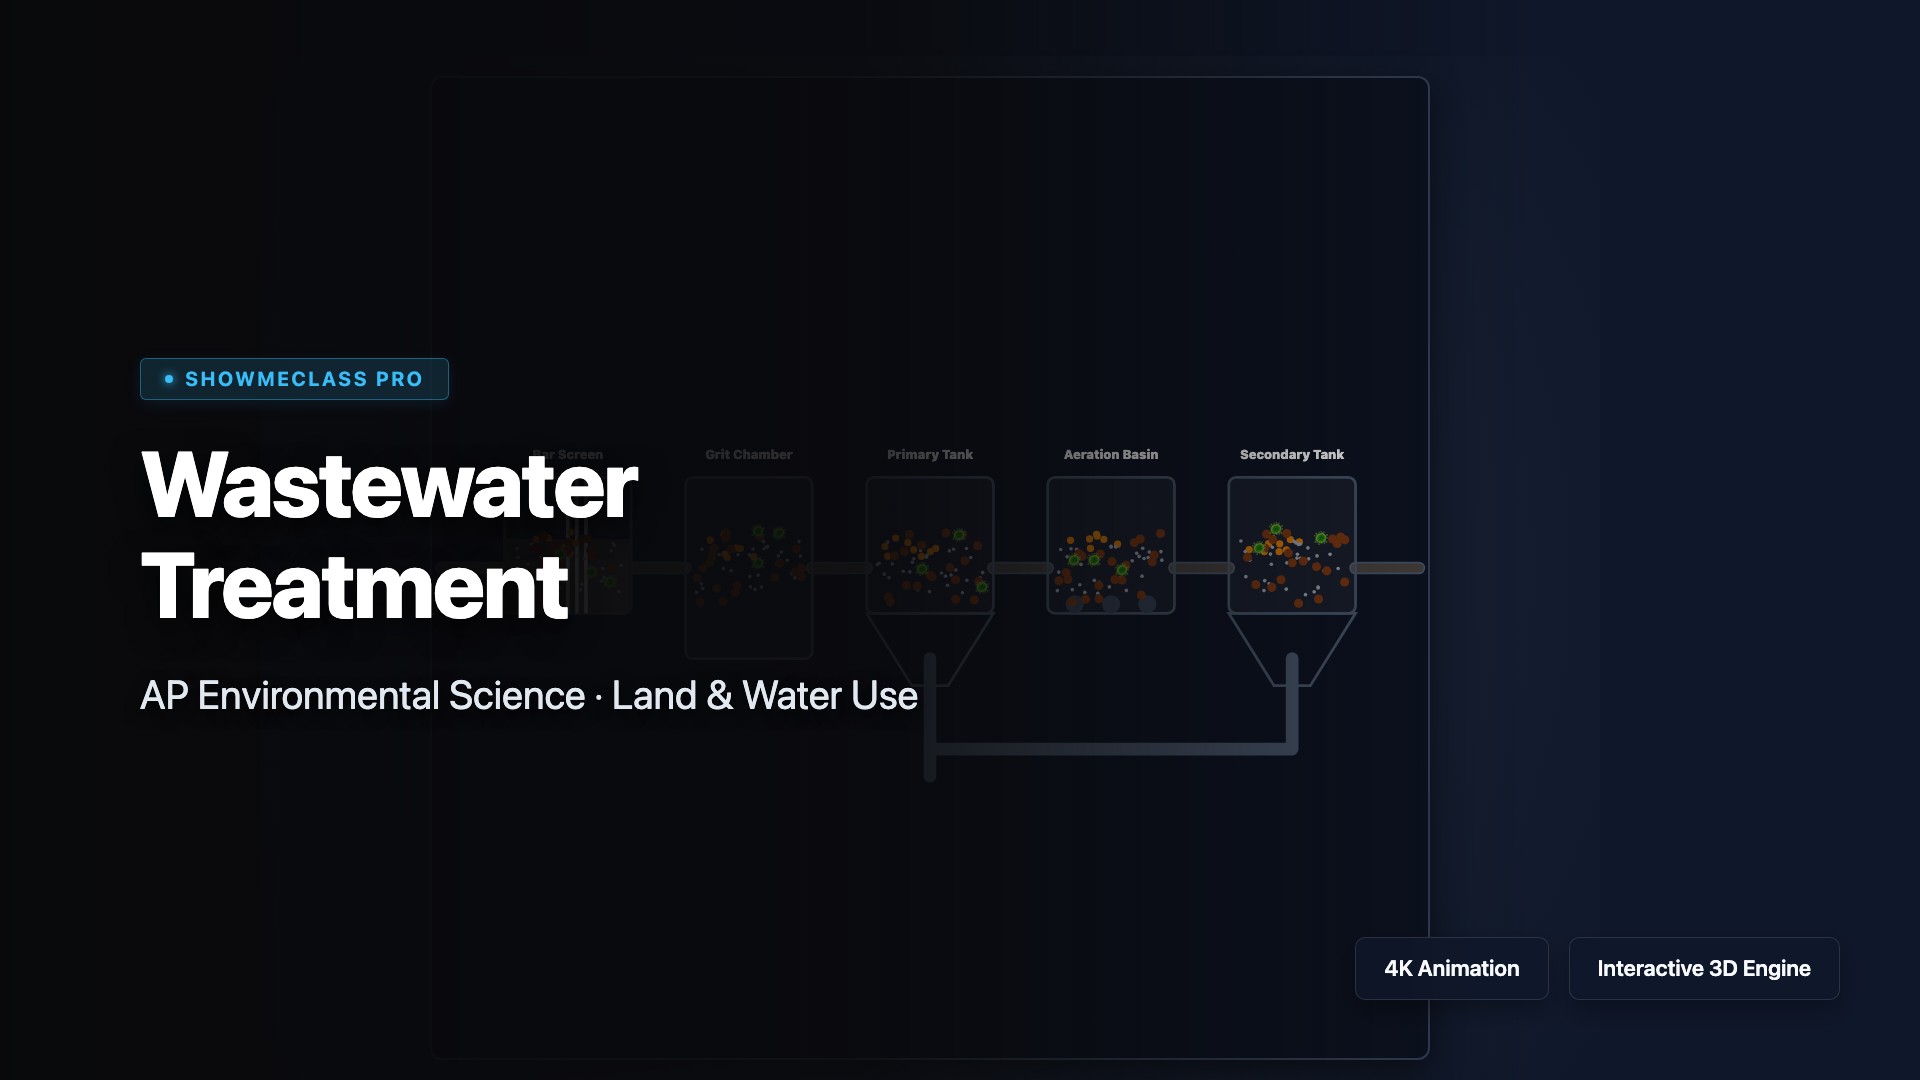
Wastewater Treatment
Examine the physical, biological, and chemical stages of sewage treatment. Understand the role of aeration and activated sludge in reducing biological oxygen demand (BOD).
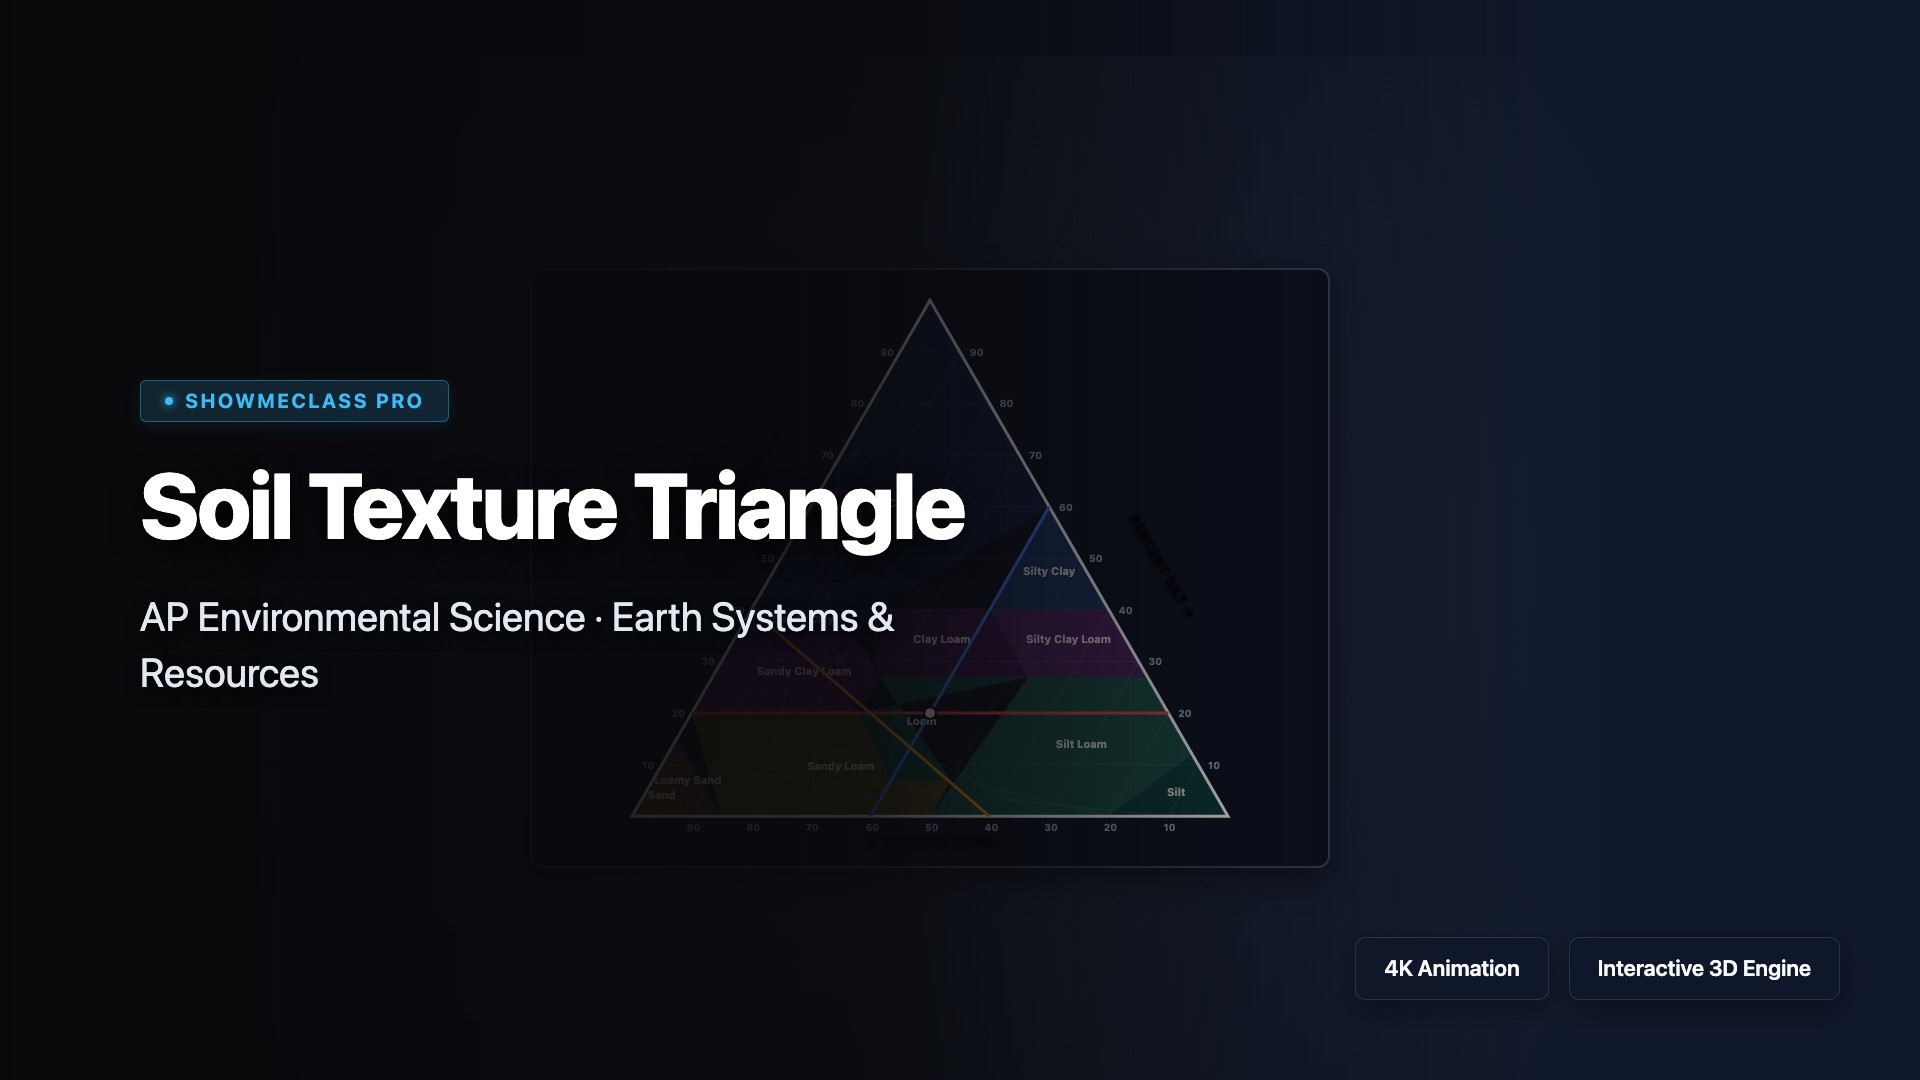
Soil Texture Triangle
Determine soil classification using the USDA Soil Texture Triangle. Adjust Sand, Silt, and Clay percentages to find the precise intersection point.
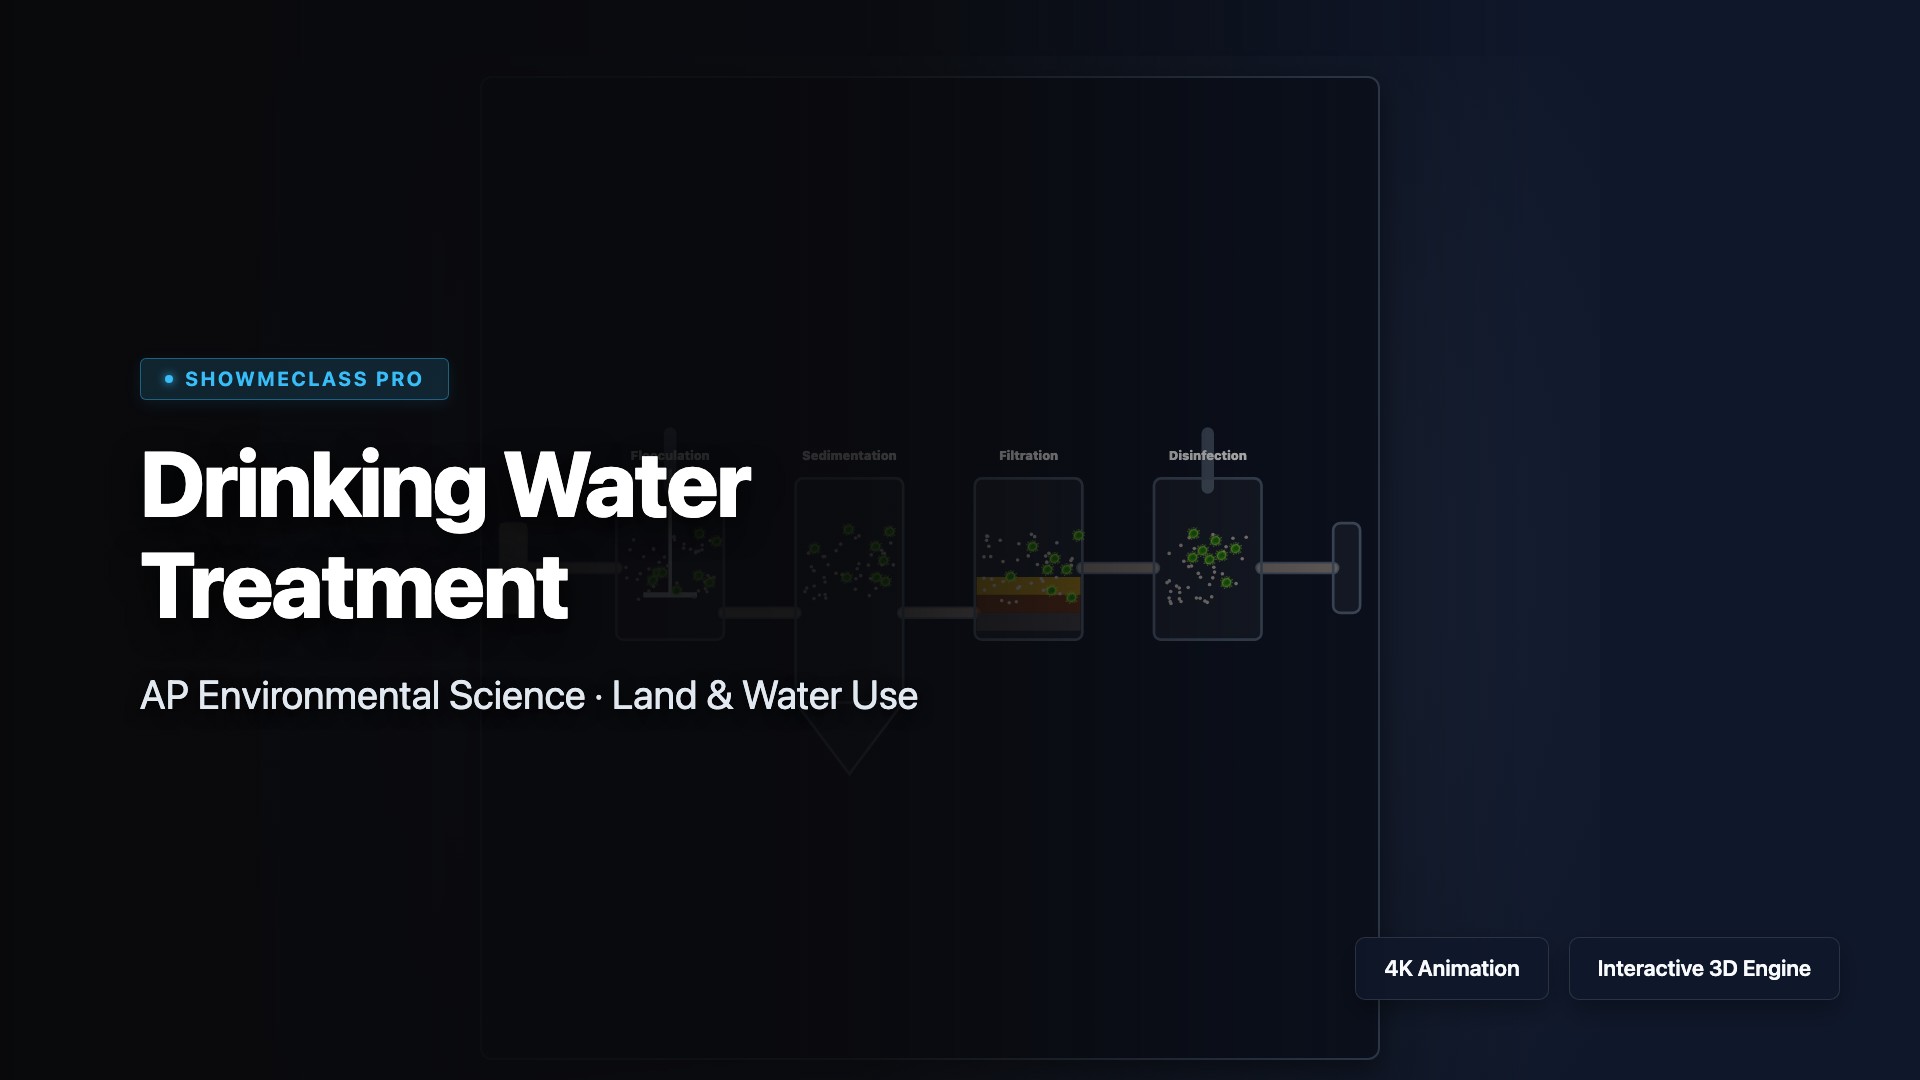
Drinking Water Treatment
Step through the municipal drinking water purification process. Observe coagulation, flocculation, sedimentation, filtration, and disinfection.
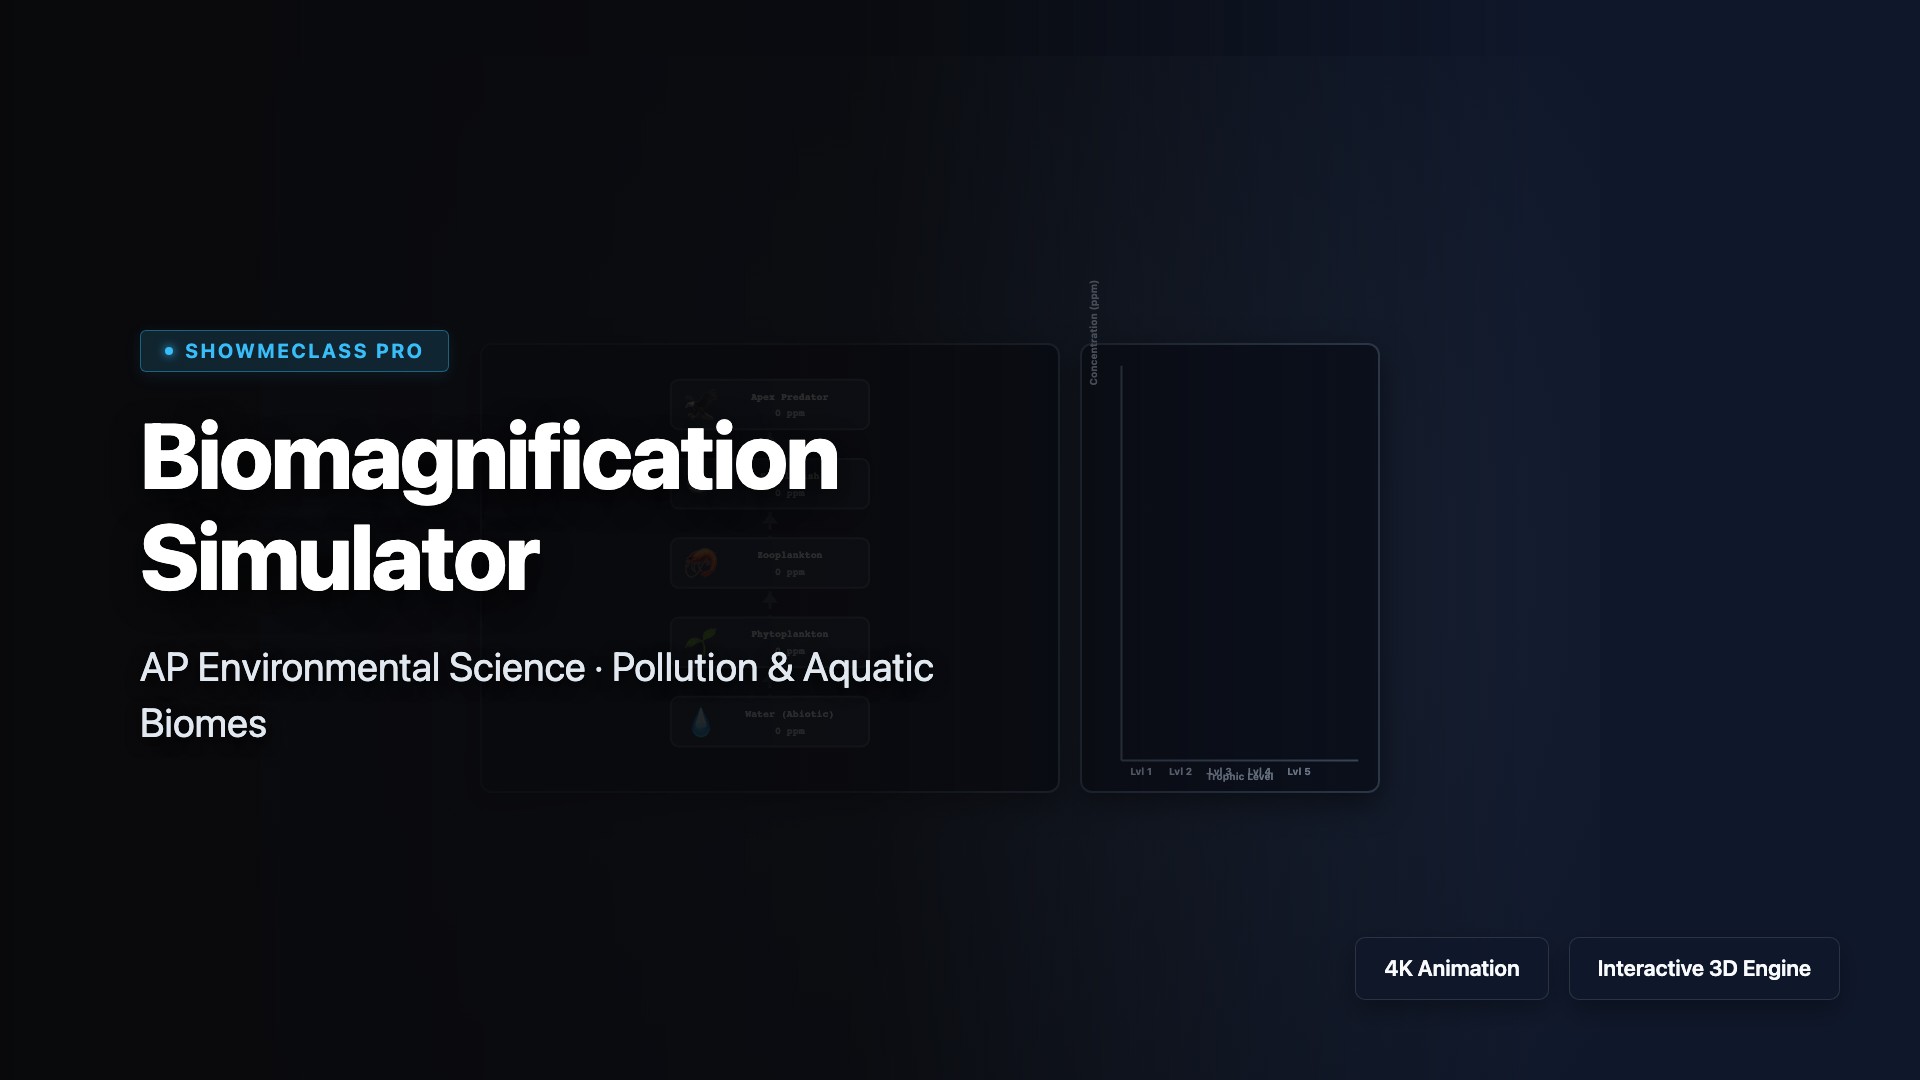
Biomagnification Simulator
Introduce a trace amount of a persistent toxin like DDT into an aquatic ecosystem and watch as the concentration multiplies exponentially up the food chain to the apex predator.
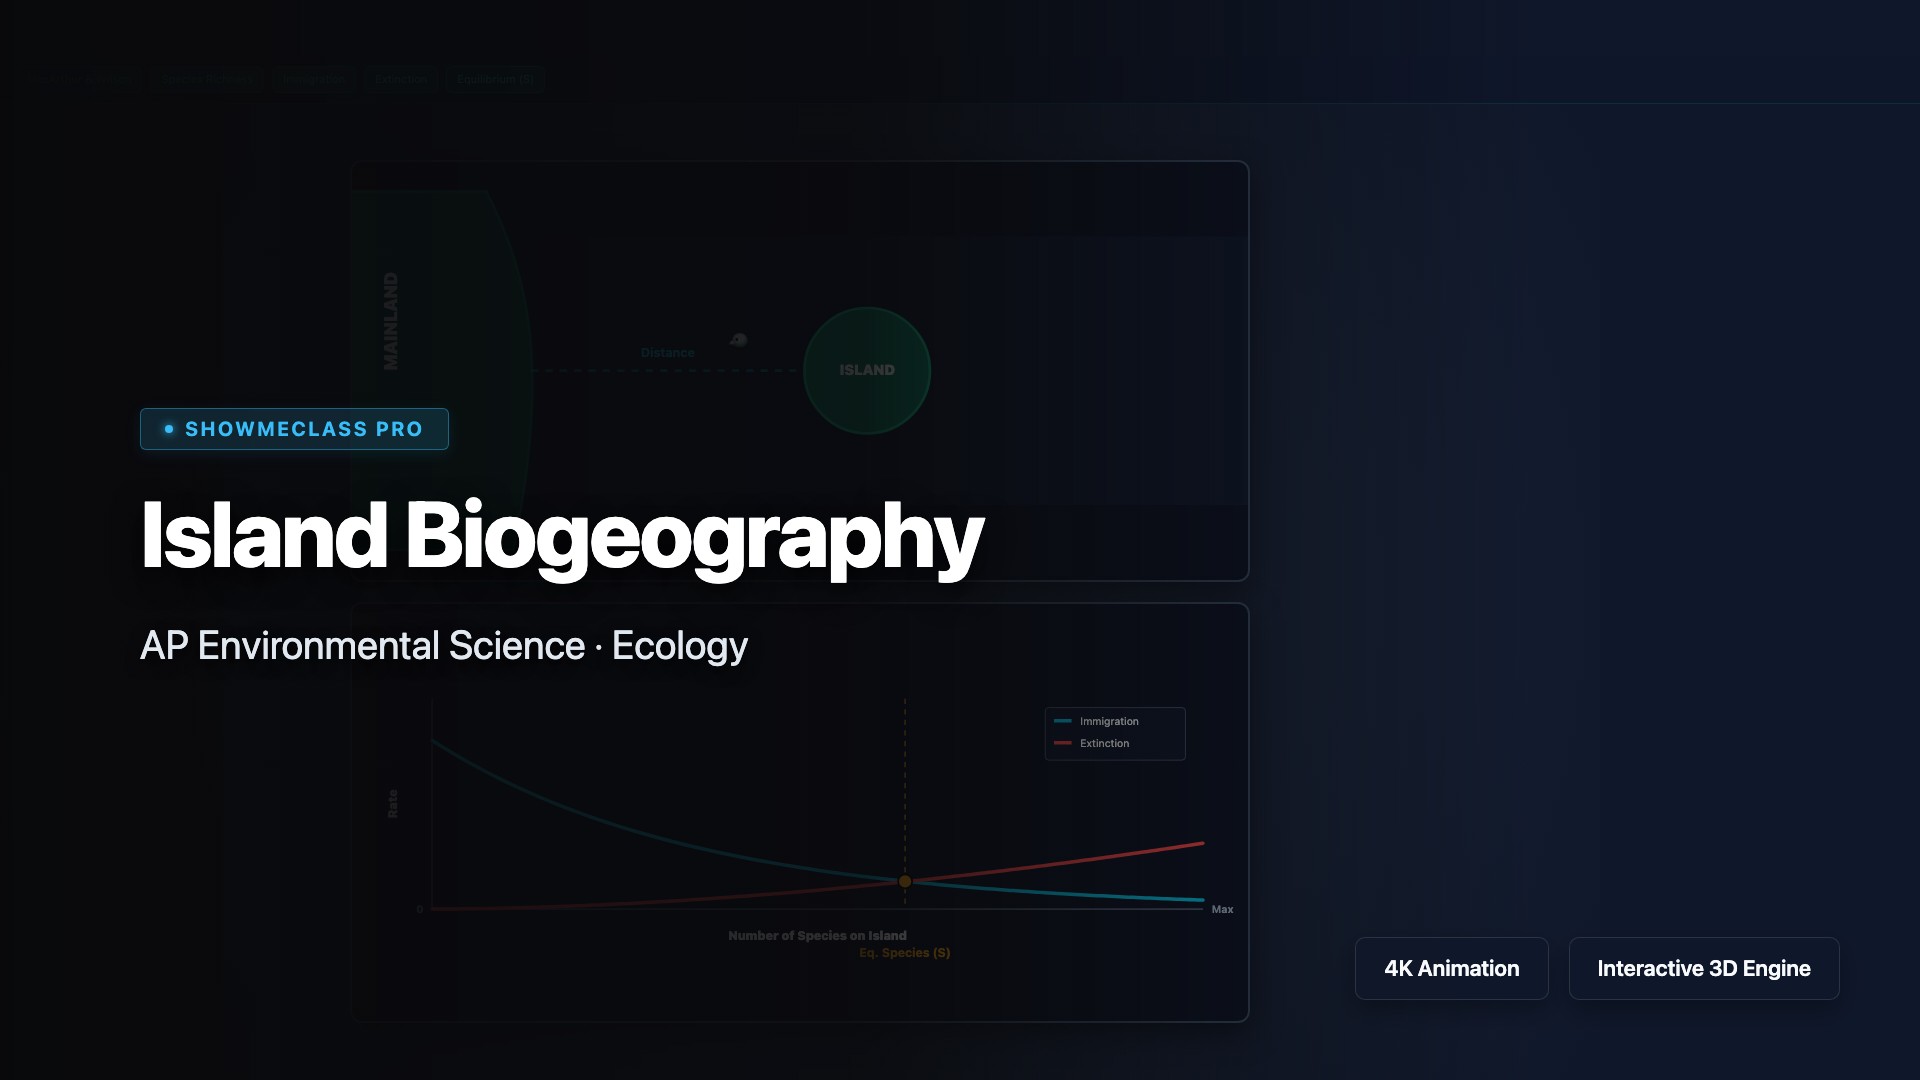
Island Biogeography Model
Simulate the Theory of Island Biogeography by adjusting island size and distance from the mainland. Observe how immigration and extinction rates determine the equilibrium number of species.
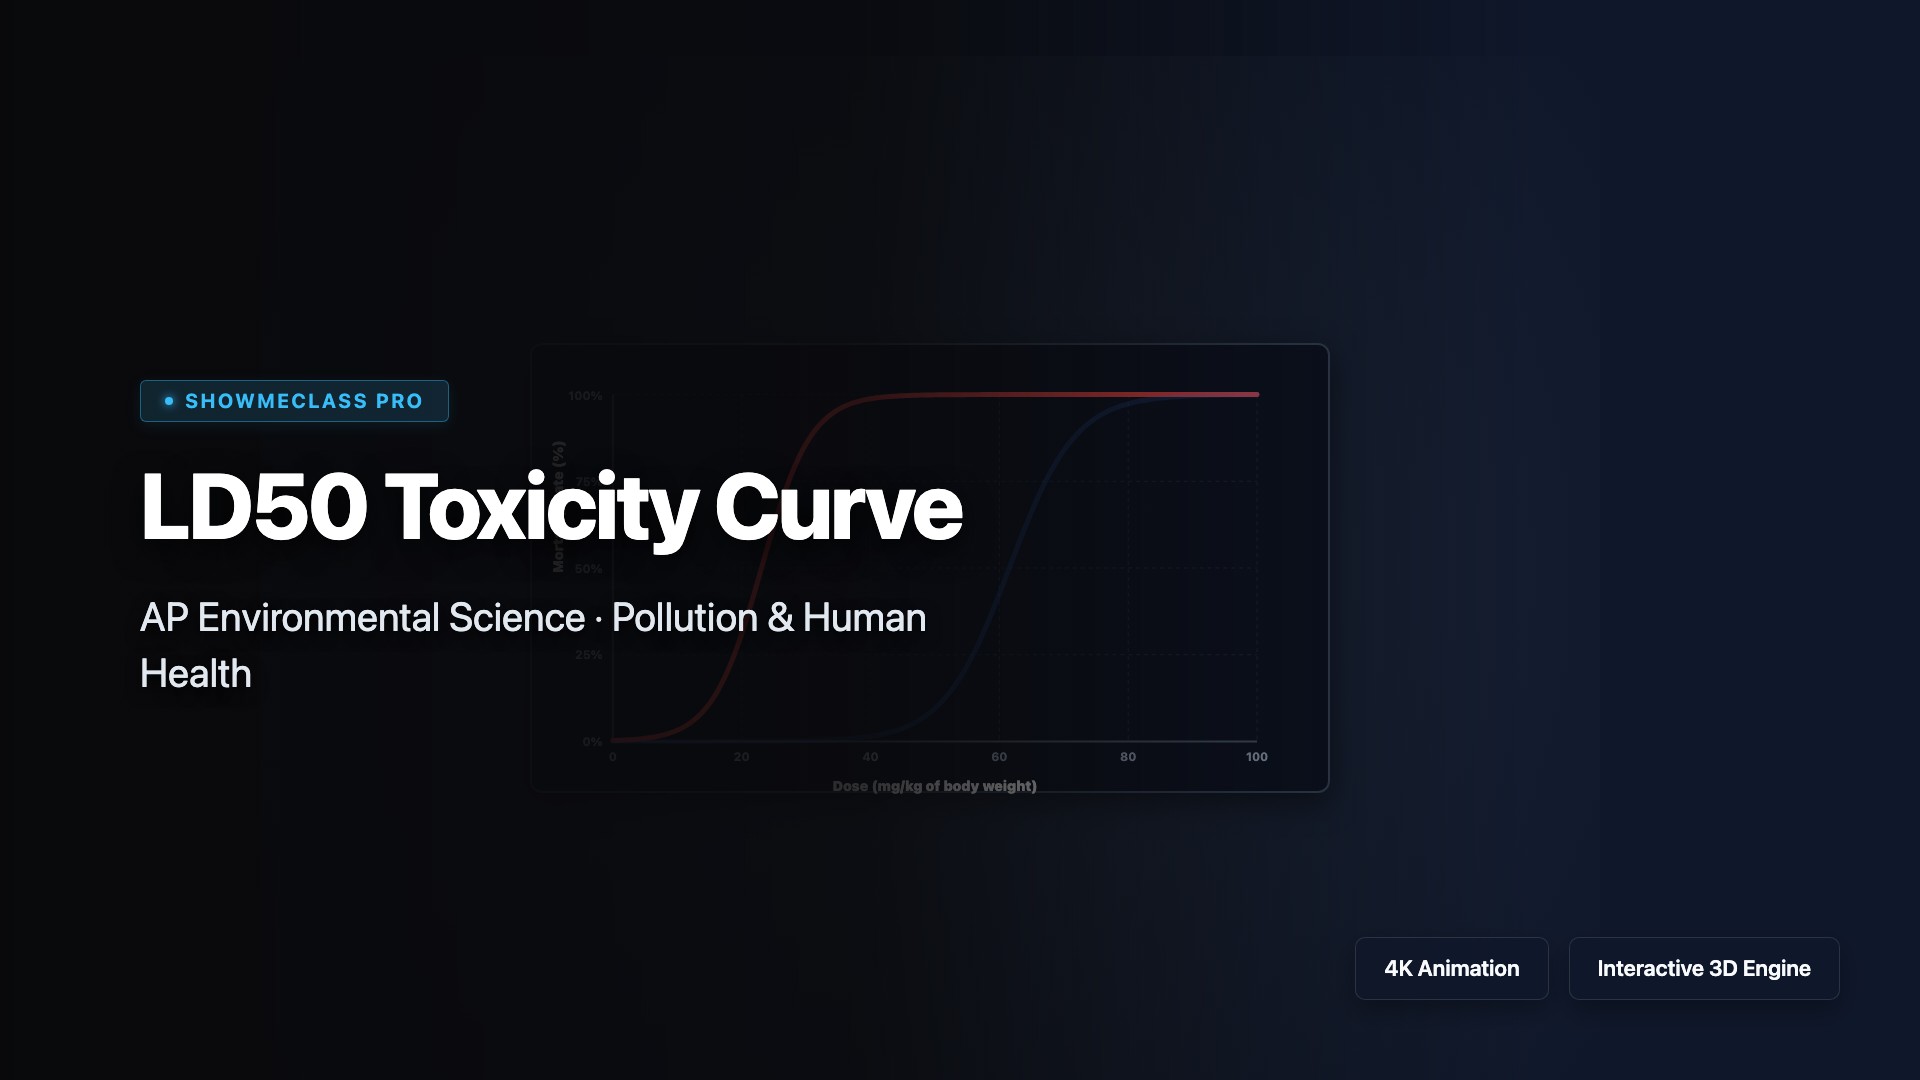
LD50 Toxicity Curve
Analyze dose-response sigmoidal curves to determine the Lethal Dose 50% (LD50) of various chemical toxins. Understand acute toxicity and threshold levels.
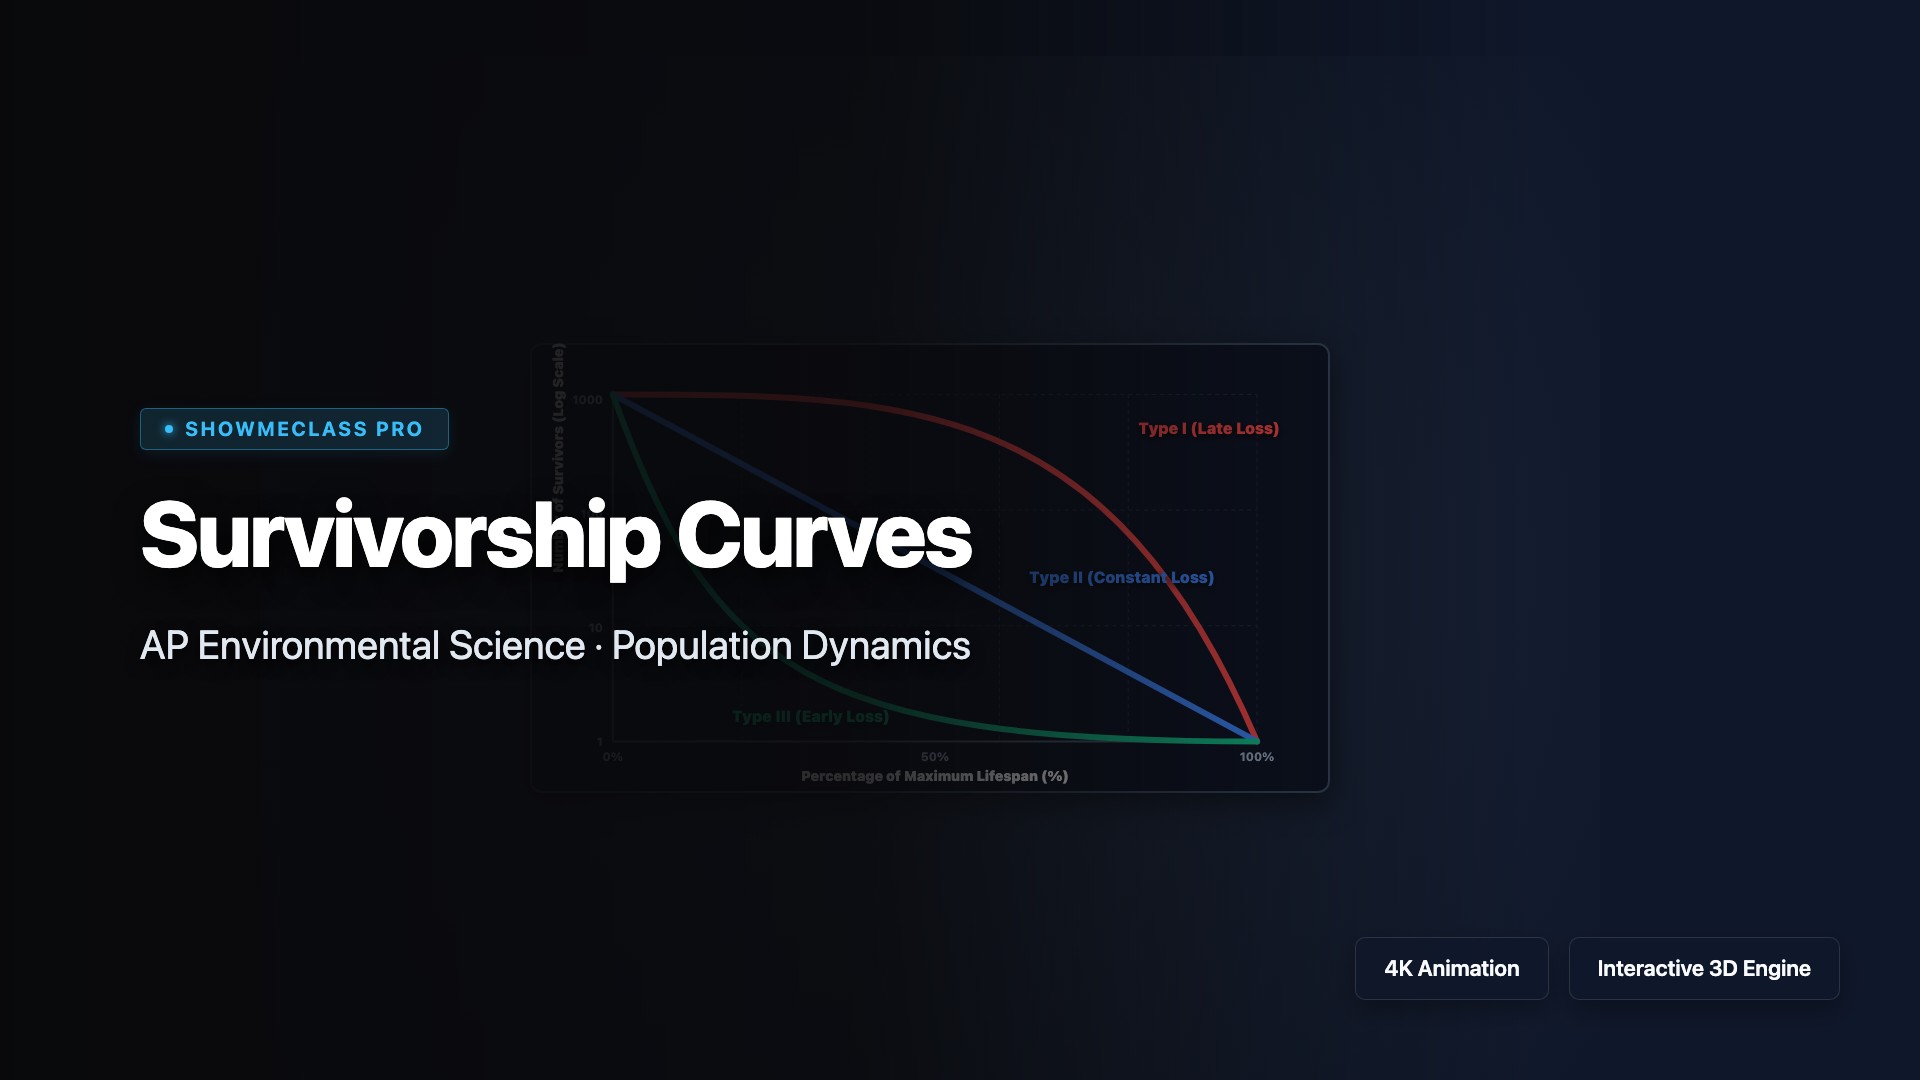
Survivorship Curves
Compare Type I, Type II, and Type III survivorship curves. Understand the distinction between K-selected and r-selected reproductive strategies across the animal kingdom.
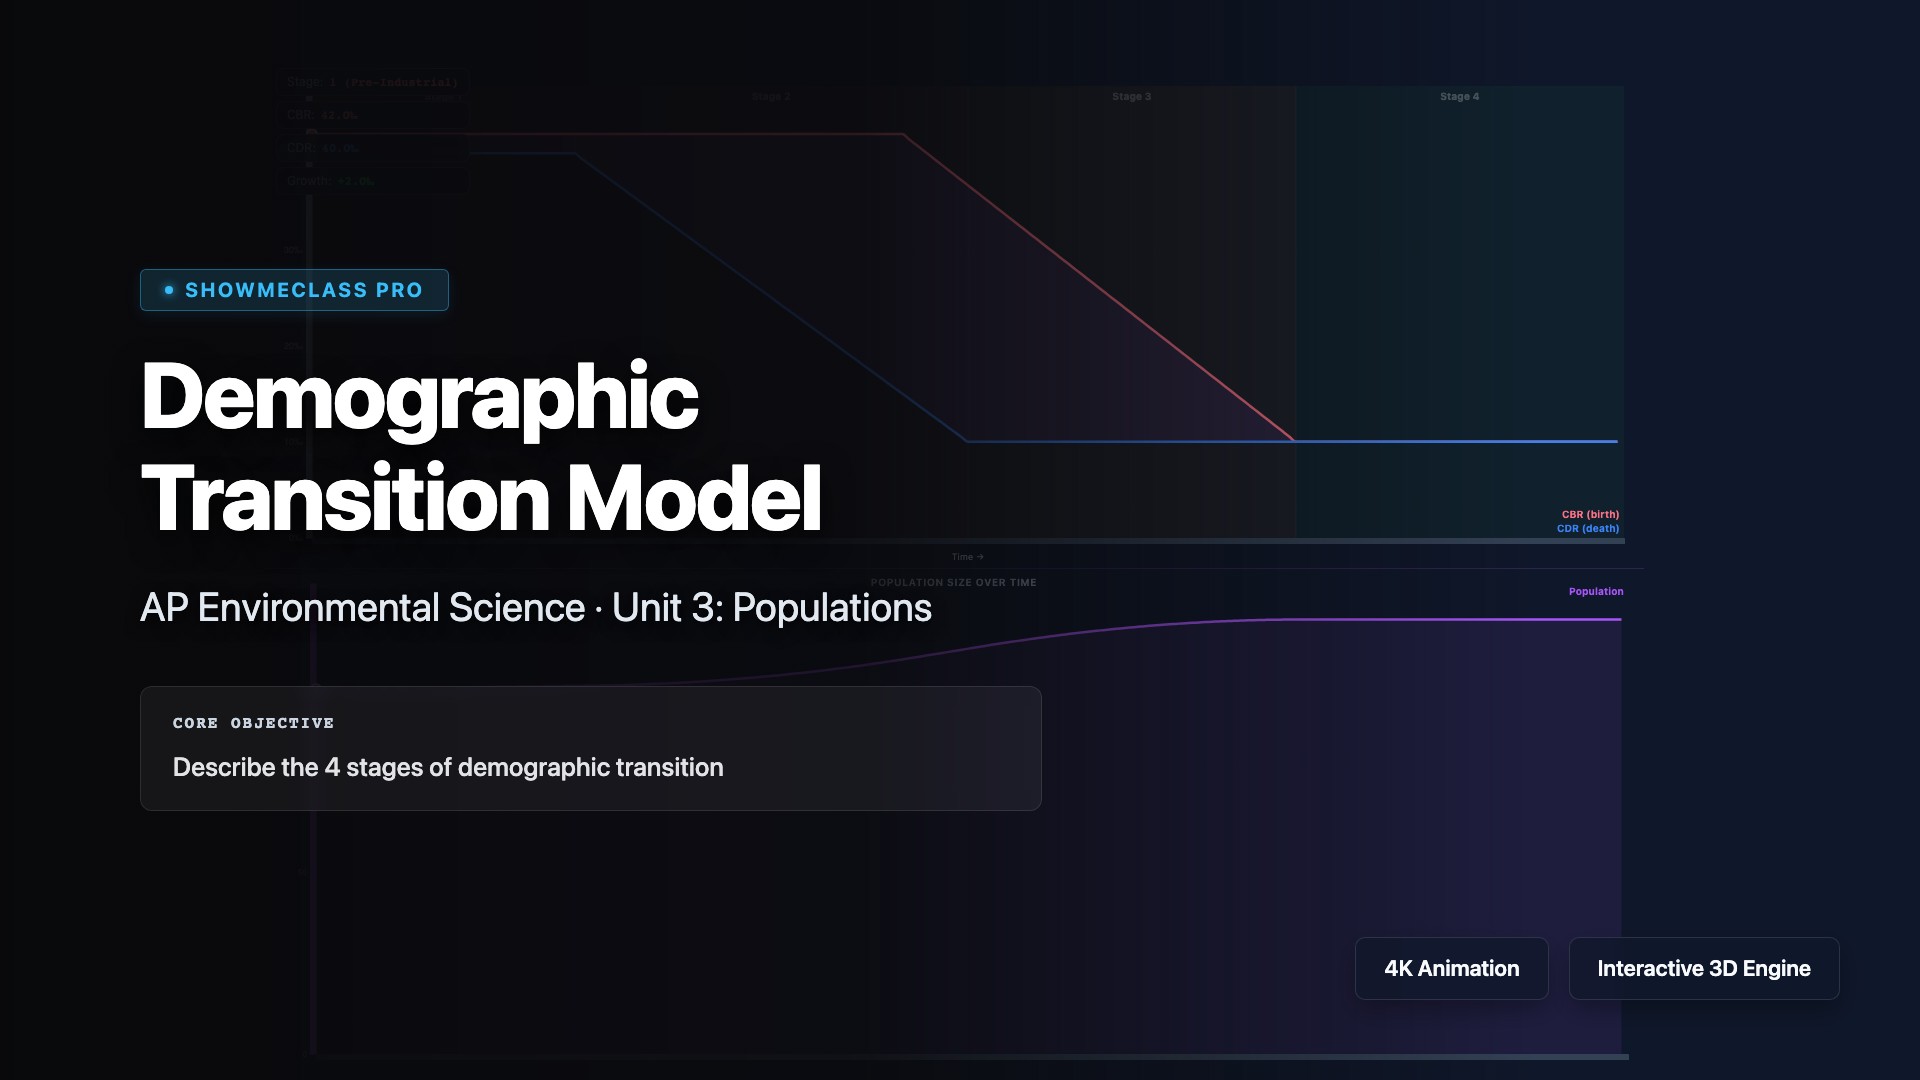
Demographic Transition Model
Explore the Demographic Transition Model (DTM) that describes population changes as countries develop economically. Visualize the five stages: Stage 1 (high birth and death rates, stable population), Stage 2 (declining death rates, population explosion), Stage 3 (declining birth rates, slowing growth), Stage 4 (low birth and death rates, stable population), and Stage 5 (declining population). Understand how industrialization, healthcare, education, and women's empowerment drive demographic shifts.

Greenhouse Effect & Global Warming
Understand the greenhouse effect where atmospheric gases trap infrared radiation, warming Earth's surface. Visualize how solar radiation passes through the atmosphere, Earth absorbs and re-emits it as infrared, and greenhouse gases (CO₂, CH₄, N₂O, water vapor) absorb this heat. Explore how increased greenhouse gas concentrations from human activities enhance this natural effect, causing global warming, climate change, sea level rise, and ecosystem disruption.
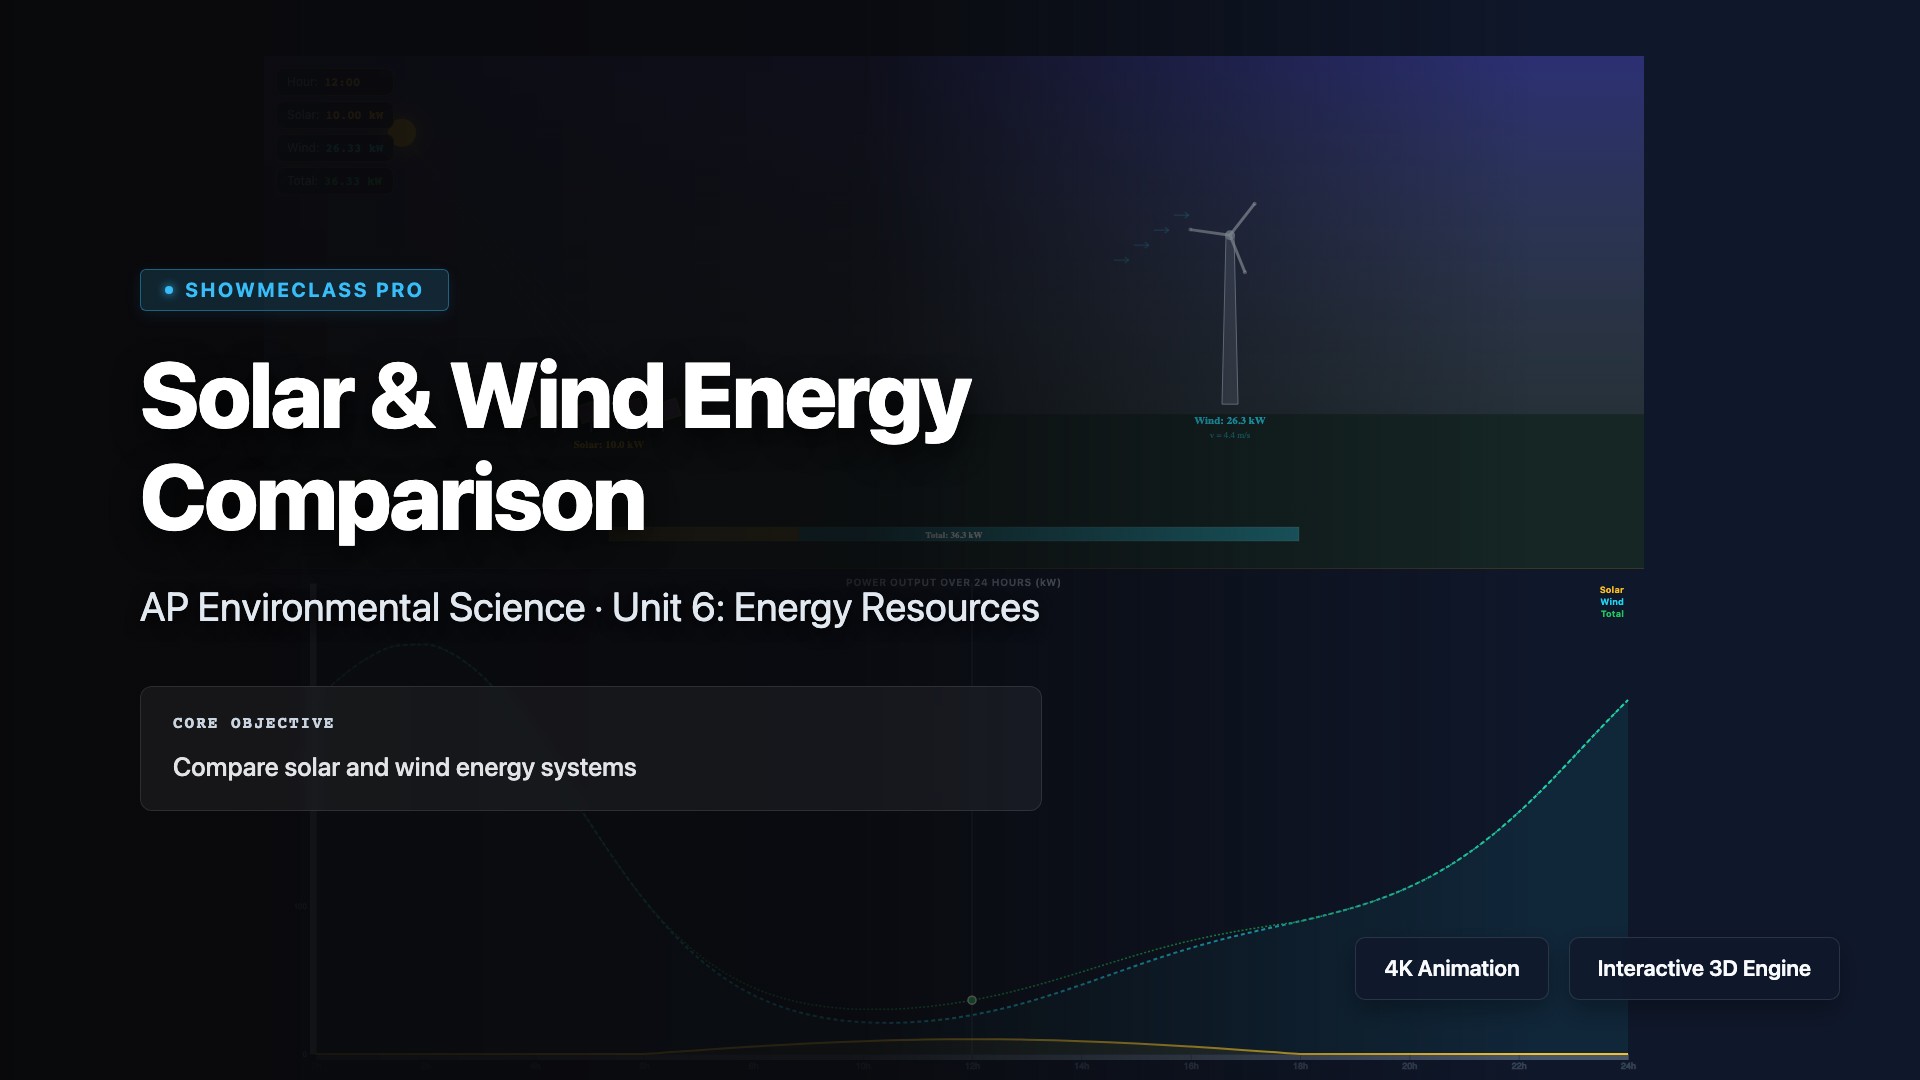
Solar & Wind Energy Comparison
Compare solar and wind energy as renewable alternatives to fossil fuels. Analyze photovoltaic cells converting sunlight to electricity versus wind turbines harnessing kinetic energy. Evaluate advantages (clean, renewable, decreasing costs) and disadvantages (intermittency, land use, initial investment, energy storage needs). Understand capacity factors, geographic suitability, environmental impacts, and how these technologies contribute to sustainable energy transitions and climate change mitigation.
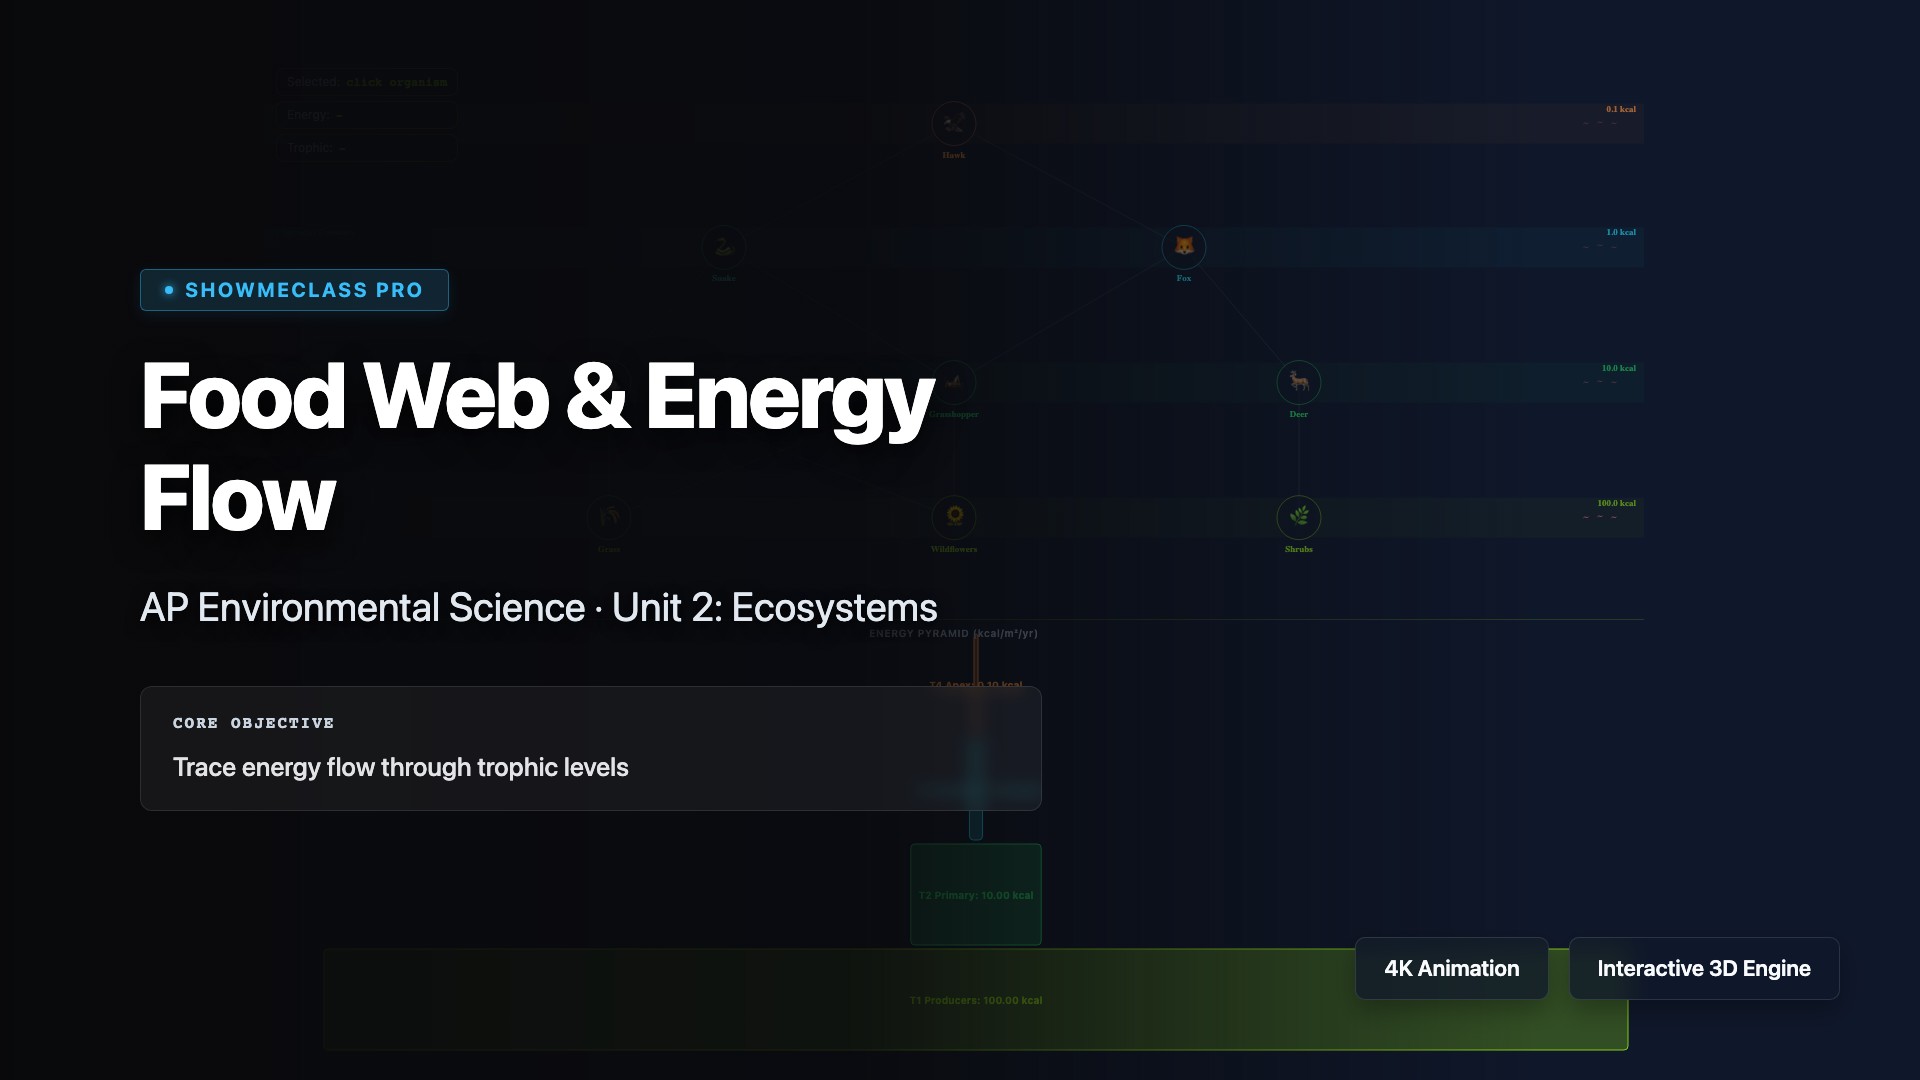
Food Web & Energy Flow
Visualize food webs showing feeding relationships and energy flow through ecosystems. Explore trophic levels from producers (autotrophs capturing solar energy) through primary consumers (herbivores), secondary consumers (carnivores), tertiary consumers, and decomposers. Understand the 10% rule where only about 10% of energy transfers between trophic levels, explaining why food chains rarely exceed 4-5 levels and why biomass pyramids taper toward top predators.
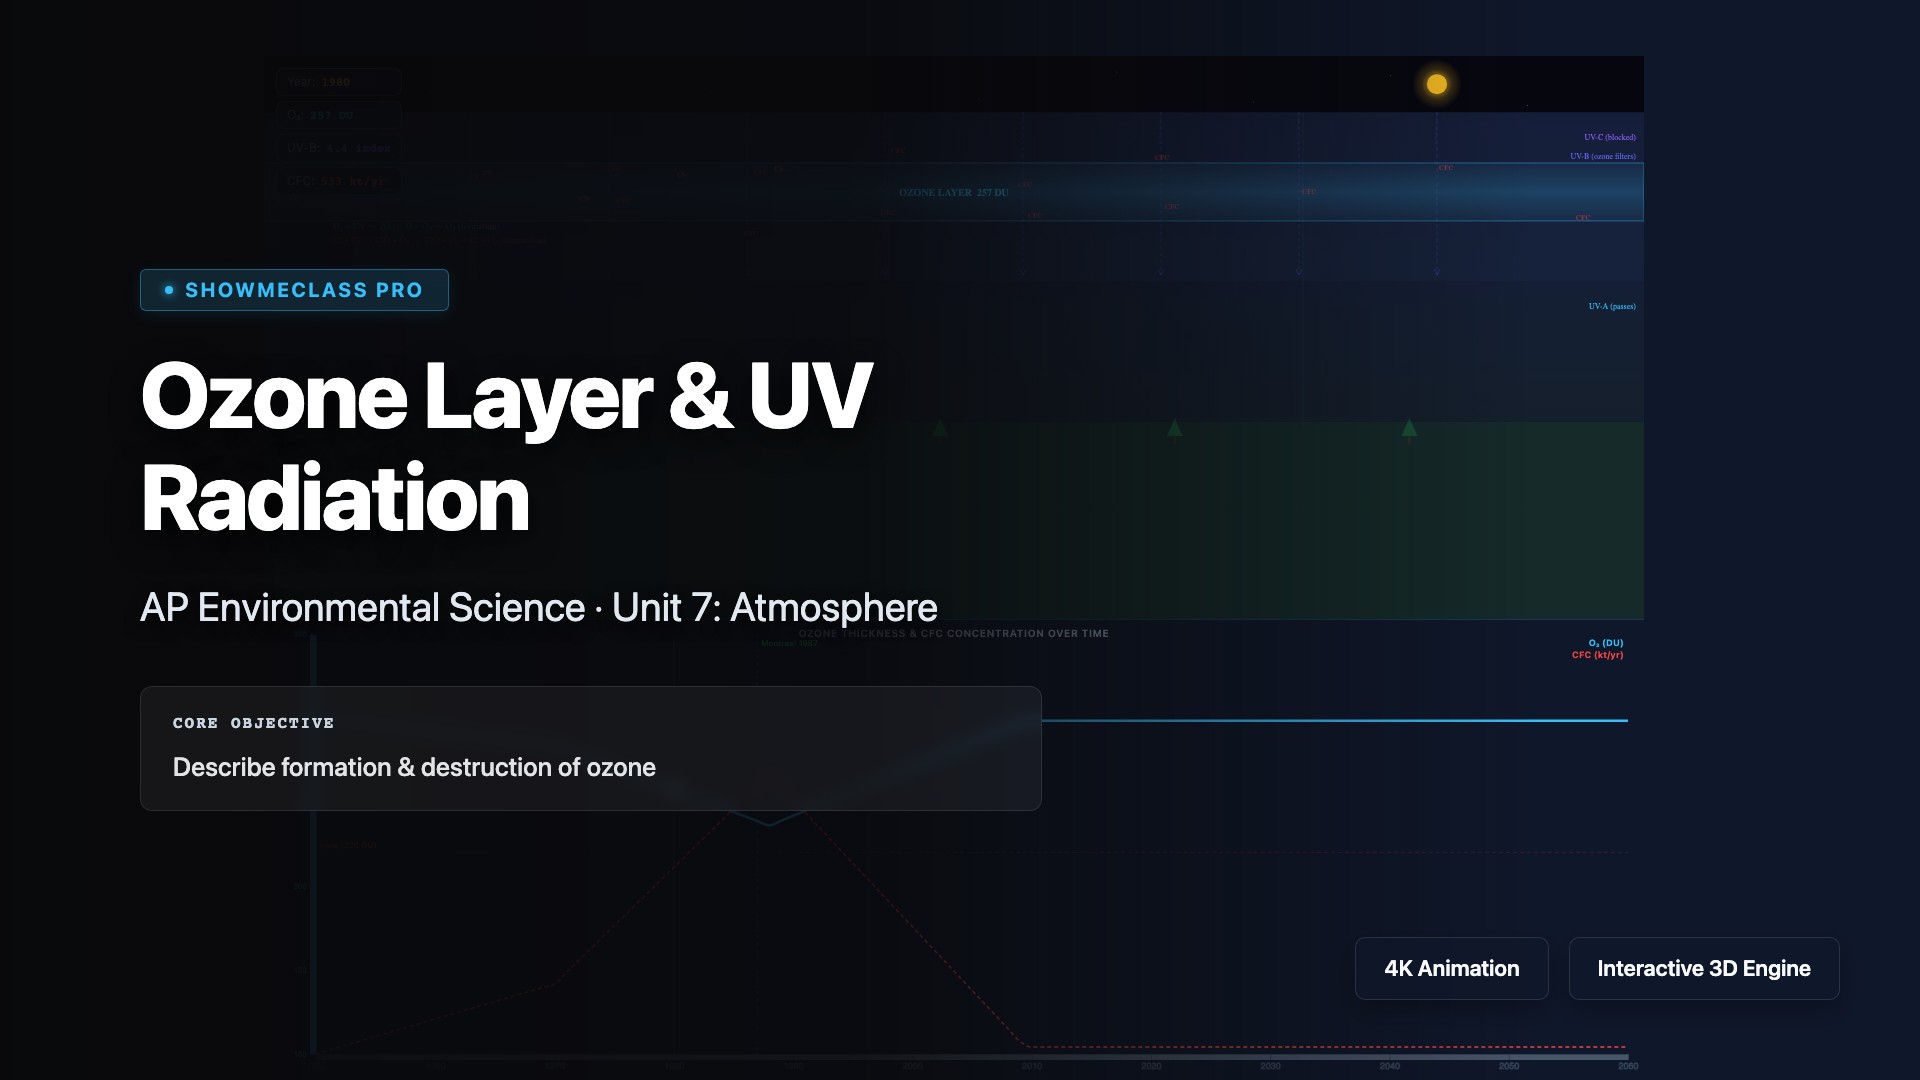
Ozone Layer & UV Radiation
Explore the stratospheric ozone layer that absorbs harmful ultraviolet (UV) radiation, protecting life on Earth. Understand how chlorofluorocarbons (CFCs) from aerosols and refrigerants catalytically destroy ozone molecules, creating the ozone hole over Antarctica. Learn about the Montreal Protocol (1987), the most successful international environmental agreement, which phased out ozone-depleting substances and enabled ozone layer recovery.
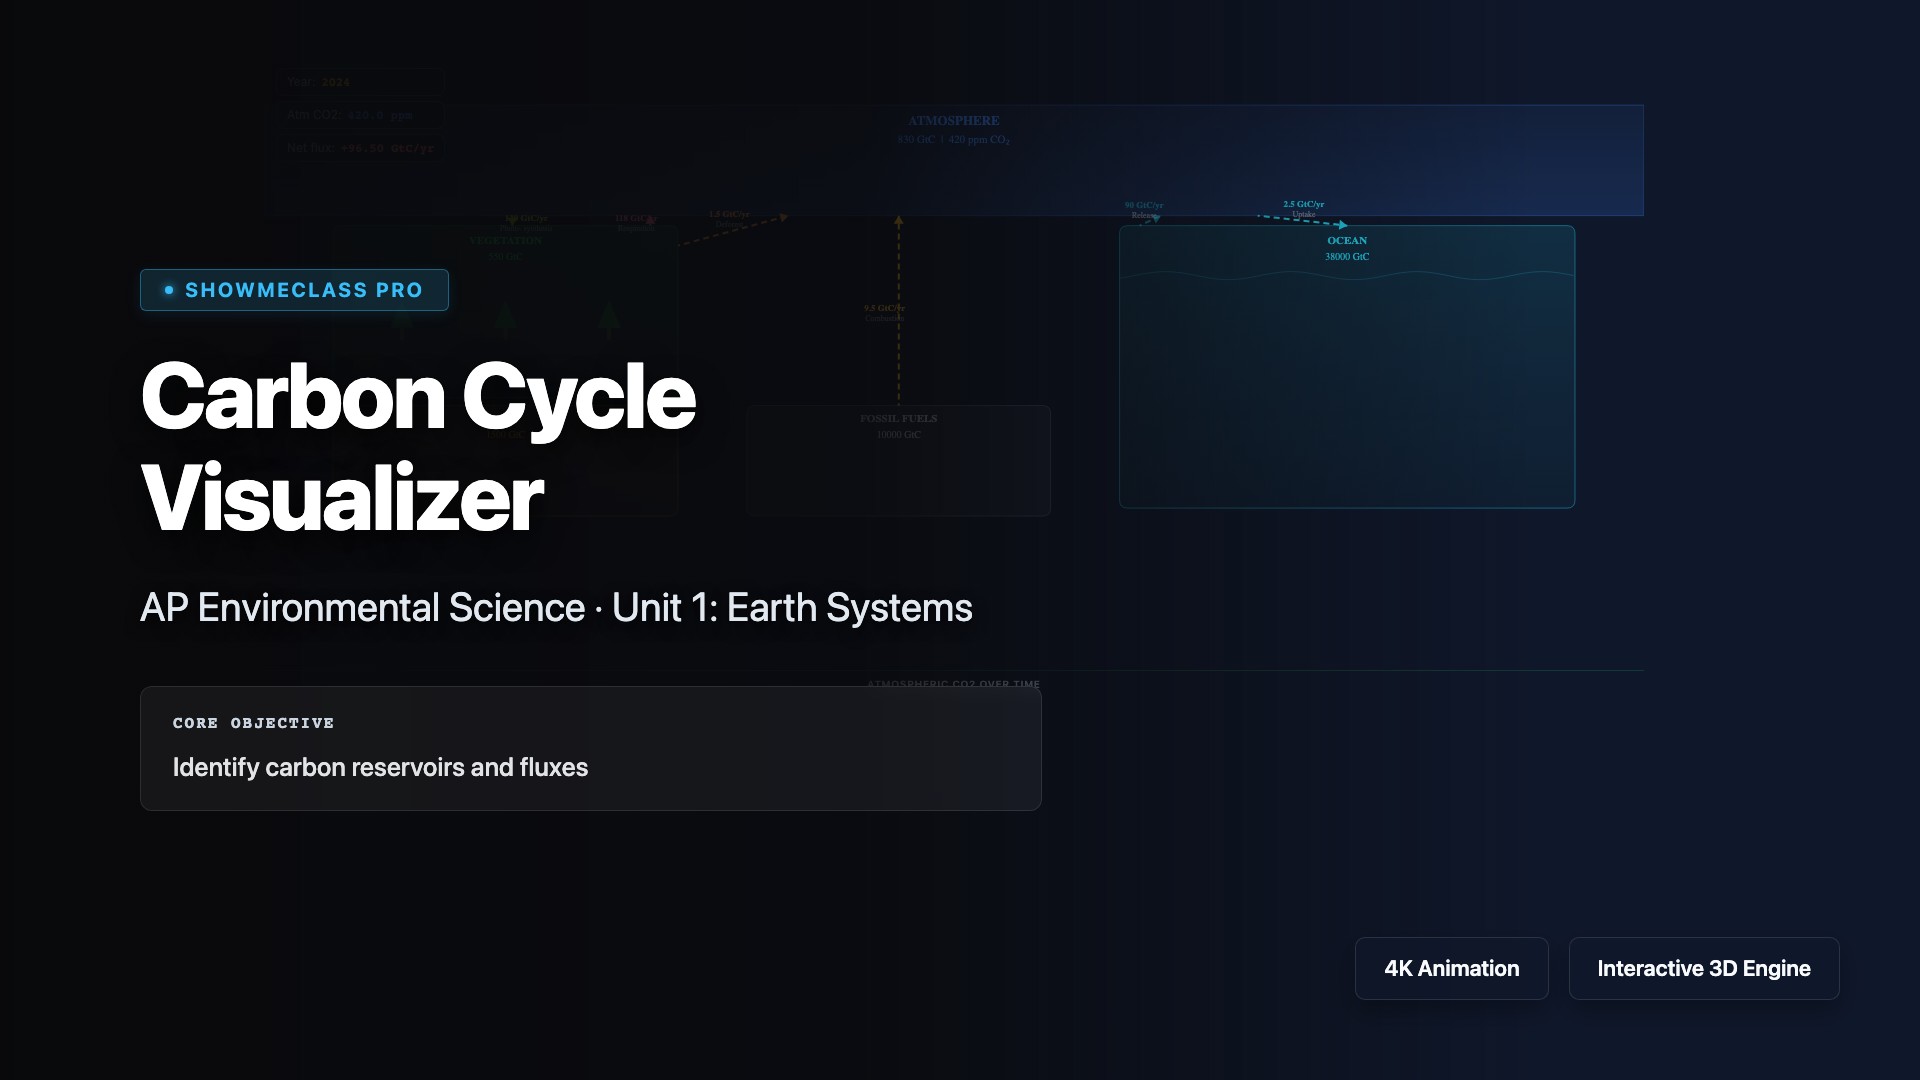
Carbon Cycle Visualizer
Visualize the carbon cycle showing how carbon moves between the atmosphere, biosphere, hydrosphere, and geosphere. Explore processes including photosynthesis (carbon fixation), cellular respiration (carbon release), decomposition, fossil fuel combustion, ocean absorption, and geological sequestration. Understand how human activities like deforestation and burning fossil fuels disrupt the natural carbon balance, contributing to increased atmospheric CO₂ and climate change.

Eutrophication & Hypoxia System
Trigger an ecological collapse. Release nitrogen and phosphorus Agricultural Runoff to force an Algal Bloom, then watch the horrific spike in Biological Oxygen Demand (BOD) that strips Dissolved Oxygen (DO) and causes an aquatic Dead Zone.
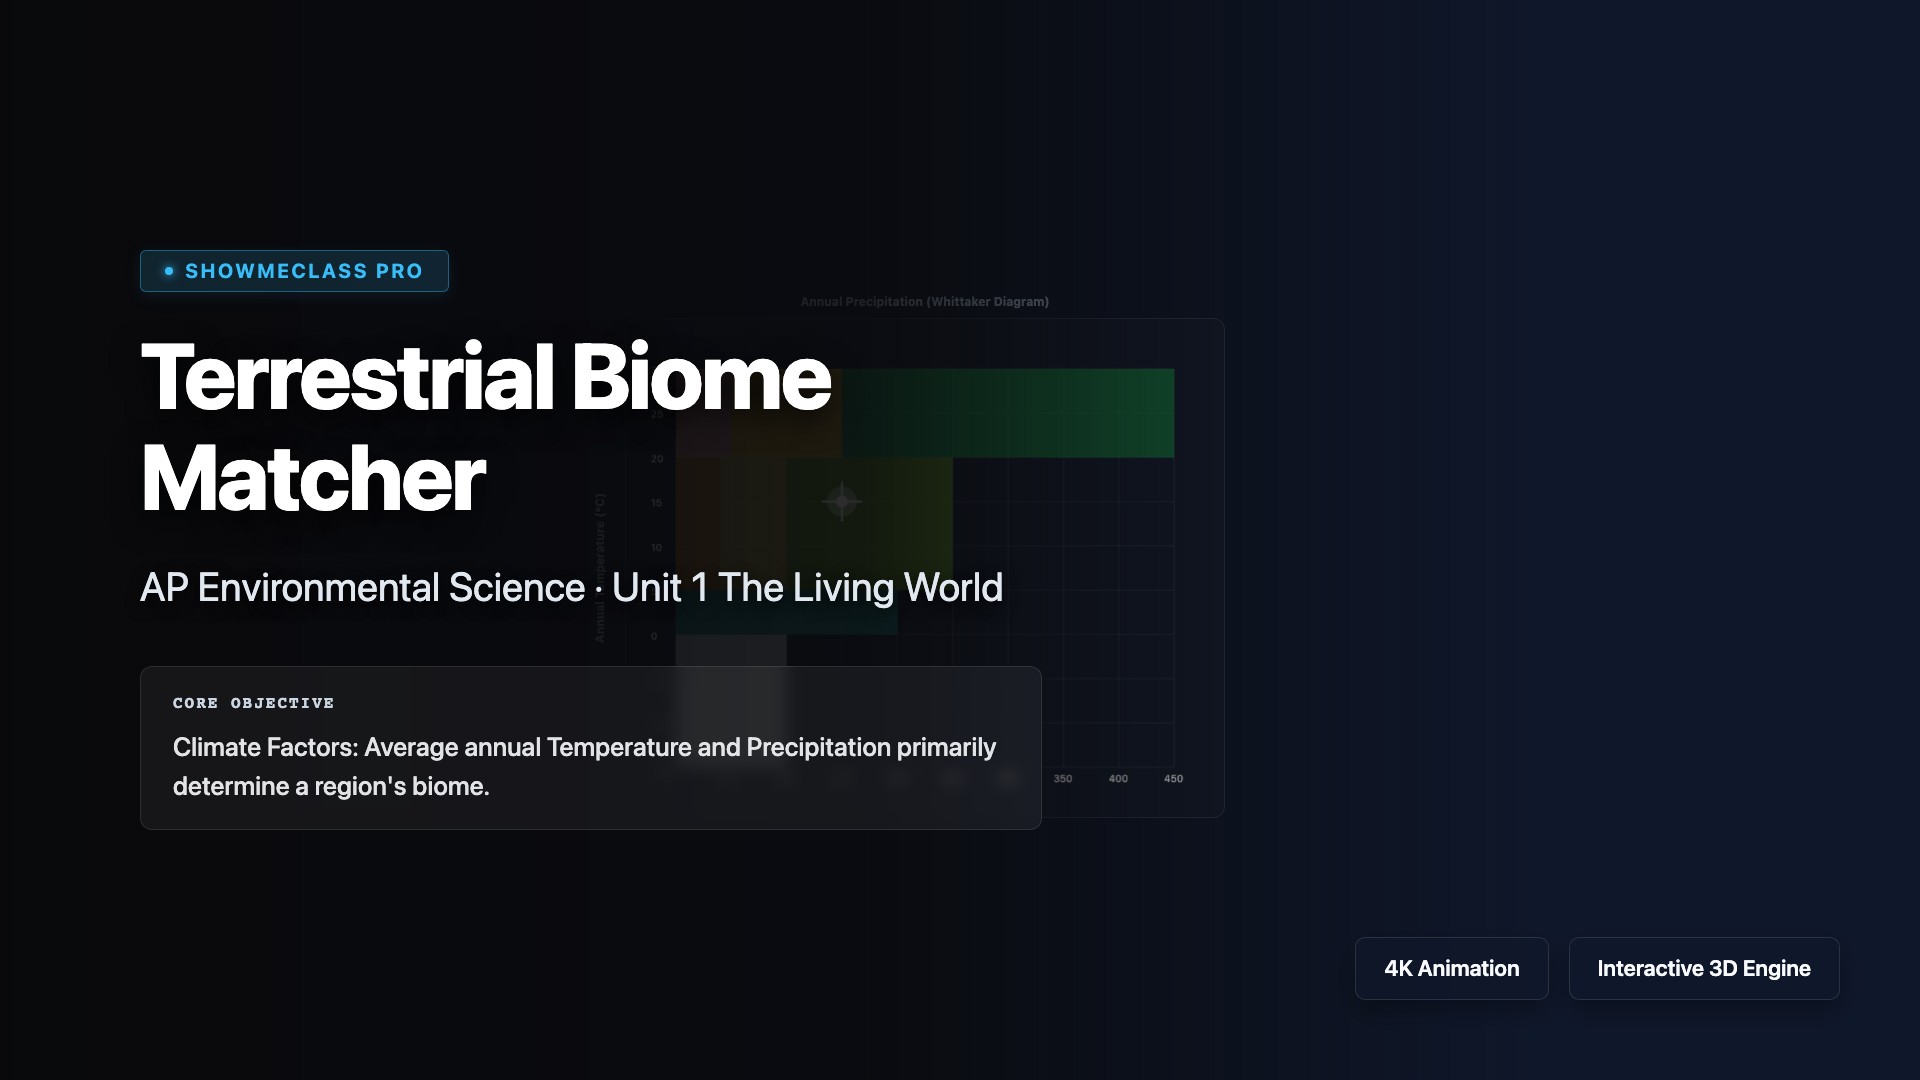
Terrestrial Biome Matcher
Interactive Whittaker Biome Plot mapping average annual temperature and precipitation to global terrestrial biomes, from Tundra to Tropical Rainforest.
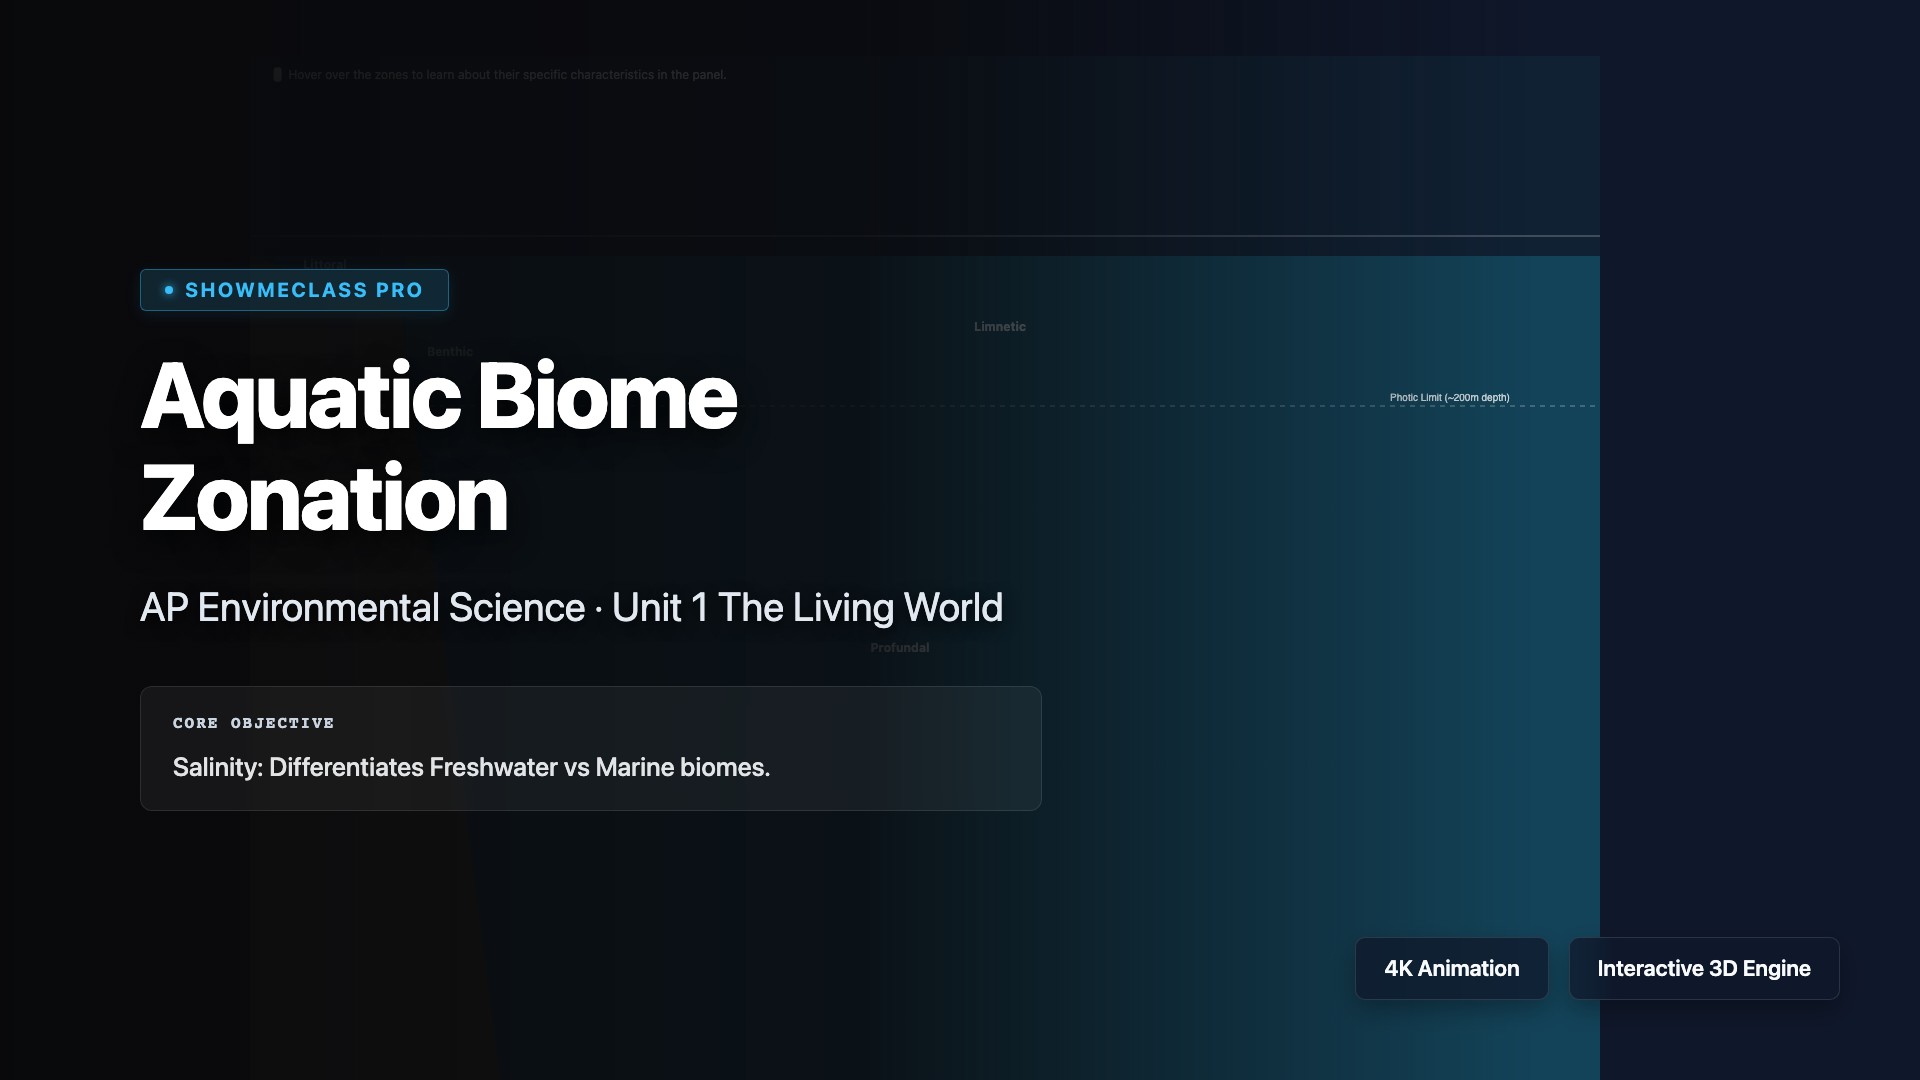
Aquatic Biome Zonation
Interactive diagram dividing Lakes and Oceans into standard ecological zones (Littoral, Limnetic, Benthic, Pelagic, Intertidal). Hover-based learning tool.

Nitrogen Cycle Interactive
Detailed APES Nitrogen Cycle interactive mapping the 5 chemical steps: Fixation, Nitrification, Assimilation, Ammonification, and Denitrification involving specific bacterial functions.
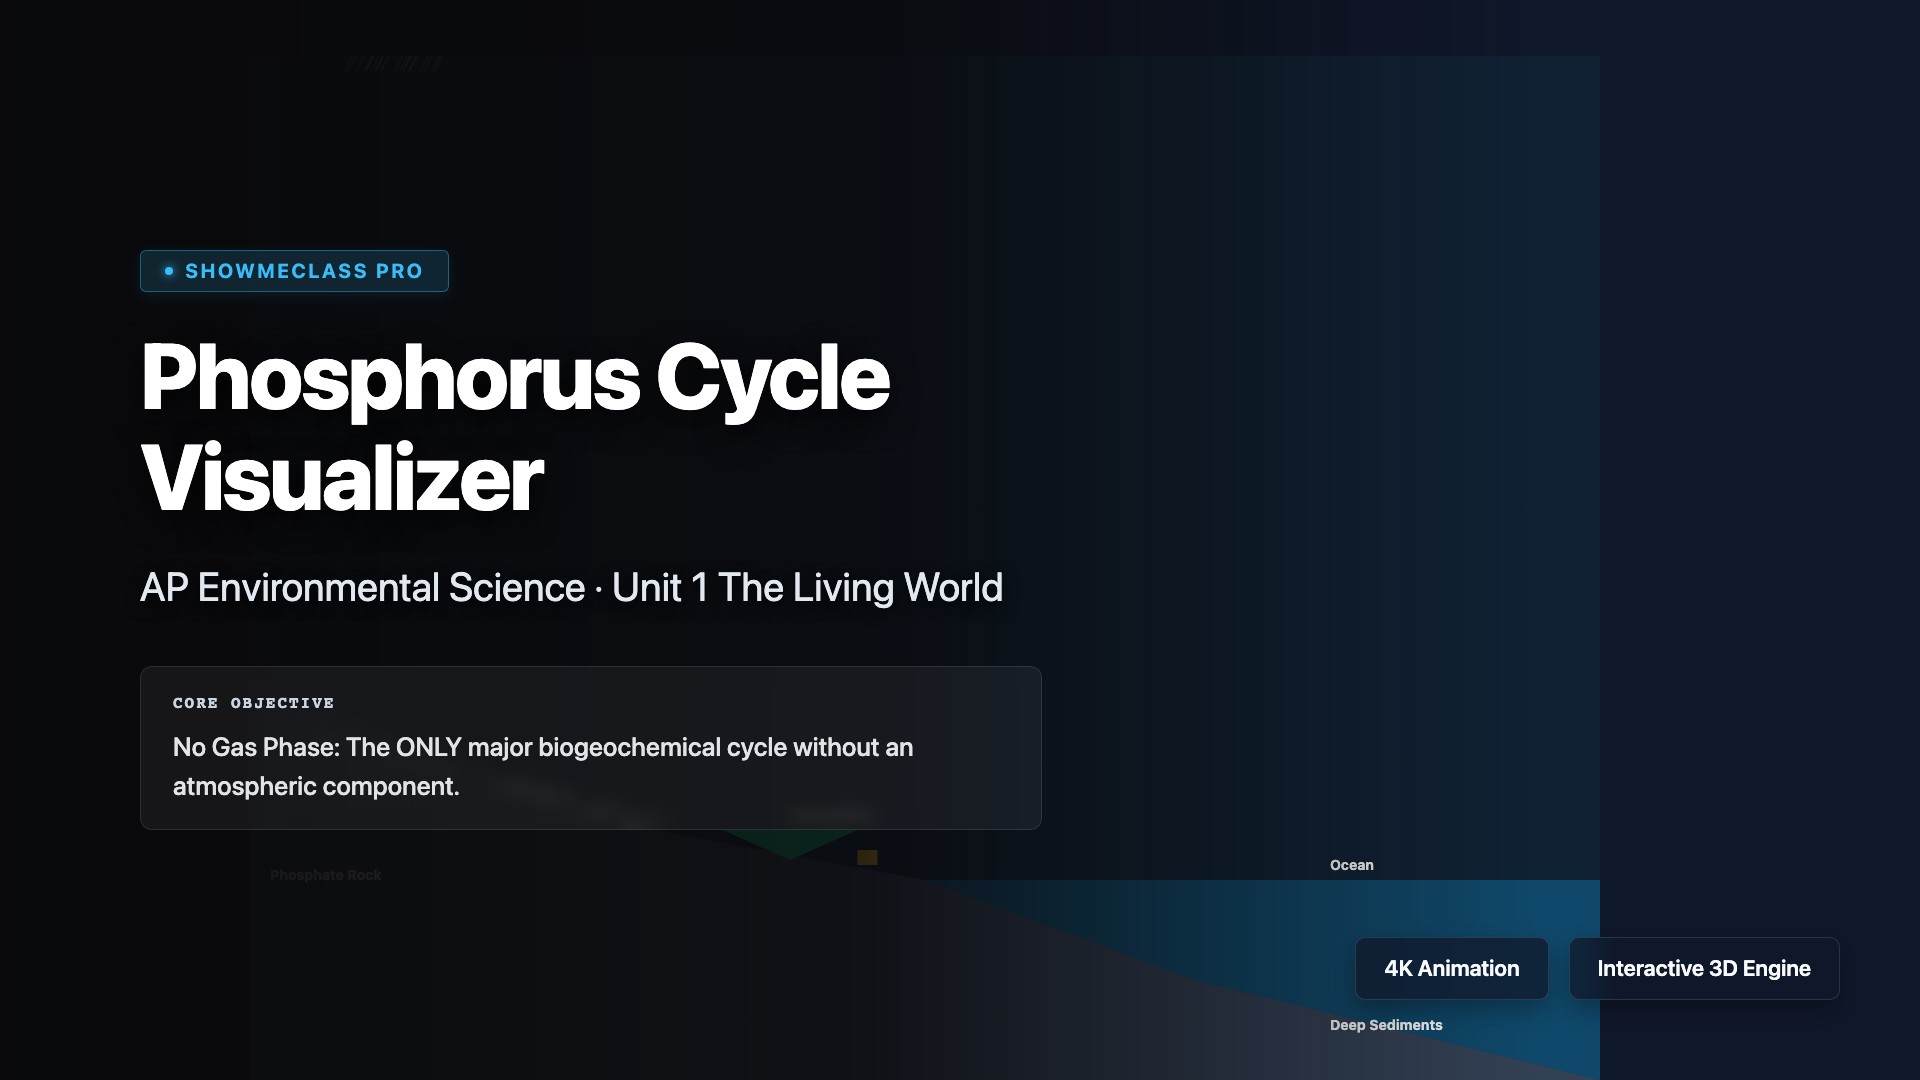
Phosphorus Cycle Visualizer
Phosphorus Cycle showing the absence of an atmospheric phase, slow rock weathering, biological assimilation into DNA/ATP, marine sedimentation, and long-term geologic uplift.
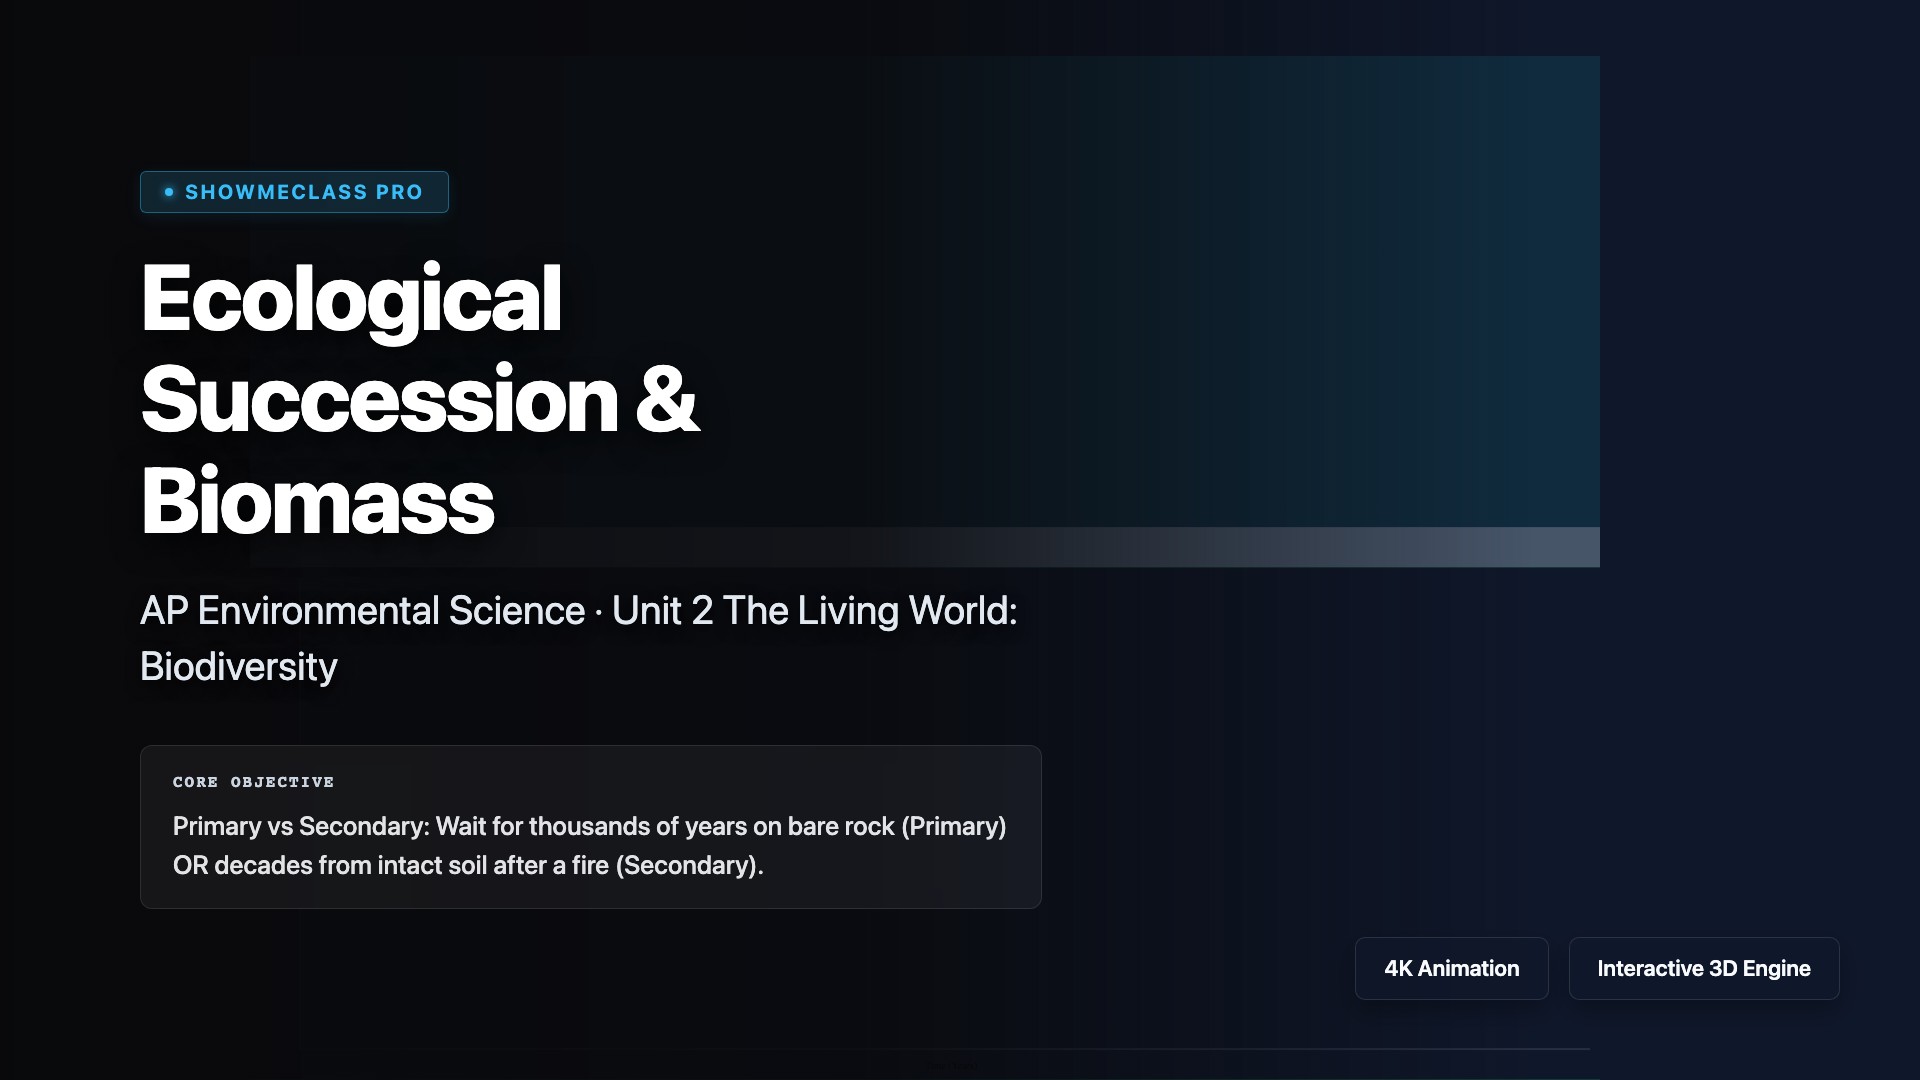
Ecological Succession Simulator
Ecological Succession simulation focused on APES concepts: comparing Biomass accumulation and Species Richness curves for Primary vs Secondary Succession over time.
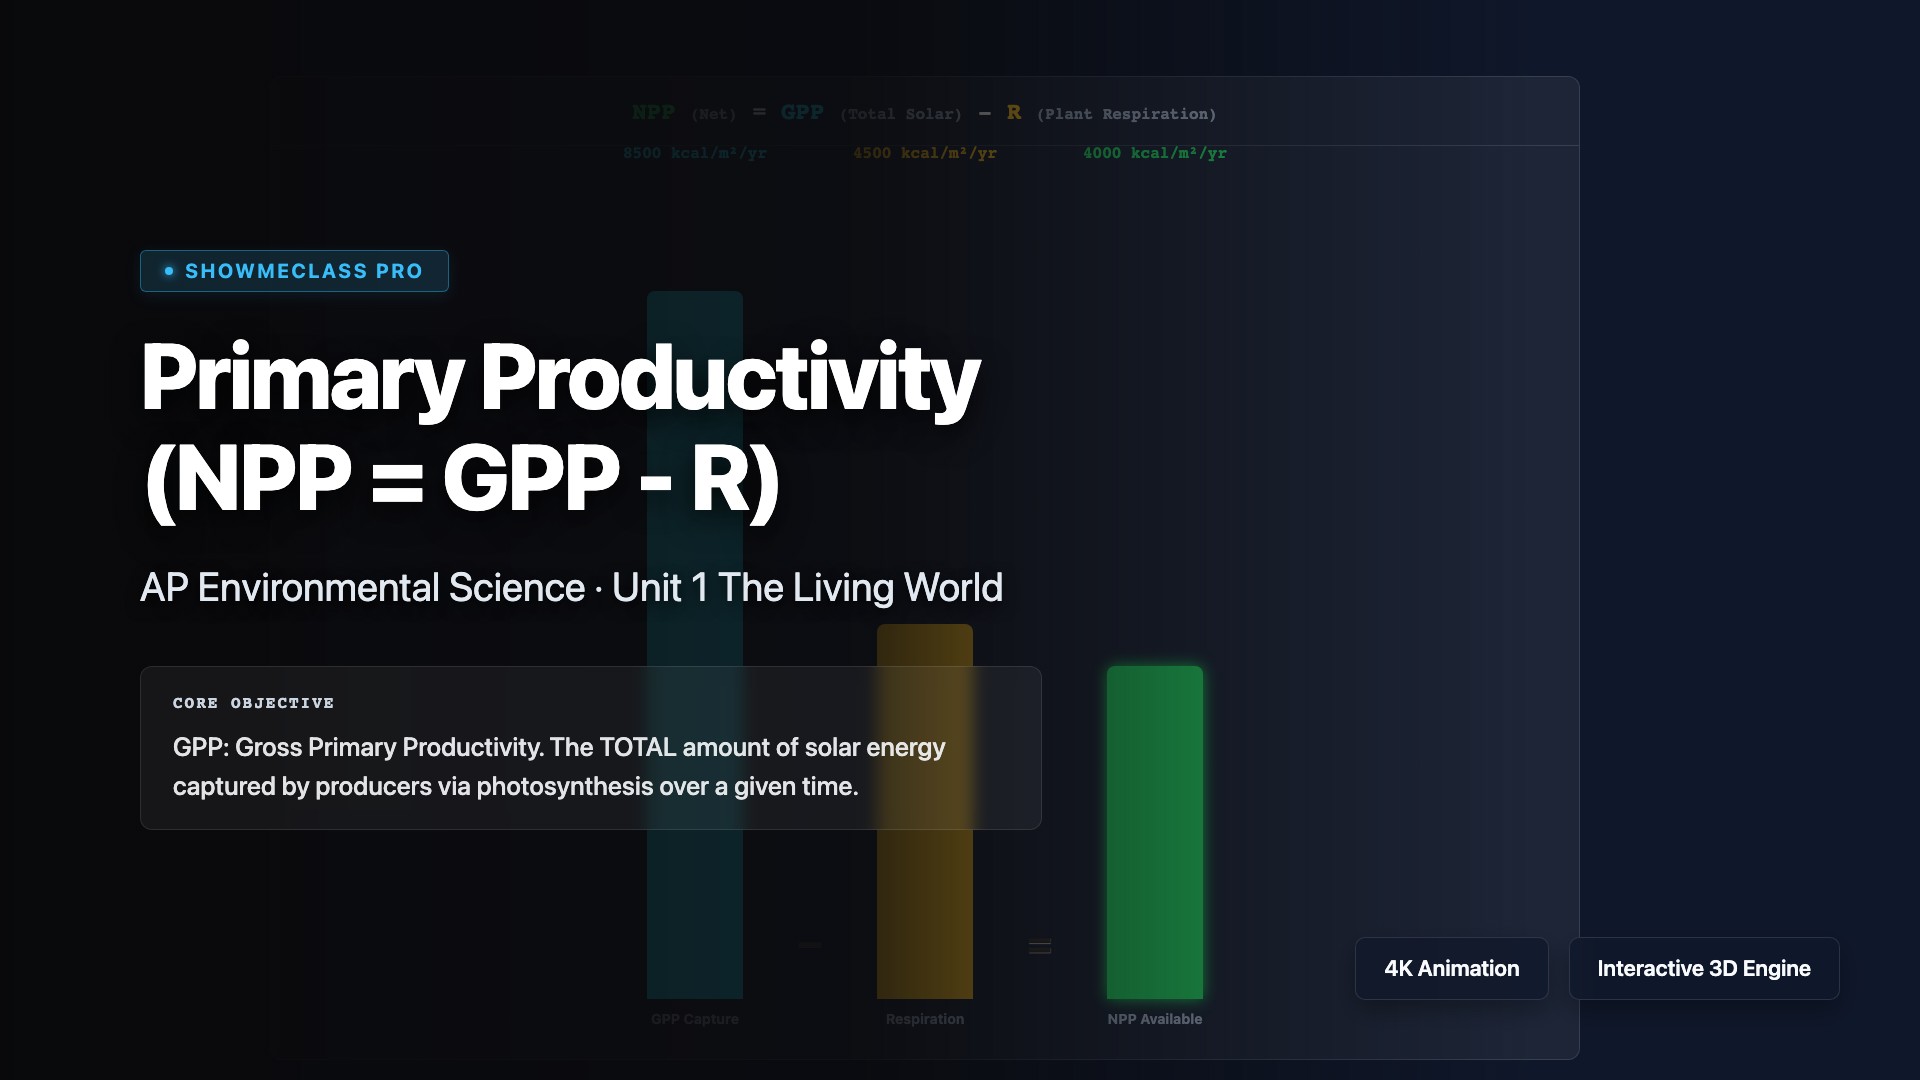
NPP & GPP Calculator
Tool to calculate and visualize Net Primary Productivity (NPP = GPP - Respiration). Explores the distinct productivity rates across various global biomes.
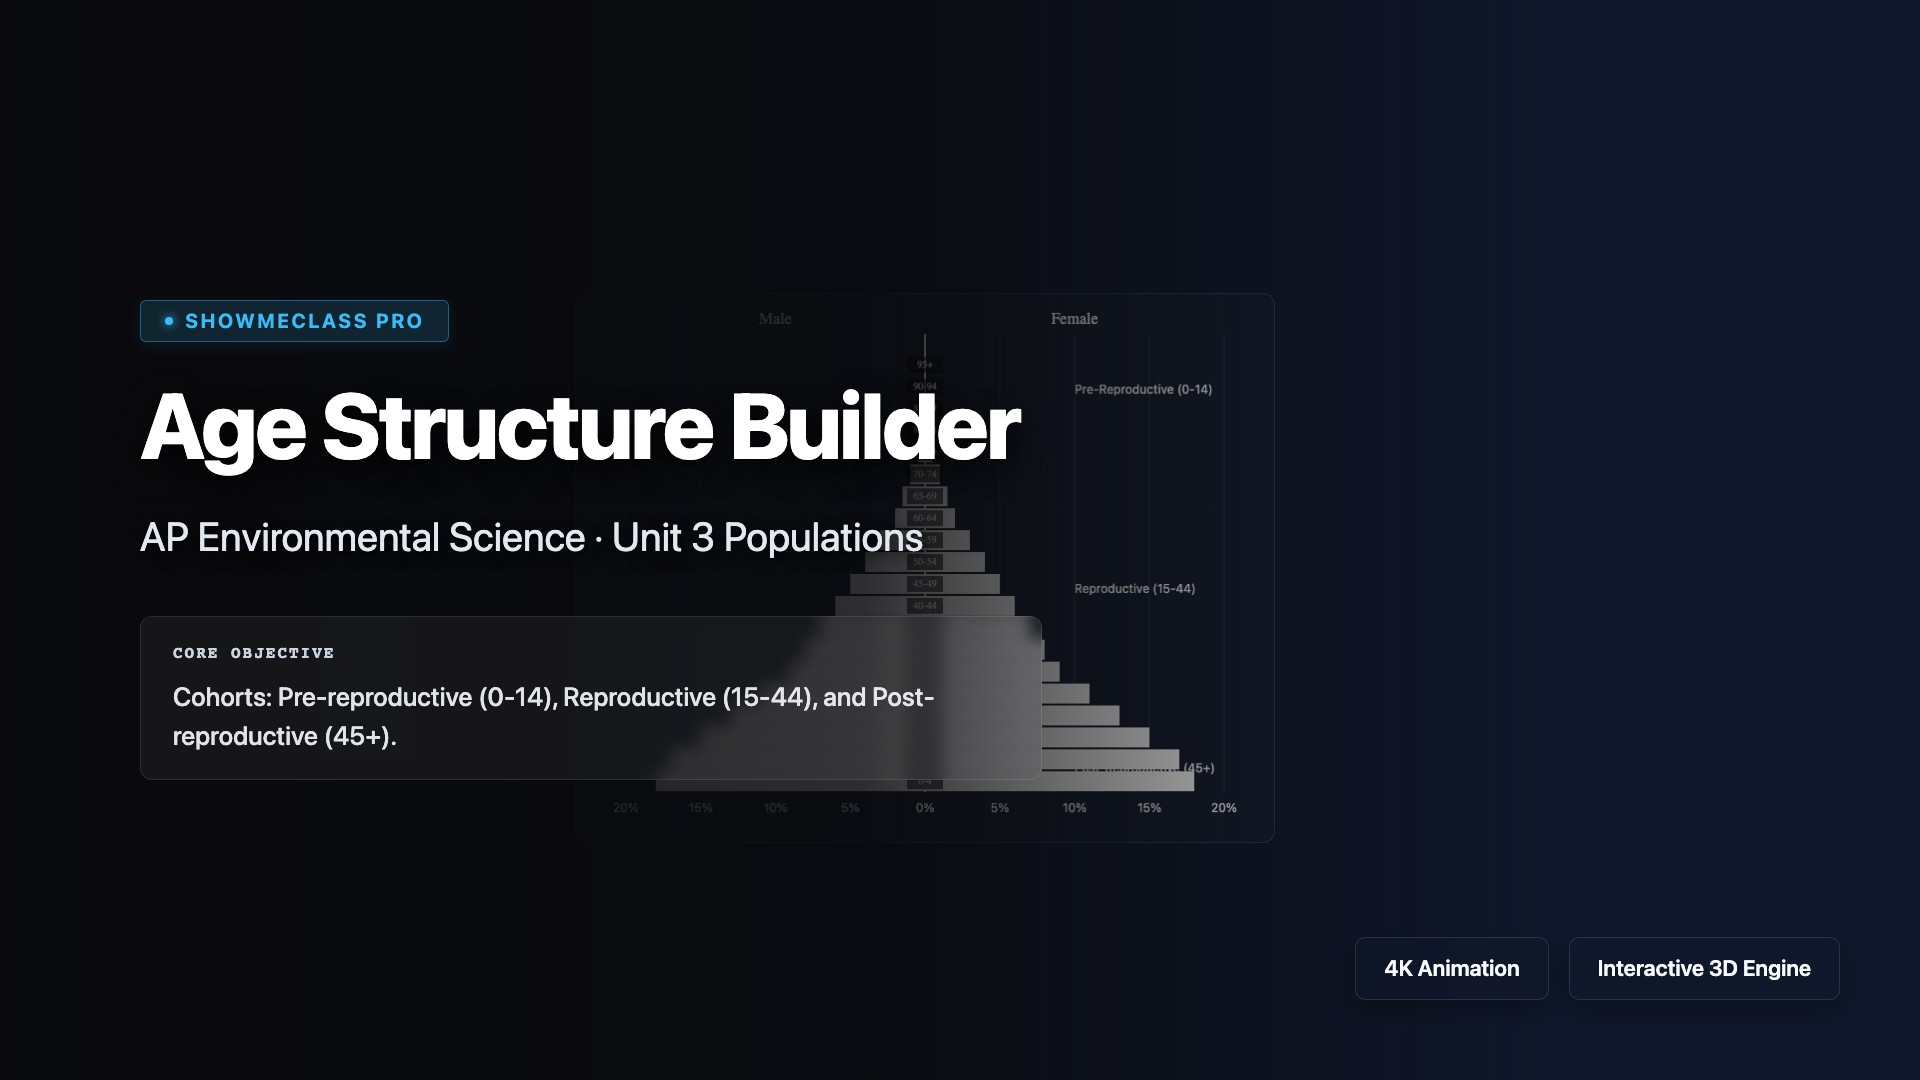
Age Structure Builder
Interactive Age Structure Pyramid Builder. Analyzes demographics, growth models (rapid, slow, stable, declining), and reproductive cohorts.
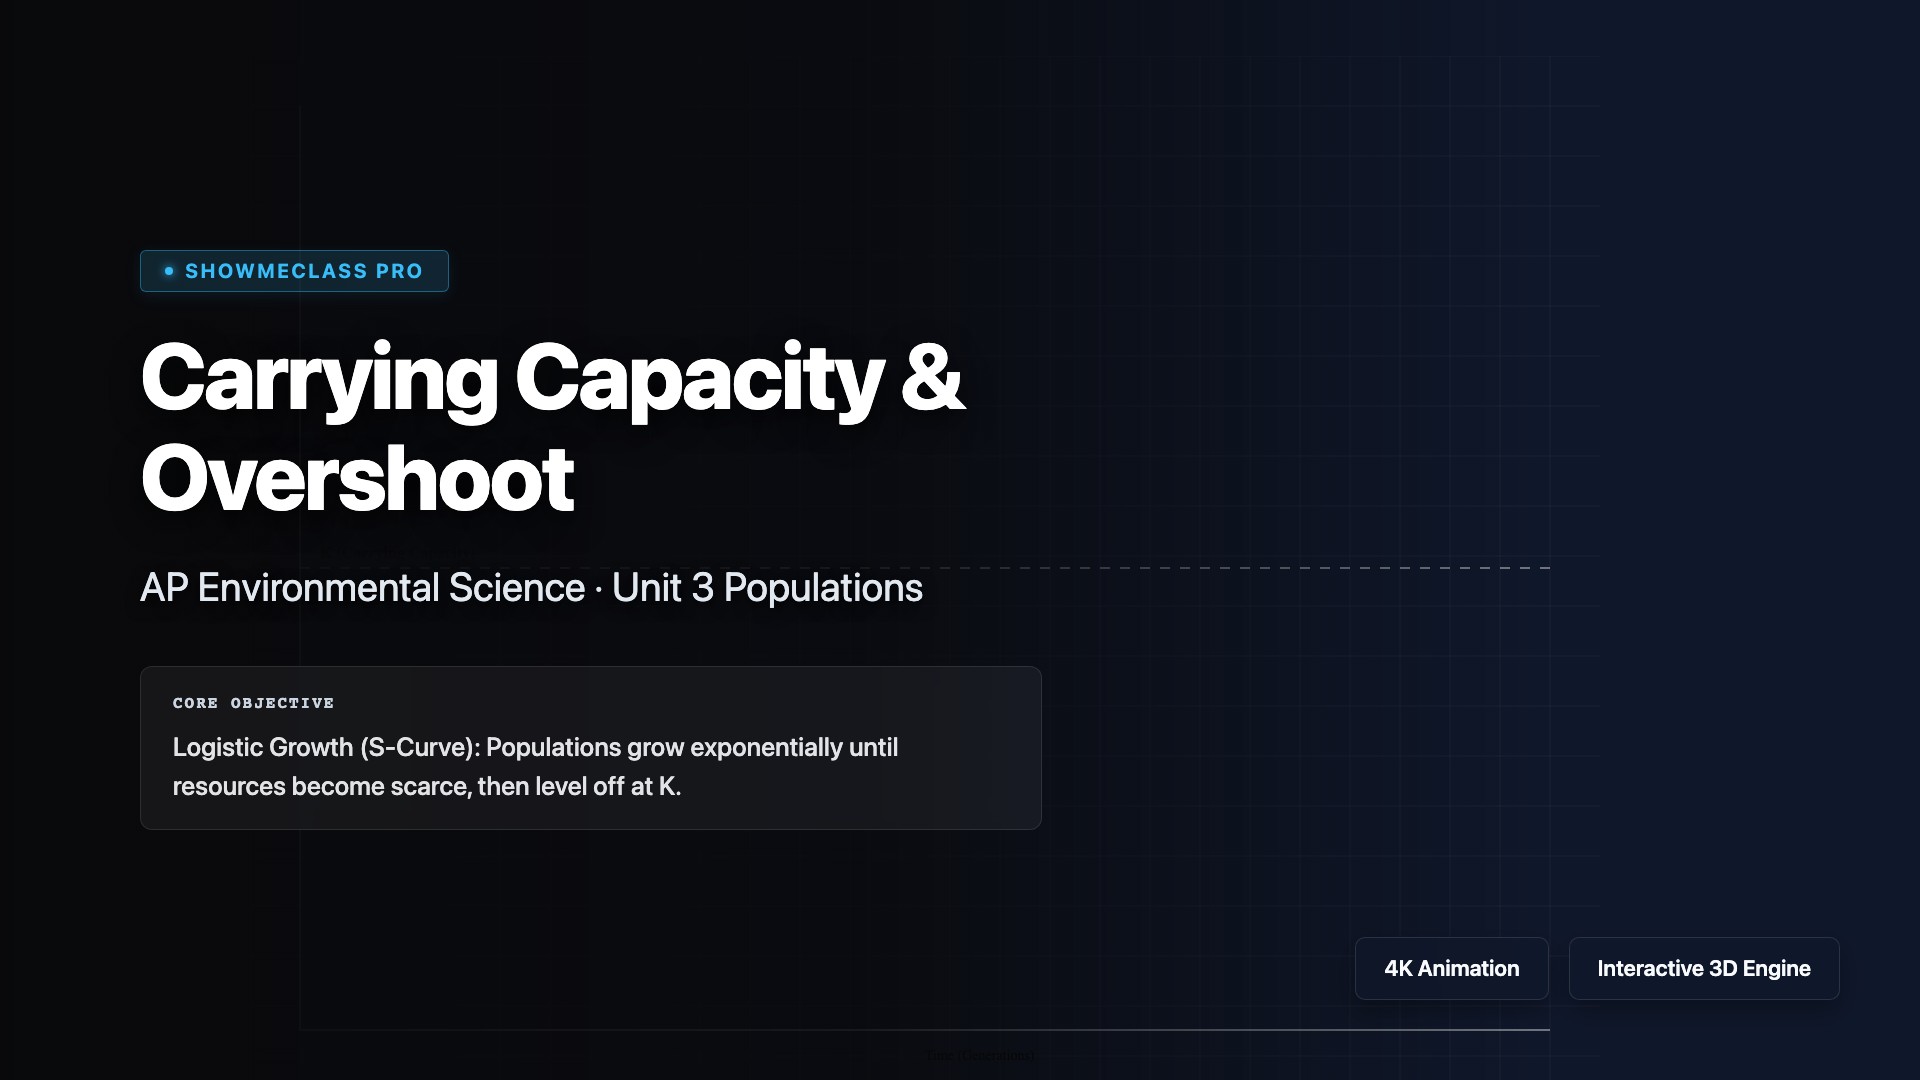
Carrying Capacity & Overshoot
Logistic population growth simulation modeling reproductive rate (r) lag, environmental carrying capacity limits (K), and severe resource overshoot dieback scenarios.
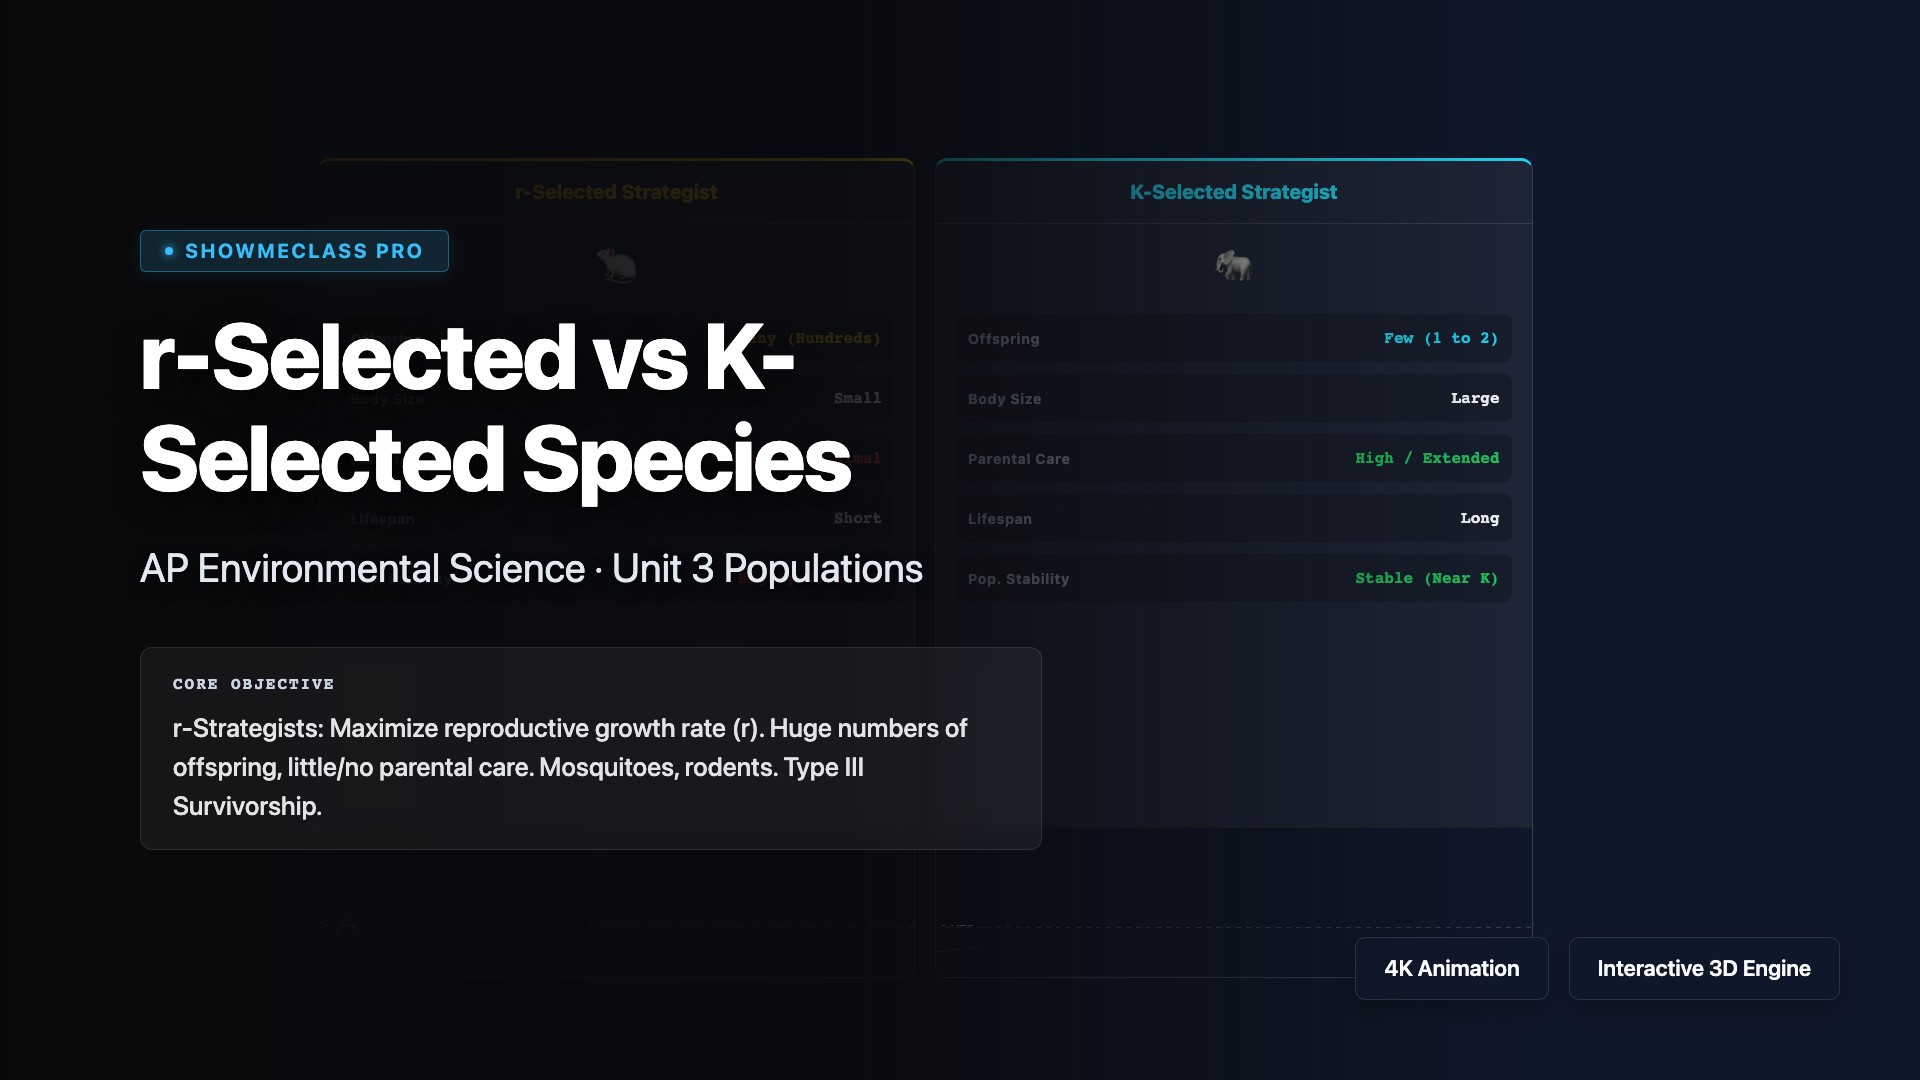
r/K Selection Dynamics
Comparison tool differentiating r-selected strategies (volatile booms, rapid reproductive rates) from K-selected strategies (stable carrying capacity, vulnerability to extinction).
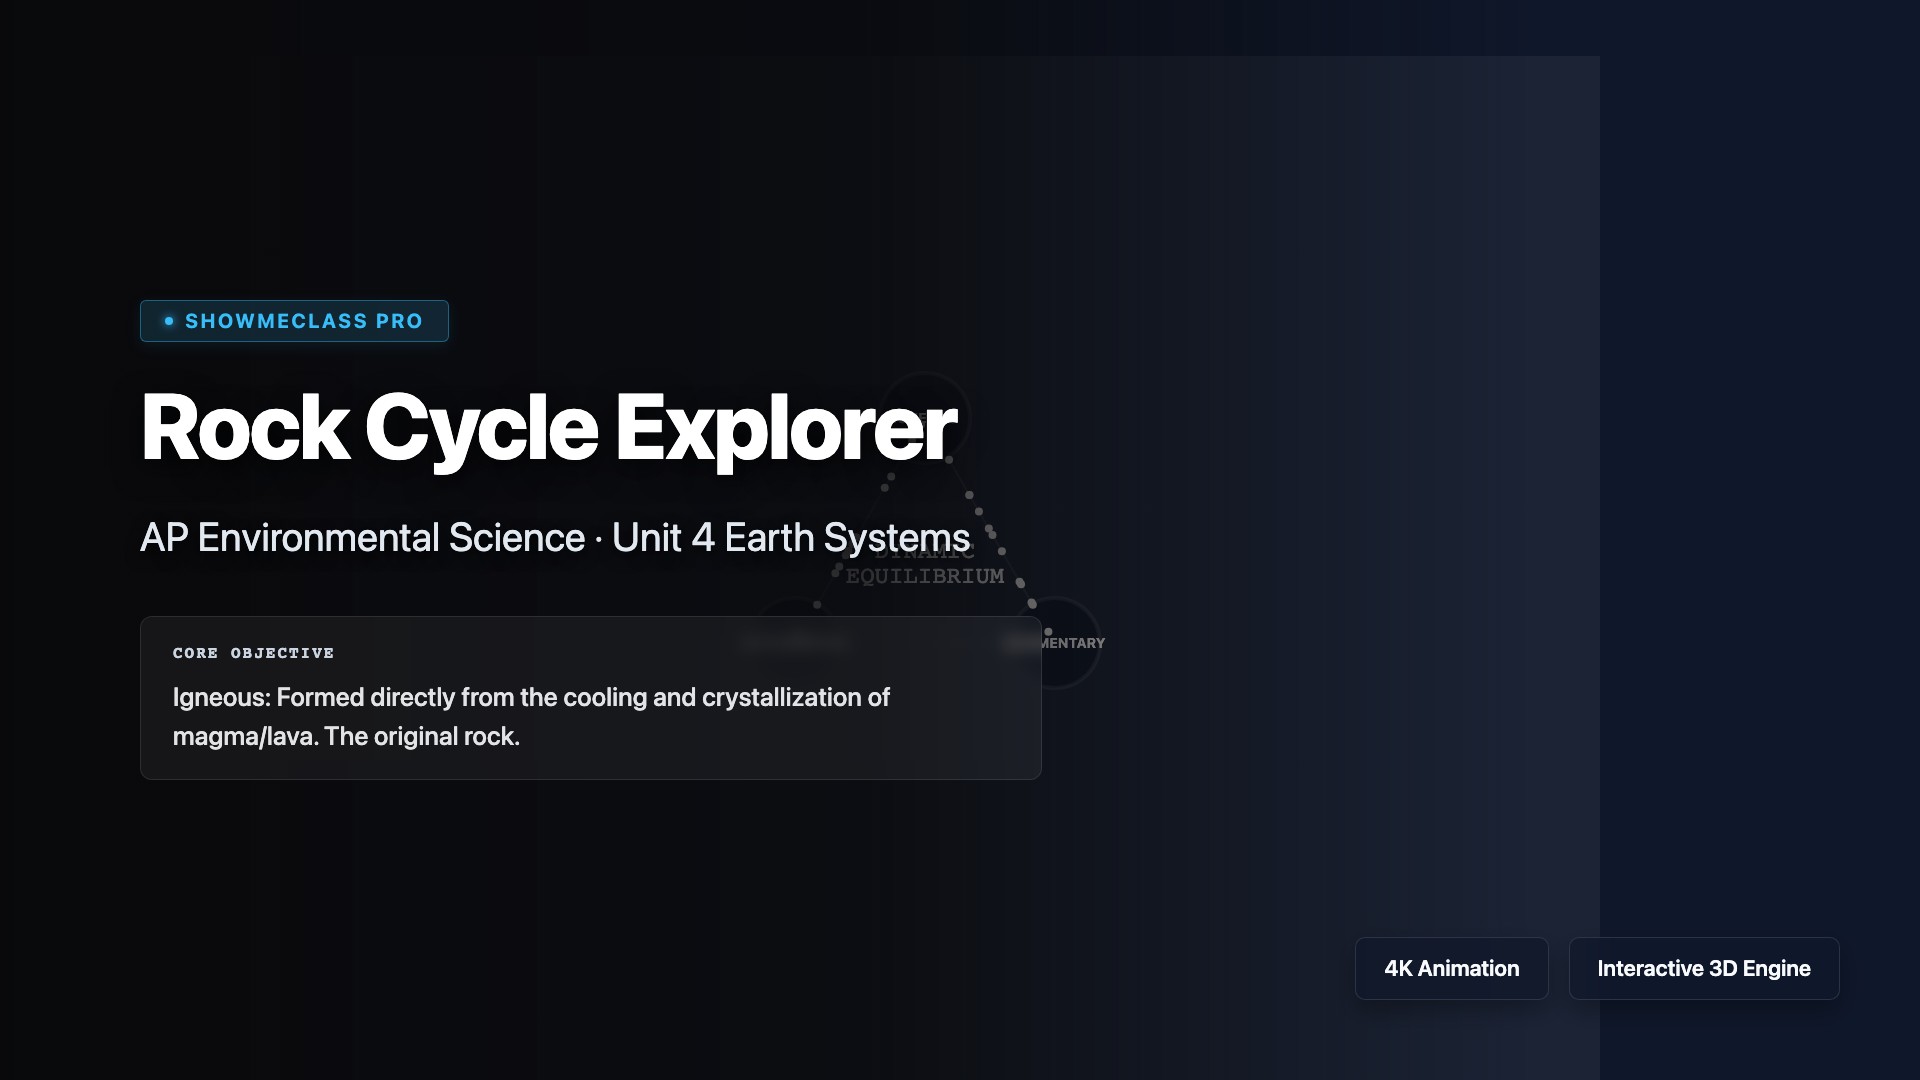
Rock Cycle Explorer
The Rock Cycle (Igneous, Sedimentary, Metamorphic) simplified into an interactive, node-based dynamic loop governed by tectonic and surface processes.
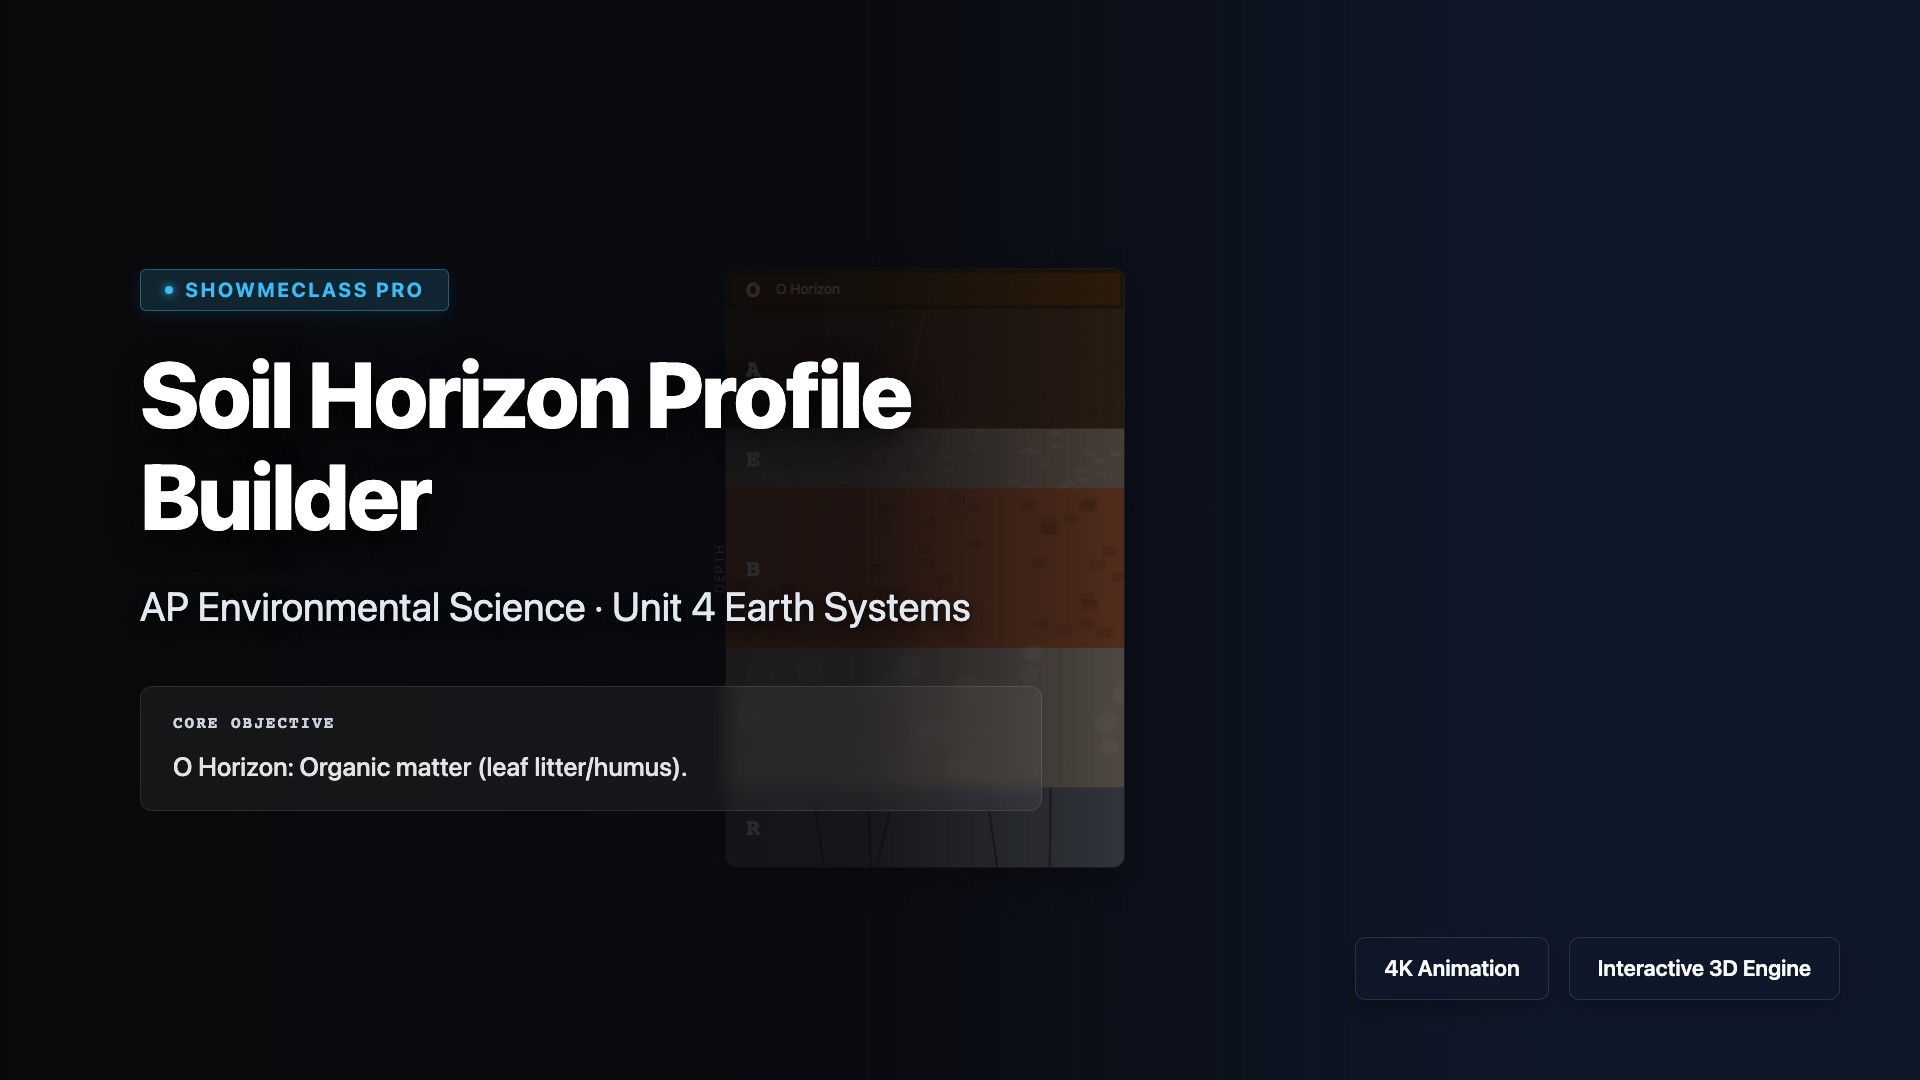
Soil Horizon Profile Builder
Visual builder examining the 6 distinct soil horizons (O, A, E, B, C, R) identifying organic aggregation, topsoil leaching, and bedrock breakdown.
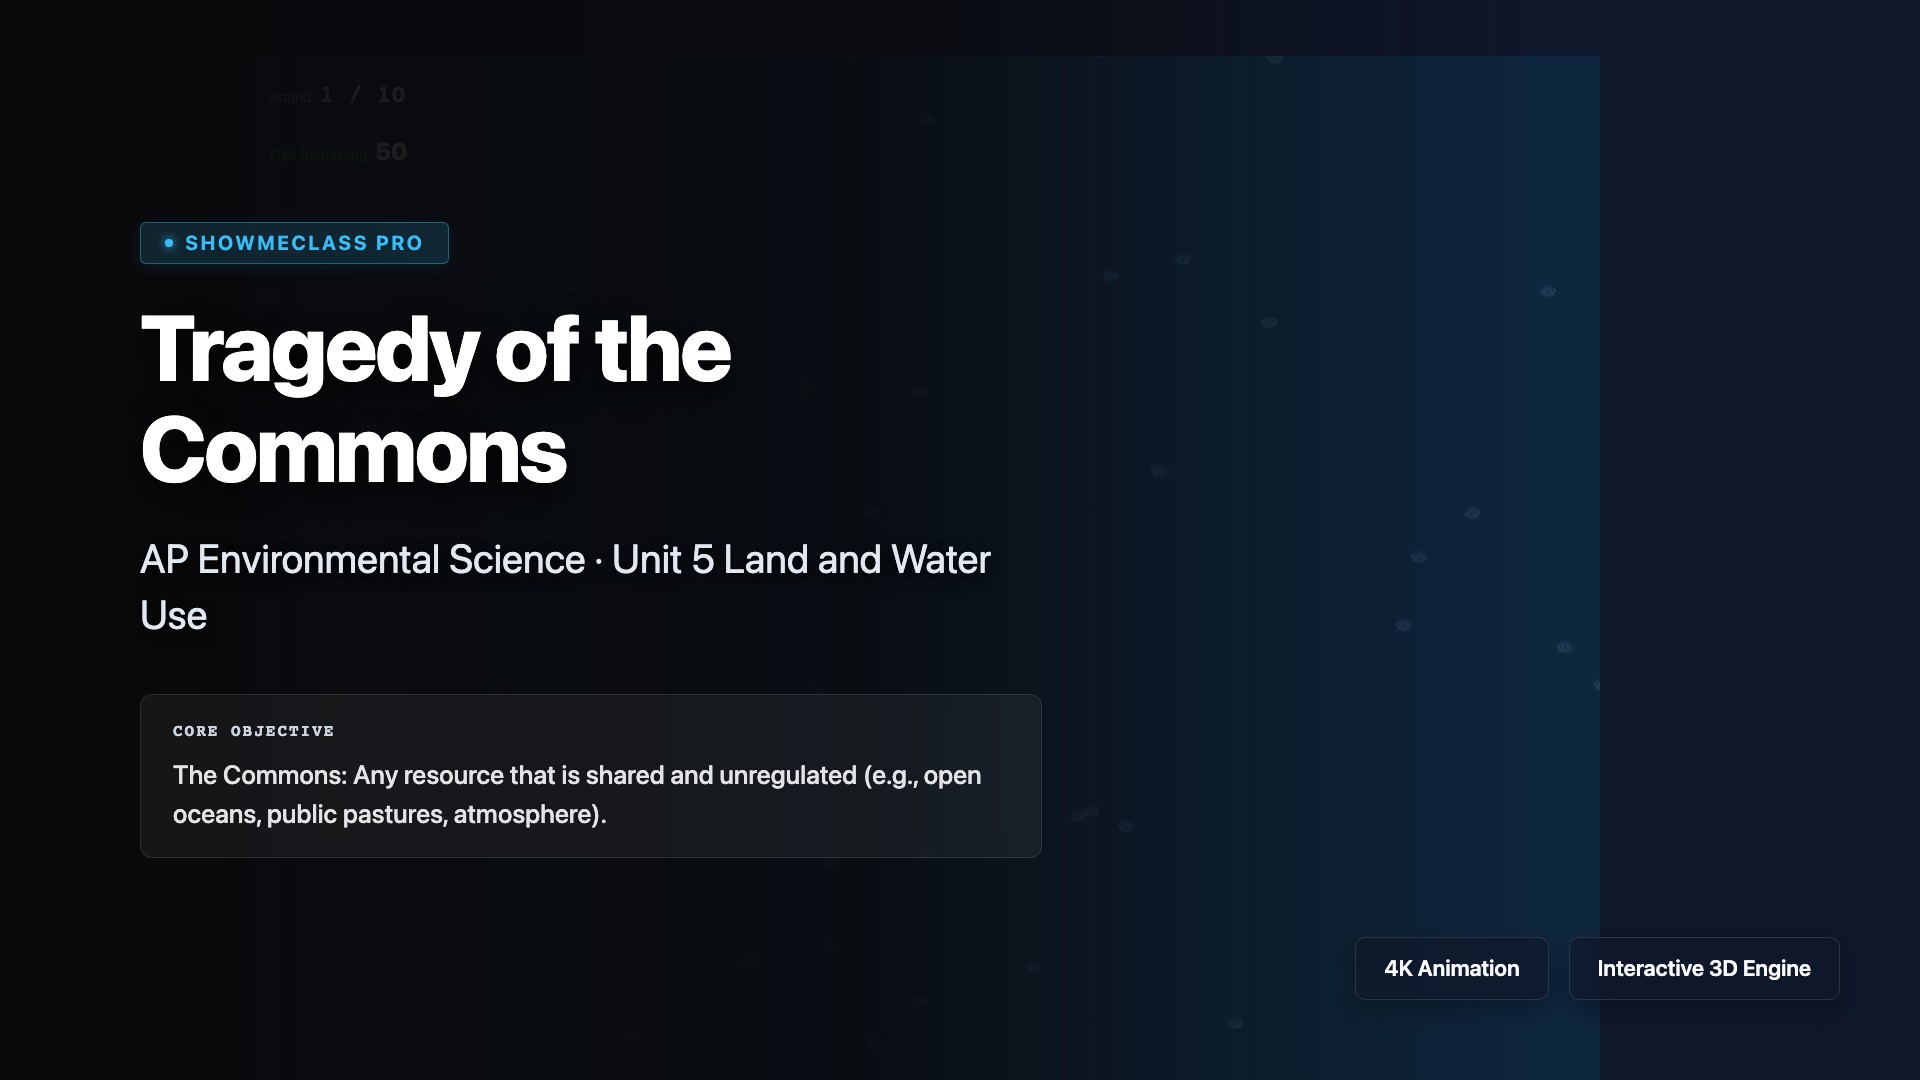
Tragedy of the Commons
Economic game theory simulator demonstrating the Tragedy of the Commons via a multi-turn global fishery model against AI fleets.
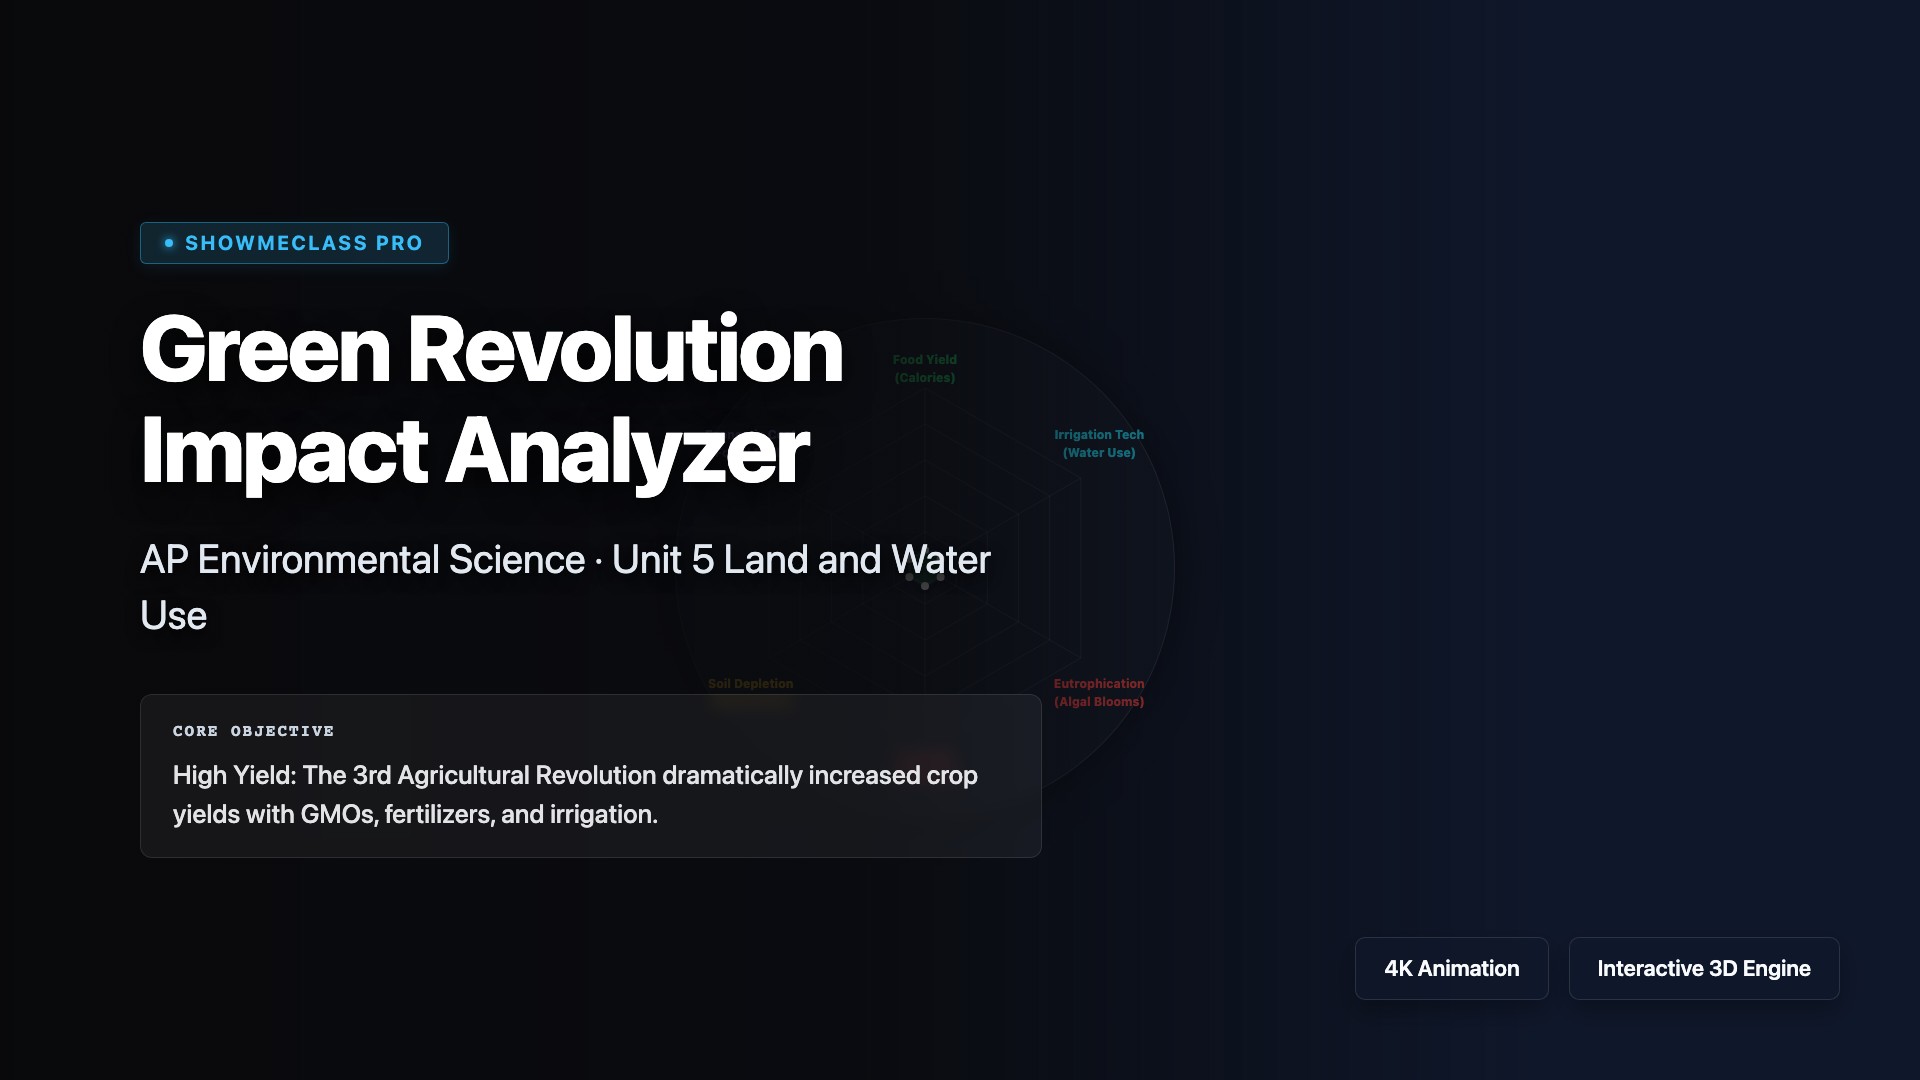
Green Revolution Impact Analyzer
Radar chart interactive exploring the trade-offs of the Green Revolution: drastically boosting yield via fertilizers and irrigation while risking eutrophication and salinization.
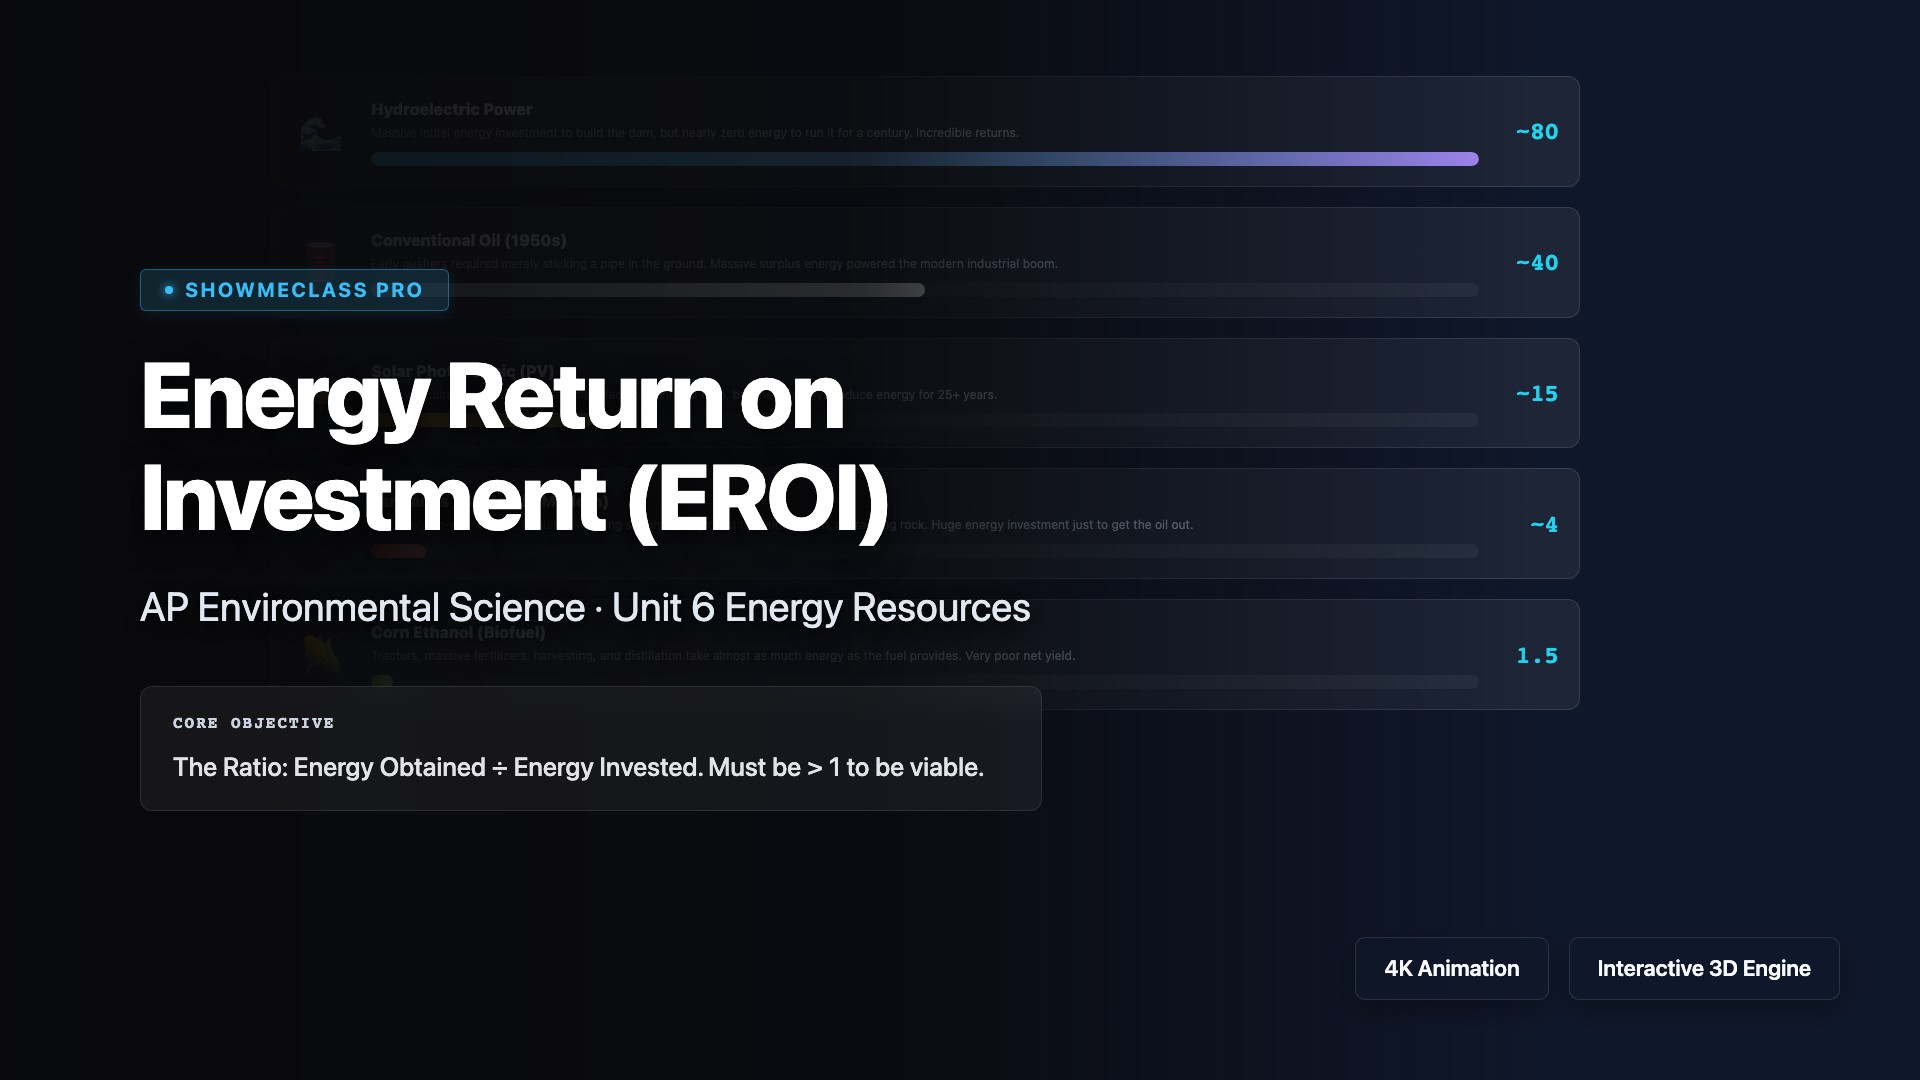
EROI Energy Return
Comparator for Energy Return on Investment (EROI), mapping the high yields of early oil and hydro against the modern low-yield reality of tar sands and corn ethanol.
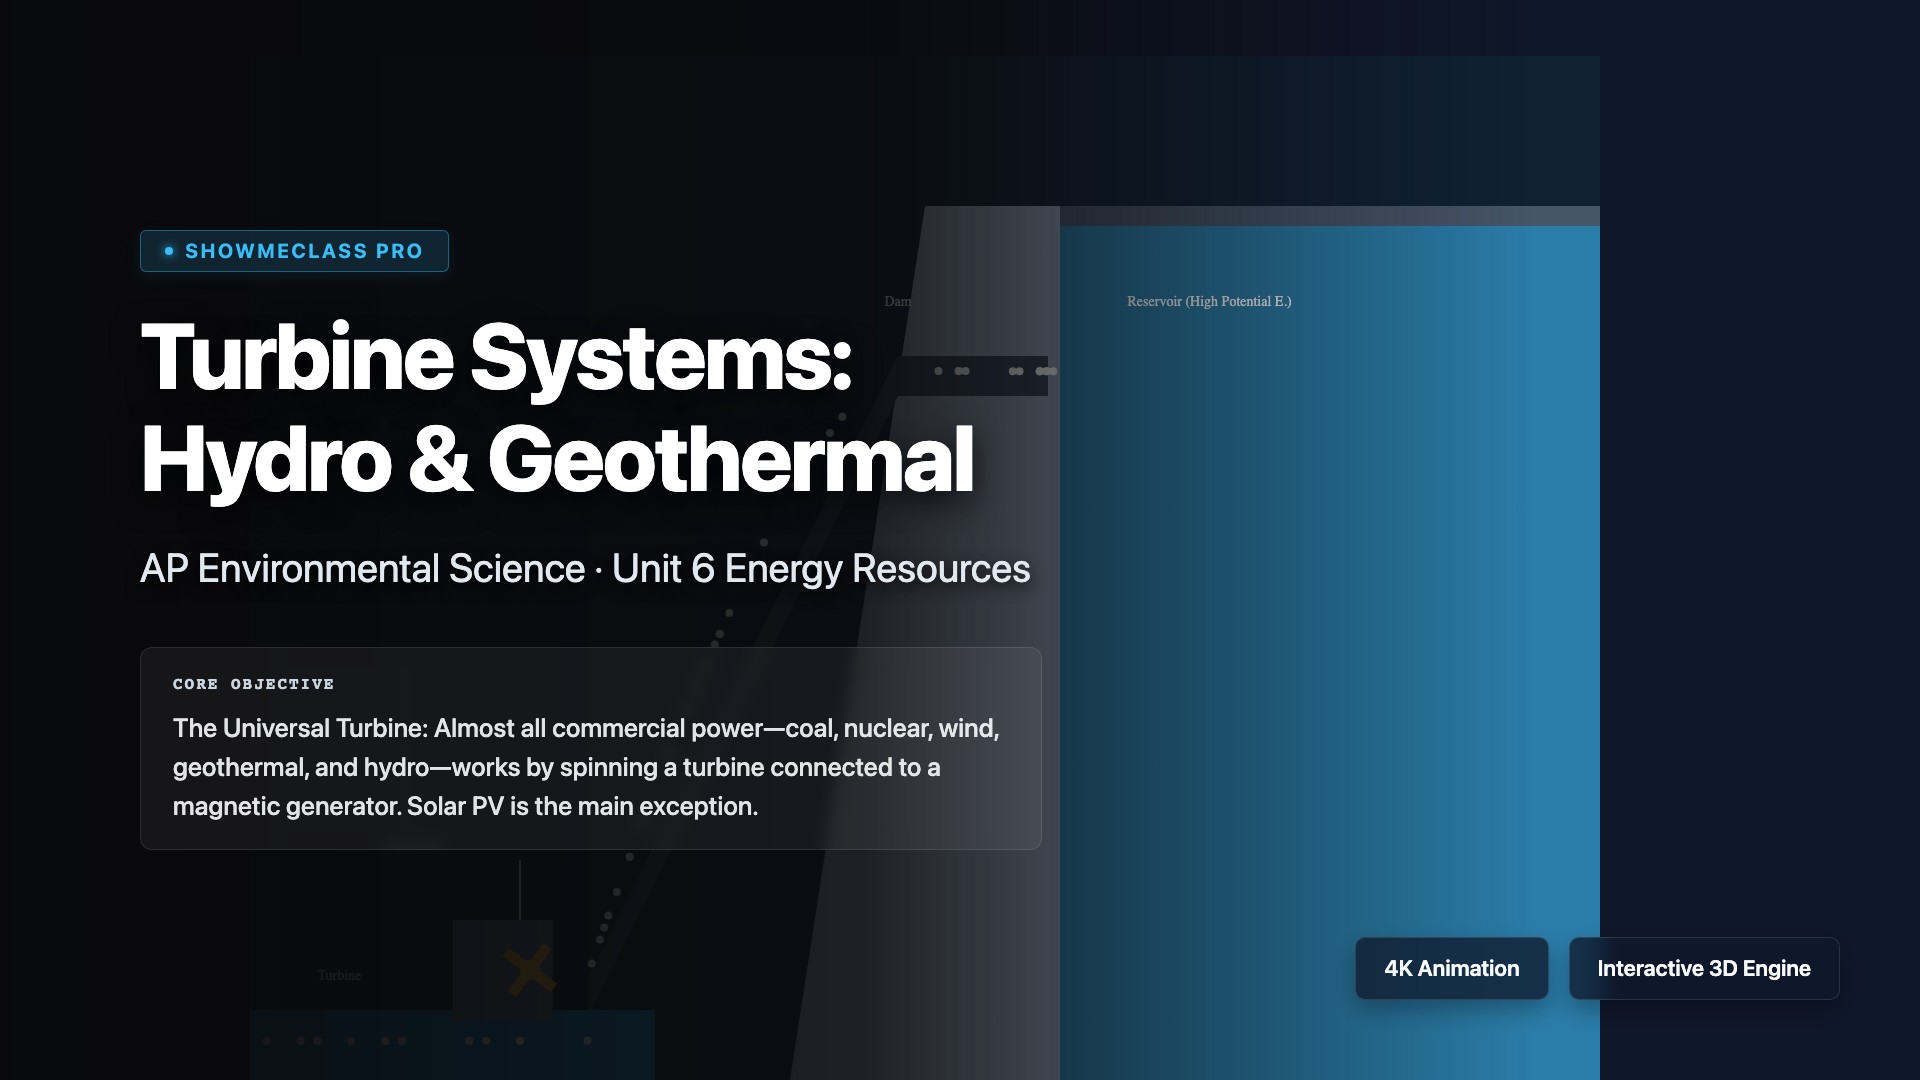
Turbine Systems: Hydro & Geothermal
Comparison of the ubiquitous turbine-generator electrical system, modeled for Gravity/Kinetic generation (Hydroelectric dam) and Heat/Steam generation (Geothermal mapping).
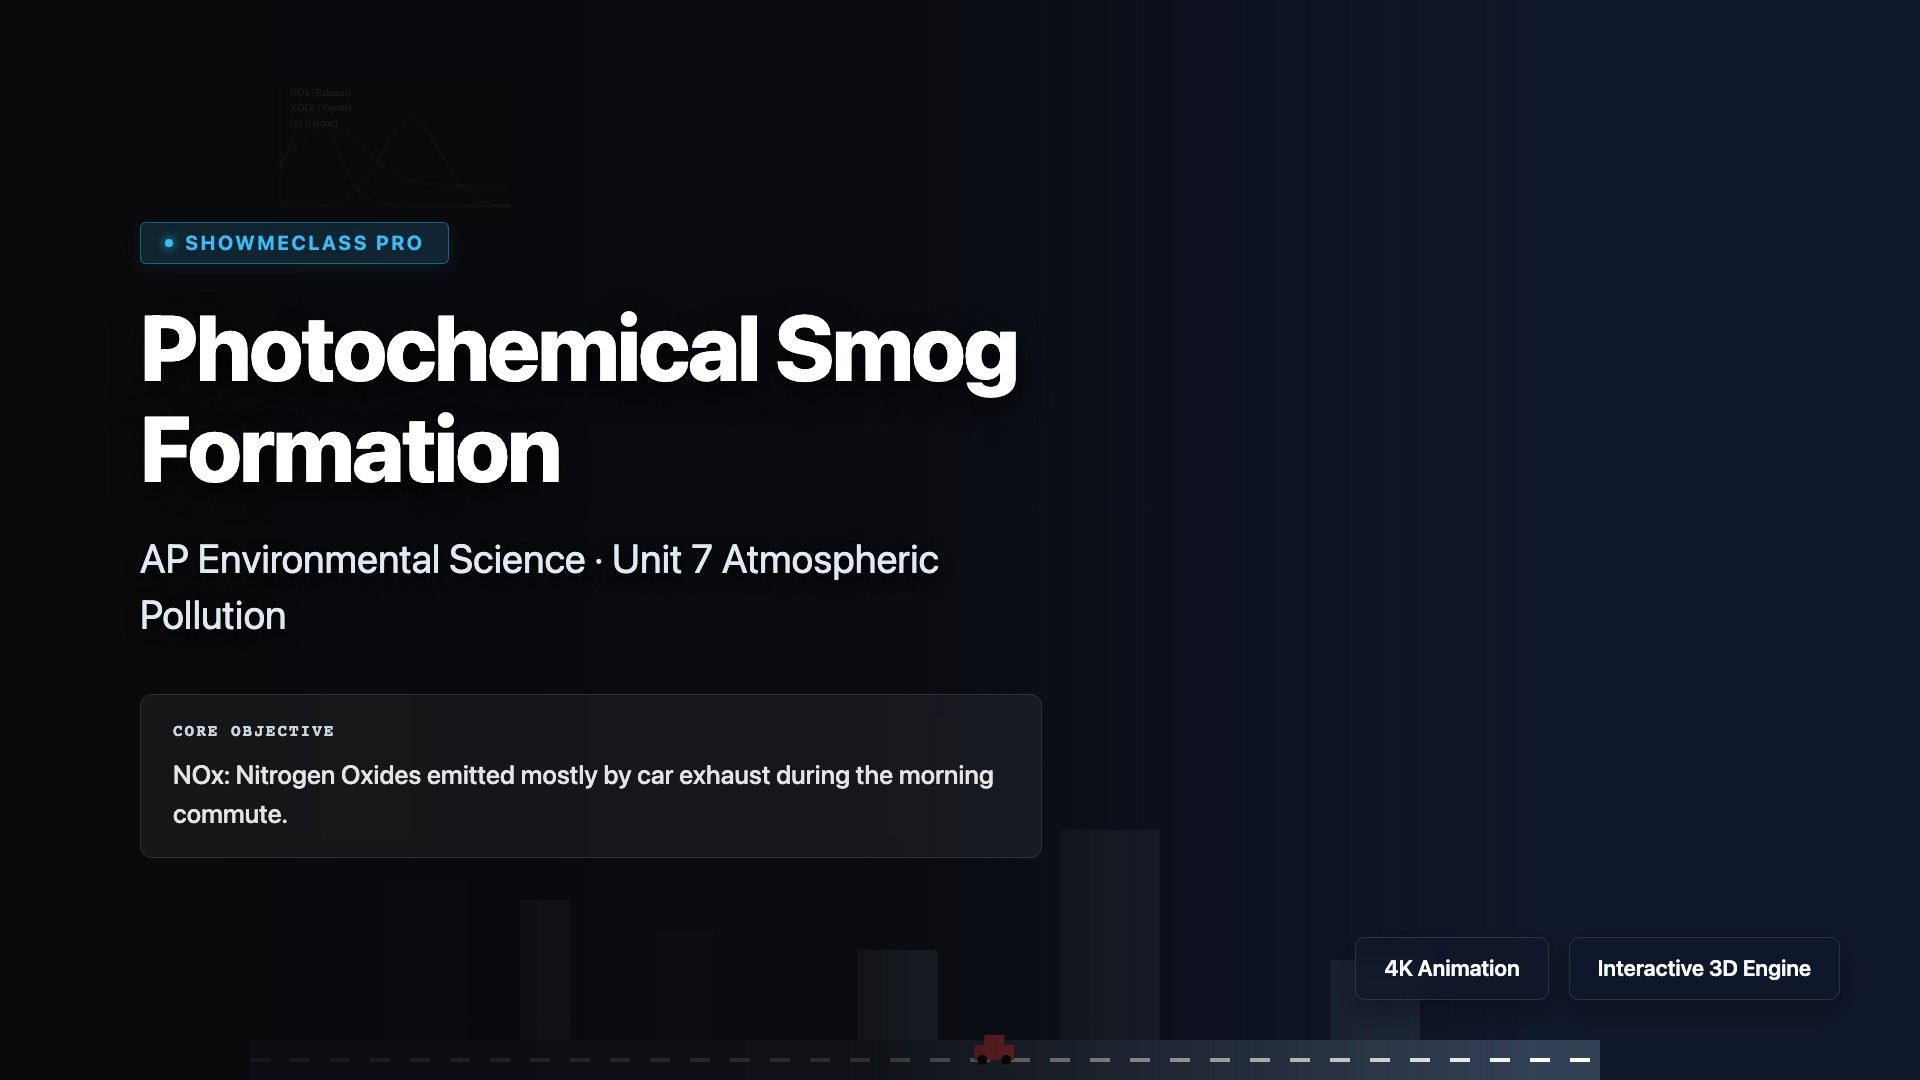
Photochemical Smog Formation
Interactive diurnal cycle simulator mapping the timing offset between morning commuter NOx emissions and peak afternoon photochemcial ozone formation.
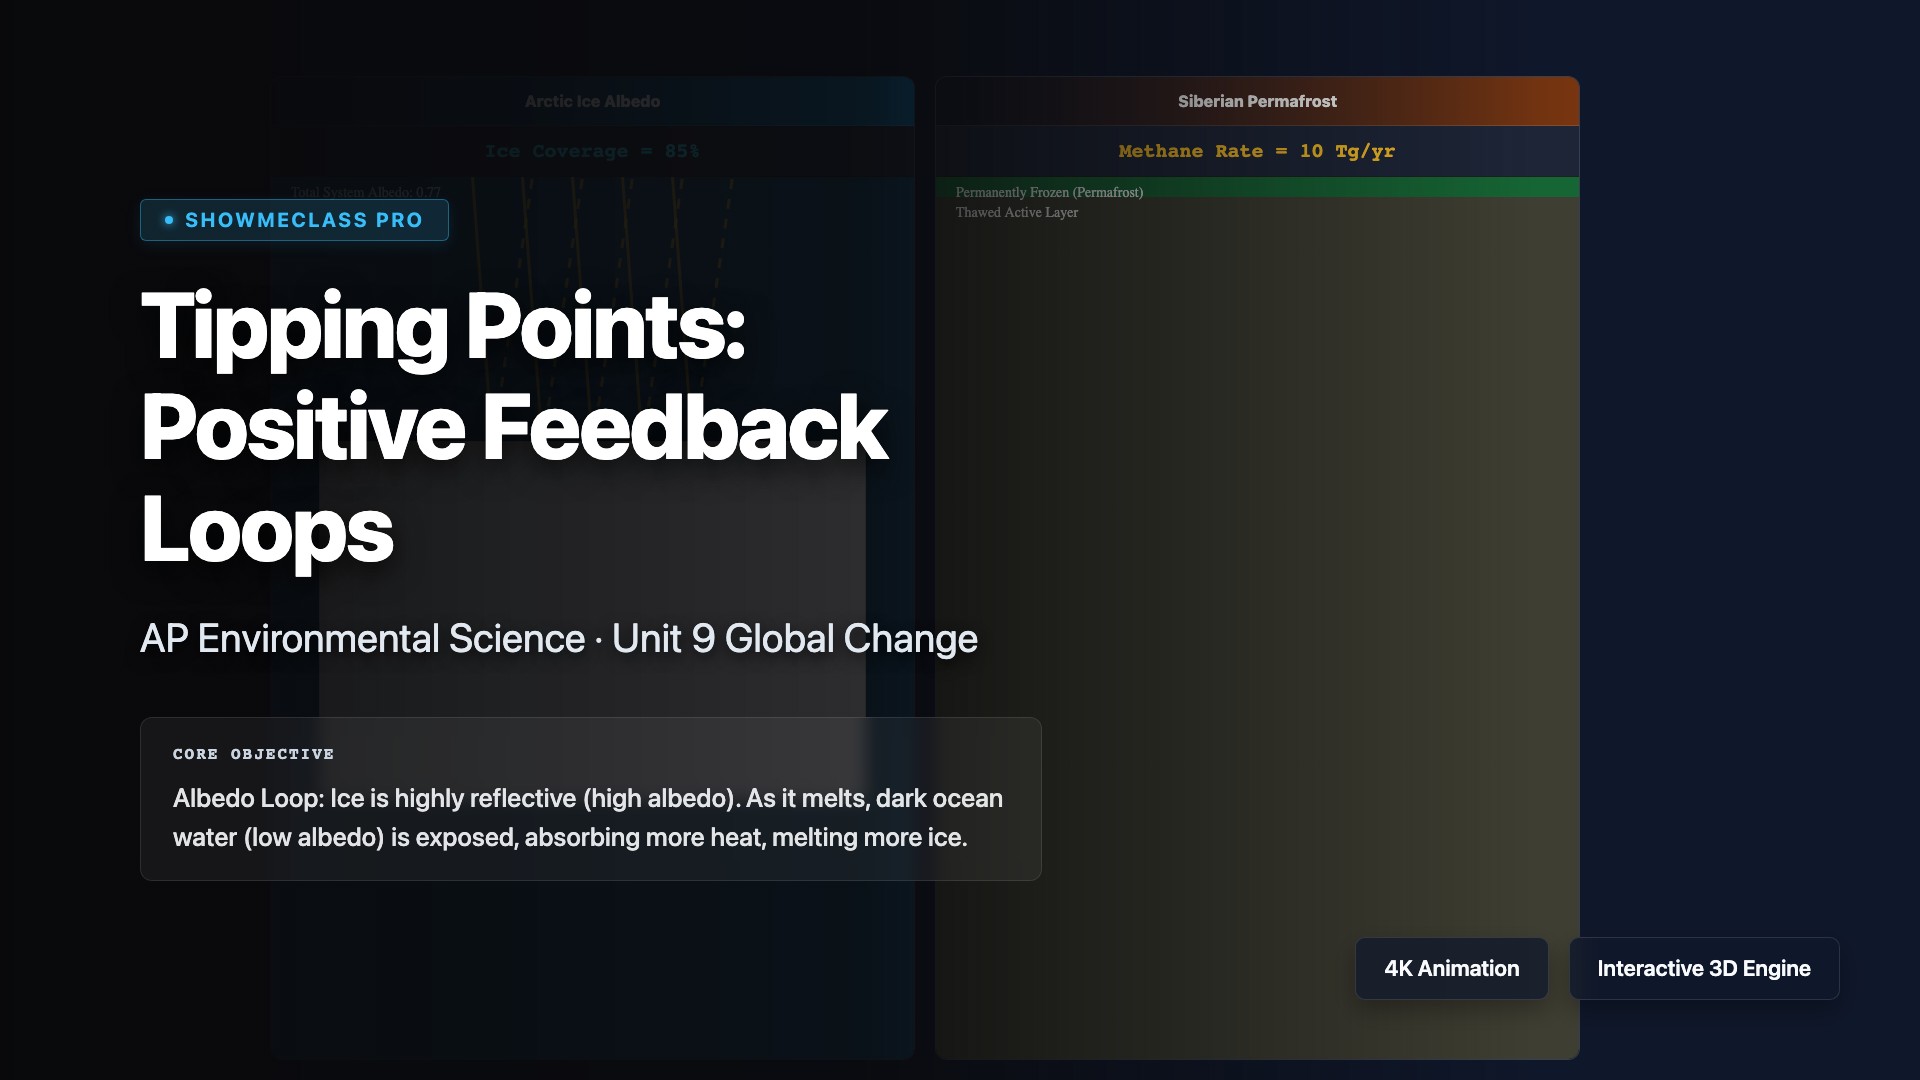
Tipping Points: Positive Feedback Loops
Dual-simulator visualizing physical positive climate tipping points: the exponential loss of sea-ice reflectivity (Albedo) alongside explosive methane expulsion from thawing Siberian permafrost.
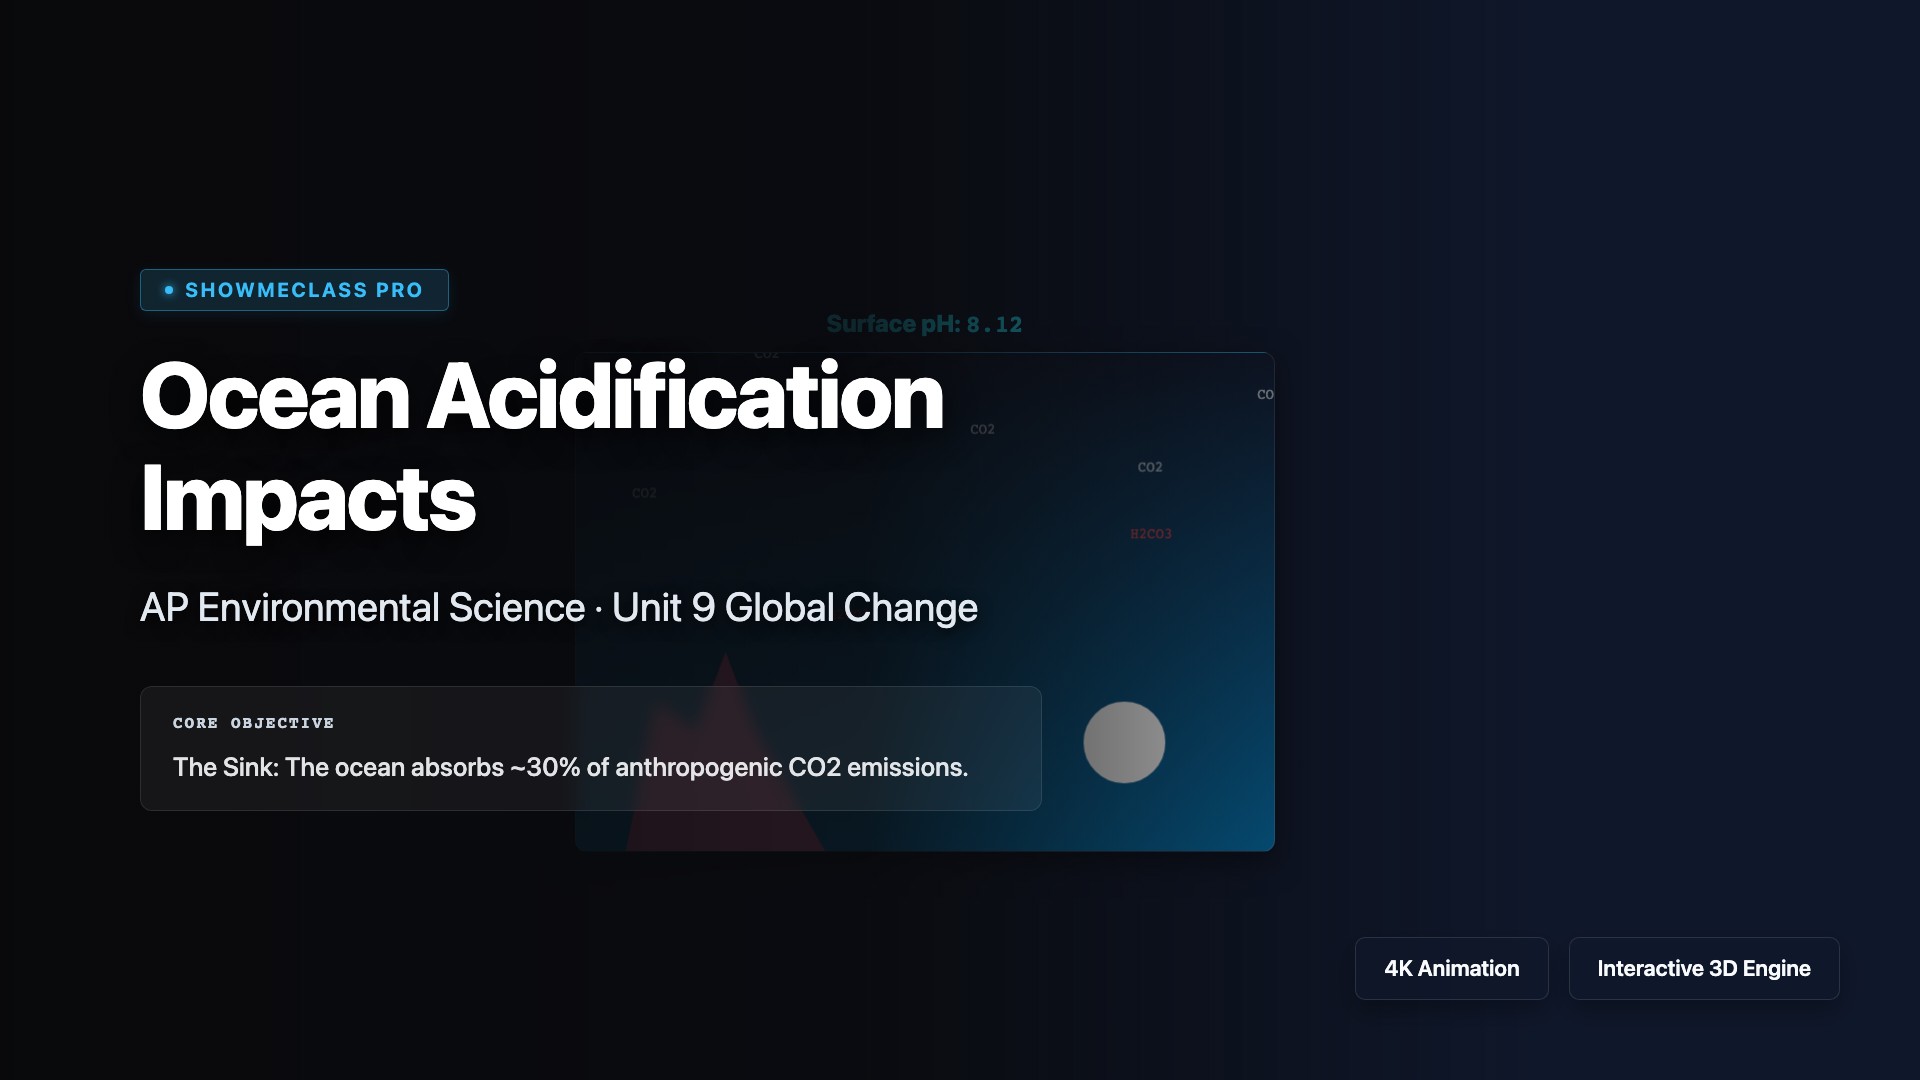
Ocean Acidification Impacts
Chemistry visualization of oceanic CO2 absorption forming Carbonic Acid. Tracks the precise mathematical pH logarithmic shift and devastating bio-calcification impacts (aragonite dissolution).
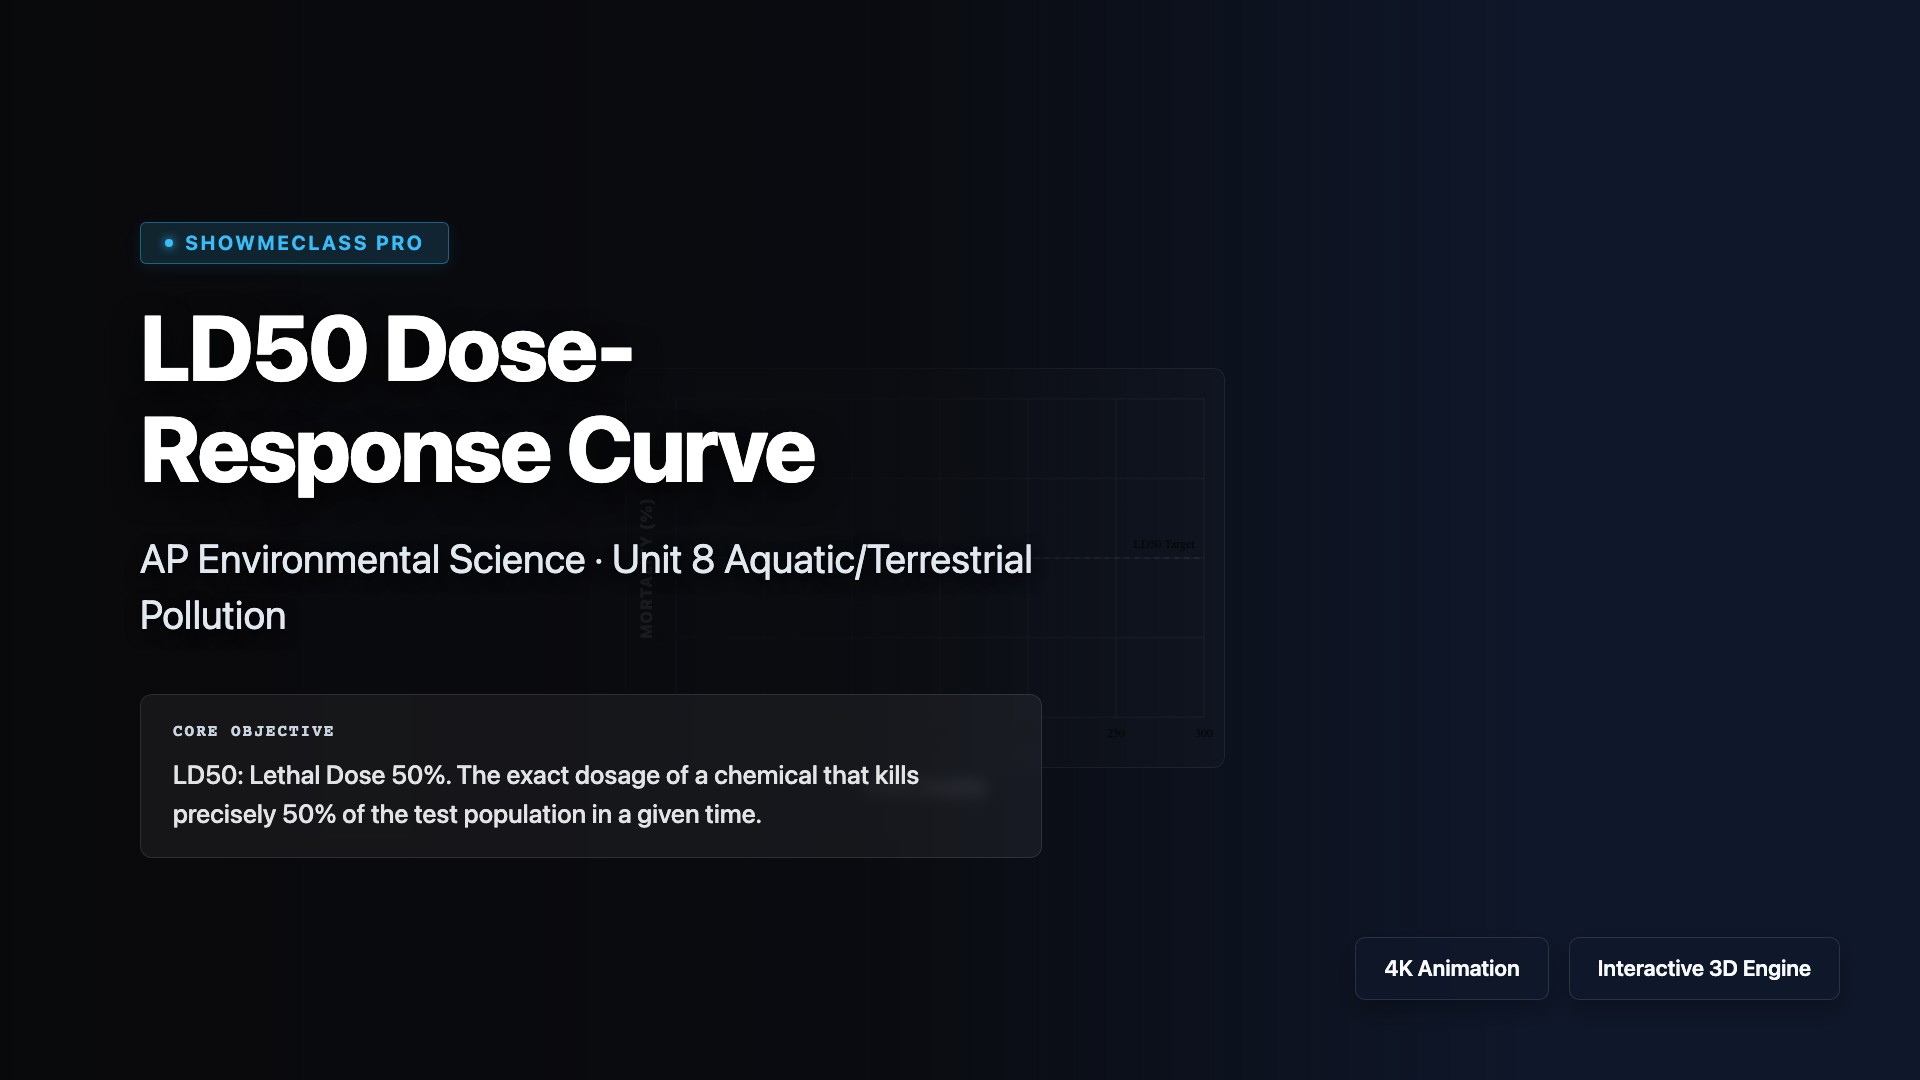
LD50 Dose-Response Curve
Toxicological laboratory test plotting the classic S-shaped dose-response curve to mathematically isolate the lethal dose 50% (LD50) threshold constraint.
Bioaccumulation & Biomagnification
Step-by-step mathematical visualization of biomagnification. Tracks the exponential concentration multiplication of fat-soluble toxins (DDT) as energy degrades across trophic levels.
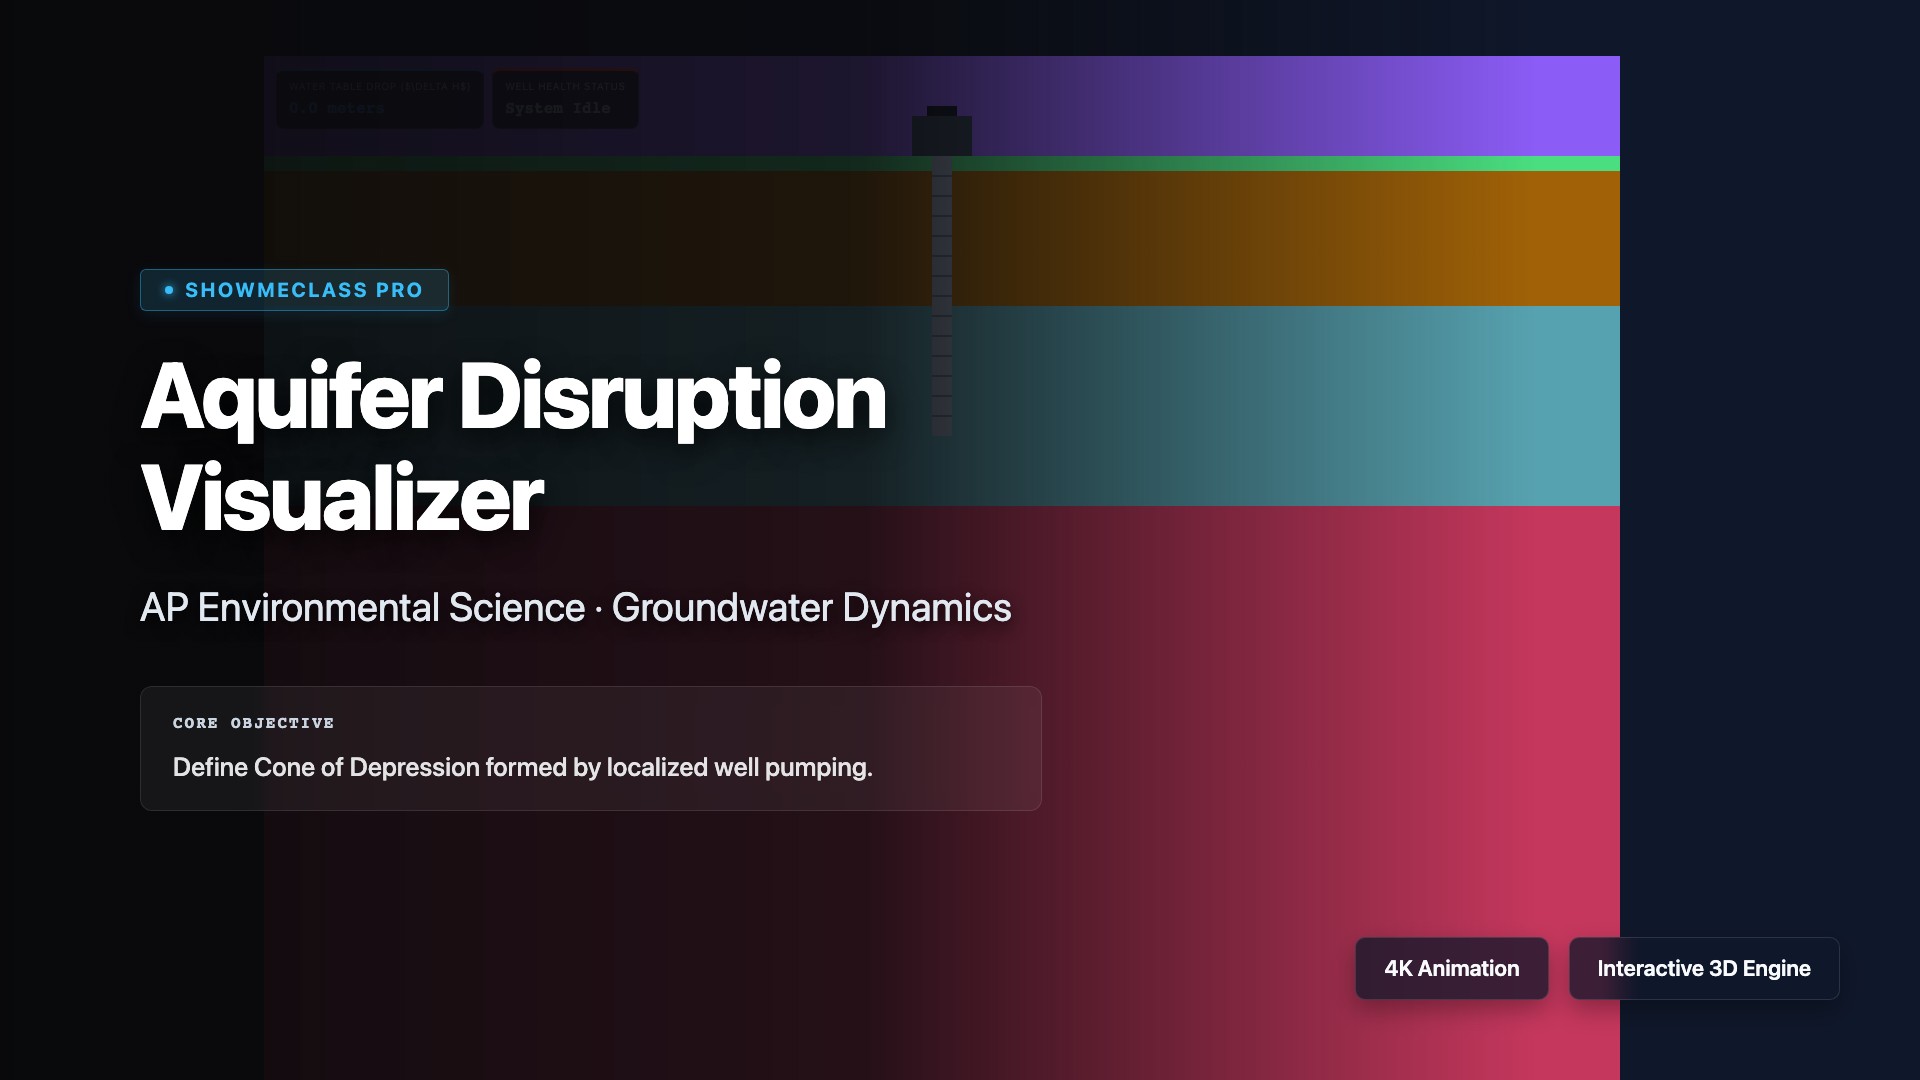
Aquifer Drawdown & Saltwater Intrusion
Examine groundwater dynamics under agricultural duress. Over-pump the well to witness the Cone of Depression collapse the water table, eventually drawing up toxic saltwater from the deep aquifer and ruining the well.
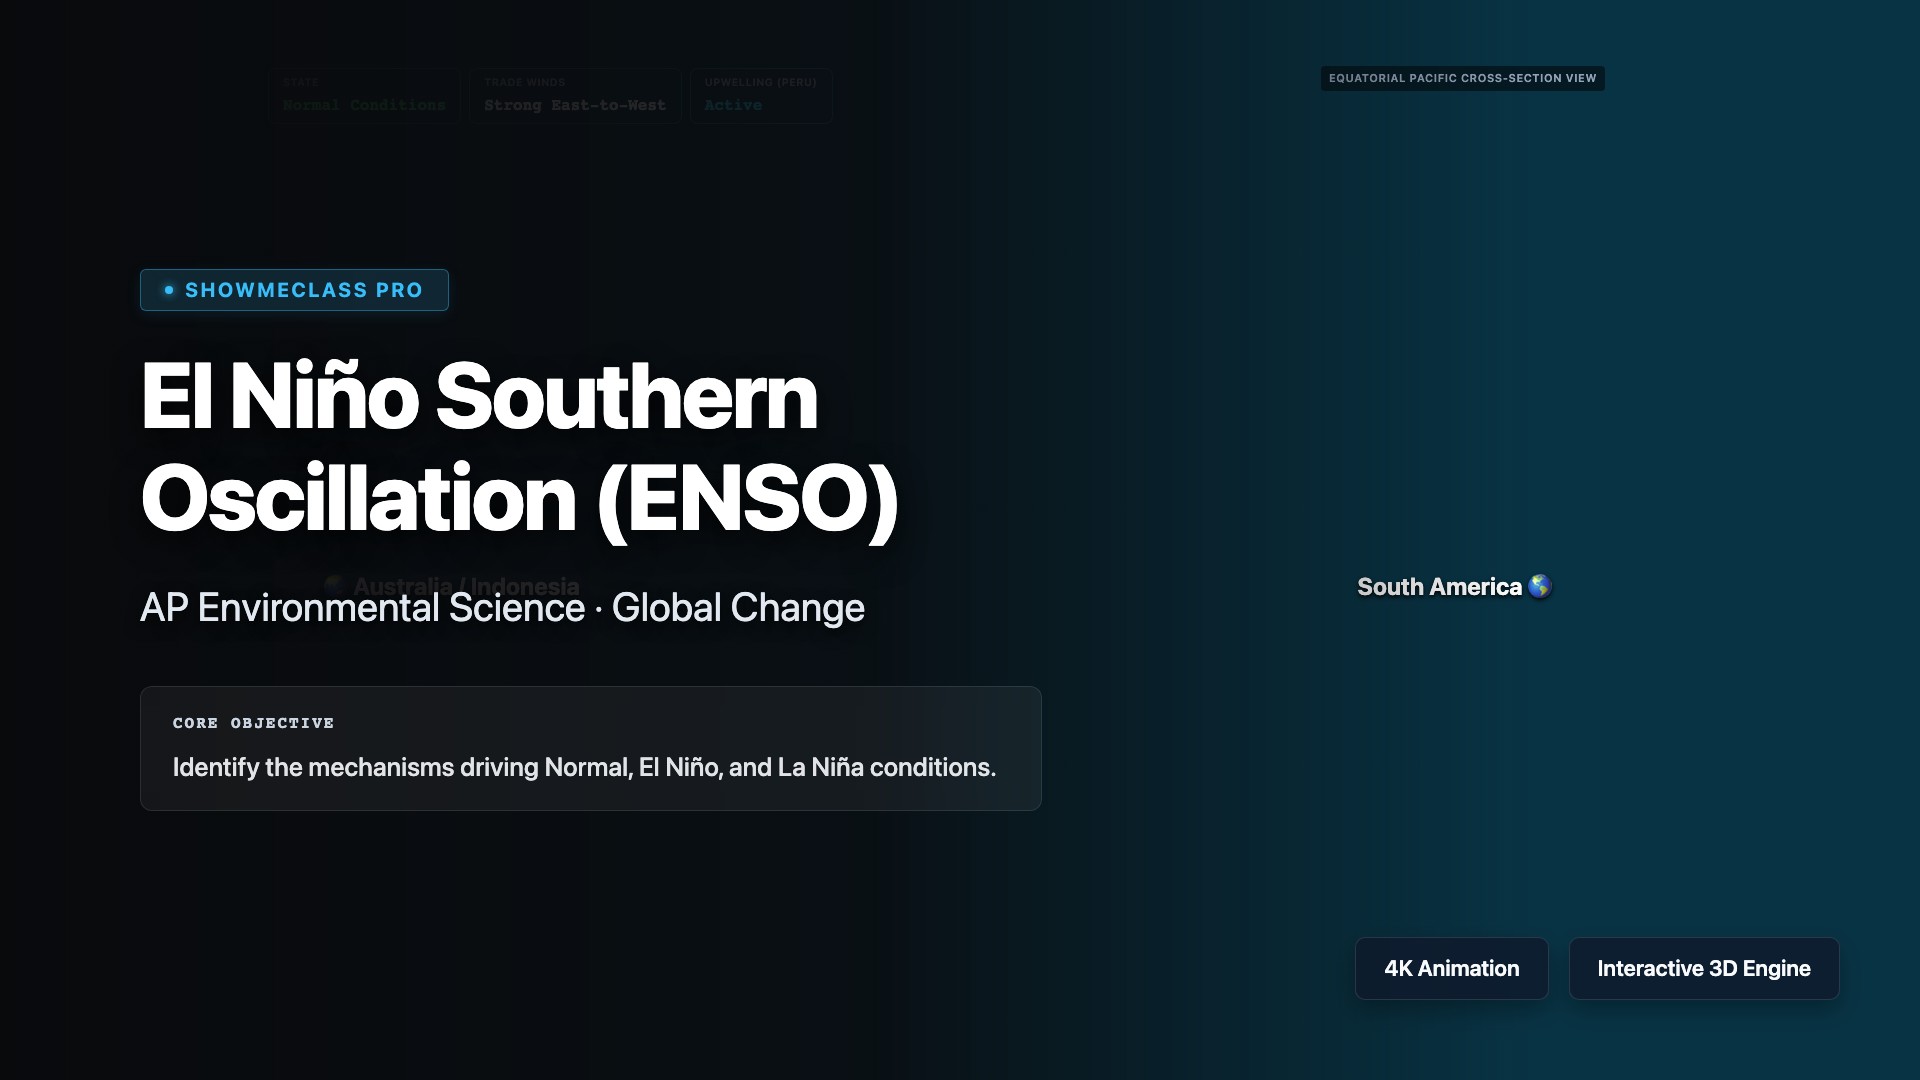
El Niño Southern Oscillation (ENSO)
Visualize the Pacific Ocean trade winds, thermocline shift, and upwelling mechanisms that govern El Niño and La Niña climate phases.
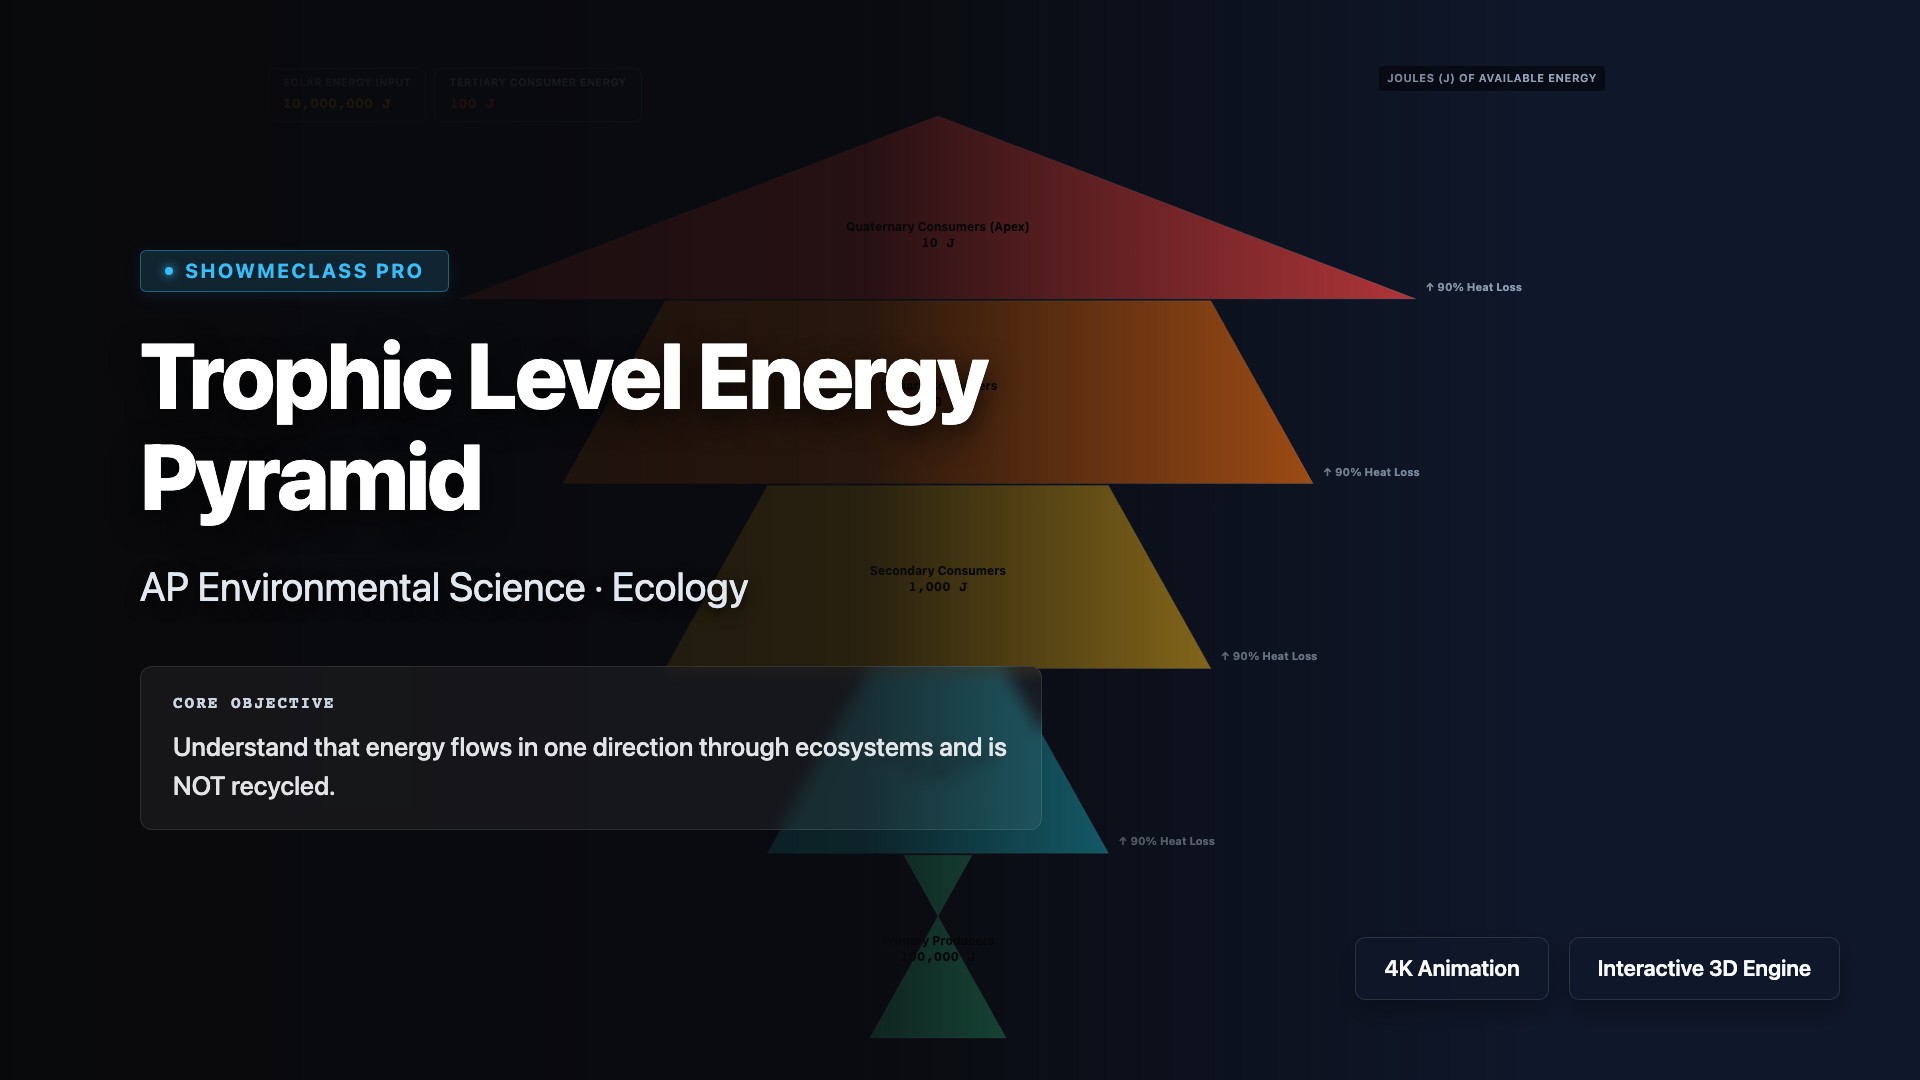
Trophic Energy Pyramid
Observe the 10% Rule in action: Energy flows in one direction and 90% is lost at each step, explaining why ecosystems rarely support chains longer than 5 levels.