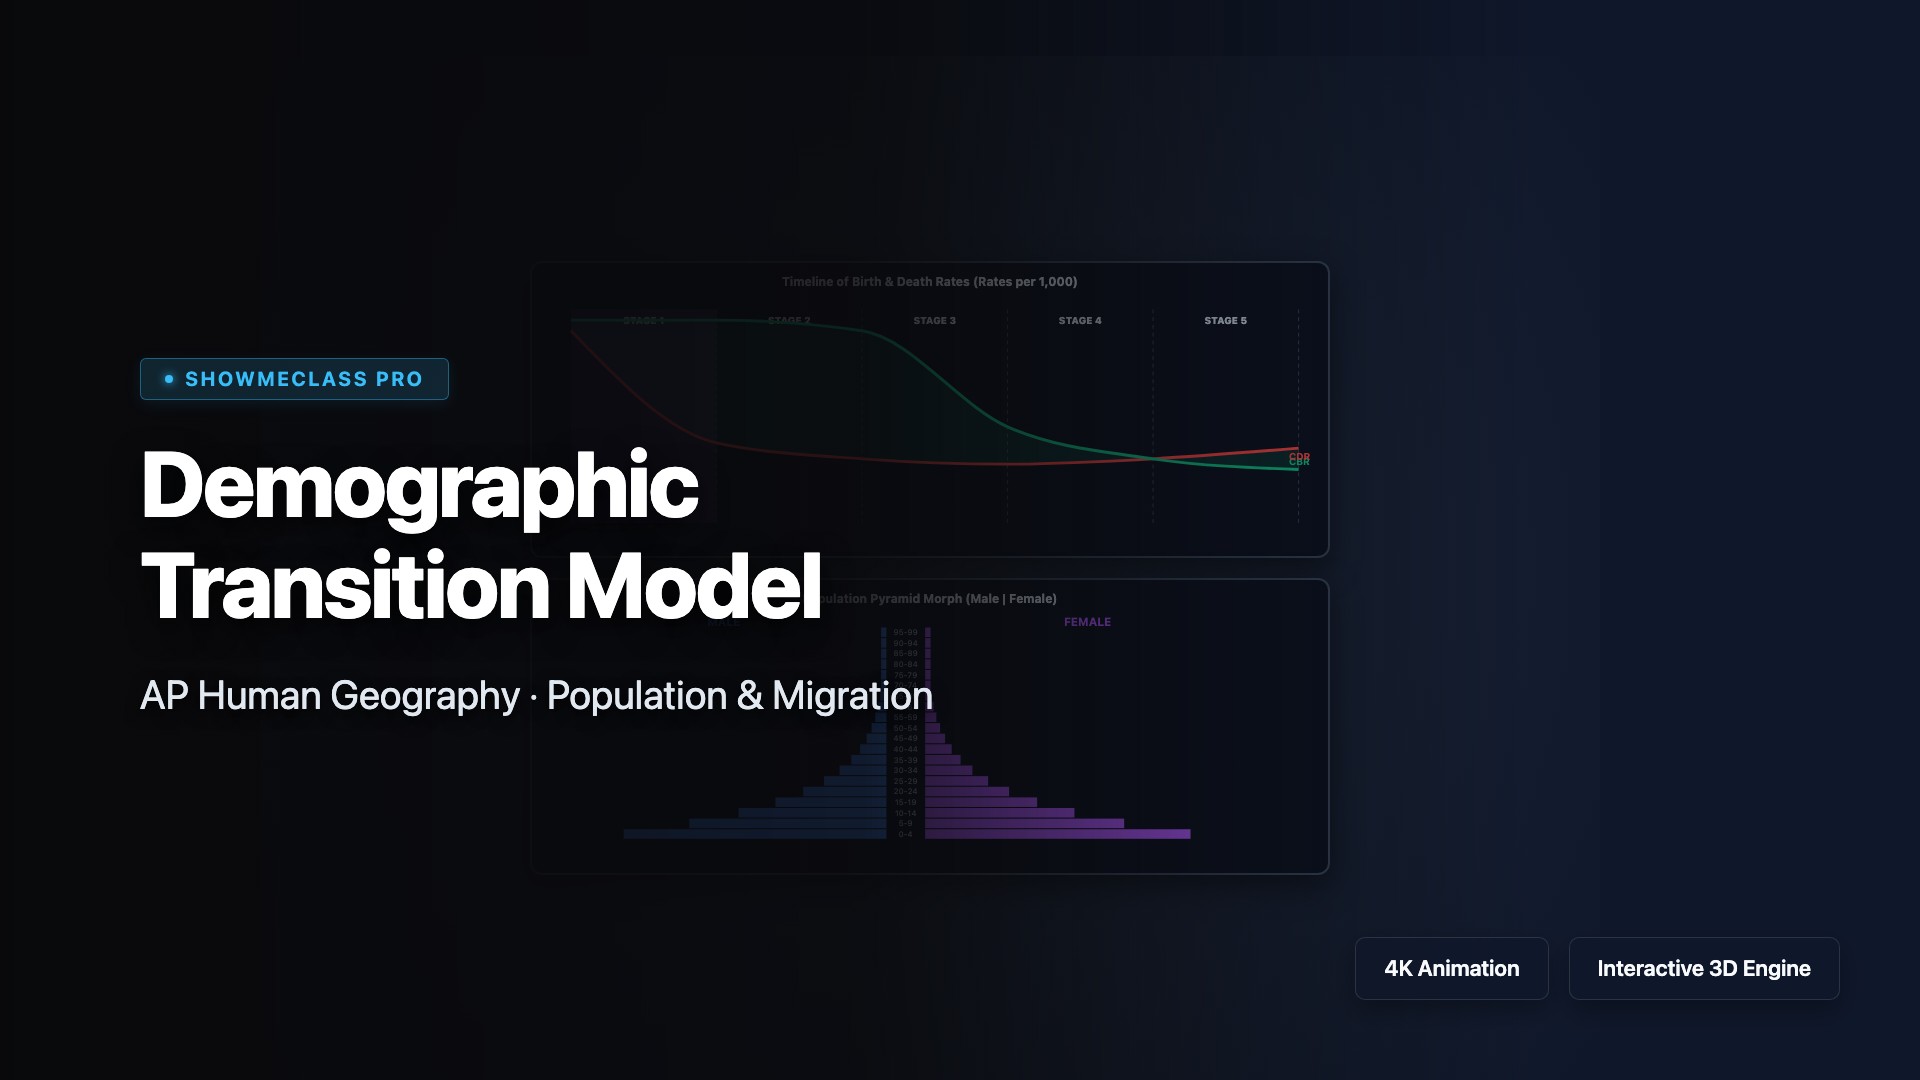
DTM Expanded Model
Scrub through the 5 stages of the Demographic Transition Model. Watch CBR, CDR, and Natural Increase shift while witnessing the real-time morphing of population pyramids.

Central Place Theory
Unlock Walter Christaller's urban model. Toggle Range and Threshold parameters across a hexagonal grid to understand the spatial distribution of hamlets, villages, towns, and massive Central Cities.

Migration Push/Pull Factors
Visualize the forces of global migration. Set economic, political, and environmental push/pull factors, and watch how intervening obstacles and opportunities alter the migration stream.

Urban Models: Burgess/Hoyt
Compare the core North American urban models. Toggle between the Burgess Concentric Zone and Hoyt Sector models to understand socio-economic spatial layout.

Agricultural Origins Map
Explore the First Agricultural Revolution on an interactive timeline. Click flashing hearths to discover the origin points for global domestication of plants and animals.

Supply Chain Routing
Test Weber's Least Cost Theory. Drag factory locations across a map to balance raw material and market distances for bulk-gaining and bulk-reducing industries.

Urban Land Use Models – AP Human Geography
Interactive visualization for Urban Land Use Models – AP Human Geography in AP HUMAN GEOGRAPHY.

Choropleth Map Explorer – AP Human Geography
Interactive visualization for Choropleth Map Explorer – AP Human Geography in AP HUMAN GEOGRAPHY.

Types of Diffusion – AP Human Geography
Interactive visualization for Types of Diffusion – AP Human Geography in AP HUMAN GEOGRAPHY.
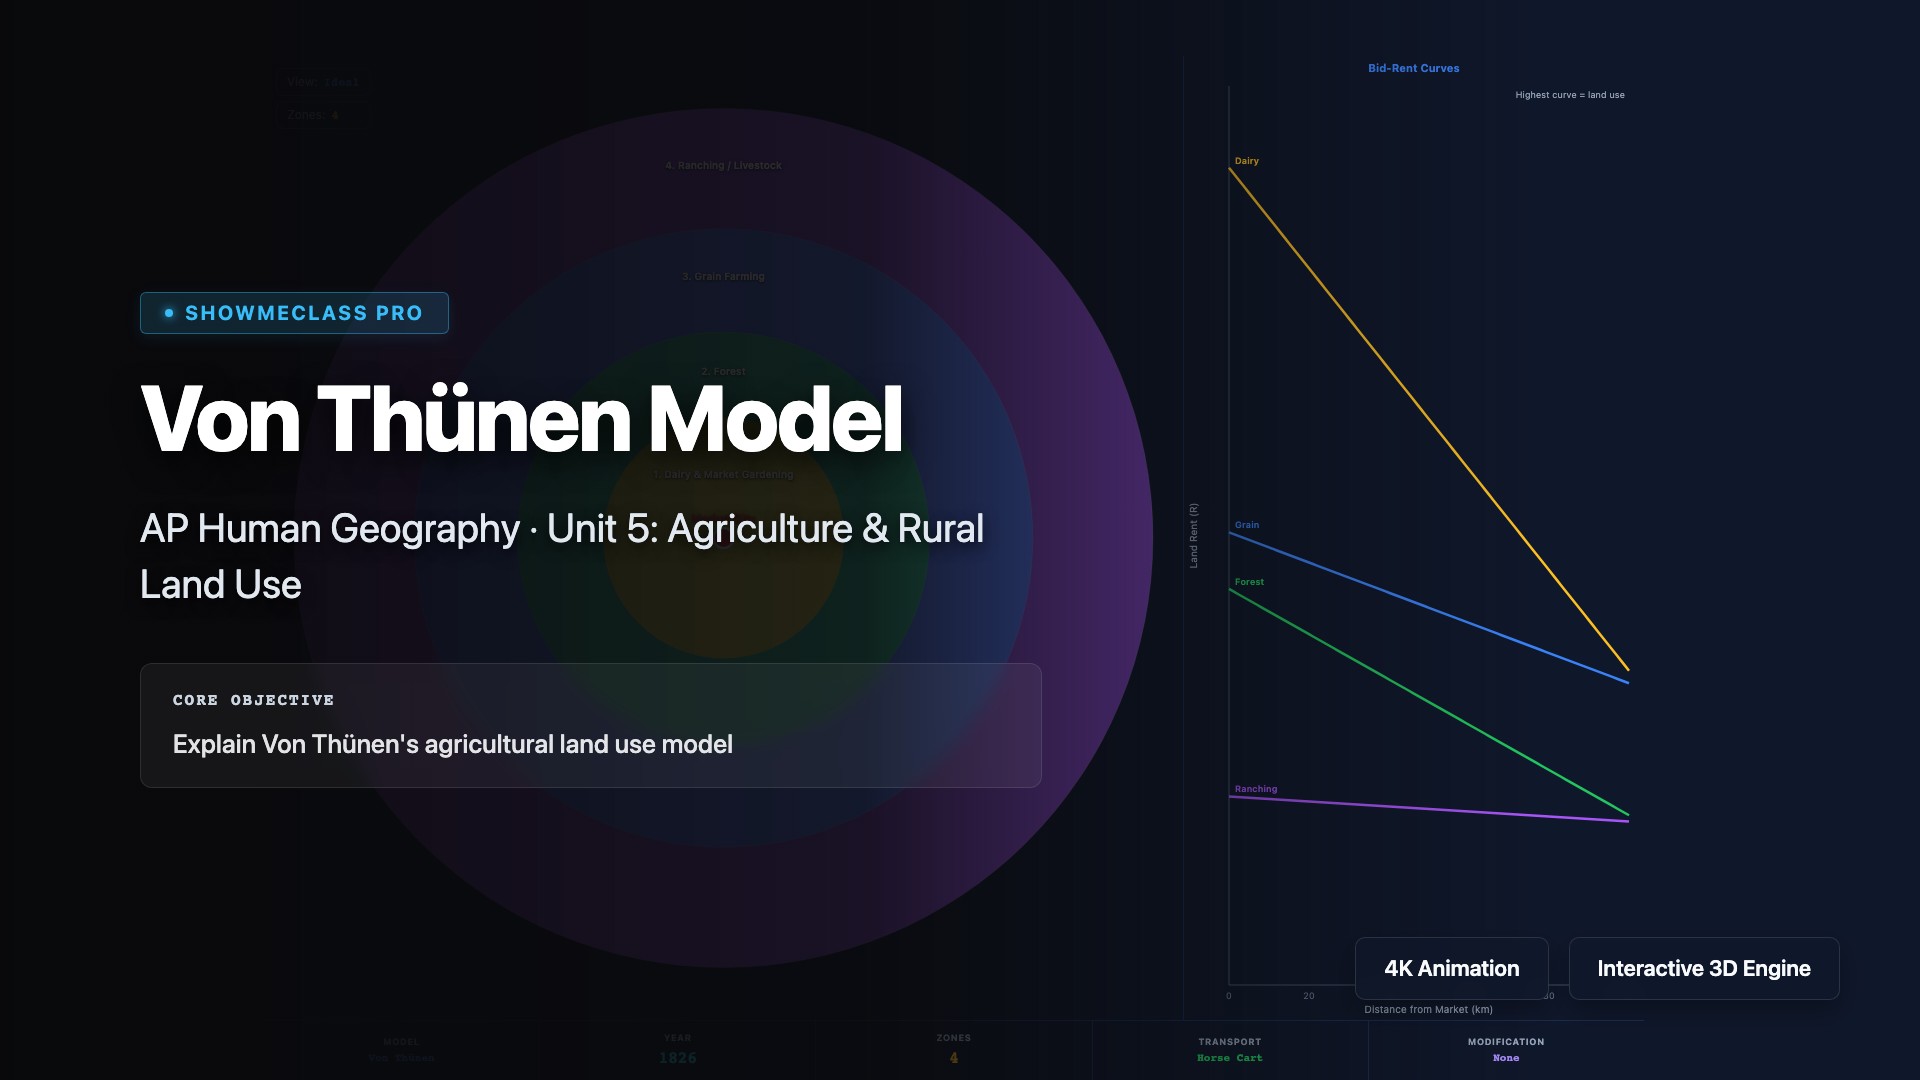
Von Thünen Model – AP Human Geography
Interactive visualization for Von Thünen Model – AP Human Geography in AP HUMAN GEOGRAPHY.
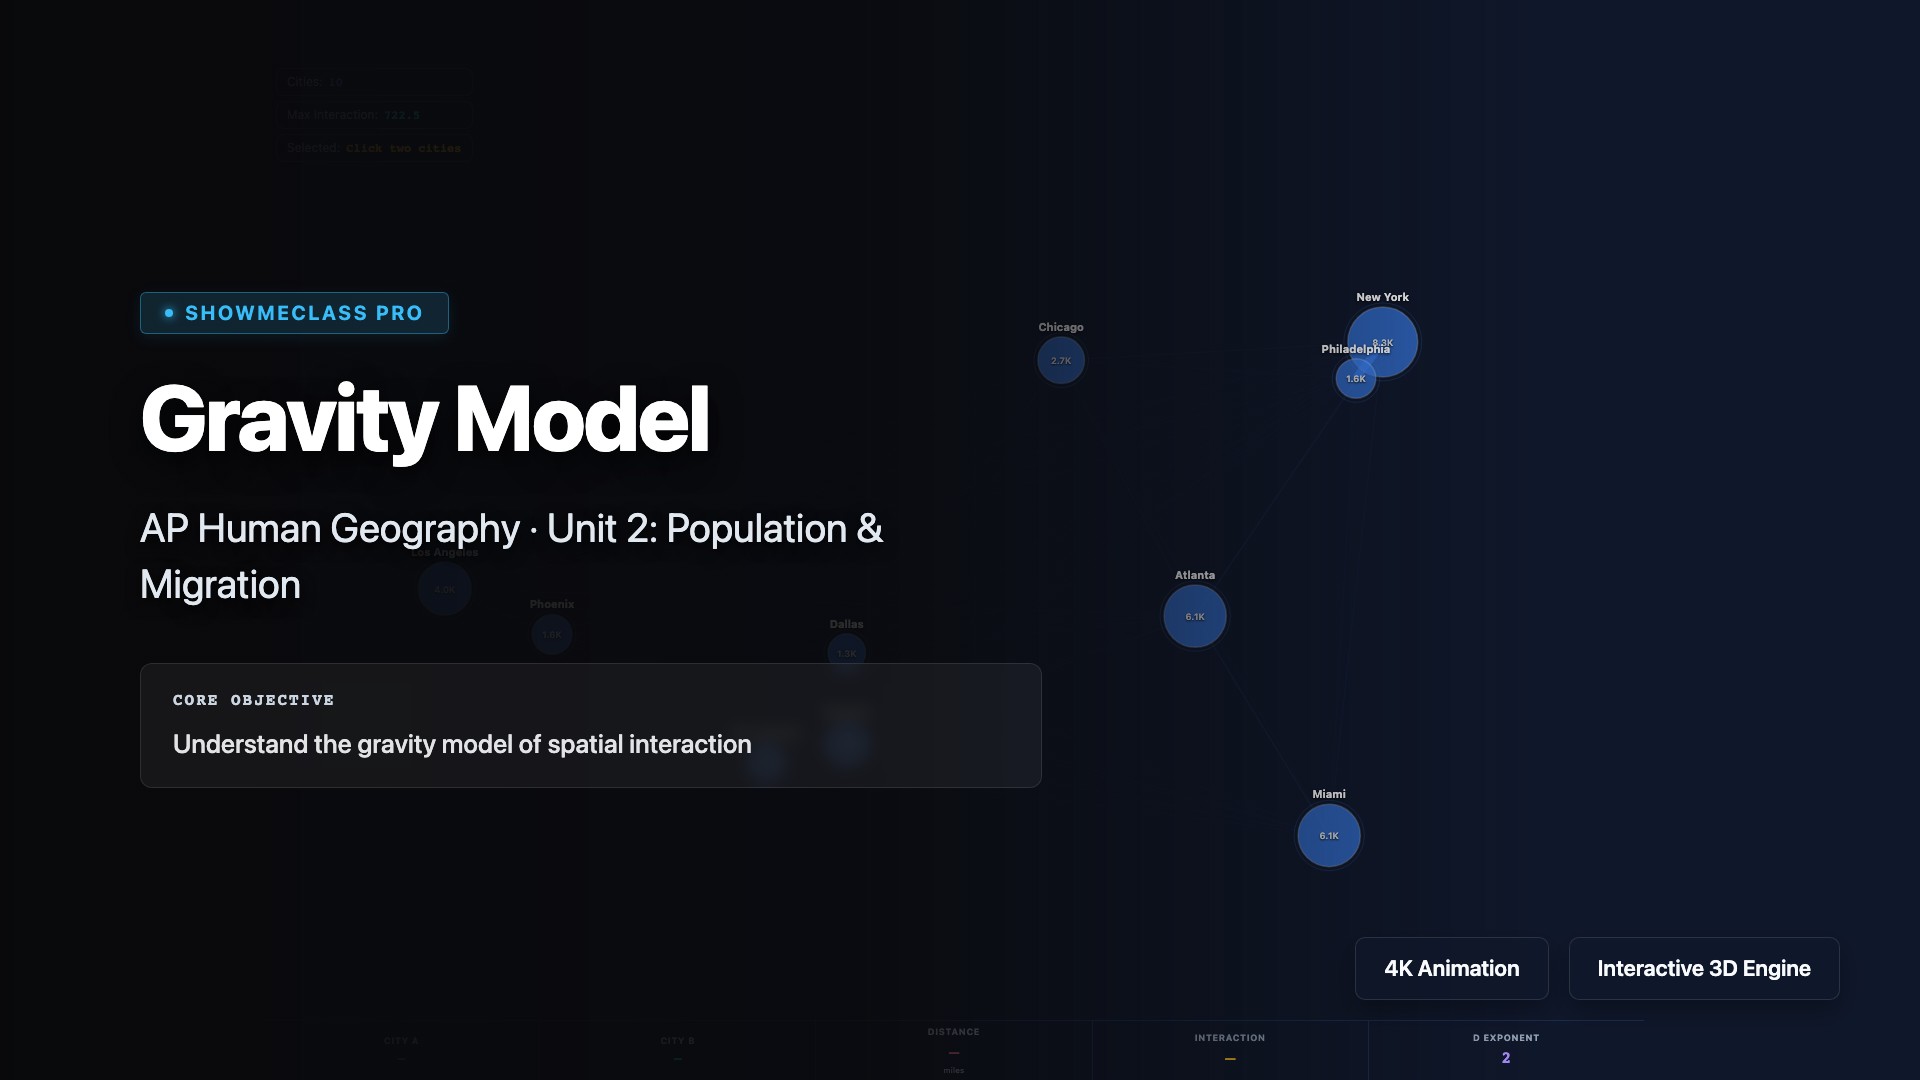
Gravity Model – AP Human Geography
Interactive visualization for Gravity Model – AP Human Geography in AP HUMAN GEOGRAPHY.
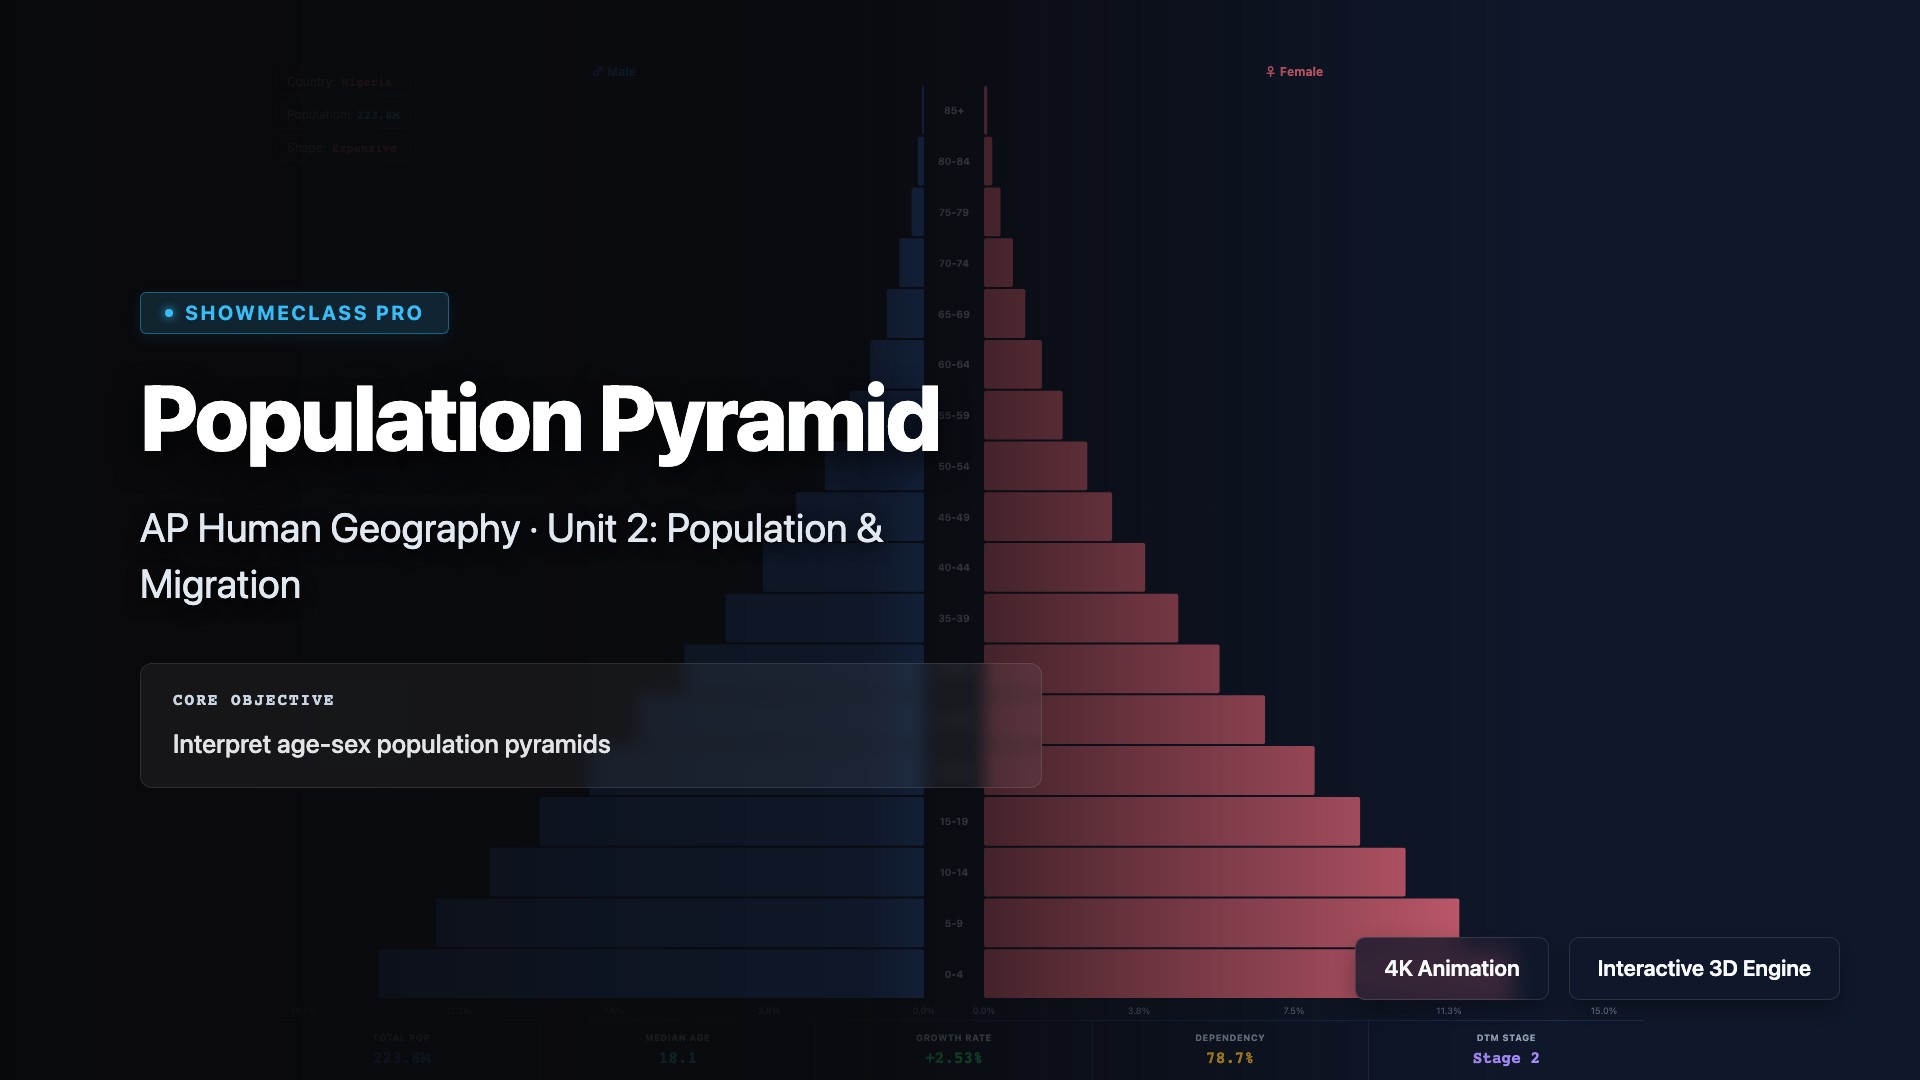
Population Pyramid – AP Human Geography
Interactive visualization for Population Pyramid – AP Human Geography in AP HUMAN GEOGRAPHY.

Rostow's Stages of Growth
Navigate the 5 linear stages W.W. Rostow asserted all countries must pass through to modernize, from Traditional Society to High Mass Consumption.