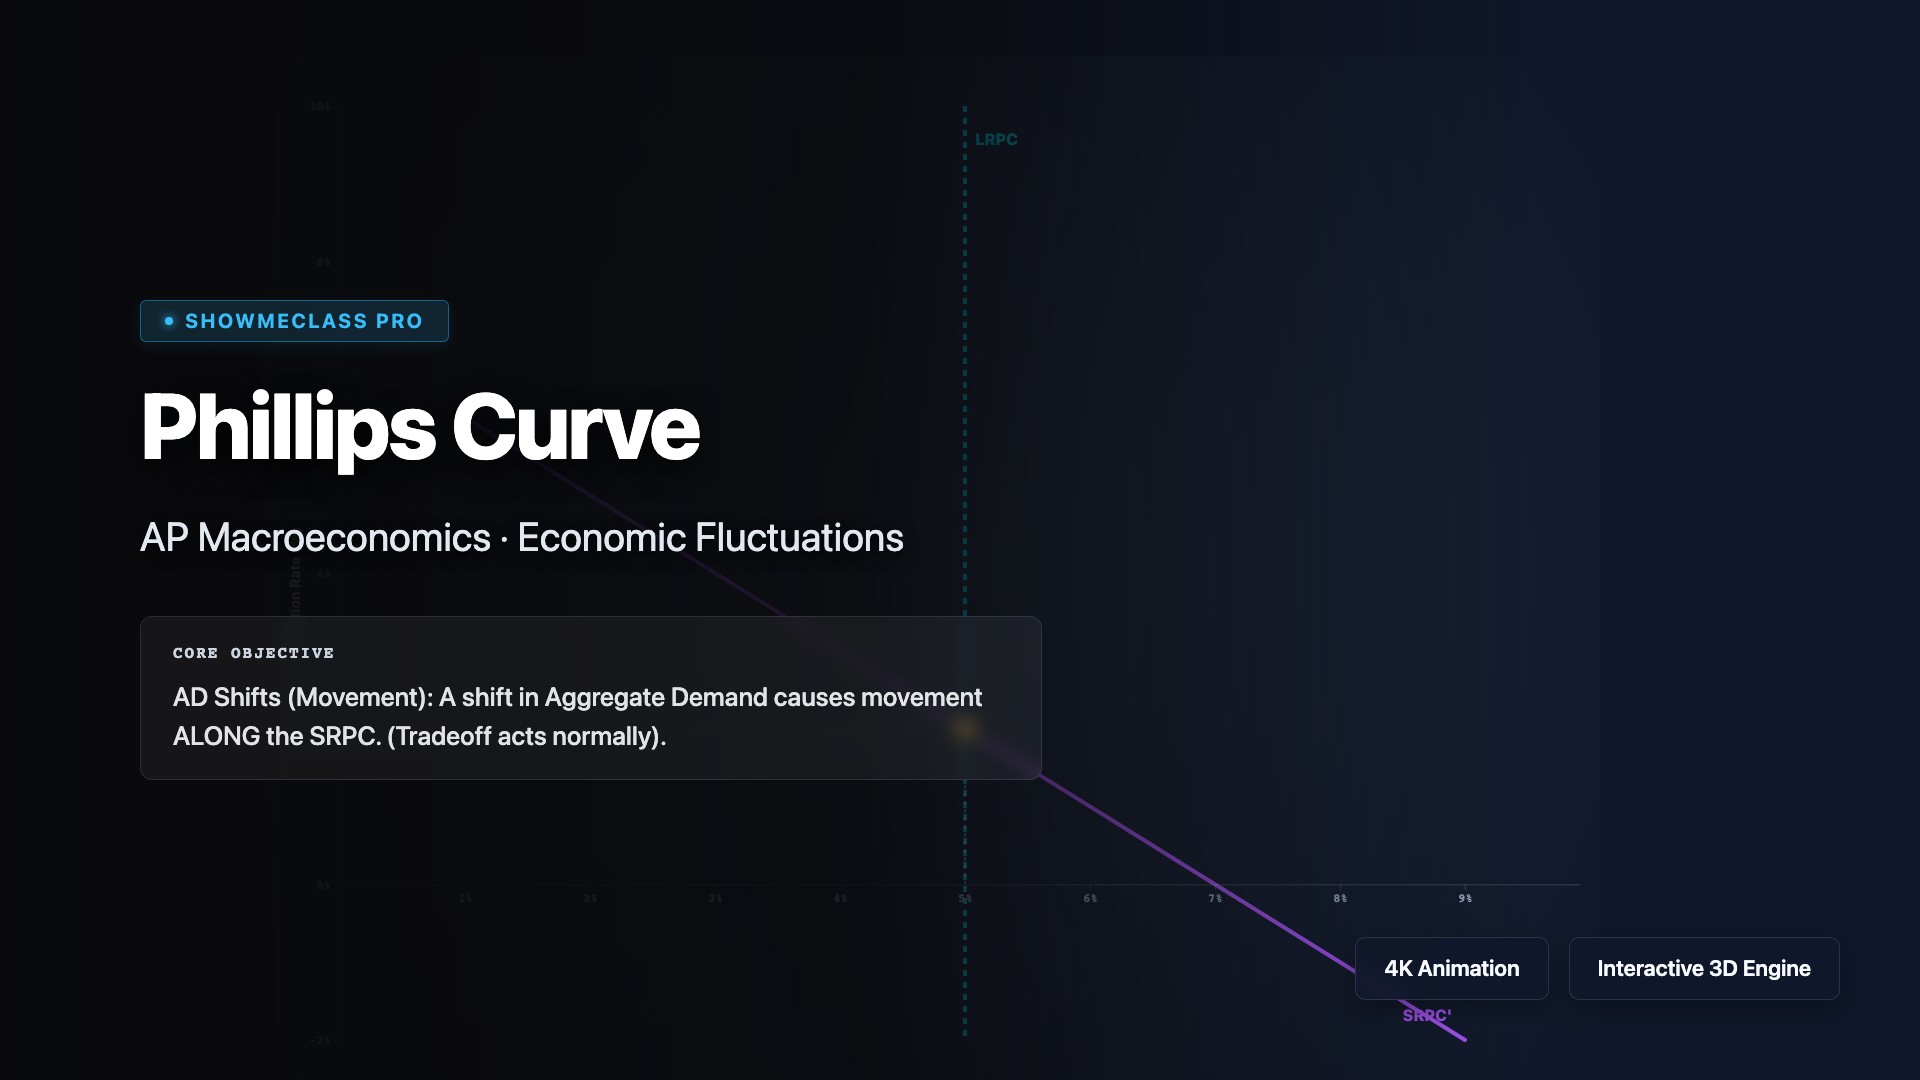
Phillips Curve dynamics
Master the Inflation-Unemployment tradeoff. Separate short-run movements along the SRPC (Demand Shocks) from catastrophic shifts of the entire curve (Supply Shocks causing Stagflation).
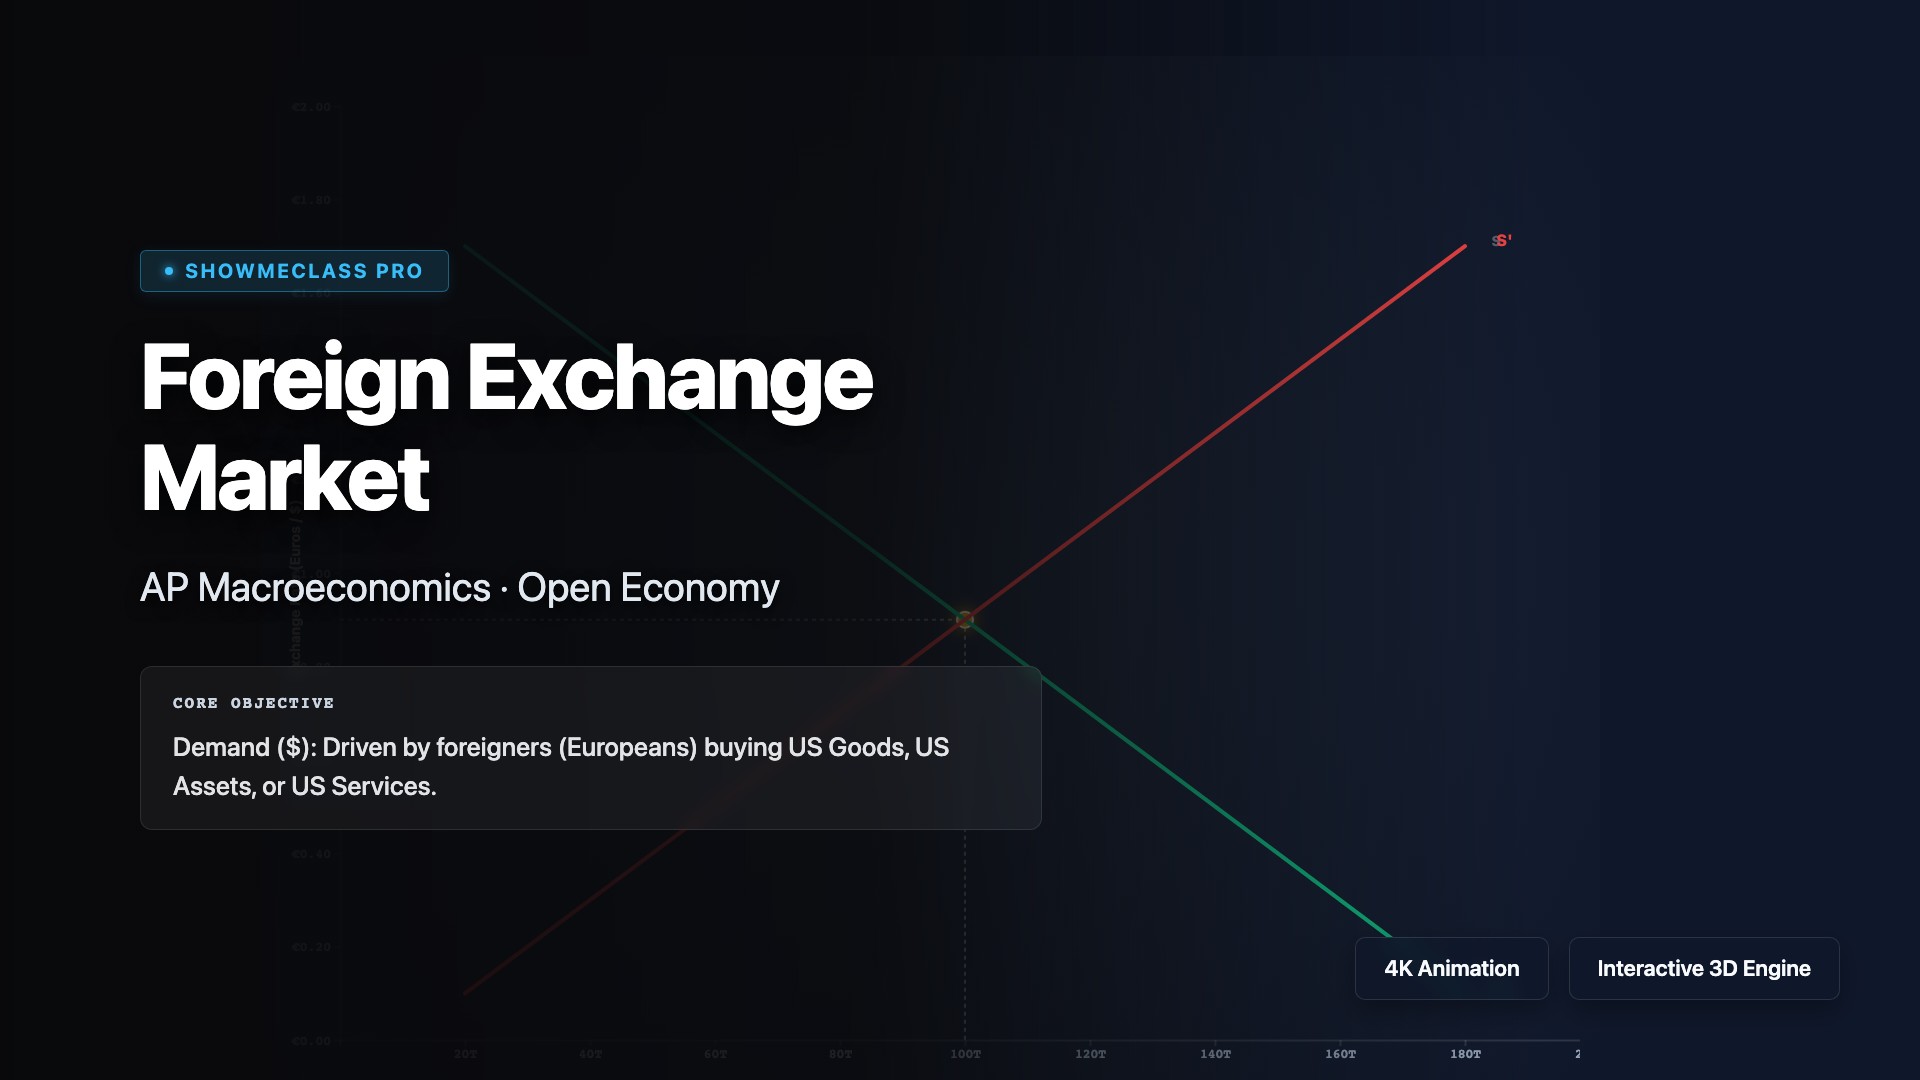
Foreign Exchange Market
Visualize currency Appreciation and Depreciation on the forex market. Shift Supply and Demand curves for US Dollars relative to the Euro based on dynamic global conditions.

Money Multiplier
Deconstruct Fractional Reserve Banking. Track an initial deposit dynamically chaining through multiple bank node T-accounts via Excess Reserve lending.
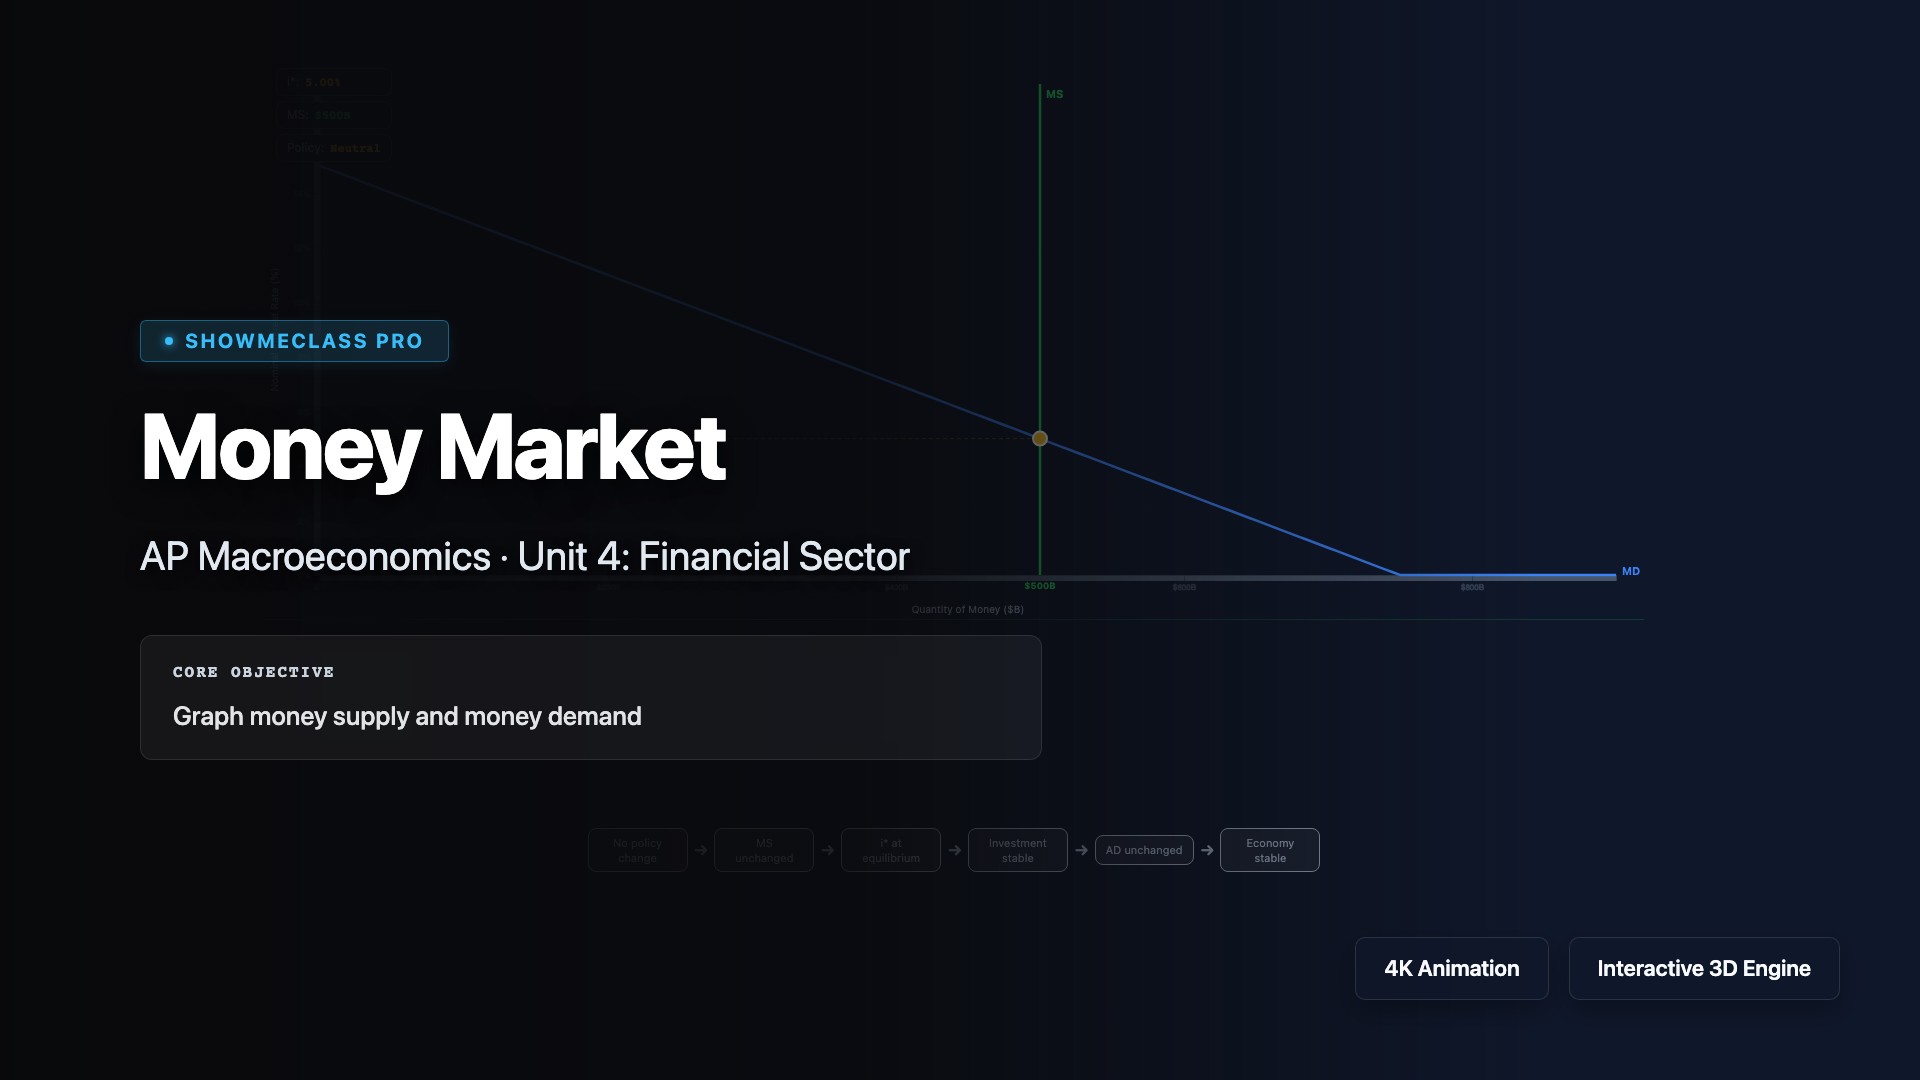
Money Market
Explore the money market where the supply and demand for money determine the nominal interest rate. Visualize how the Federal Reserve controls money supply through open market operations, reserve requirements, and the discount rate. Understand the inverse relationship between bond prices and interest rates, how changes in money supply shift the vertical MS curve, and how the Fed uses monetary policy to influence economic activity, inflation, and employment.
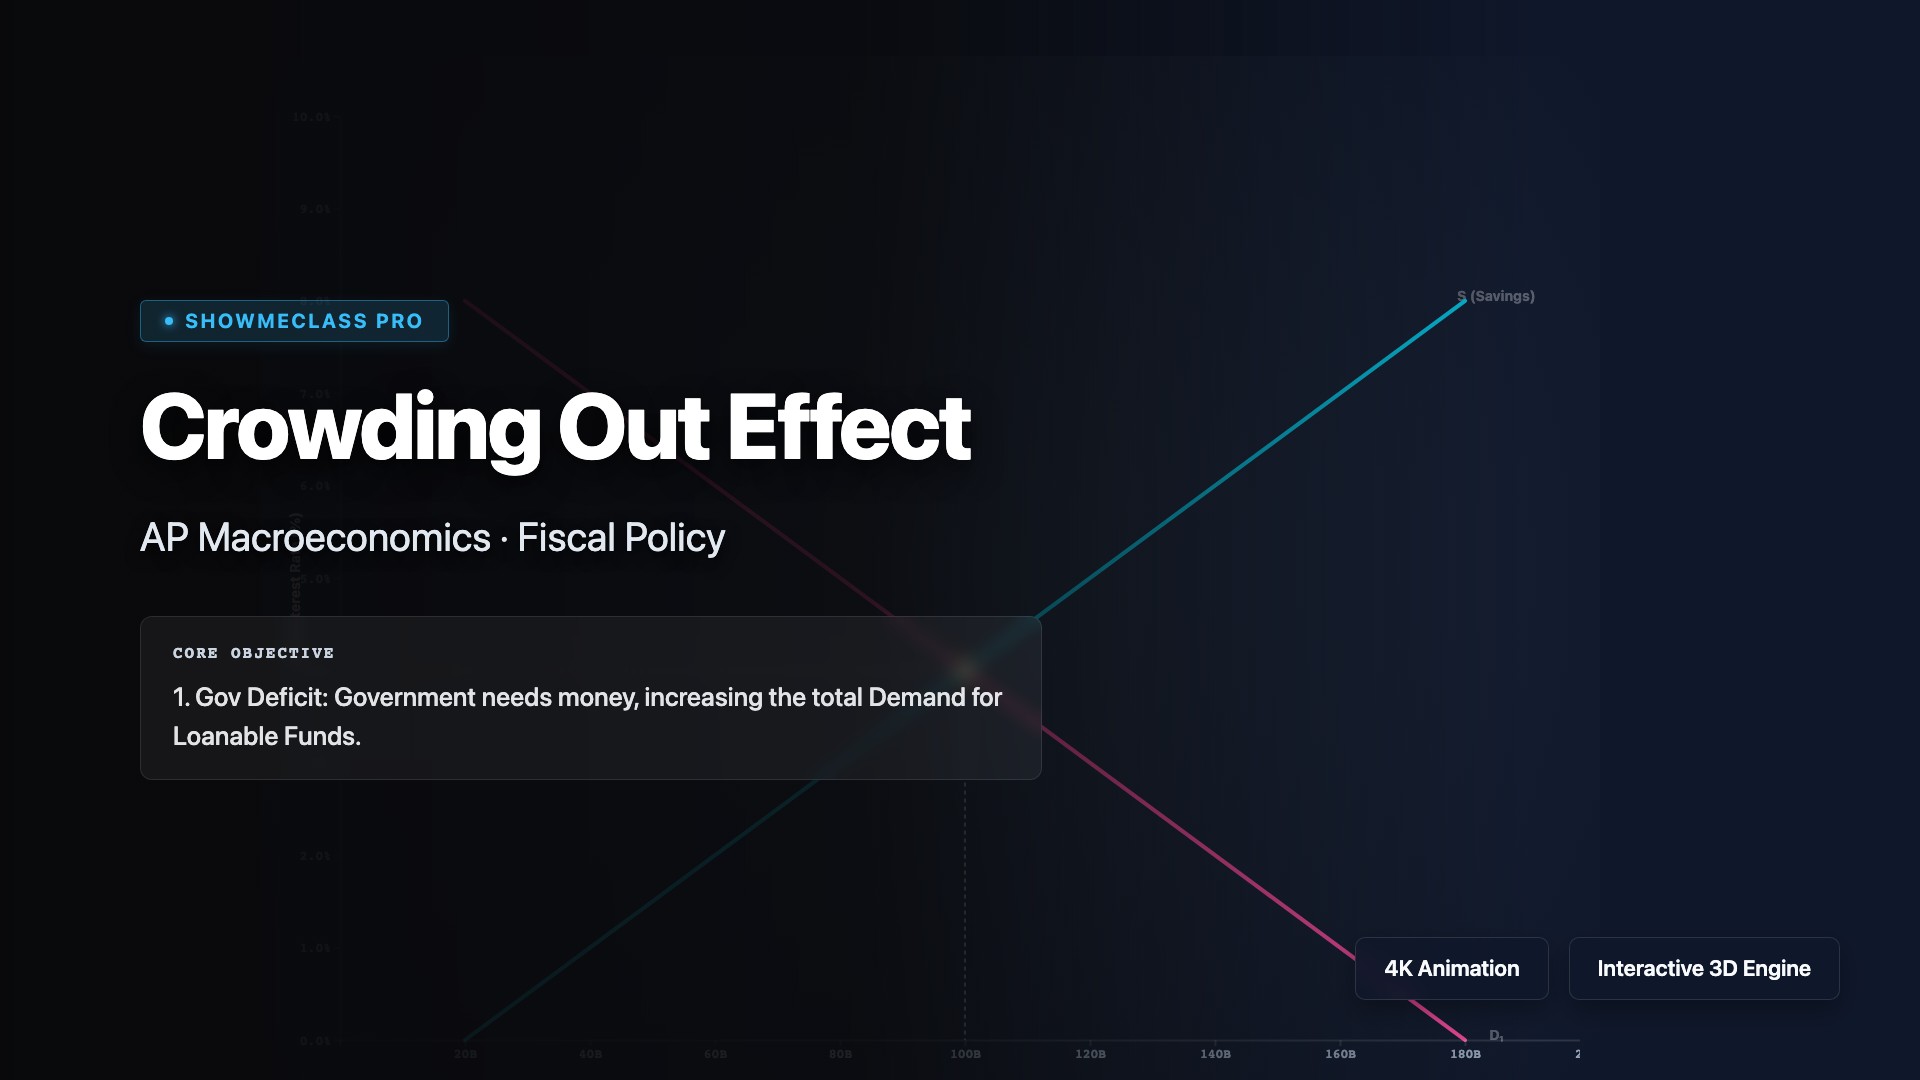
Crowding Out Effect
Observe how Government Deficit spending spikes Real Interest Rates in the Loanable Funds Market, inadvertently Crowding Out private business investment.
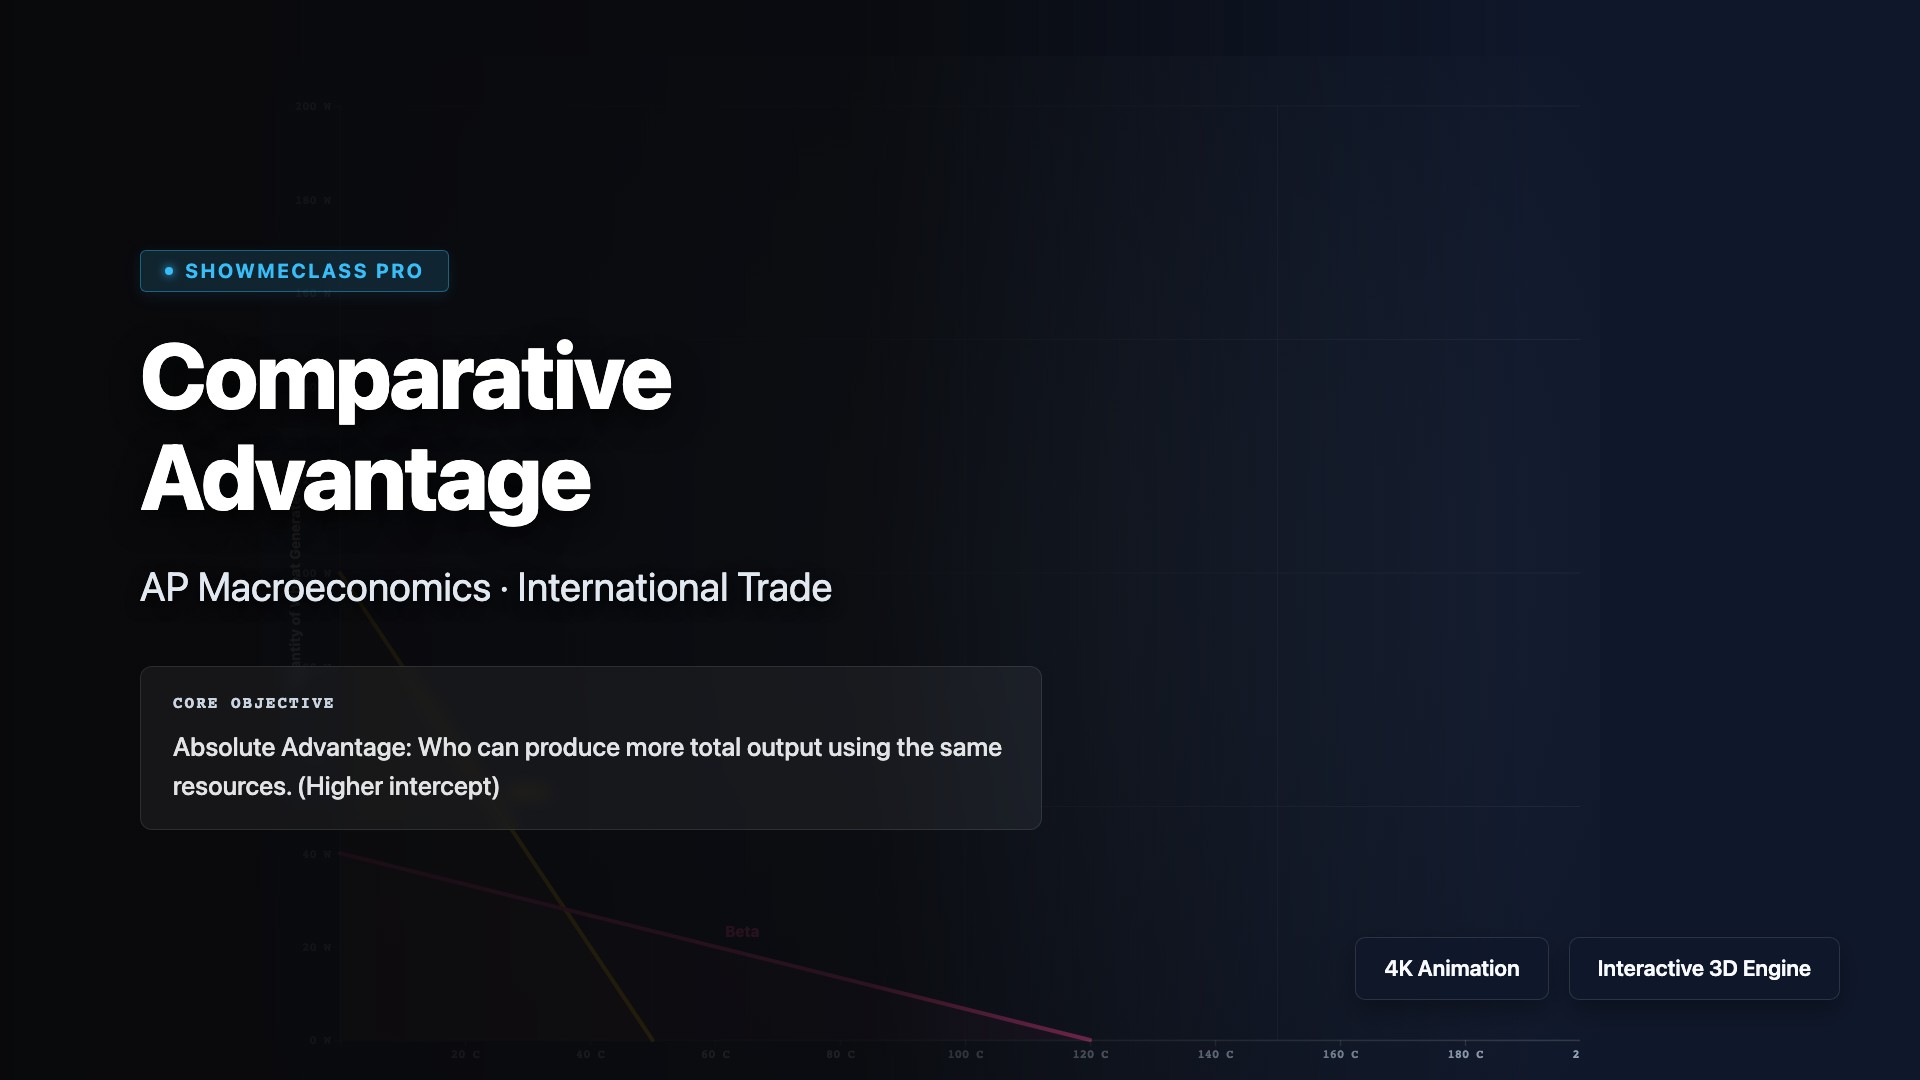
Comparative Advantage
Calculate Absolute and Comparative advantage dynamically. Adjust Production Possibility Frontiers for two countries to reveal who should specialize in which good based on the lowest opportunity cost.
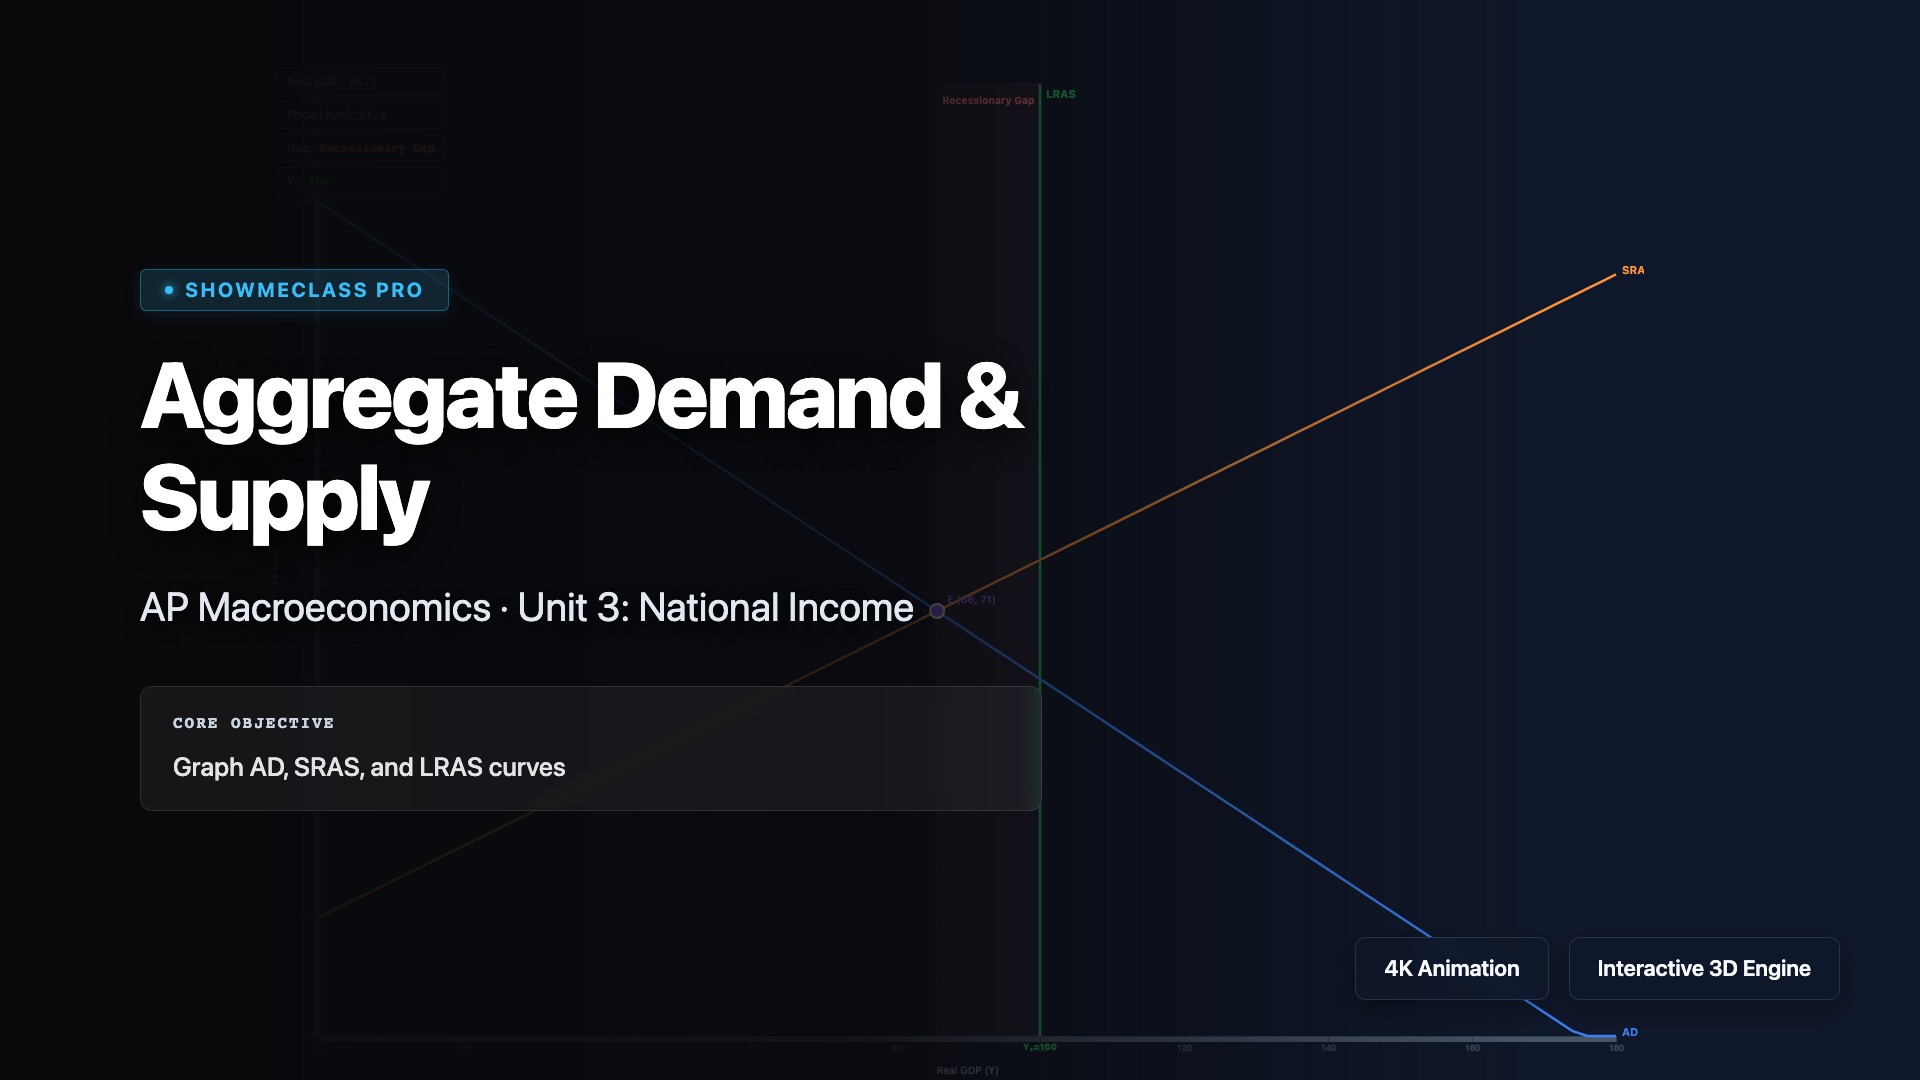
Aggregate Demand & Supply
Analyze the Aggregate Demand-Aggregate Supply (AD-AS) model that shows the relationship between overall price level and real GDP in an economy. Visualize how AD (consumption, investment, government spending, net exports) intersects with short-run and long-run AS to determine equilibrium output and price level. Understand how shifts in AD or AS cause inflation, recession, or economic growth, and how fiscal and monetary policies affect macroeconomic equilibrium.
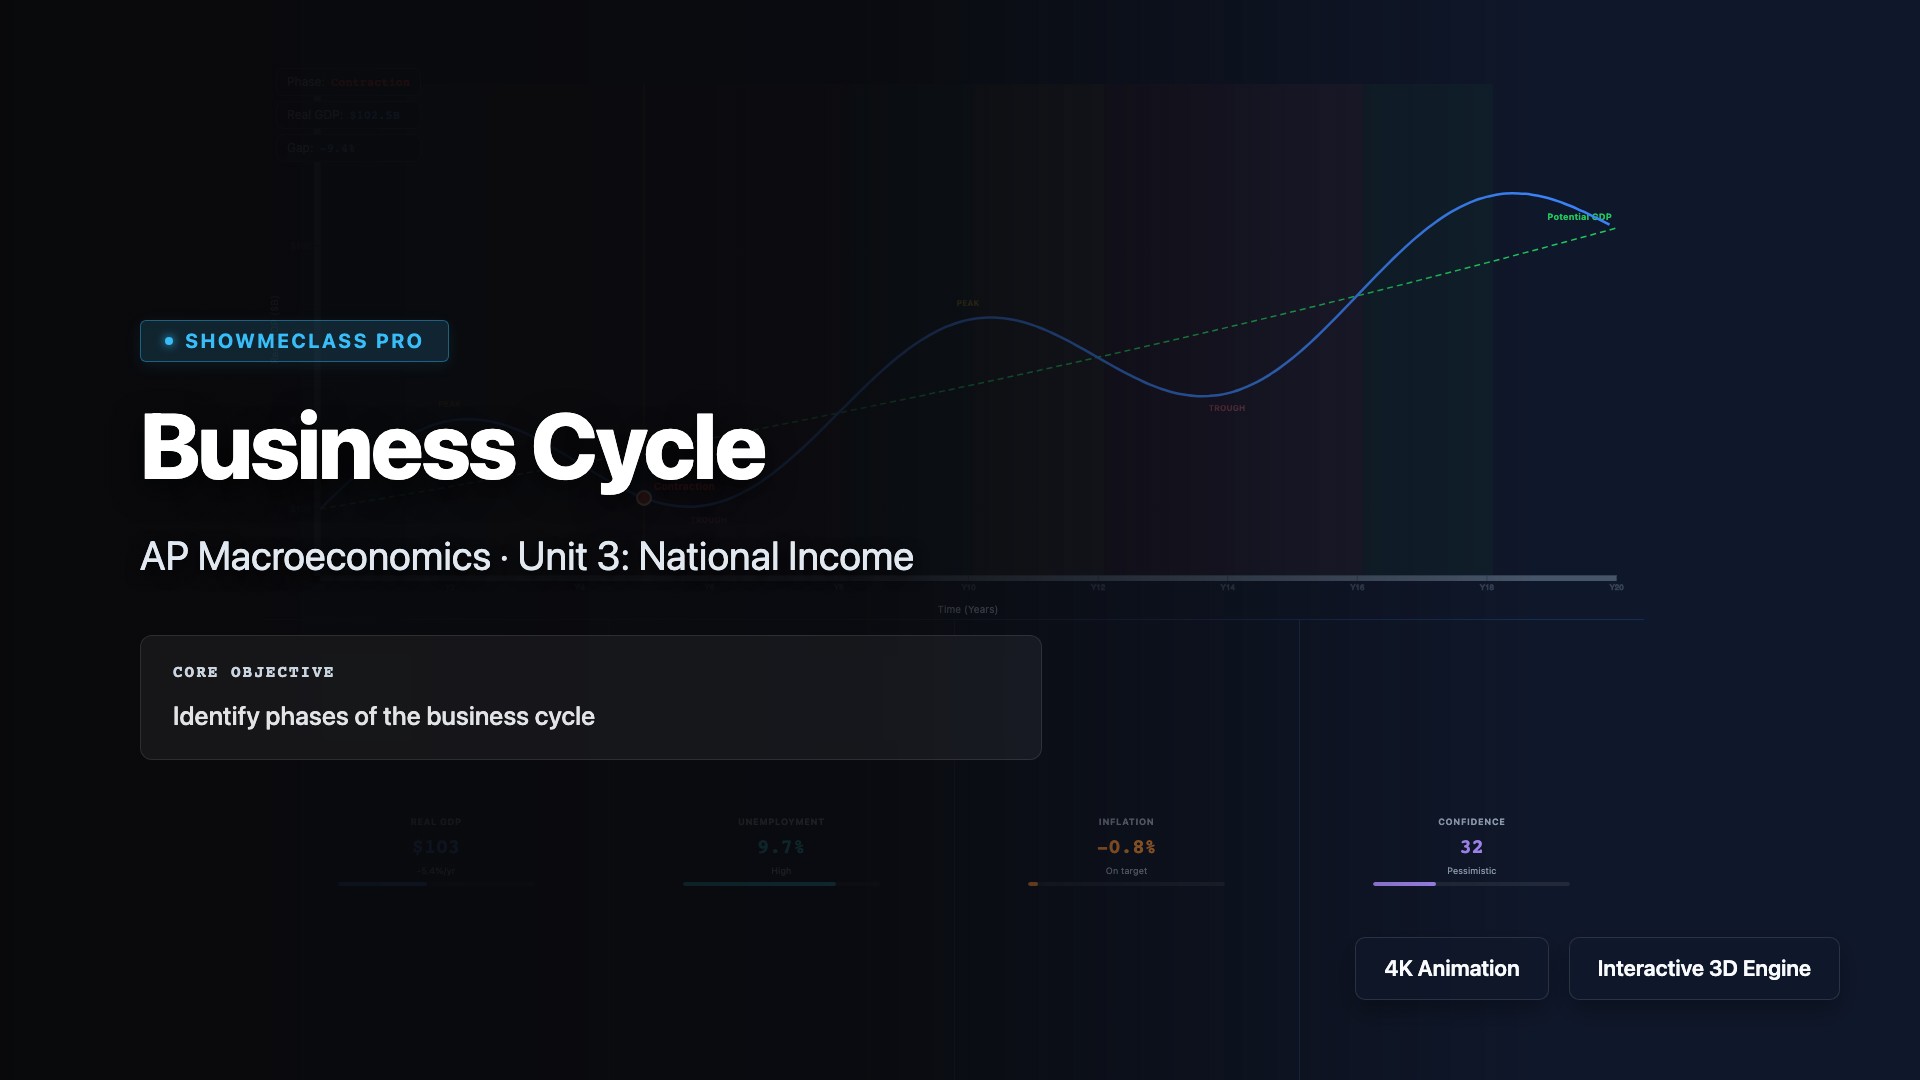
Business Cycle
Visualize the business cycle showing fluctuations in real GDP over time through four phases: expansion (rising GDP, employment, and income), peak (maximum output), contraction/recession (declining GDP for two consecutive quarters), and trough (lowest point). Understand leading indicators (stock market, consumer confidence), coincident indicators (GDP, employment), and lagging indicators (unemployment rate, inflation) used to track economic conditions and predict turning points.
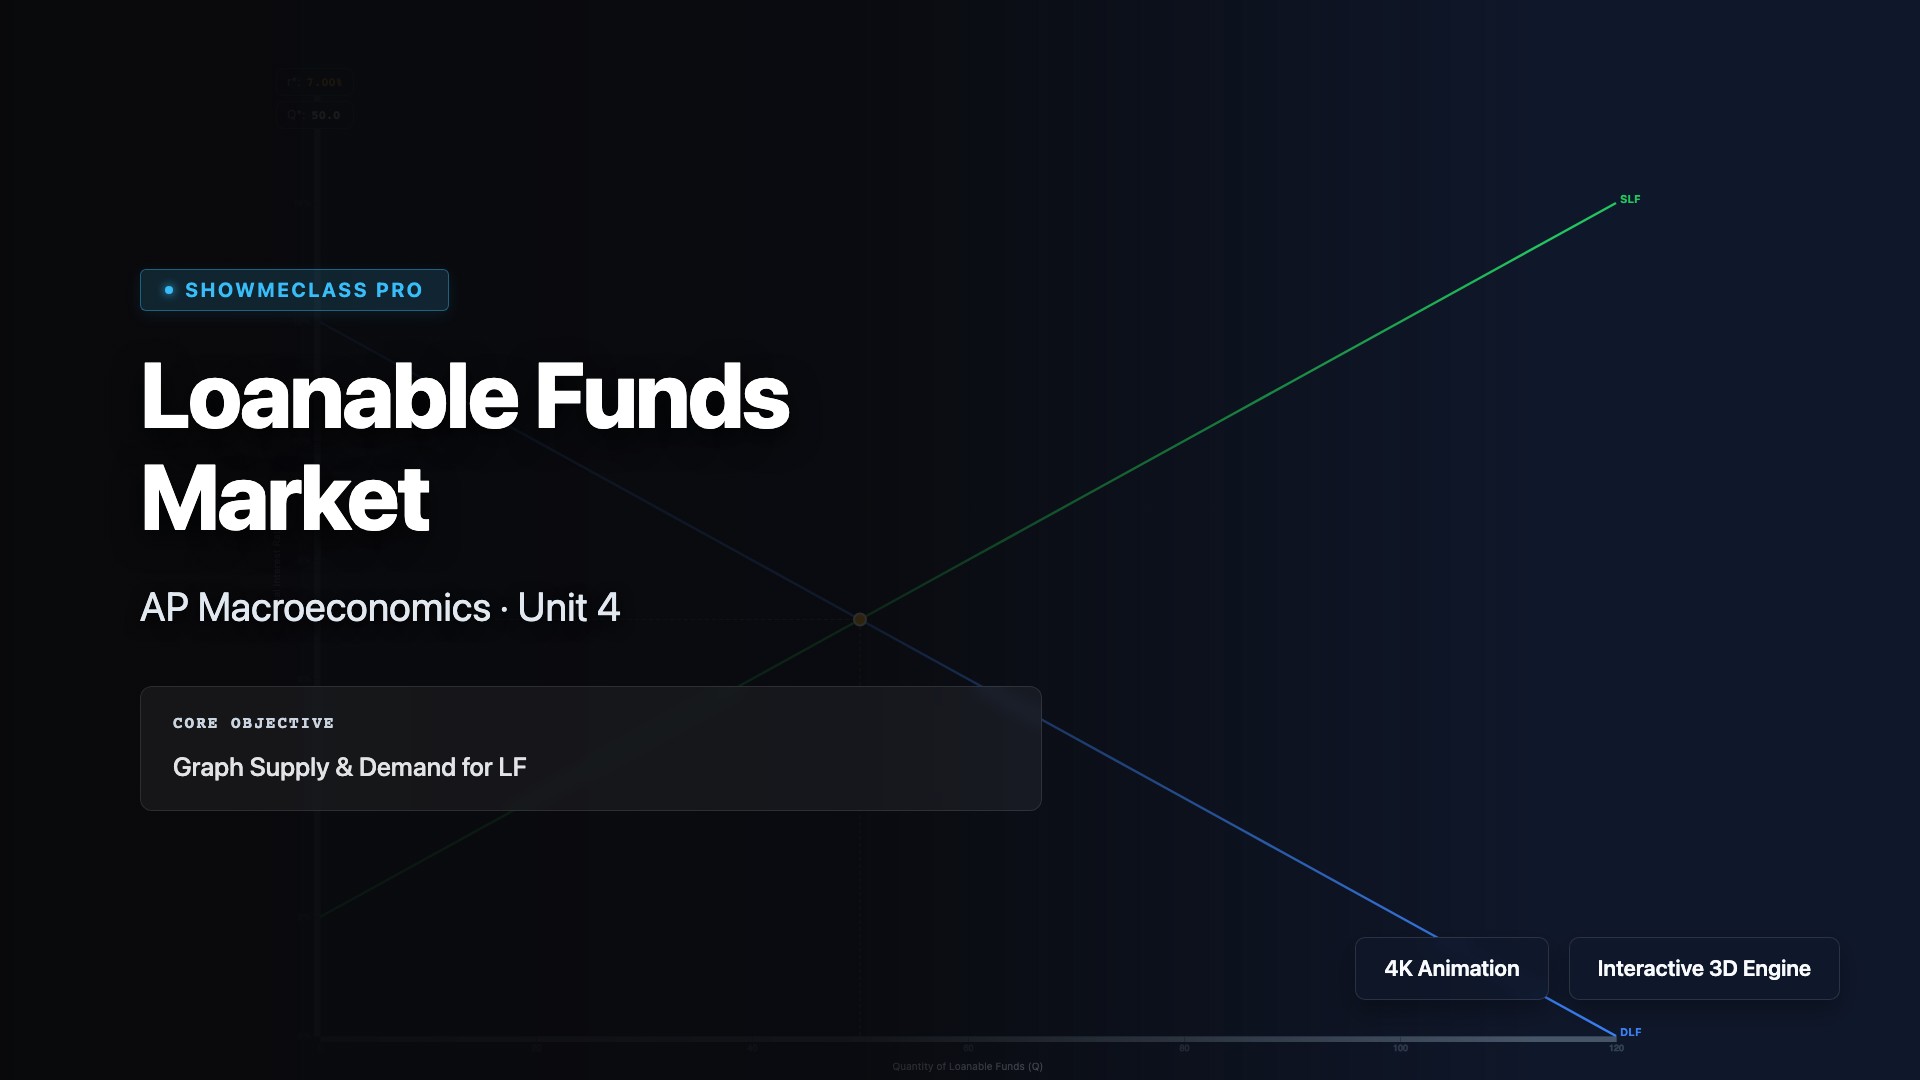
Loanable Funds Market & Crowding Out
Visualize the Market for Loanable Funds. Explore how government deficit borrowing causes the Crowding Out effect by driving up the real interest rate, and how foreign capital inflows shift the supply of loanable funds.
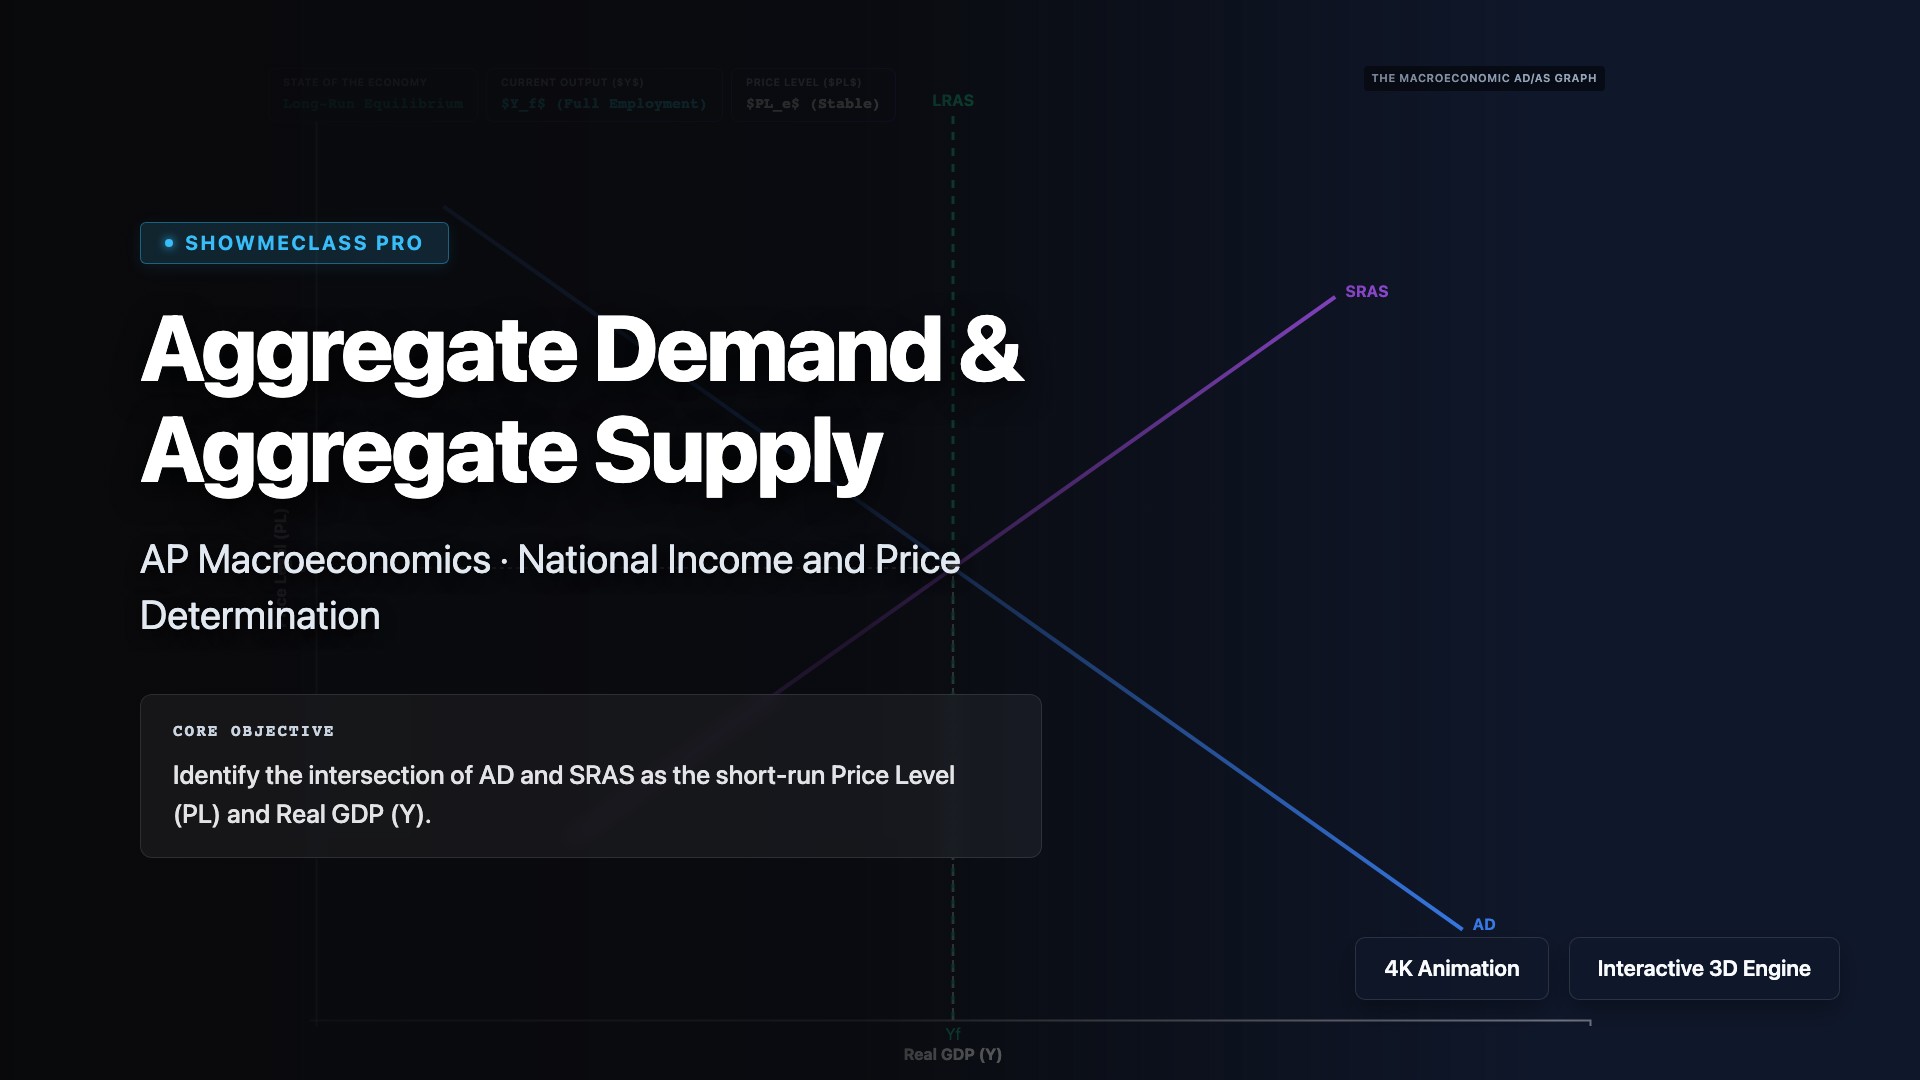
Aggregate Demand & Supply Model
Shift the AD and SRAS curves to visually create Recessionary Gaps, Inflationary Gaps, and Stagflation relative to the LRAS full employment boundary.
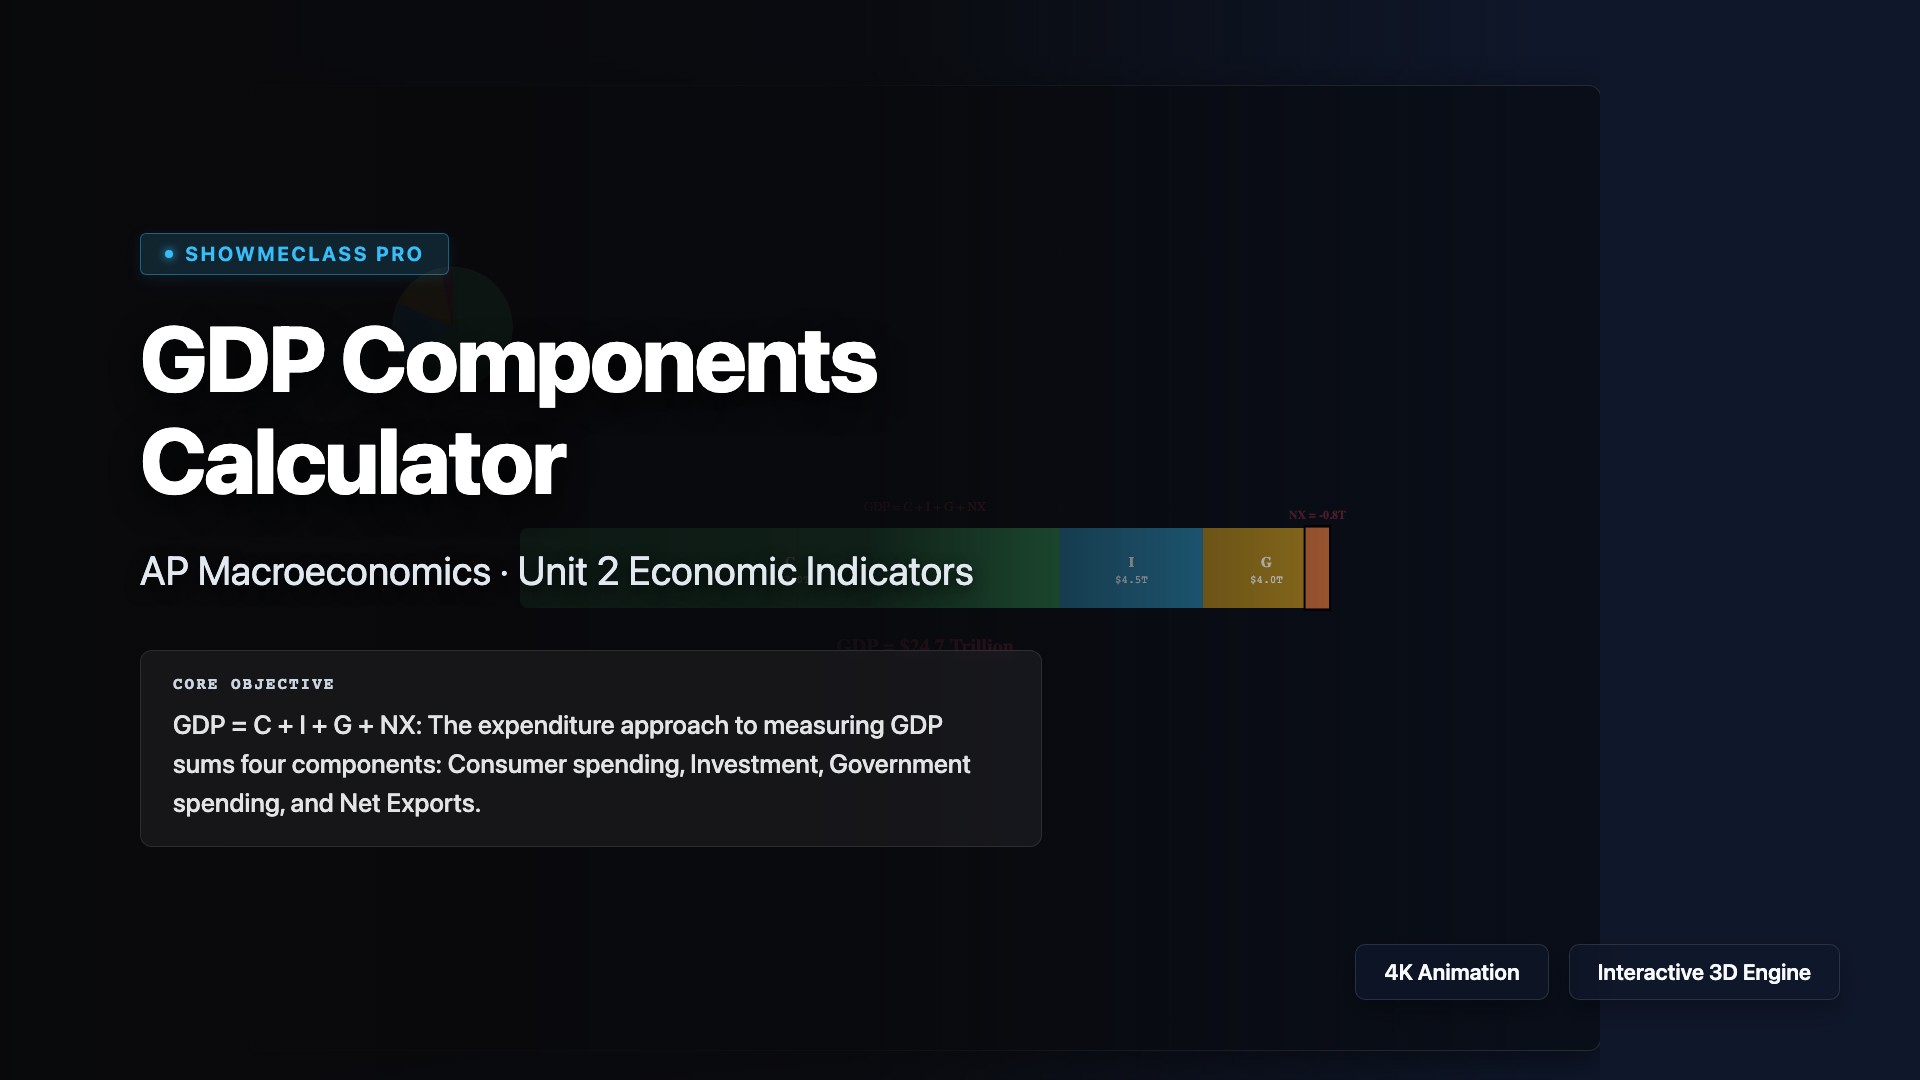
GDP Components Calculator (C+I+G+NX)
Interactive GDP expenditure approach calculator. Adjust Consumption, Investment, Government spending, and Net Exports with real-time stacked bar and pie chart visualization showing US-benchmarked component share percentages.
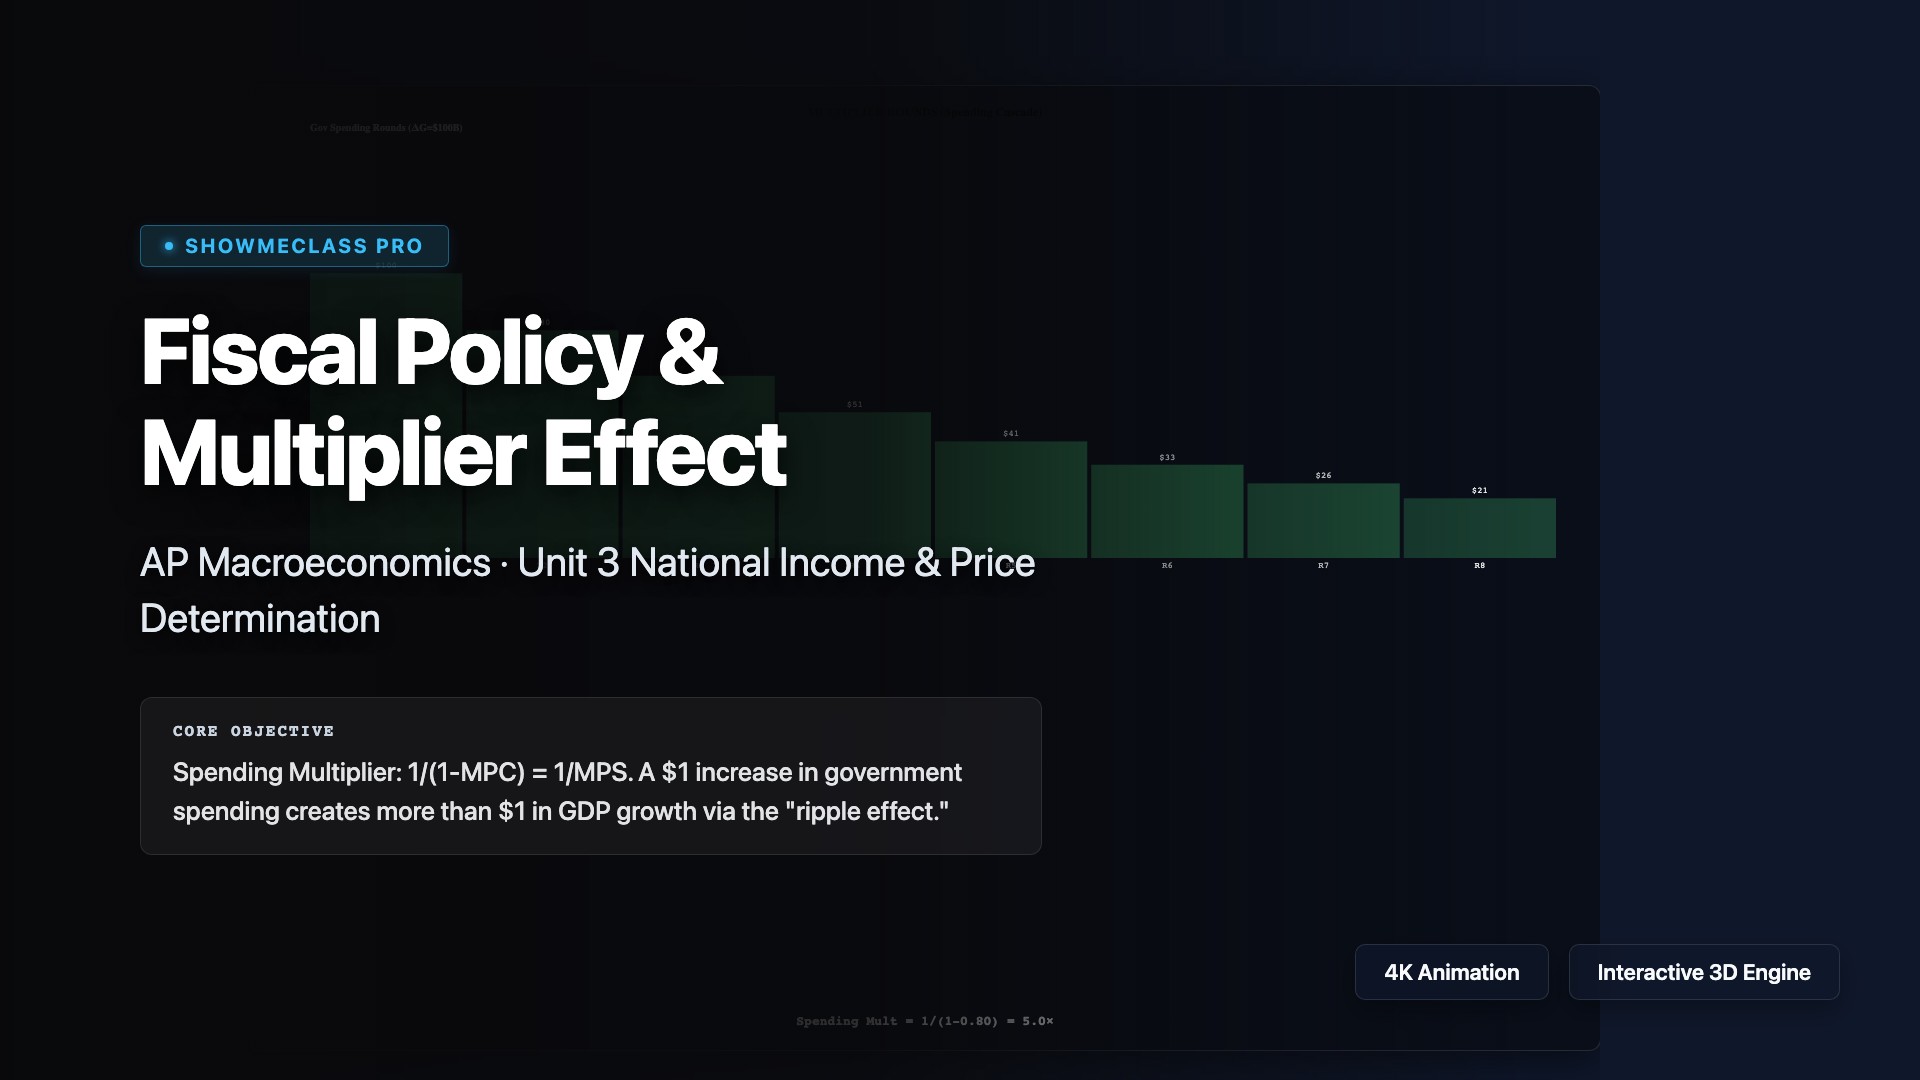
Fiscal Policy & Multiplier Effect
Spending and tax multiplier calculator with cascading round-by-round visualization. Compares government spending multiplier (1/MPS) vs tax multiplier (-MPC/MPS) to demonstrate why $1 of spending has greater GDP impact than $1 of tax cuts.

Monetary Policy & The Federal Reserve
Dual-panel Fed monetary policy transmission mechanism. Left panel shows Money Market (MS/MD) equilibrium; right panel shows resulting AD-AS model shift. Toggle expansionary vs contractionary to trace the full causal chain from bond purchases to GDP change.
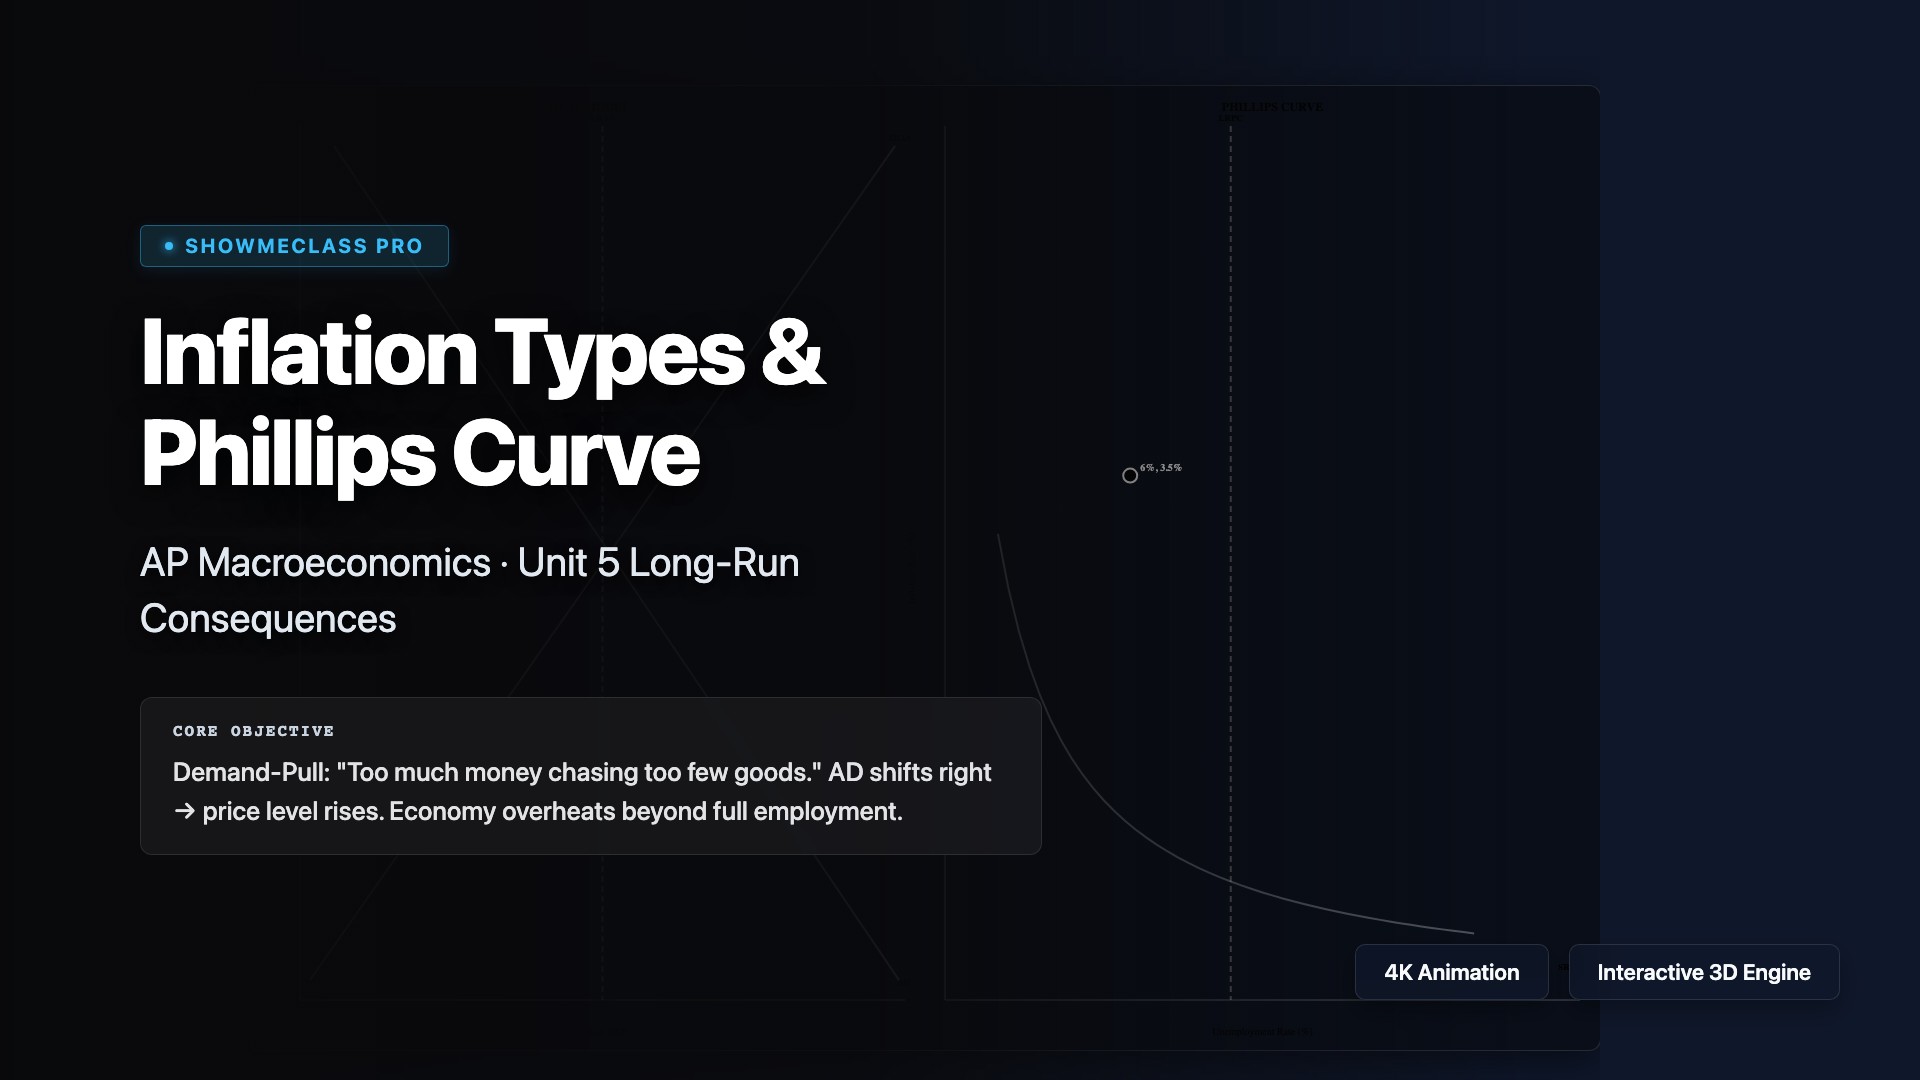
Inflation Types & Phillips Curve
Dual visualization showing AD-AS model alongside the Phillips Curve for demand-pull inflation (AD right), cost-push stagflation (SRAS left), and equilibrium scenarios. Demonstrates the short-run inflation-unemployment tradeoff.
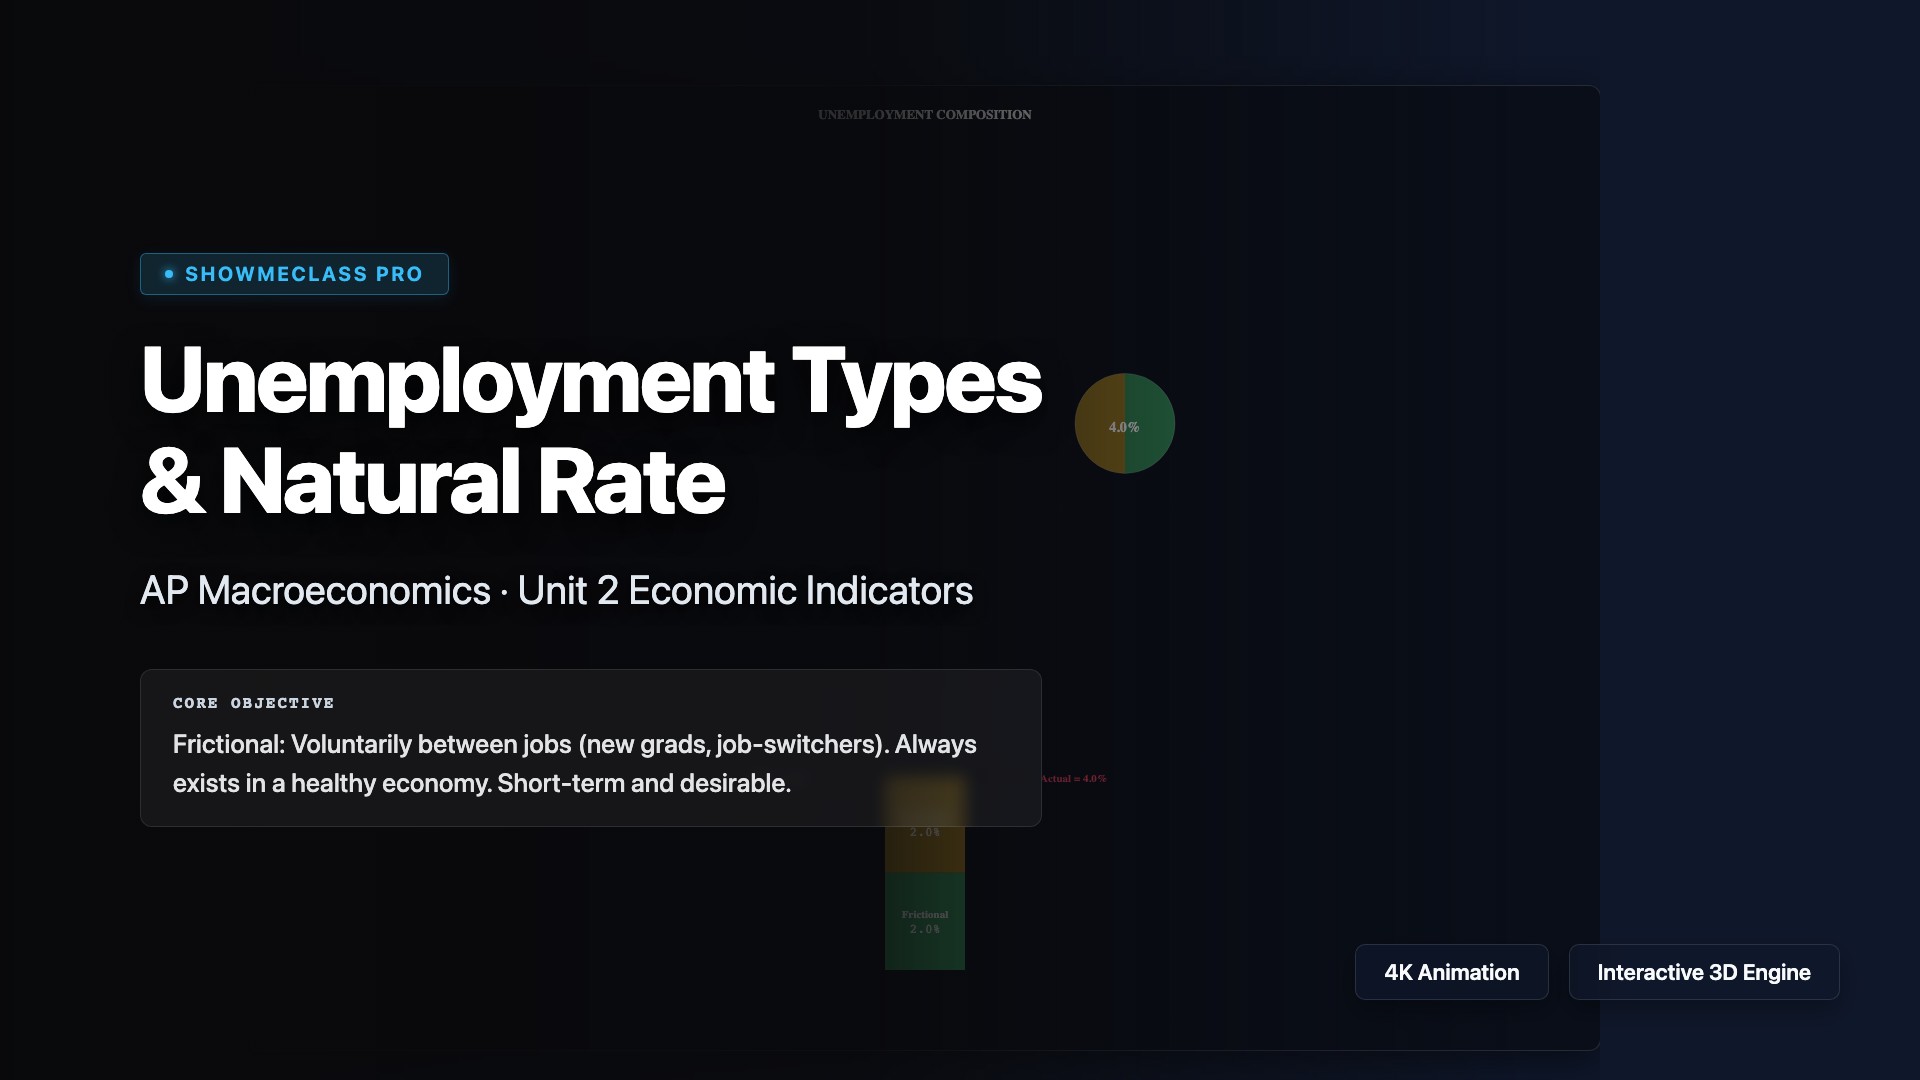
Unemployment Types & Natural Rate
Stacked bar and pie chart decomposition of 3 unemployment types (frictional, structural, cyclical). Adjustable components reveal Natural Rate of Unemployment (NRU = frictional + structural), GDP gap assessment, and economy status classification.