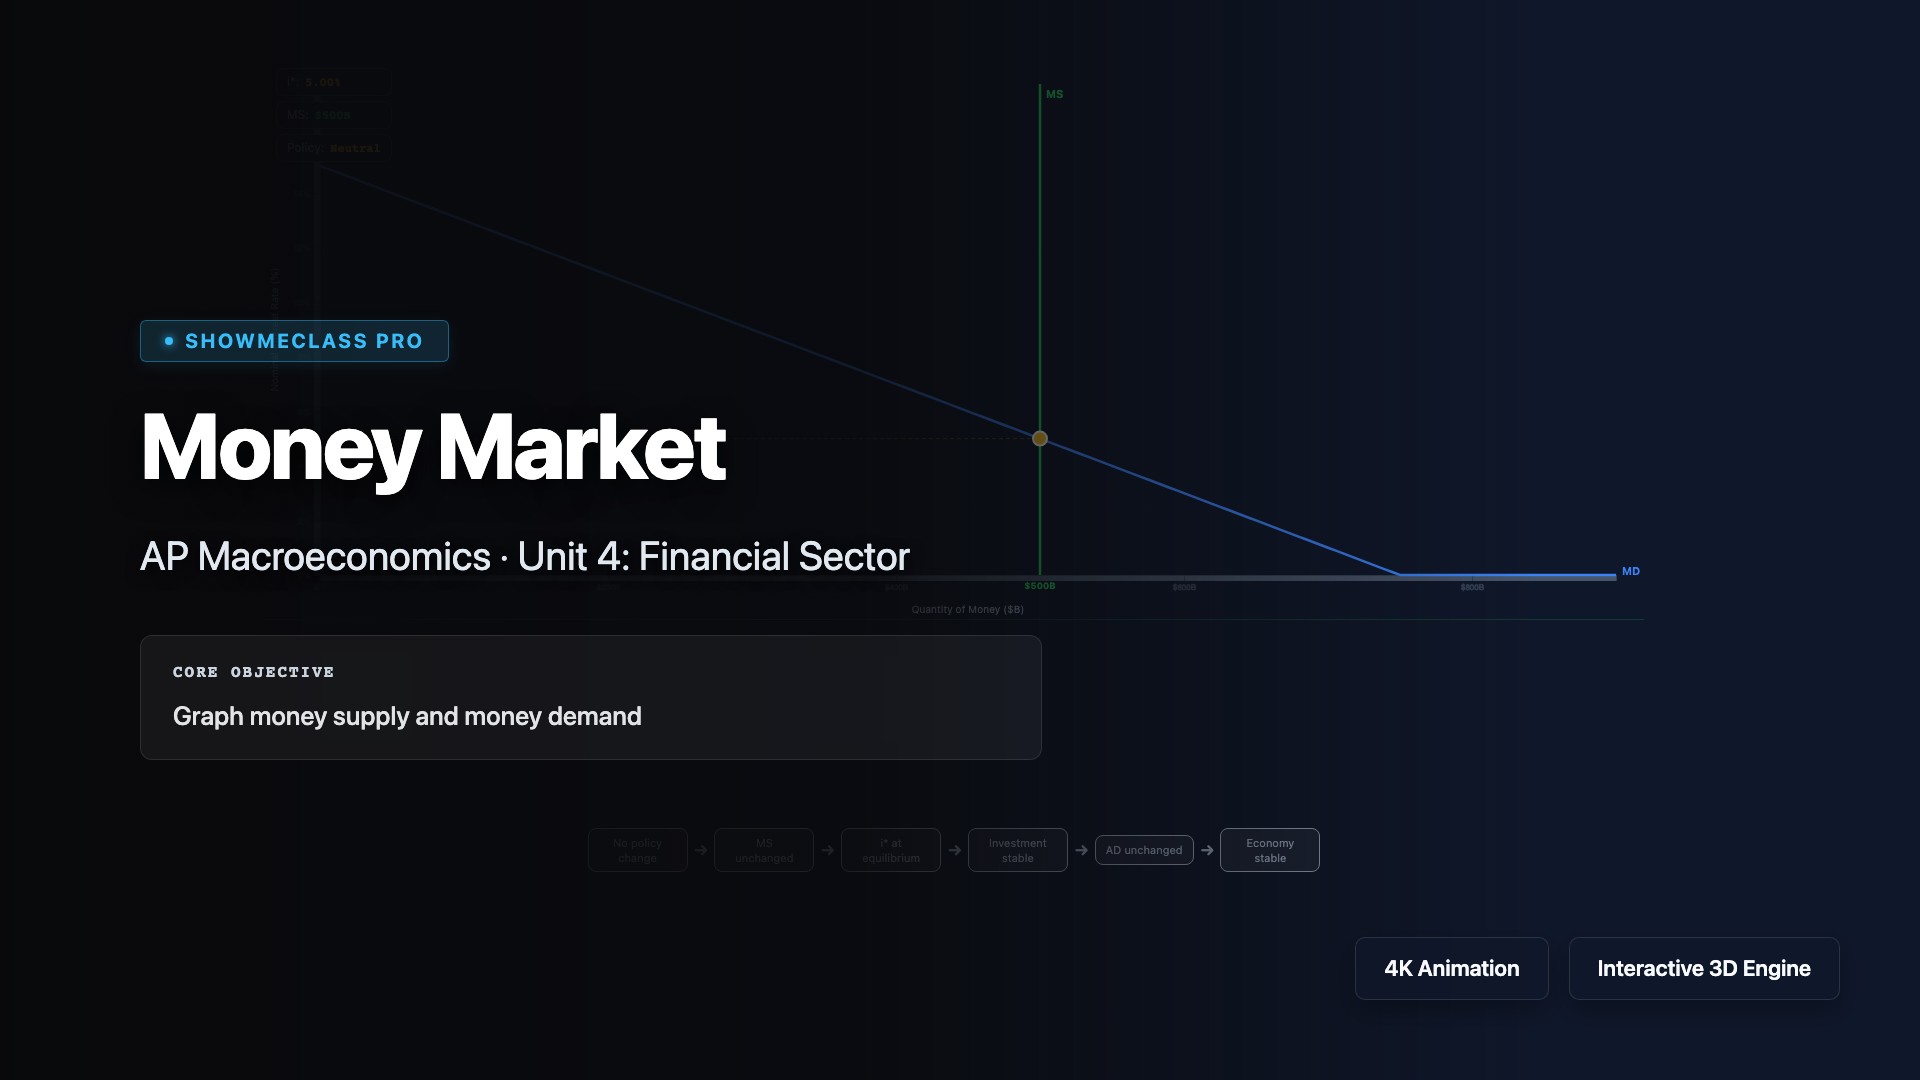
Money Market
Explore the money market where the supply and demand for money determine the nominal interest rate. Visualize how the Federal Reserve controls money supply through open market operations, reserve requirements, and the discount rate. Understand the inverse relationship between bond prices and interest rates, how changes in money supply shift the vertical MS curve, and how the Fed uses monetary policy to influence economic activity, inflation, and employment.
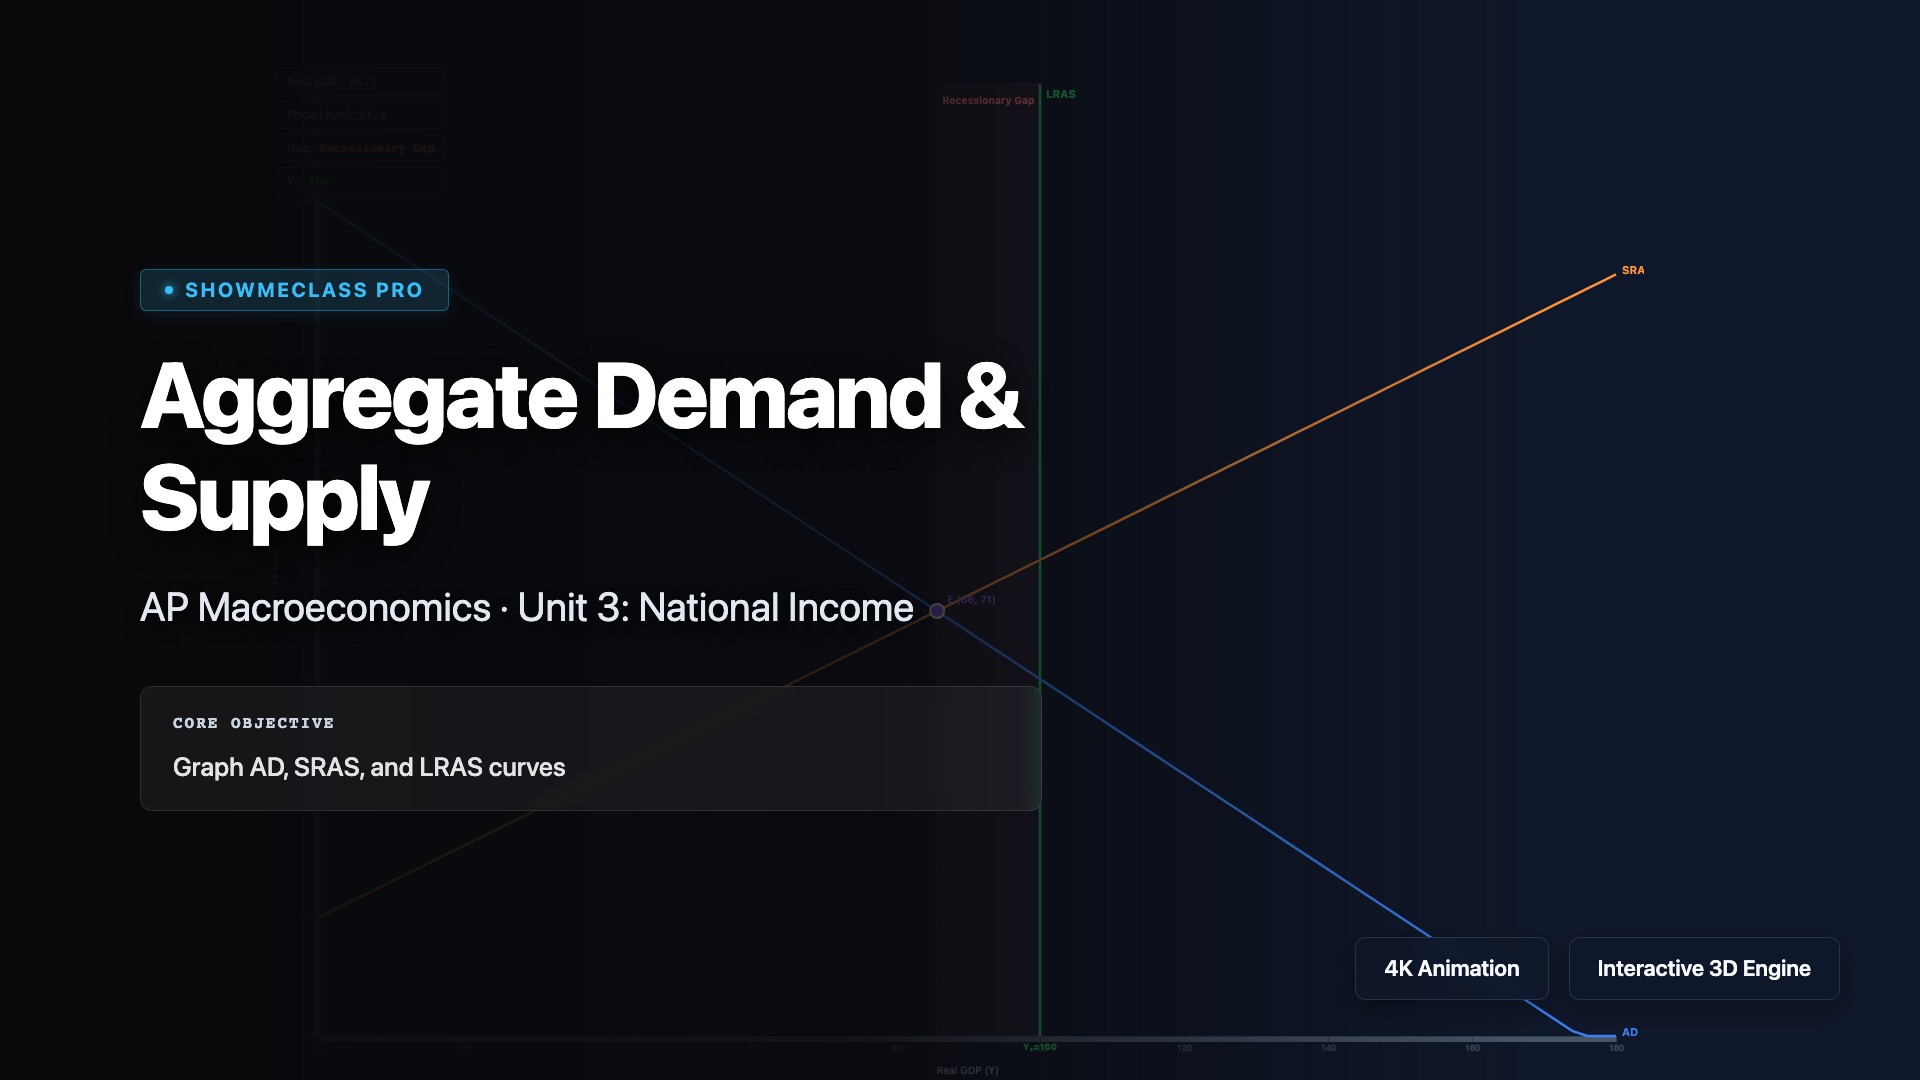
Aggregate Demand & Supply
Analyze the Aggregate Demand-Aggregate Supply (AD-AS) model that shows the relationship between overall price level and real GDP in an economy. Visualize how AD (consumption, investment, government spending, net exports) intersects with short-run and long-run AS to determine equilibrium output and price level. Understand how shifts in AD or AS cause inflation, recession, or economic growth, and how fiscal and monetary policies affect macroeconomic equilibrium.
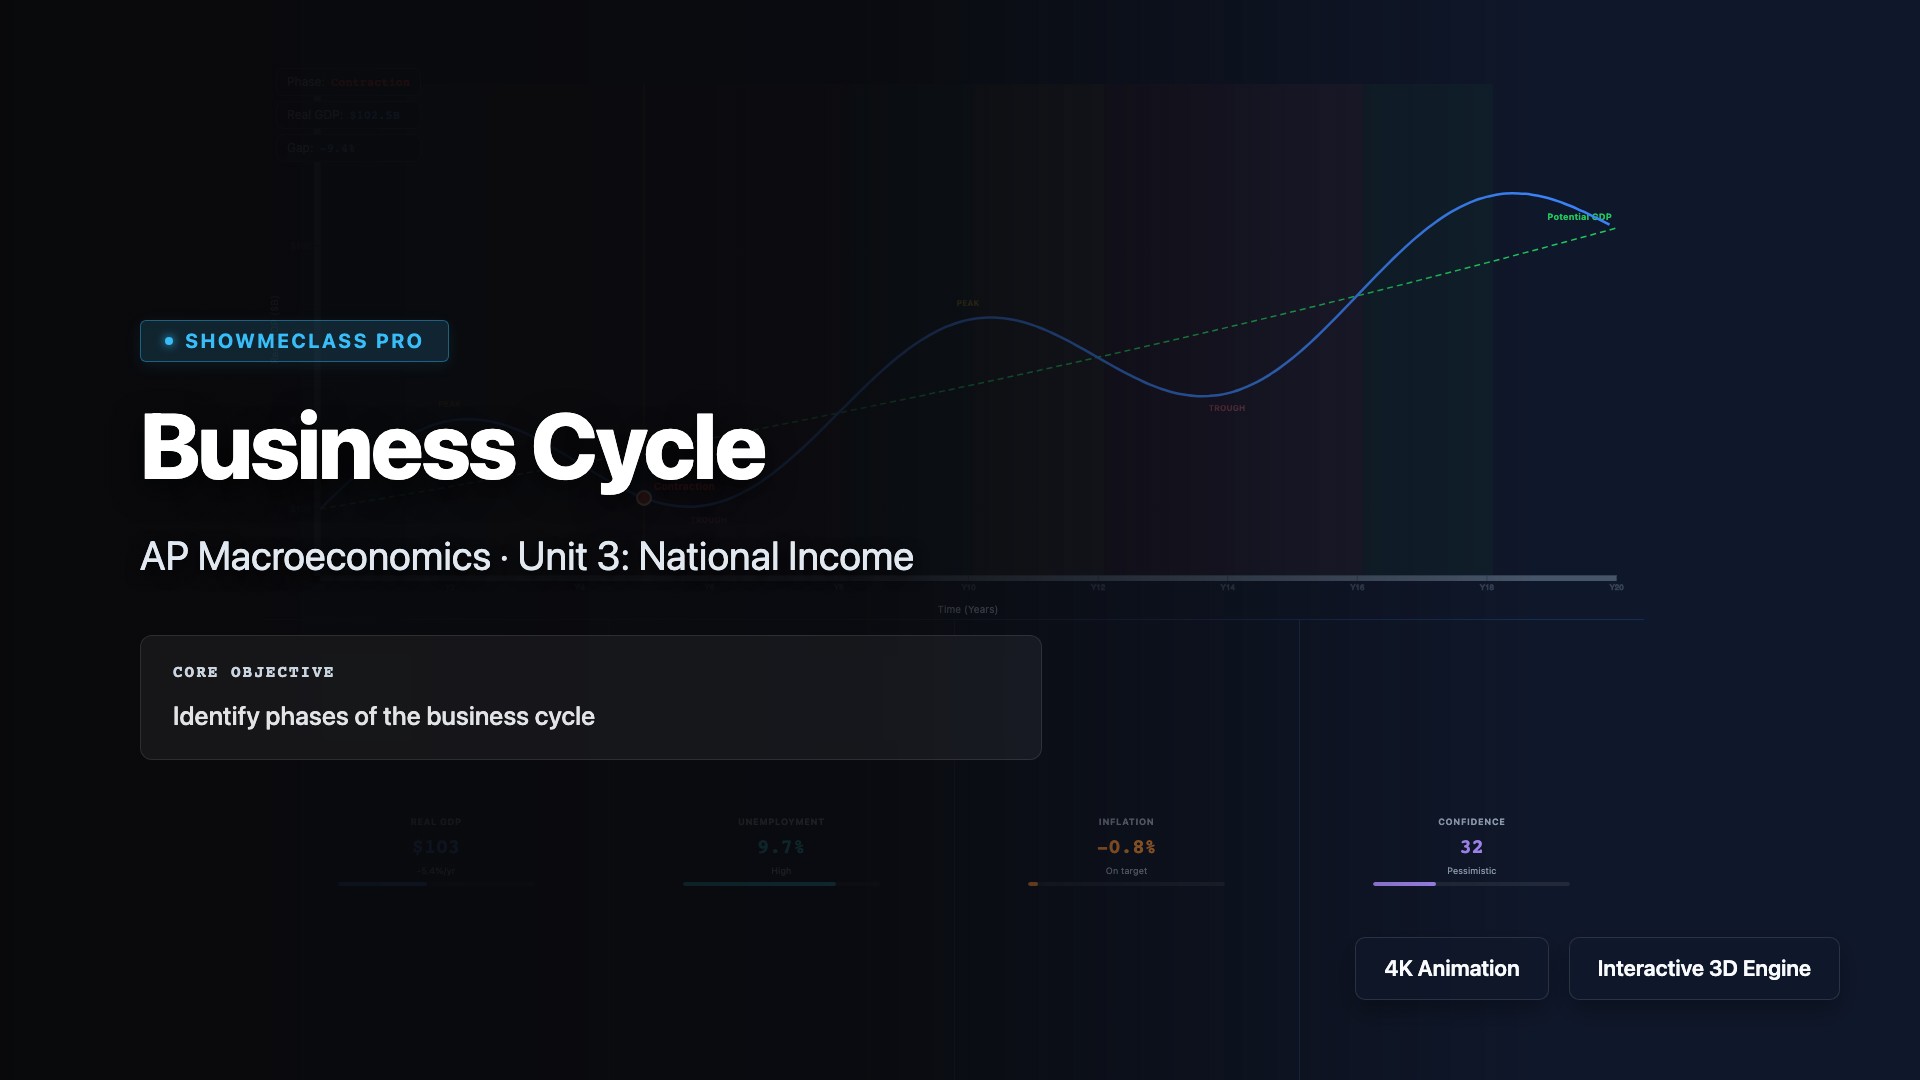
Business Cycle
Visualize the business cycle showing fluctuations in real GDP over time through four phases: expansion (rising GDP, employment, and income), peak (maximum output), contraction/recession (declining GDP for two consecutive quarters), and trough (lowest point). Understand leading indicators (stock market, consumer confidence), coincident indicators (GDP, employment), and lagging indicators (unemployment rate, inflation) used to track economic conditions and predict turning points.