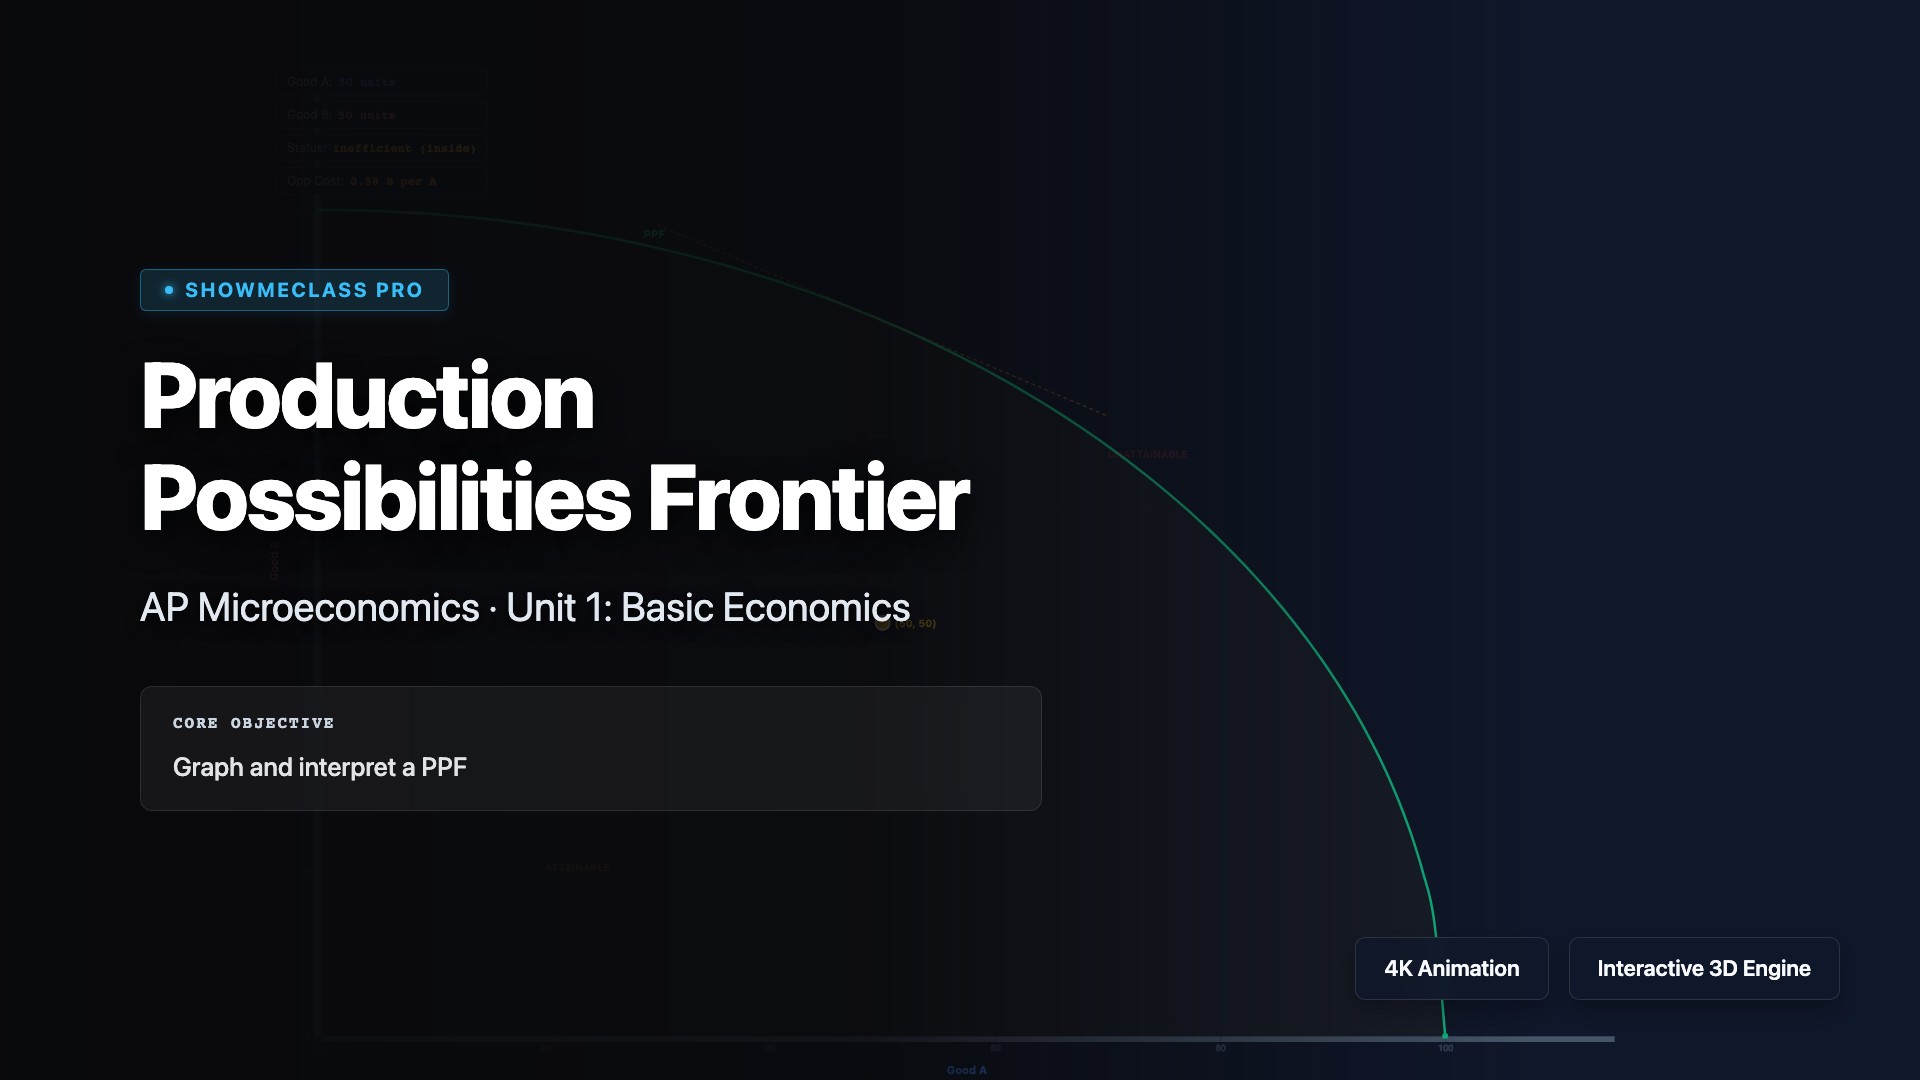
Production Possibilities Frontier
Explore the Production Possibilities Frontier (PPF) curve showing the maximum combinations of two goods an economy can produce with limited resources. Understand opportunity cost (the slope of the PPF), efficiency (points on the curve), inefficiency (points inside), and impossibility (points outside). Visualize how economic growth shifts the PPF outward, and how the law of increasing opportunity costs creates the bowed-out shape as resources are reallocated.
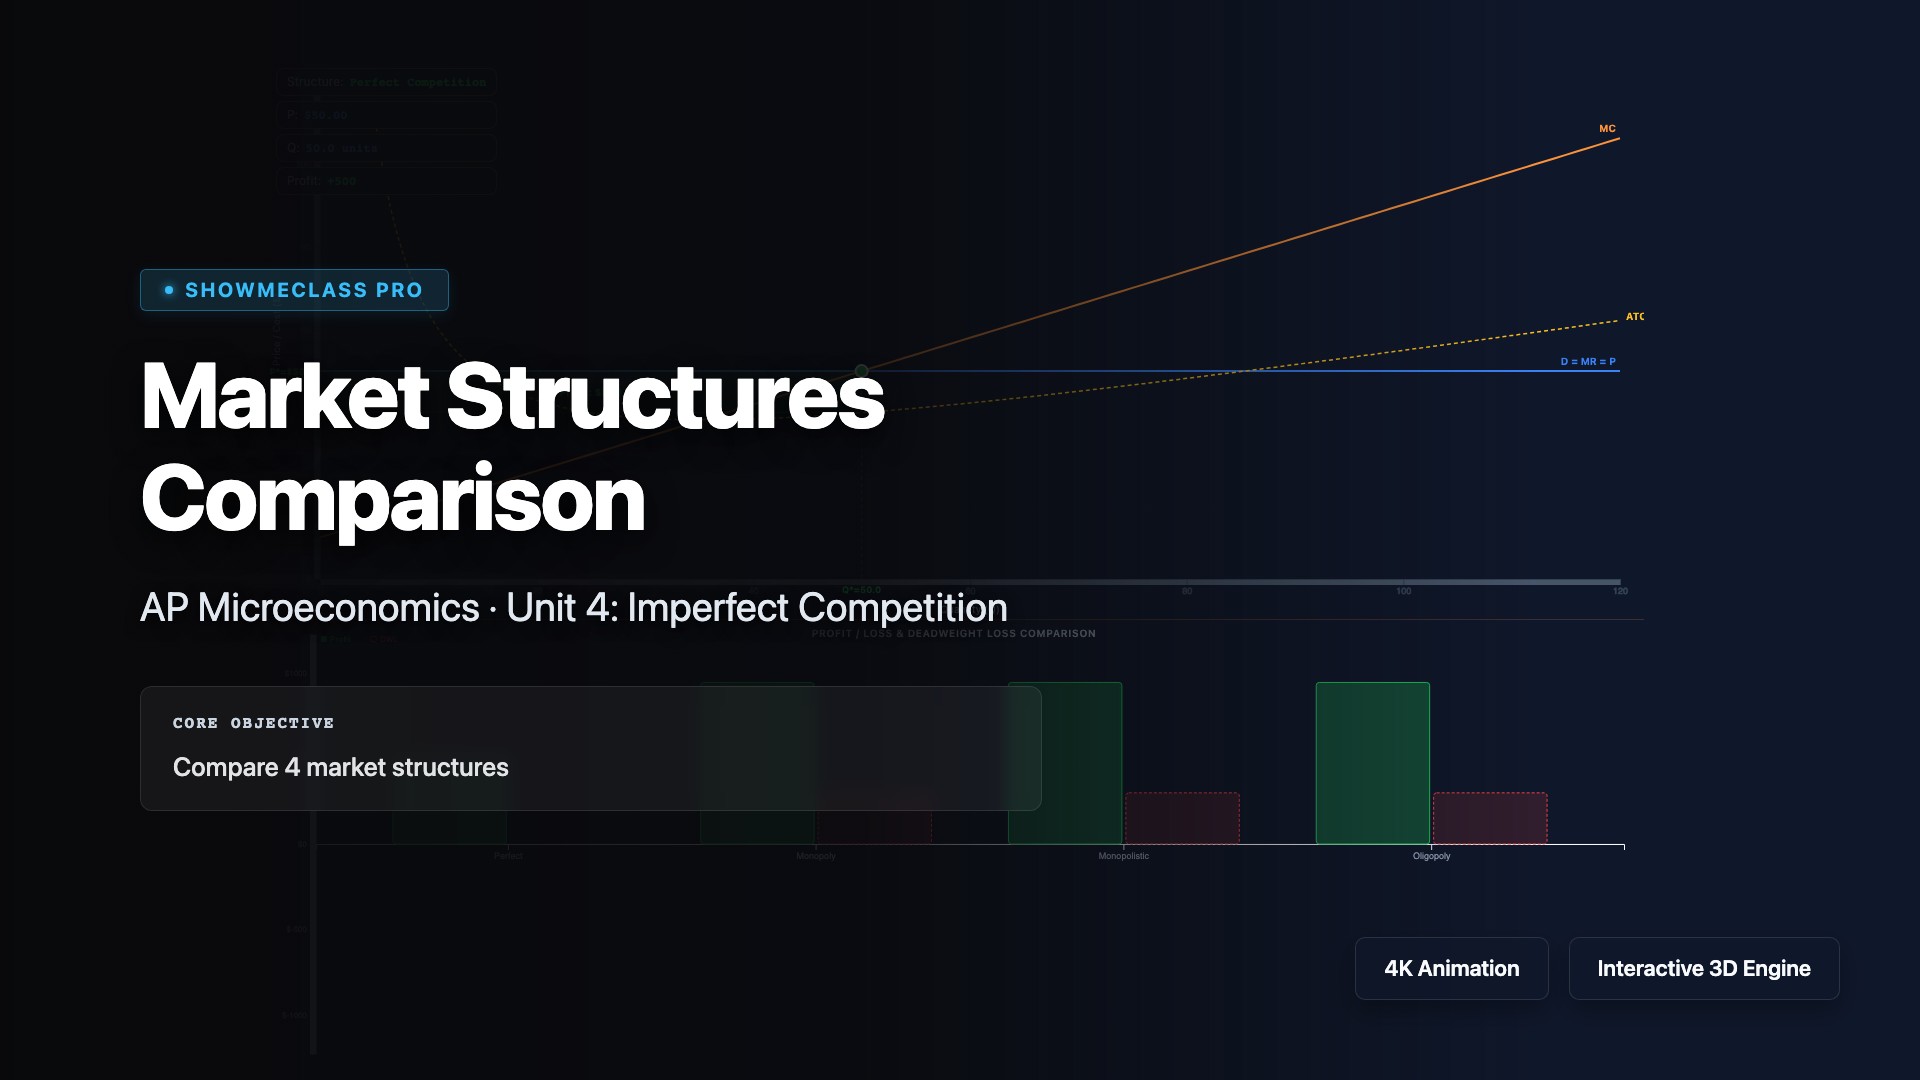
Market Structures Comparison
Compare the four market structures: perfect competition (many firms, identical products, price takers), monopolistic competition (many firms, differentiated products, some price control), oligopoly (few firms, interdependent decisions, strategic behavior), and monopoly (single firm, unique product, price maker). Understand how each structure determines pricing using MR=MC, barriers to entry, long-run economic profit, and efficiency outcomes for consumers and society.
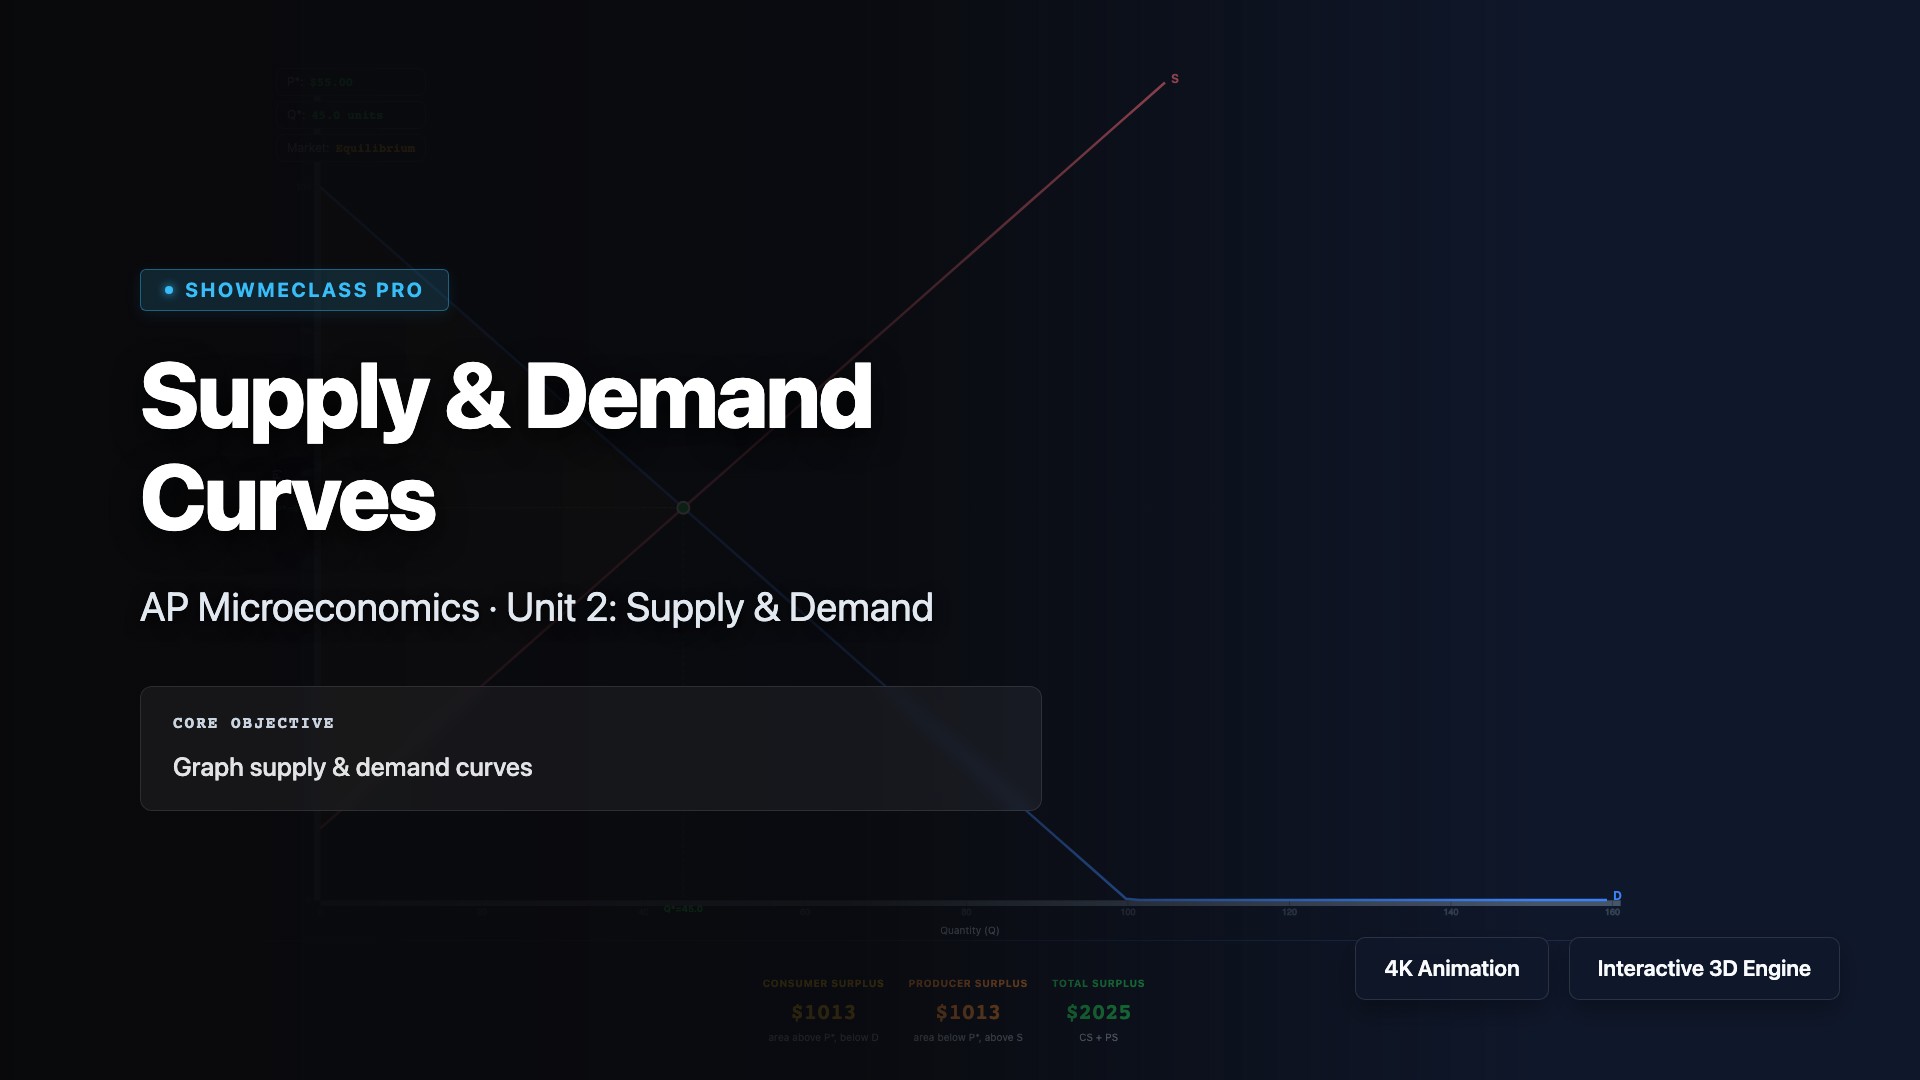
Supply & Demand Curves
Visualize supply and demand curves intersecting at market equilibrium where quantity supplied equals quantity demanded. Explore the law of demand (inverse price-quantity relationship) and law of supply (direct price-quantity relationship). Understand how shifts in demand (income, preferences, related goods) or supply (input costs, technology, expectations) create shortages or surpluses that drive price adjustments back to equilibrium. Practice analyzing how market forces allocate scarce resources efficiently.
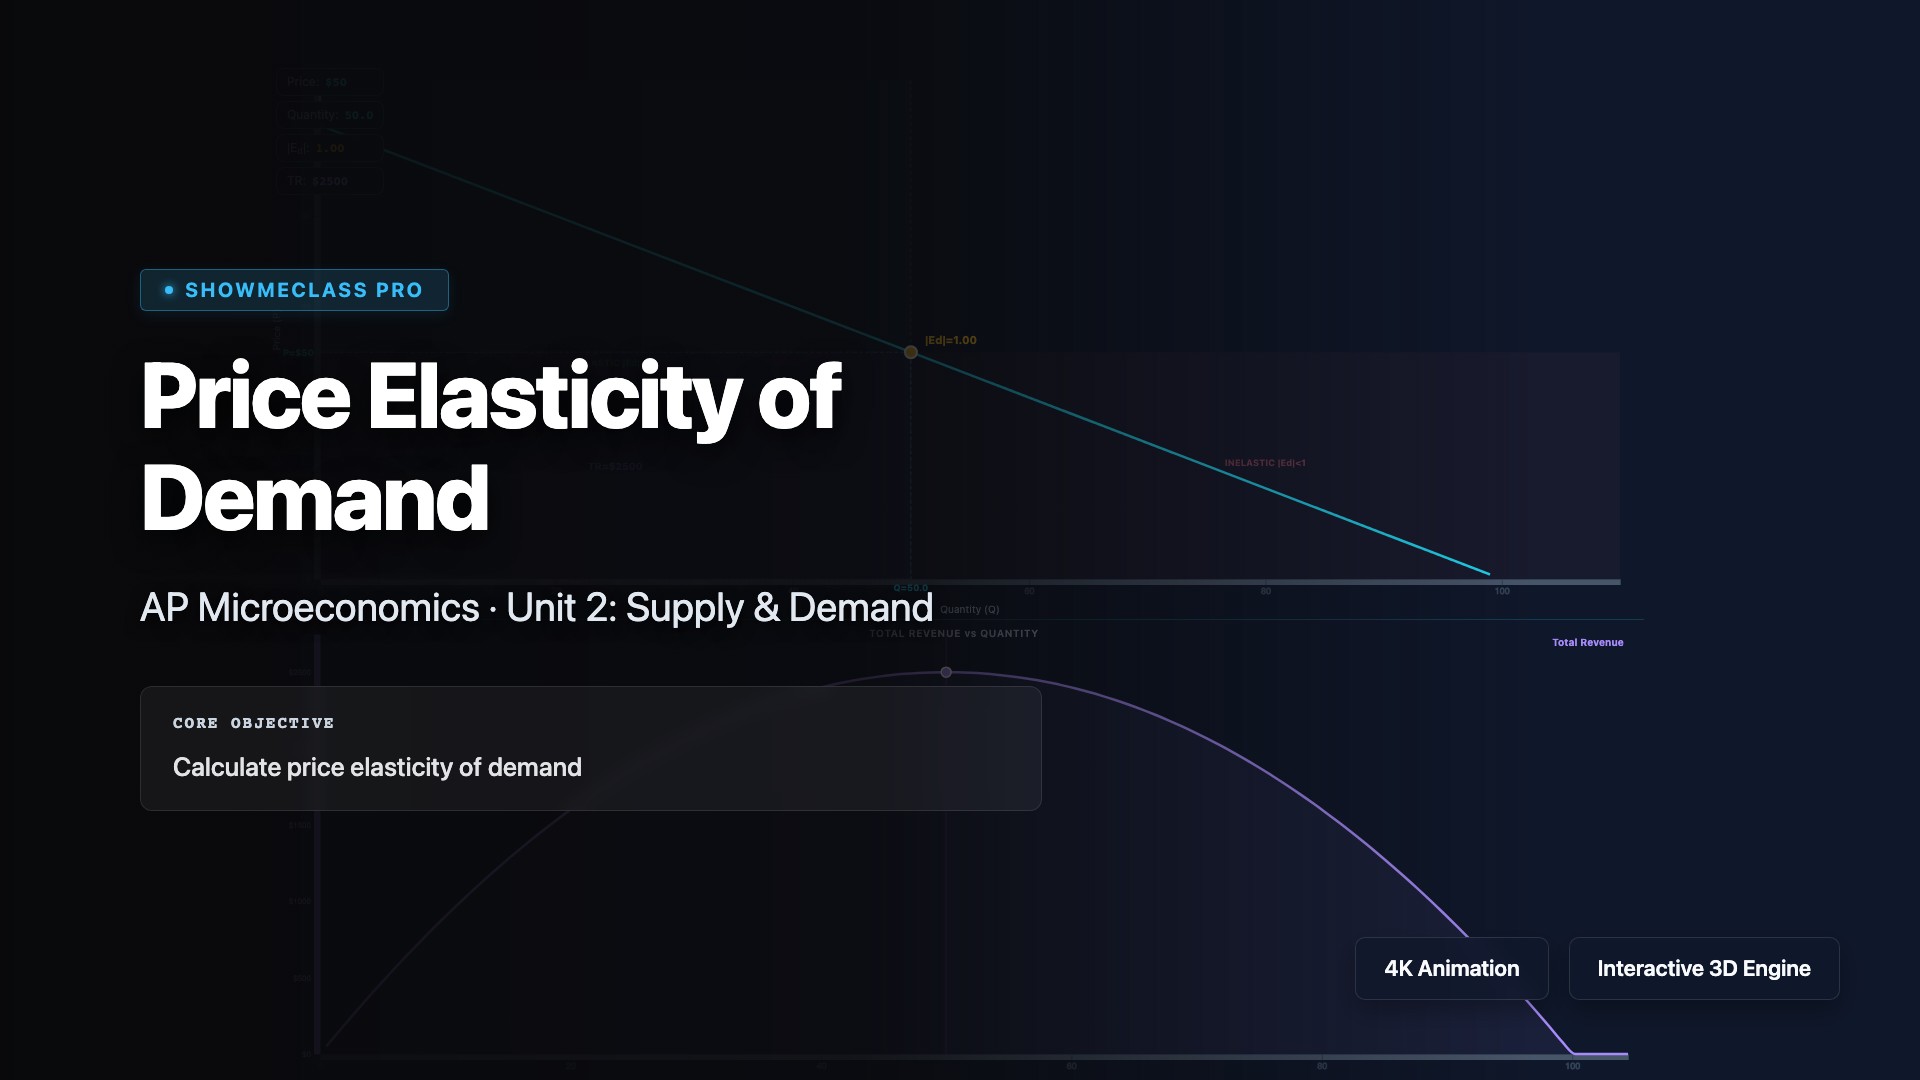
Price Elasticity of Demand
Analyze price elasticity of demand (PED) measuring how quantity demanded responds to price changes using the formula %ΔQd / %ΔP. Classify demand as elastic (|PED| > 1, price changes significantly affect quantity), inelastic (|PED| < 1, quantity relatively unresponsive), or unit elastic (|PED| = 1). Understand how elasticity affects total revenue: price increases raise revenue for inelastic goods but lower revenue for elastic goods. Explore determinants including substitutes, necessity, and time horizon.