Hypothesis Testing
Conduct hypothesis tests by calculating test statistics and p-values to evaluate null hypotheses. Visualize Type I and Type II errors, significance levels, and the decision-making process for rejecting or failing to reject the null hypothesis based on sample evidence.
THE LOGIC OF HYPOTHESIS TESTING
Hypothesis testing is a formal procedure for investigating ideas about the world using statistics. We start with two competing claims: the **Null Hypothesis** (), which represents 'no effect' or 'no change,' and the **Alternative Hypothesis** (), which represents what we are trying to find evidence for. In AP Statistics, we use a test statistic and a p-value to determine if the sample data is unusual enough to reject the null hypothesis in favor of the alternative.
TYPE I AND TYPE II ERRORS
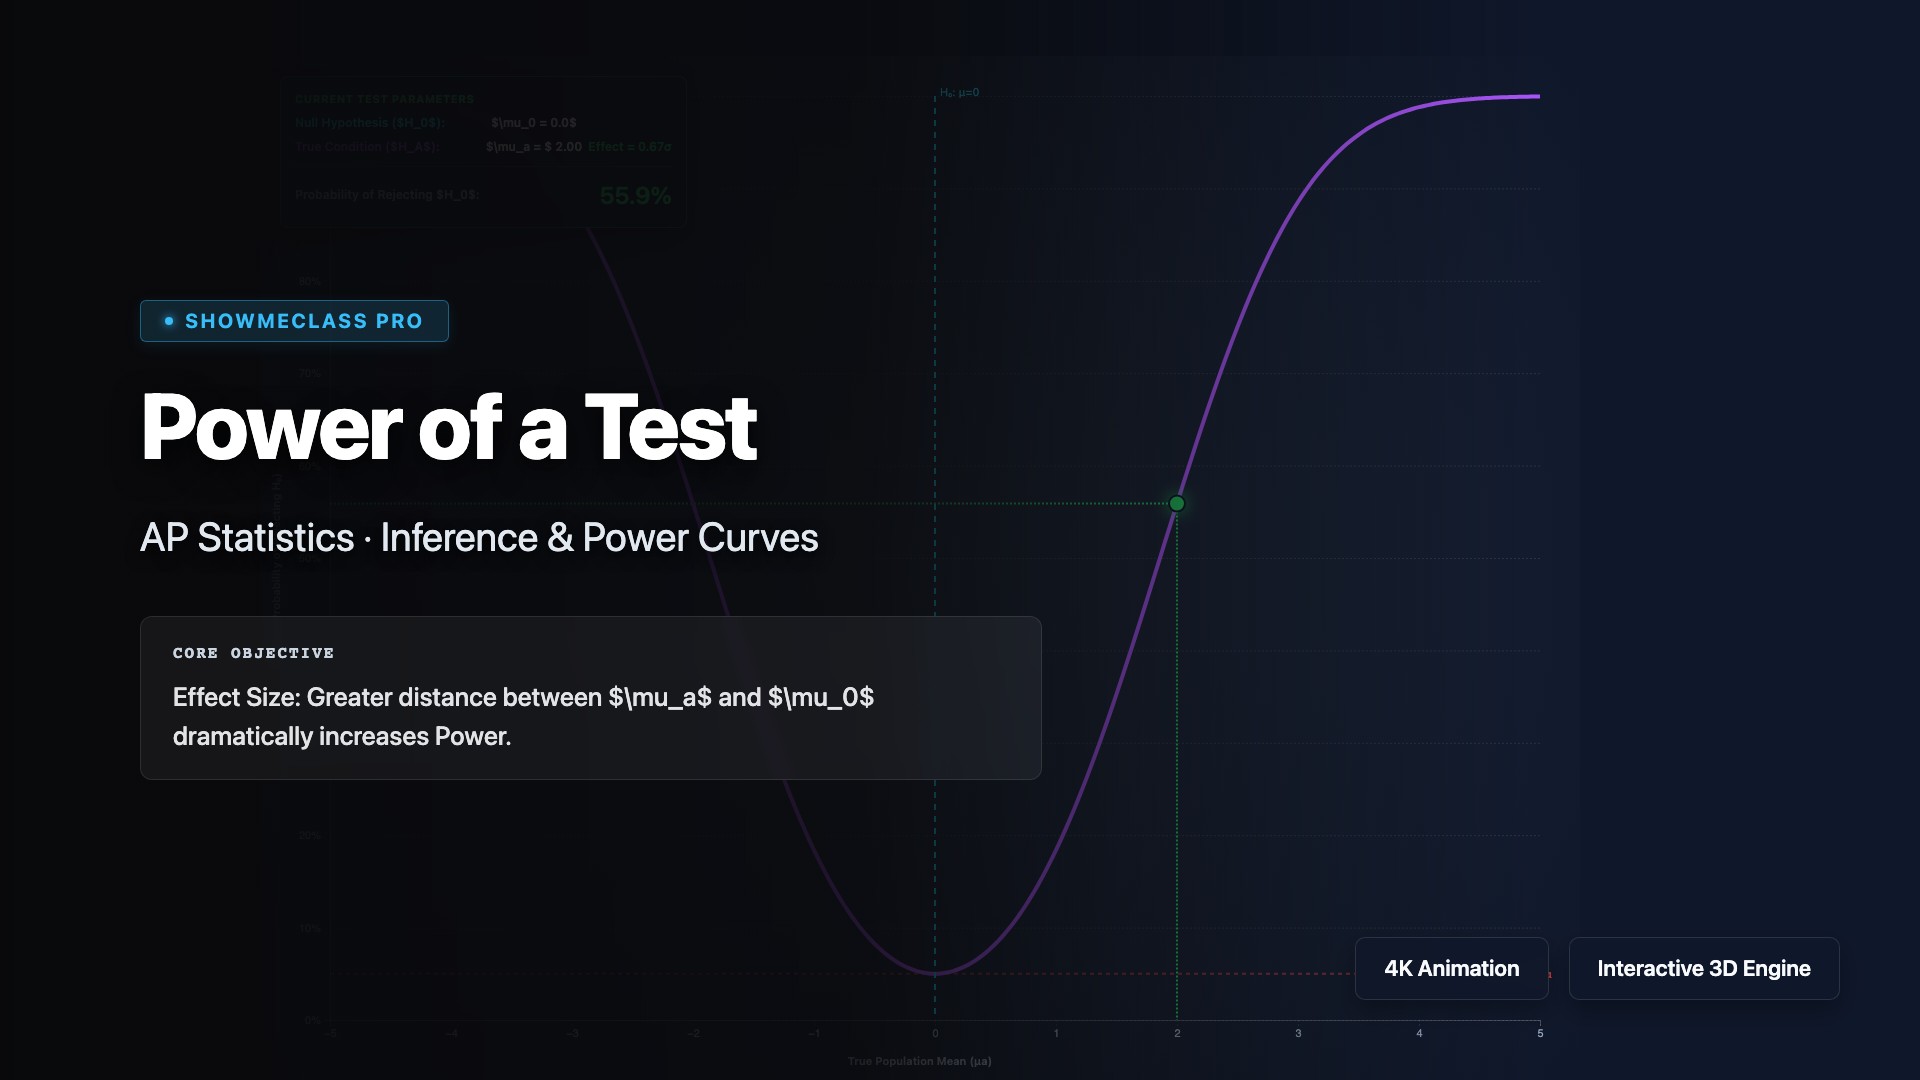
Because we are using samples to make inferences about populations, we can make mistakes. A **Type I Error** occurs if we reject when it is actually true ('false positive'). The probability of this is . A **Type II Error** occurs if we fail to reject when it is actually false ('false negative'). The probability of this is . The **Power** of a test () is the probability of correctly rejecting a false null hypothesis.
HOW TO USE THIS VISUALIZATION
1. **Define the Hypotheses**: Set and choose the direction of (Greater, Less, or Not Equal). 2. **Set the Alpha**: Adjust the significance level . Watch the 'Rejection Region' on the distribution move. 3. **Visualize Power**: Click 'Show Ha Distribution' to see the overlap between the two models. Observe how increasing the 'Effect Size' or 'Sample Size' pulls the distributions apart and increases the Power. 4. **Commit an Error**: Click 'Simulate' repeatedly. Find a case where the sample mean falls in the rejection region even though the null is true (Type I Error).
CORE FORMULAS
AP EXAM CONNECTION
Unit: Unit 6 & 7: Inference (Topic 6.4 / 7.4)
Learning Objective: UNC-5.A
COMMON MISCONCEPTIONS
- Thinking Type I and Type II errors are related to calculation mistakes (they are inherent to sampling).
- Assuming a "not significant" result means the effect is zero.
- Believing that decreasing also decreases (they are inversely related).
KEY TAKEAWAYS
- Hypothesis testing evaluates evidence against a null model.
- Type I error: Rejecting a true null (probability = ).
- Type II error: Failing to reject a false null (probability = ).
- Power increases with sample size and effect size.