AP STATISTICS
Chi-Square Goodness of Fit
DESCRIPTION
Calculate and visualize deviations from expected categorical frequencies. Generates the exact right-skewed Chi-Square distribution and P-Value tail.
AP EXAM RELEVANCE
- chi-square
- GOF
- categorical
- p-value
- AP Statistics
RELATED VISUALIZATIONS
AP STATISTICS
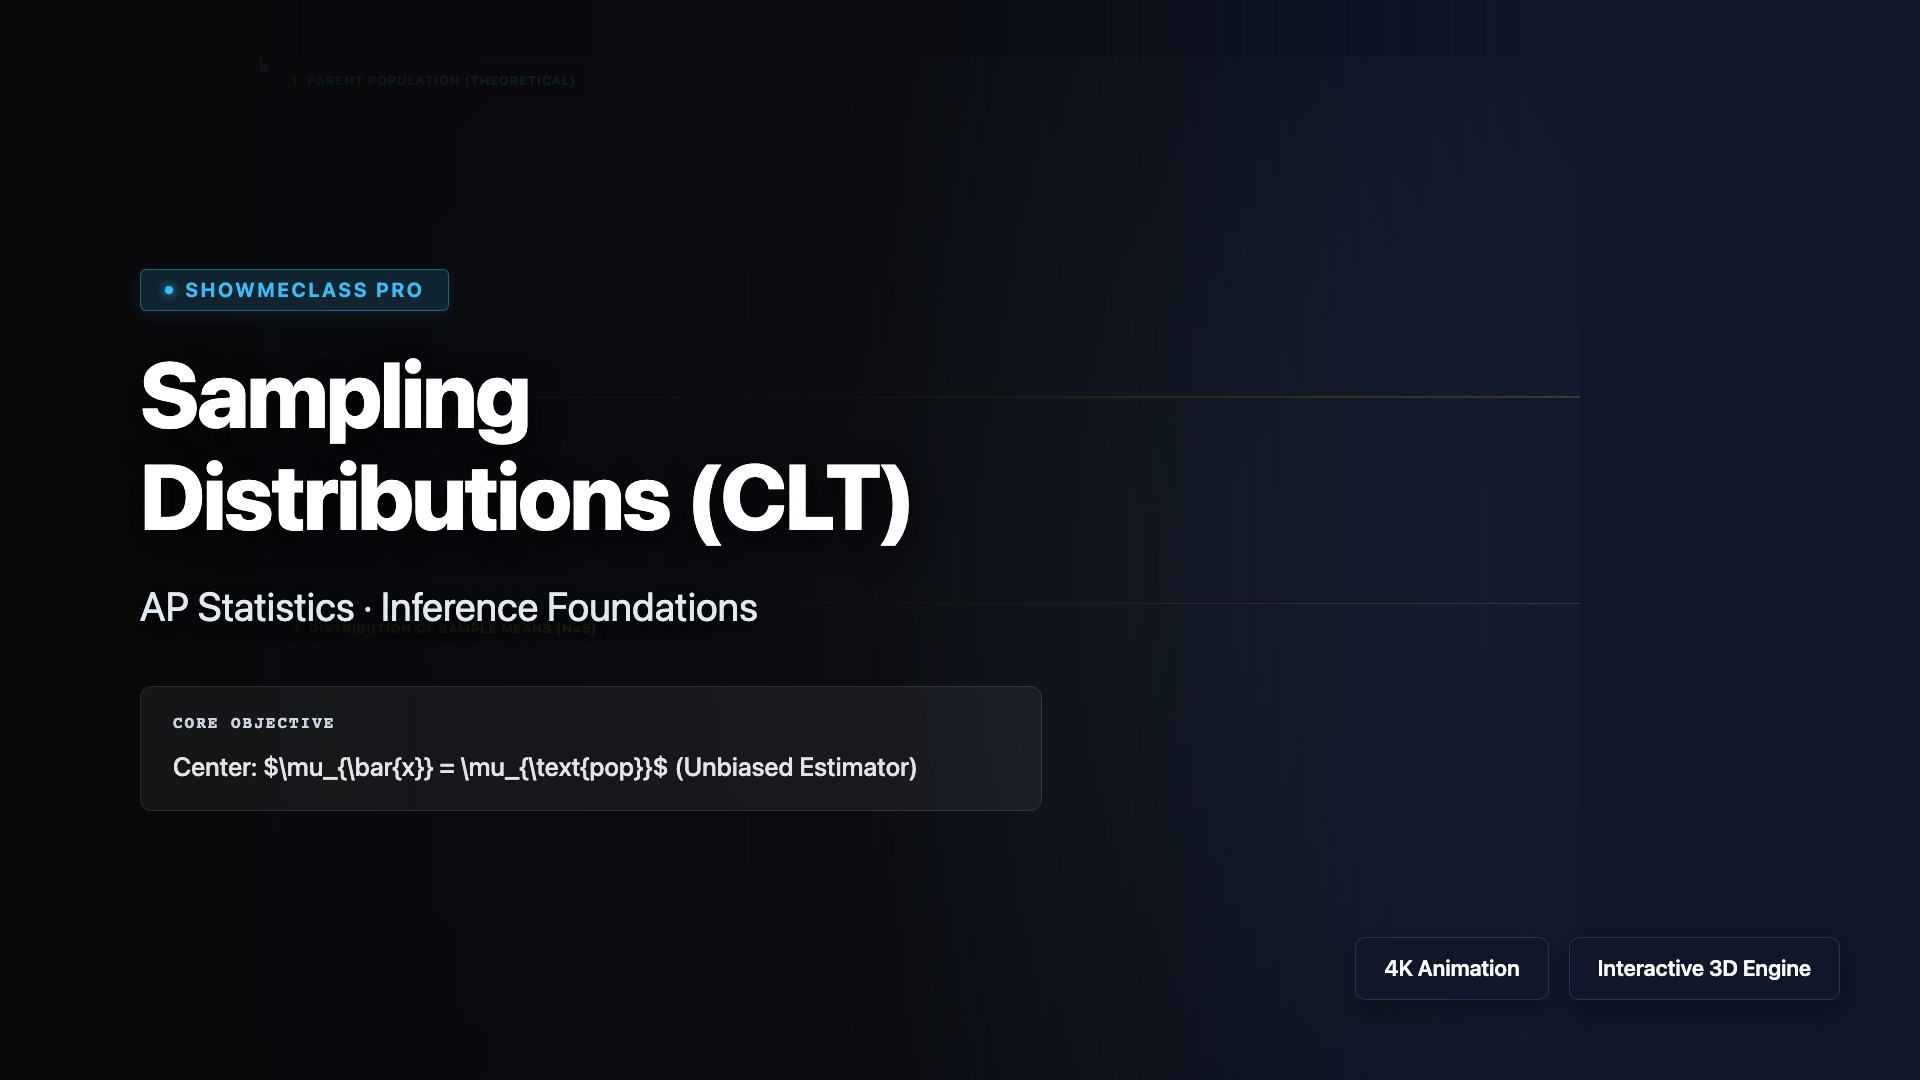
Sampling Distributions (CLT)
Struggle with the Central Limit Theorem? Draw 10,000 samples from highly skewed or bimodal parent populations and watch the perfect normal bell curve emerge.
AP STATISTICS
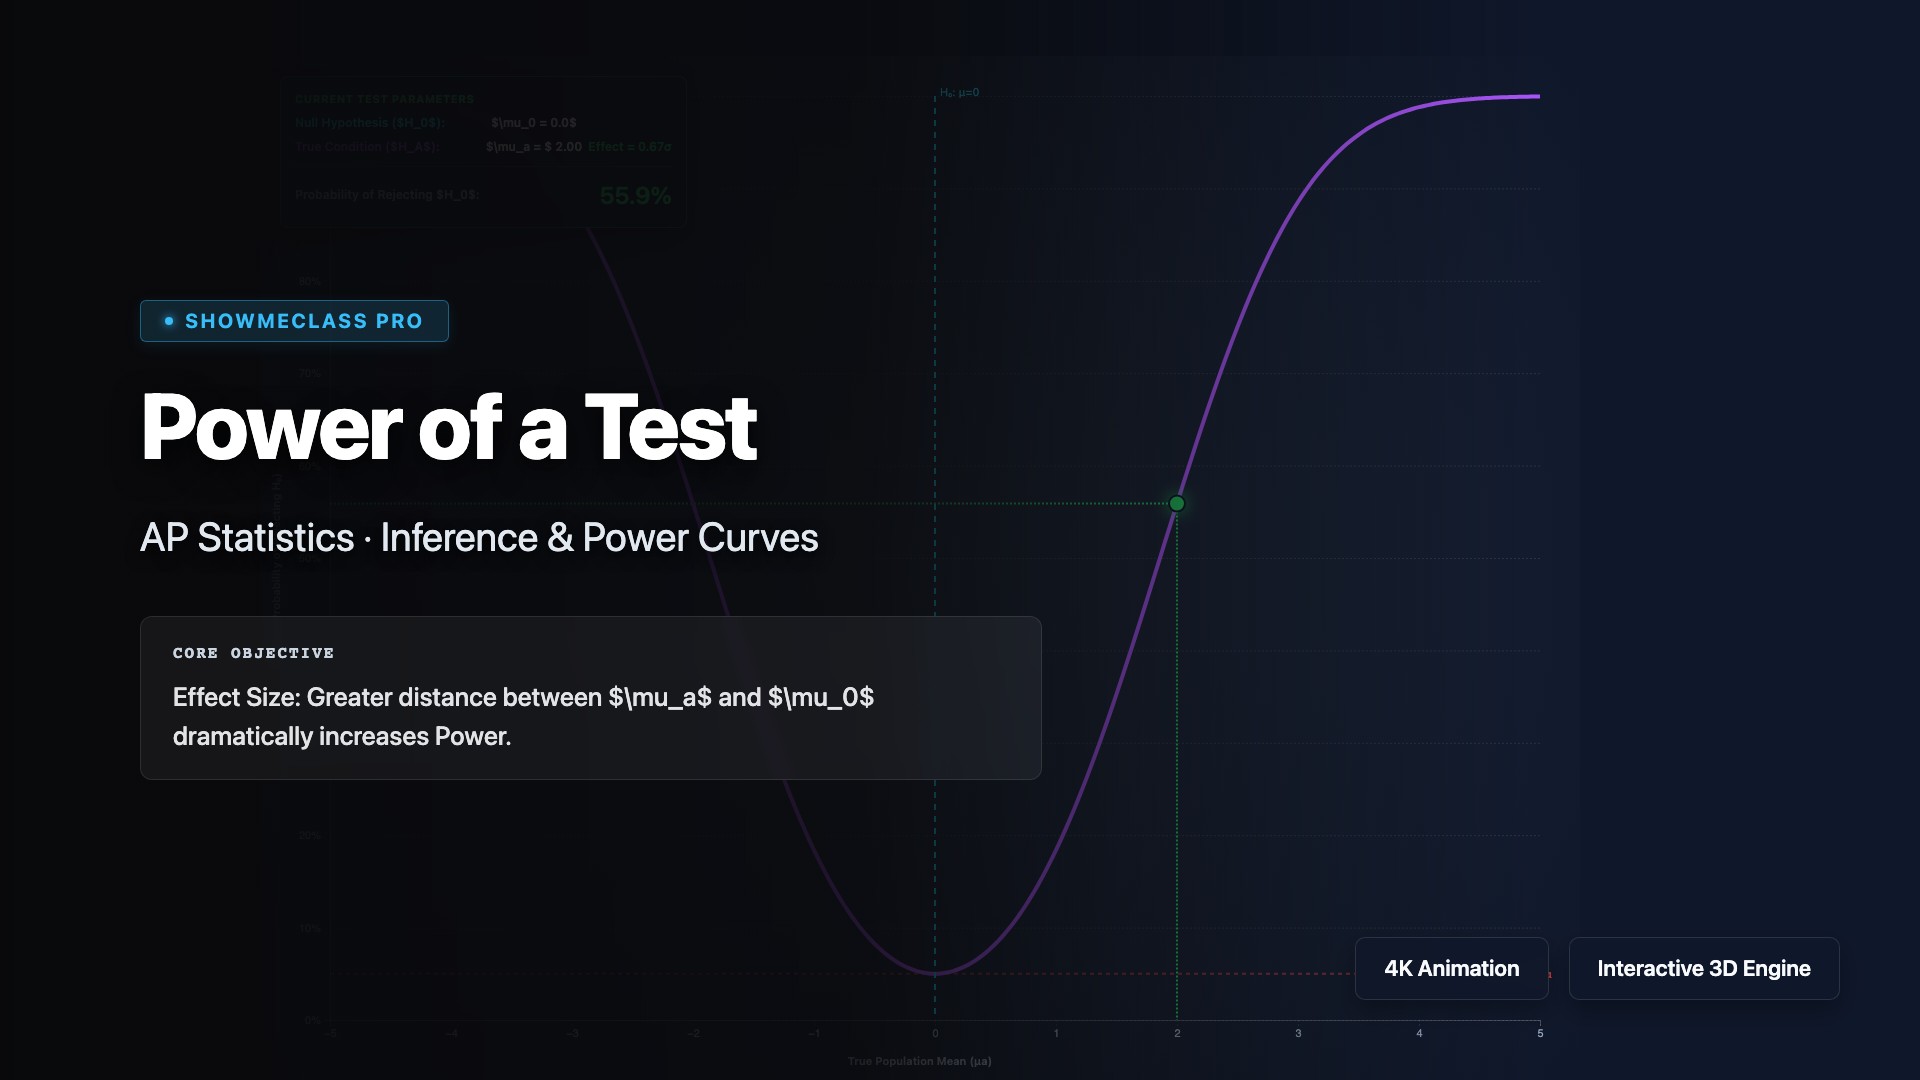
Power of a Test Curve
Visualize how Statistical Power responds dynamically to Effect Size (mu_a), Sample Size, and Alpha. Plot the complete functional power curve.
AP STATISTICS
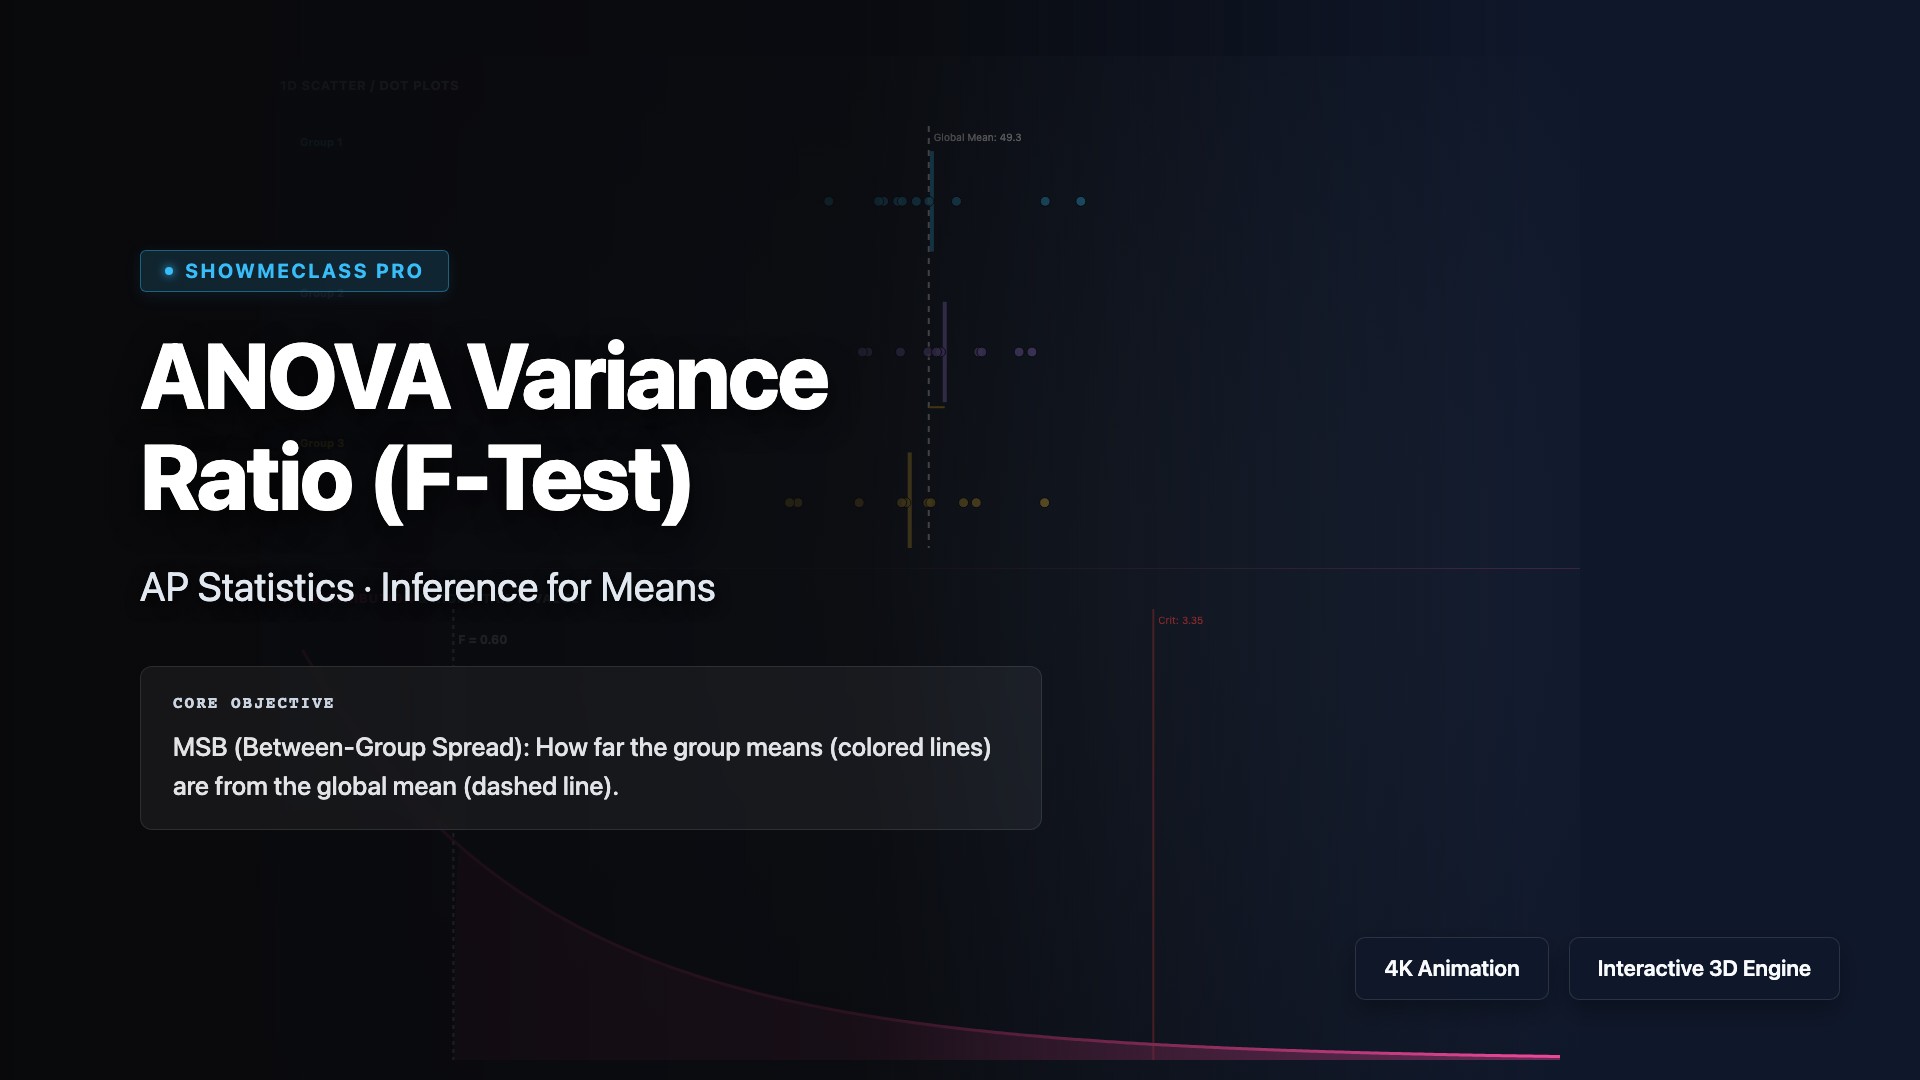
ANOVA Variance Ratio
Deconstruct Analysis of Variance geometrically. Shift group means (MSB) and internal scatter (MSW) to see the massive impact on the F-statistic and P-value.

AP STATISTICS