Showing 12 results
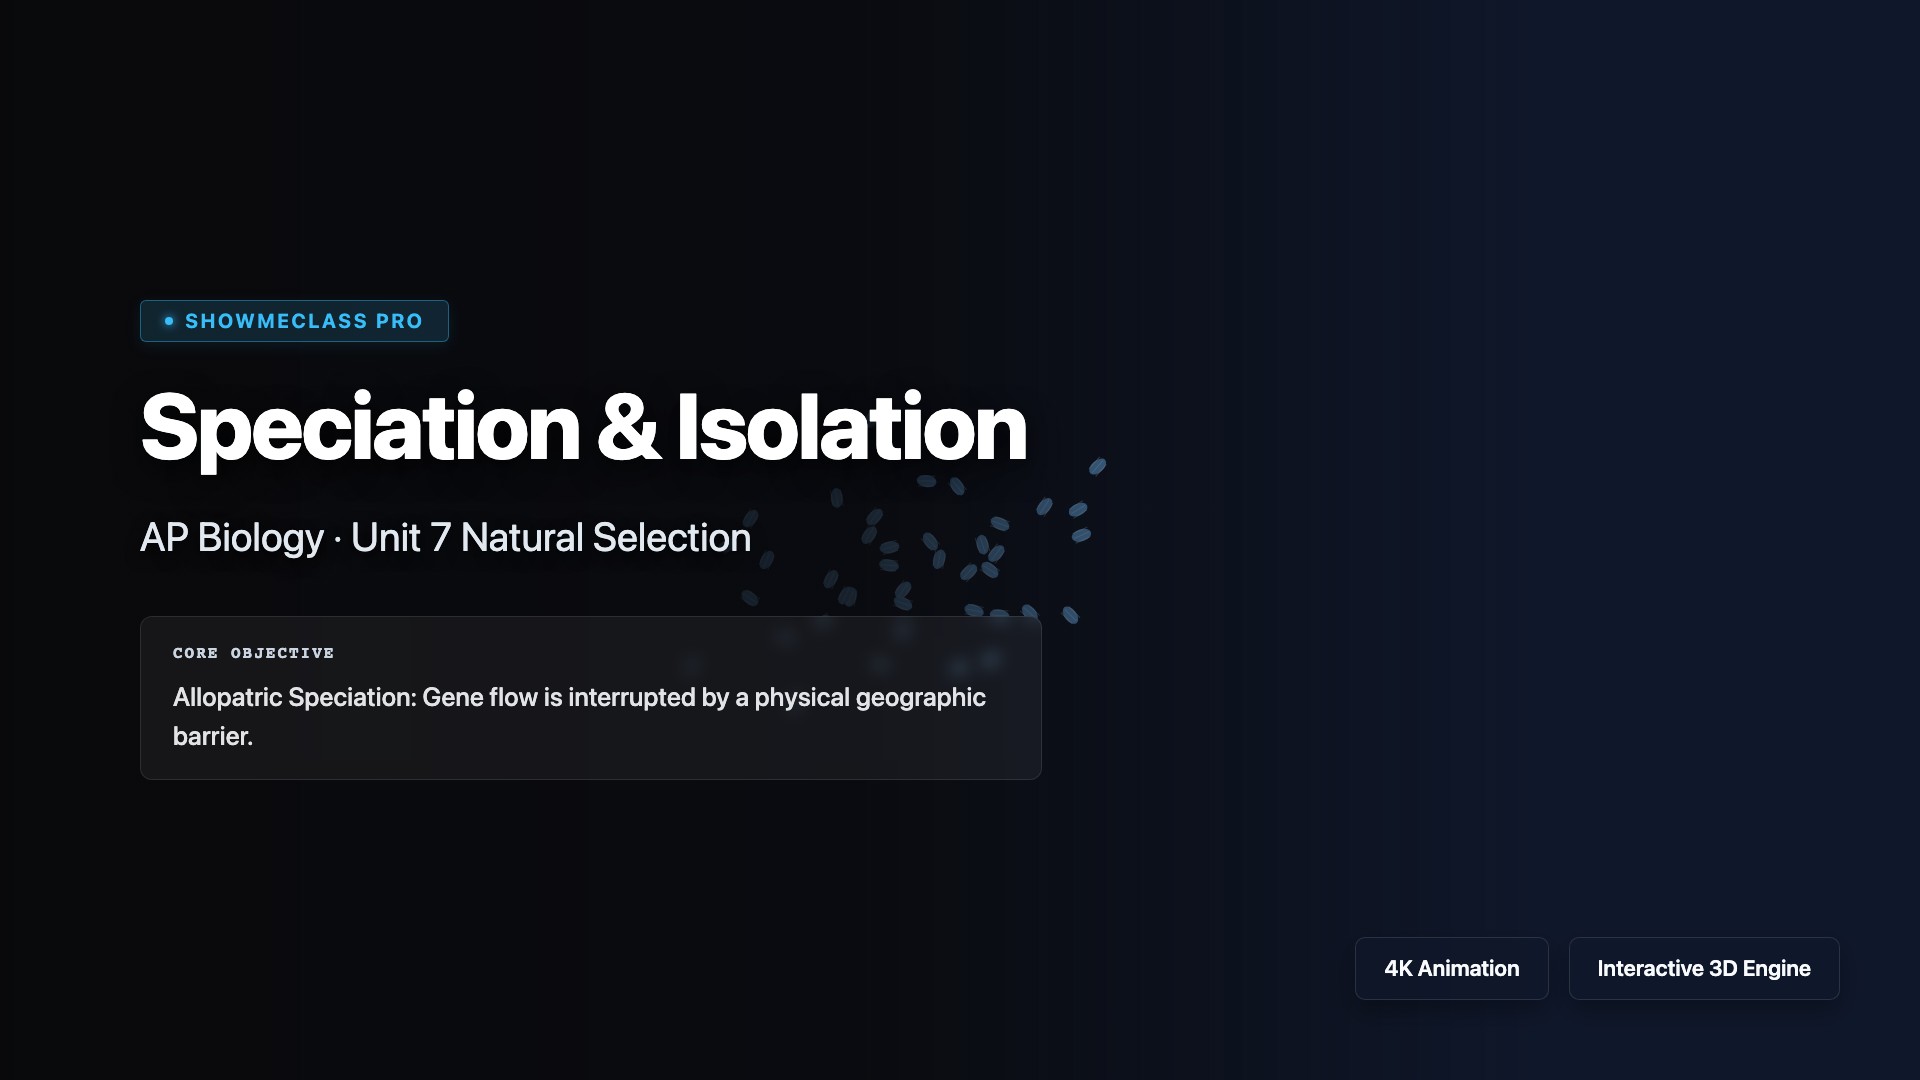
Speciation & Reproductive Isolation
Simulate populations diverging into distinct species by interrupting gene flow through Allopatric (Geographic River) or Sympatric (Polyploidy/Behavioral) isolating mechanisms.
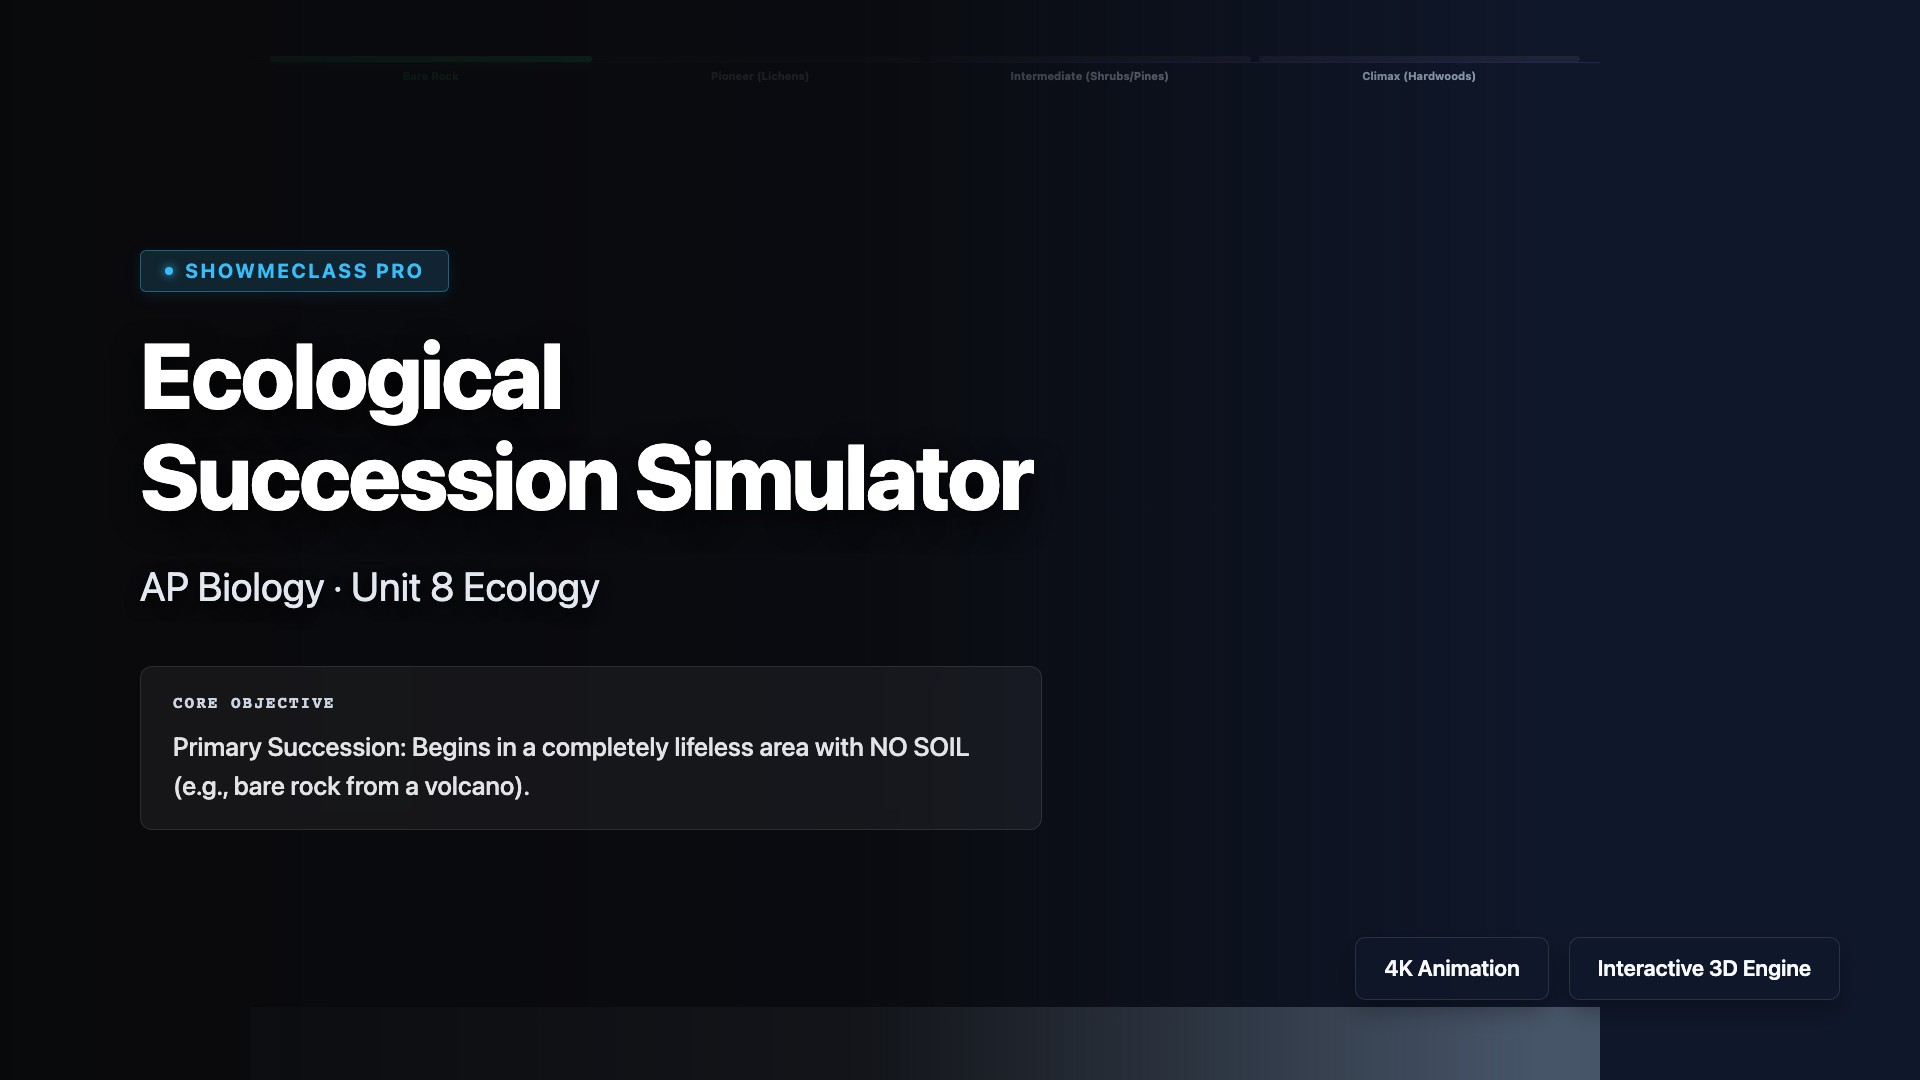
Ecological Succession Simulator
Advance a lifeless rocky landscape through Primary Succession using lichen pioneers. Trigger a catastrophic fire to demonstrate the much faster, soil-rich process of Secondary Succession.
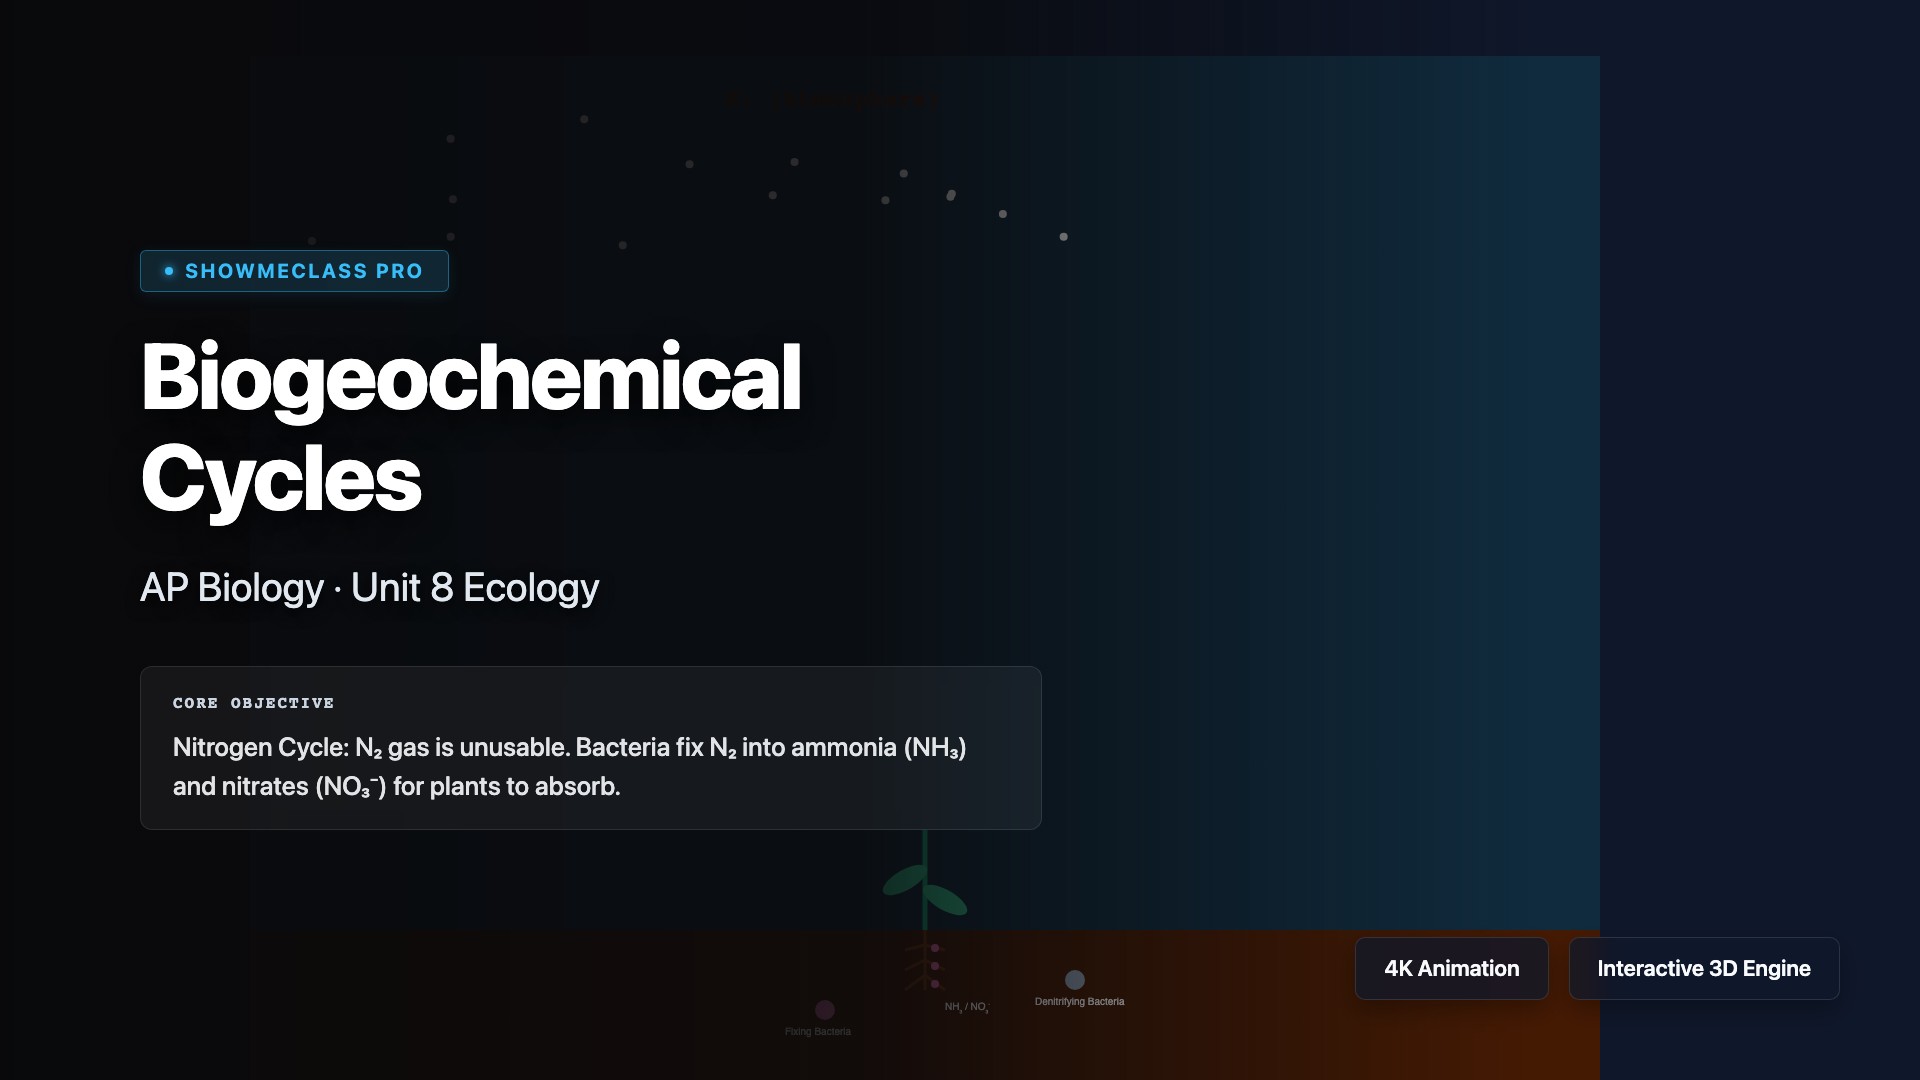
Biogeochemical Cycles (N & P)
Contrast the Nitrogen Cycle (relying entirely on root/soil bacteria to fix atmospheric N₂) against the Phosphorus Cycle (which lacks a gas phase and relies entirely on rock weathering).
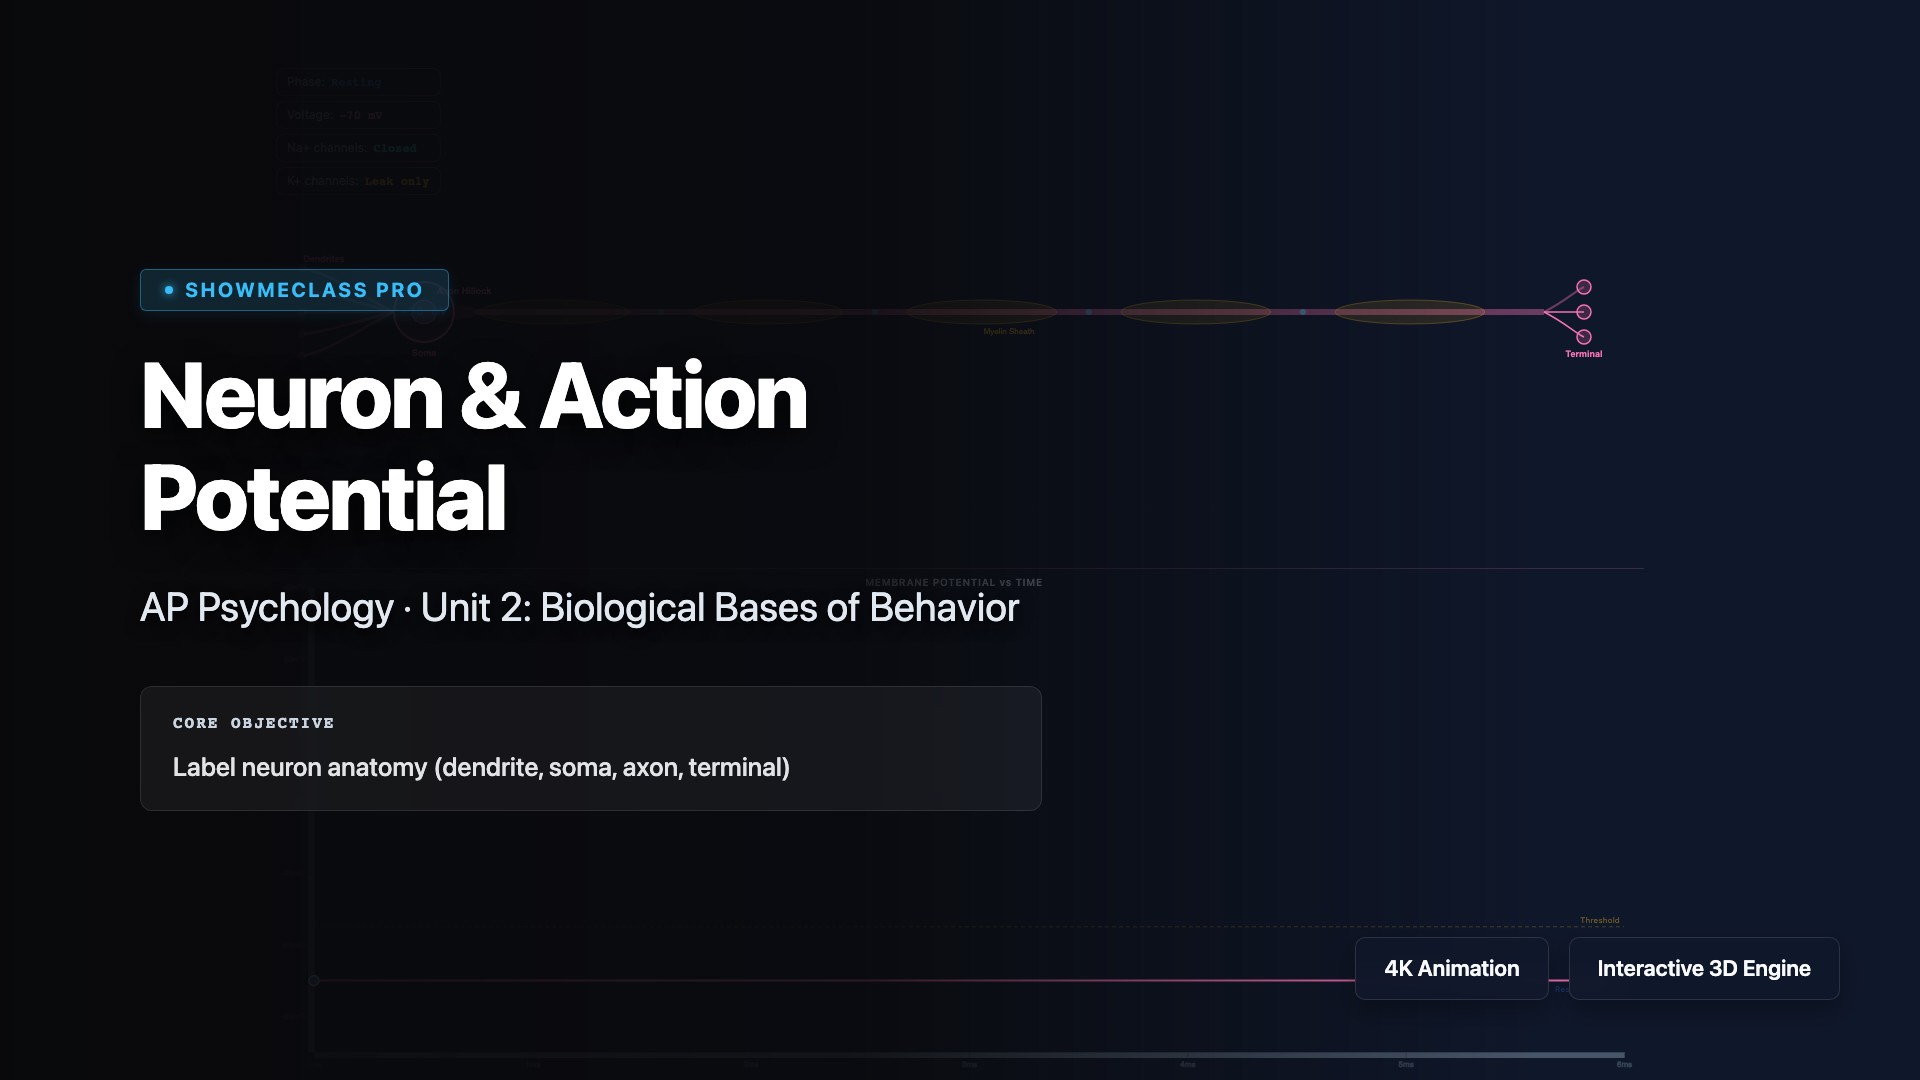
Neuron Action Potential Simulator
Trigger an electrical stimulus on a neuron and watch the membrane potential graph trace typical Depolarization, Repolarization, and Hyperpolarization phases. Track the live states of Na+ and K+ ion channels.
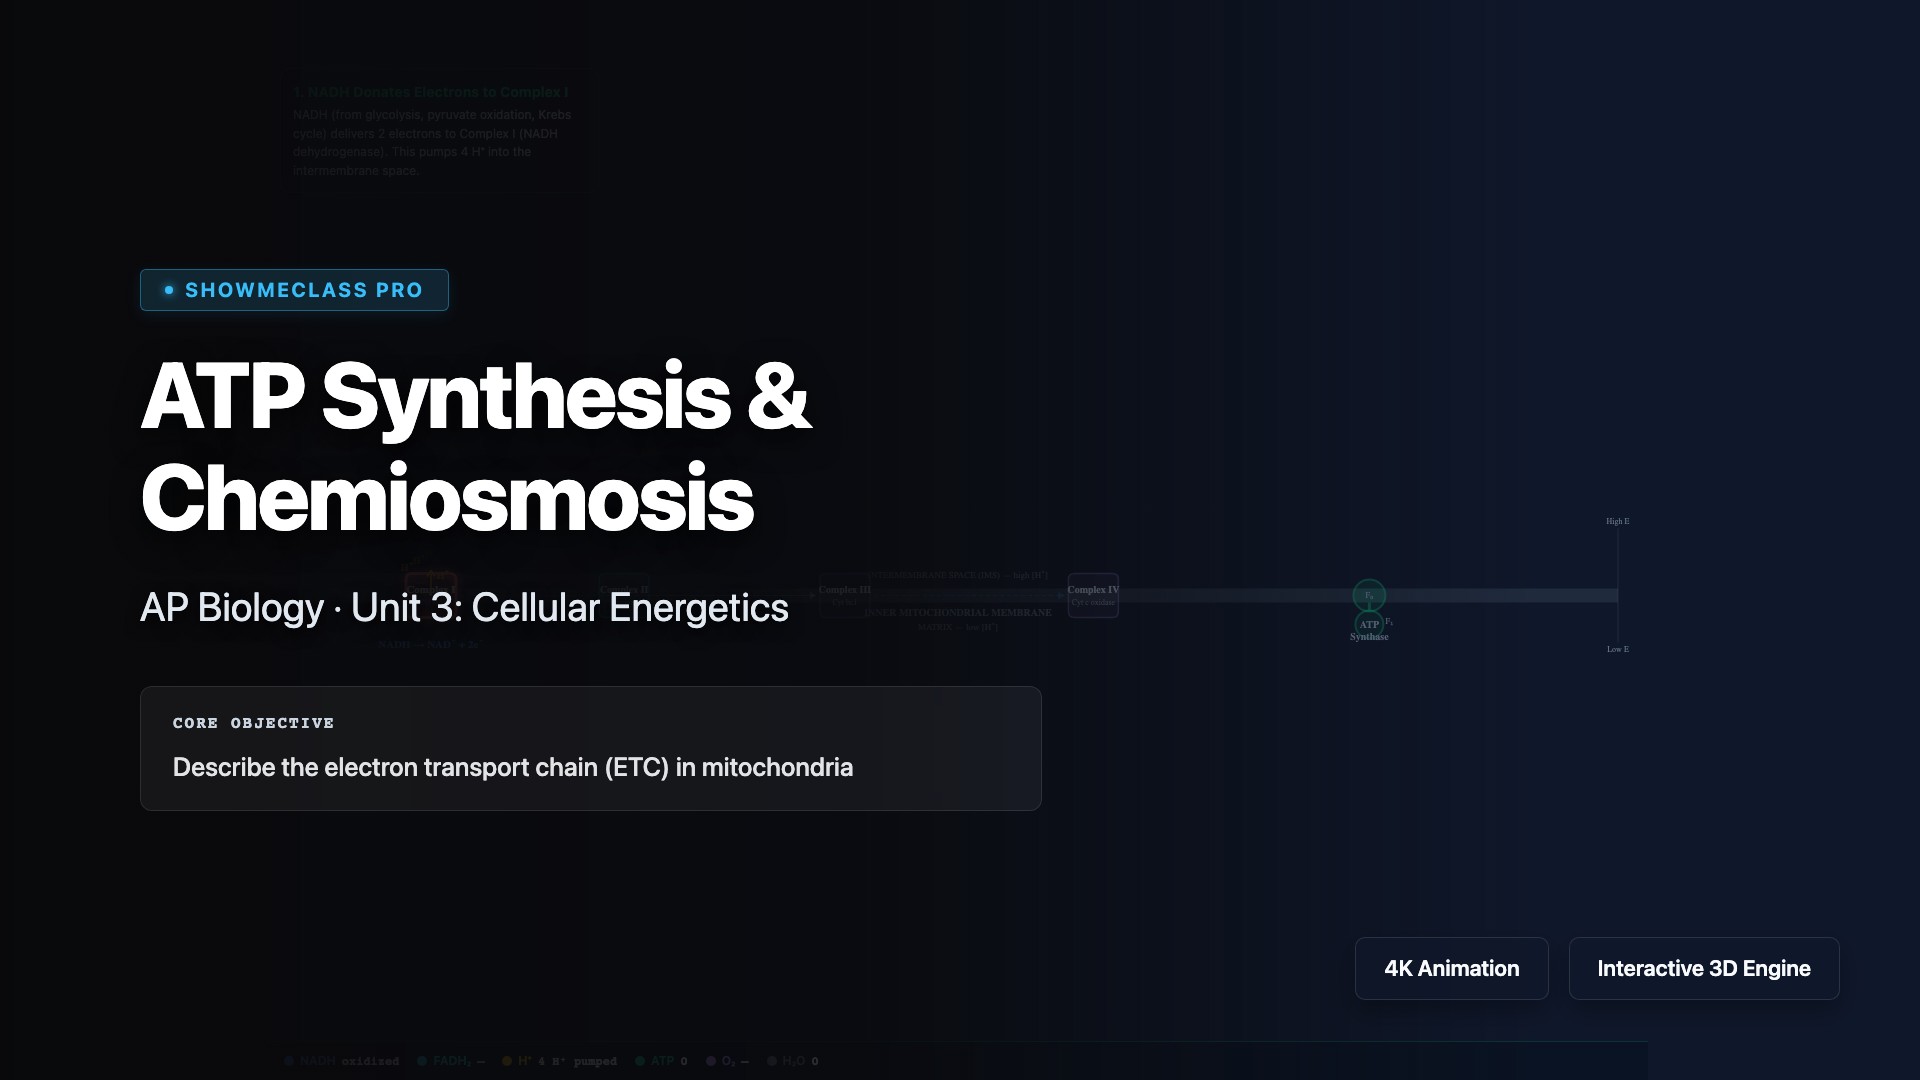
ATP Synthesis & Chemiosmosis
Explore how ATP synthase harnesses the proton gradient across the inner mitochondrial membrane to produce ATP through chemiosmosis. Visualize the electron transport chain, proton pumping, and the rotation of ATP synthase as it catalyzes the phosphorylation of ADP to ATP—the universal energy currency of cells.
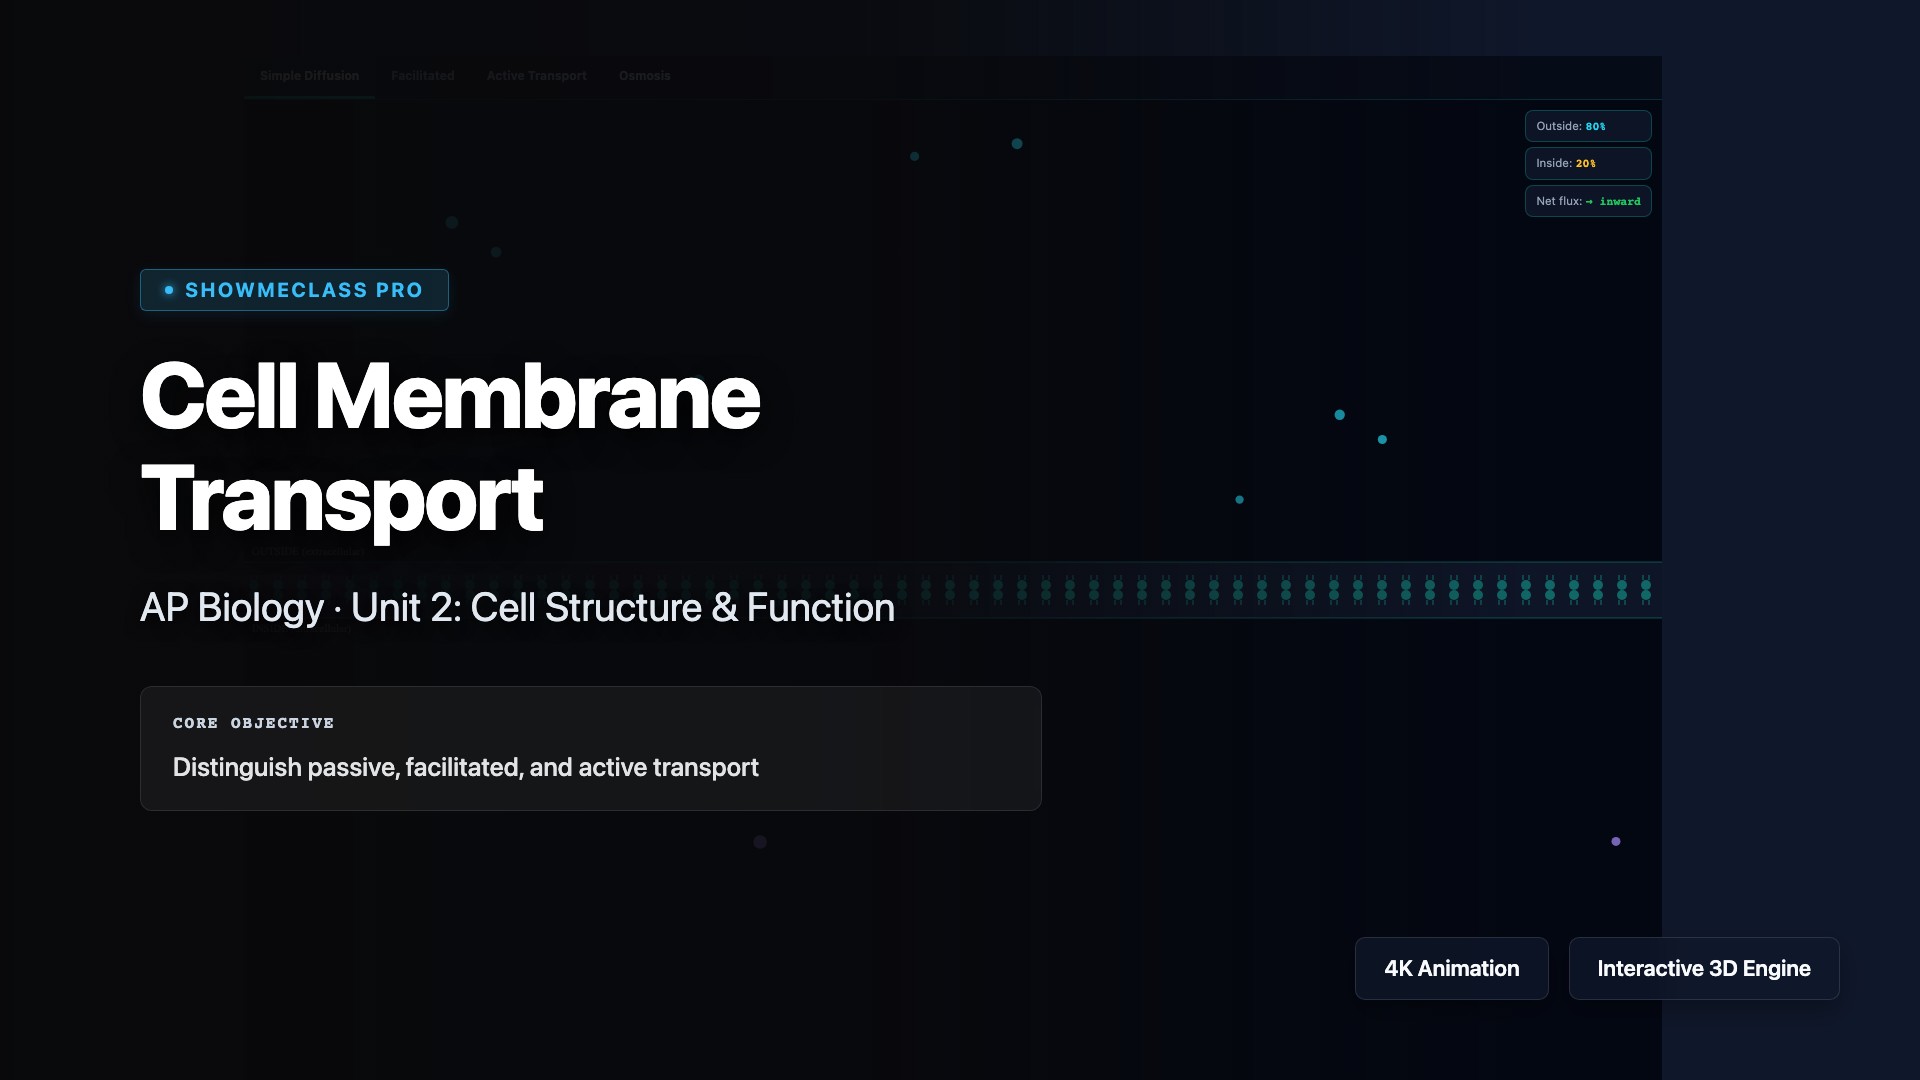
Cell Membrane Transport
Compare passive and active transport mechanisms across the selectively permeable cell membrane. Observe simple diffusion, facilitated diffusion, osmosis, and active transport (including sodium-potassium pumps and endocytosis). Adjust concentration gradients and ATP availability to see how cells maintain homeostasis.
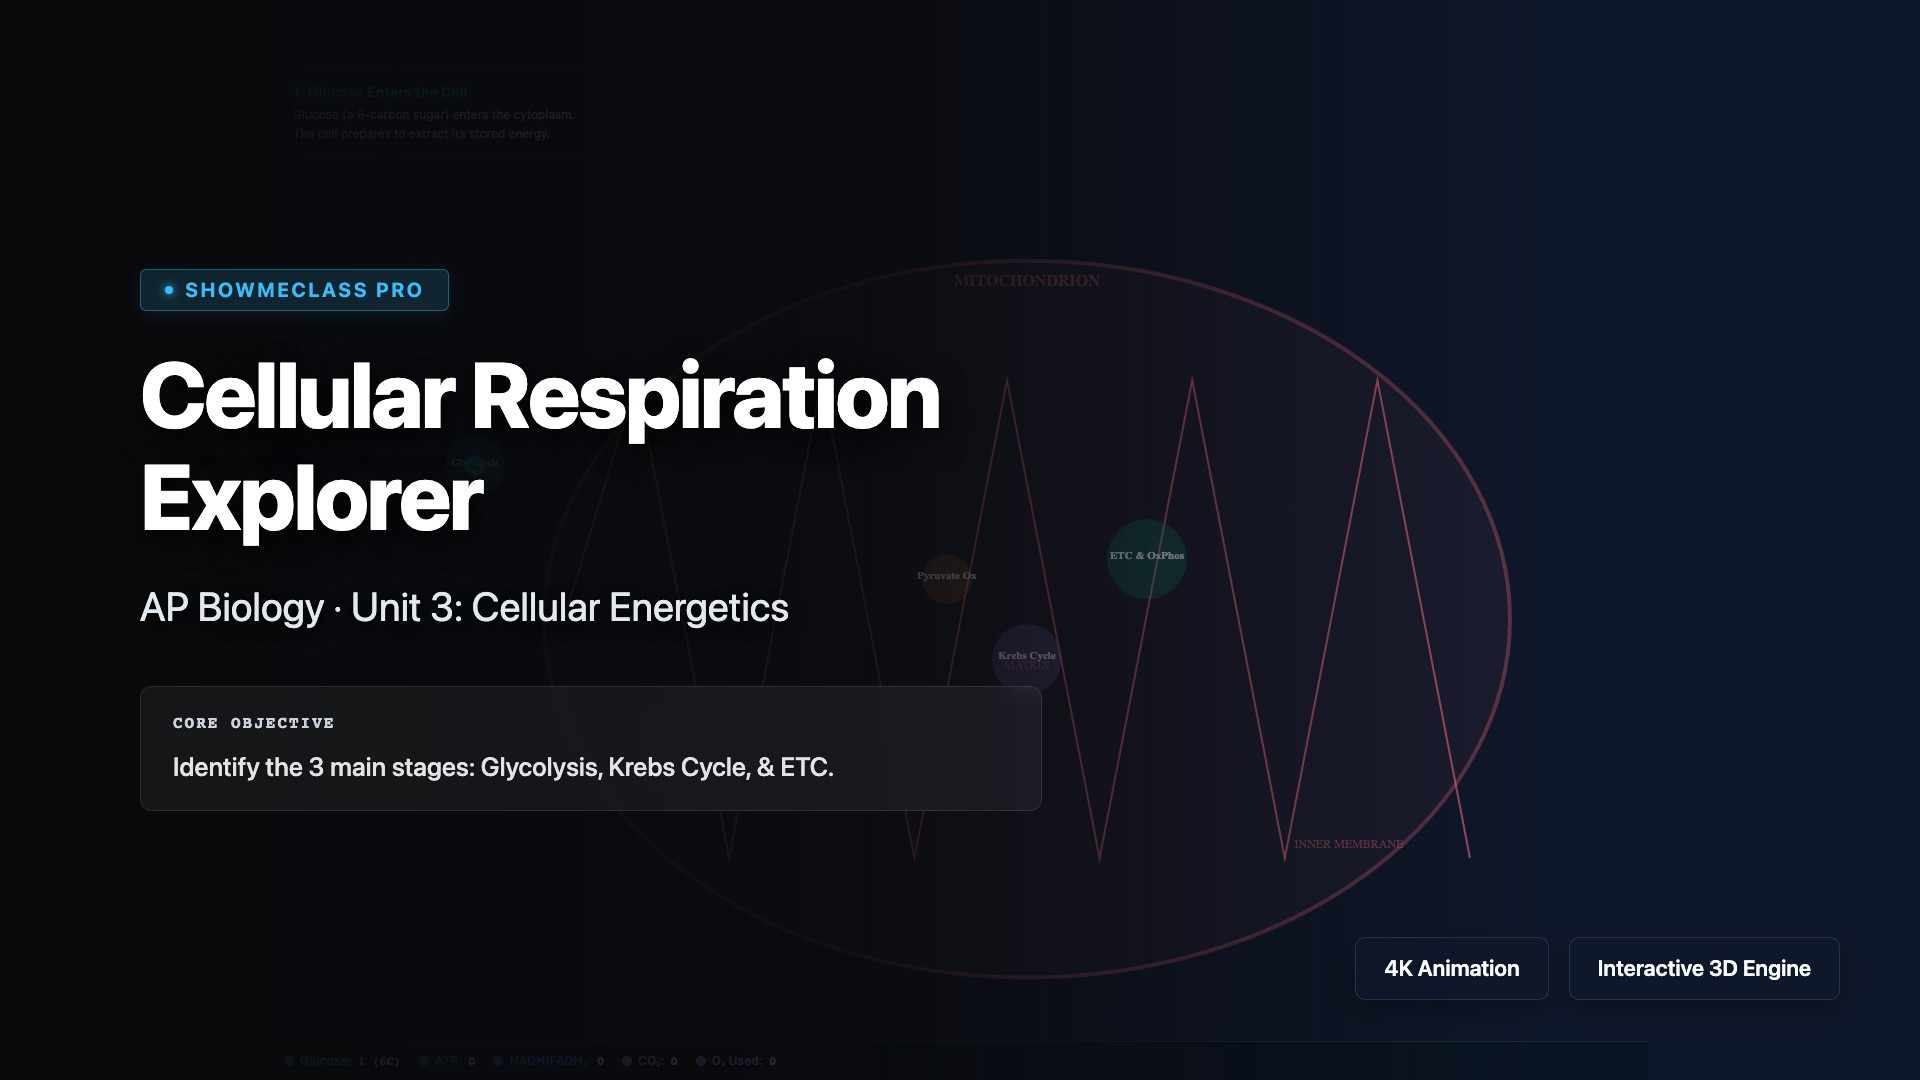
Cellular Respiration Explorer
Step through the complete cellular respiration pathway from glucose to ATP. Explore glycolysis in the cytoplasm, the Krebs cycle in the mitochondrial matrix, and oxidative phosphorylation in the inner membrane. Track the production of ATP, NADH, FADH₂, and CO₂ at each stage to understand how cells extract energy from organic molecules.
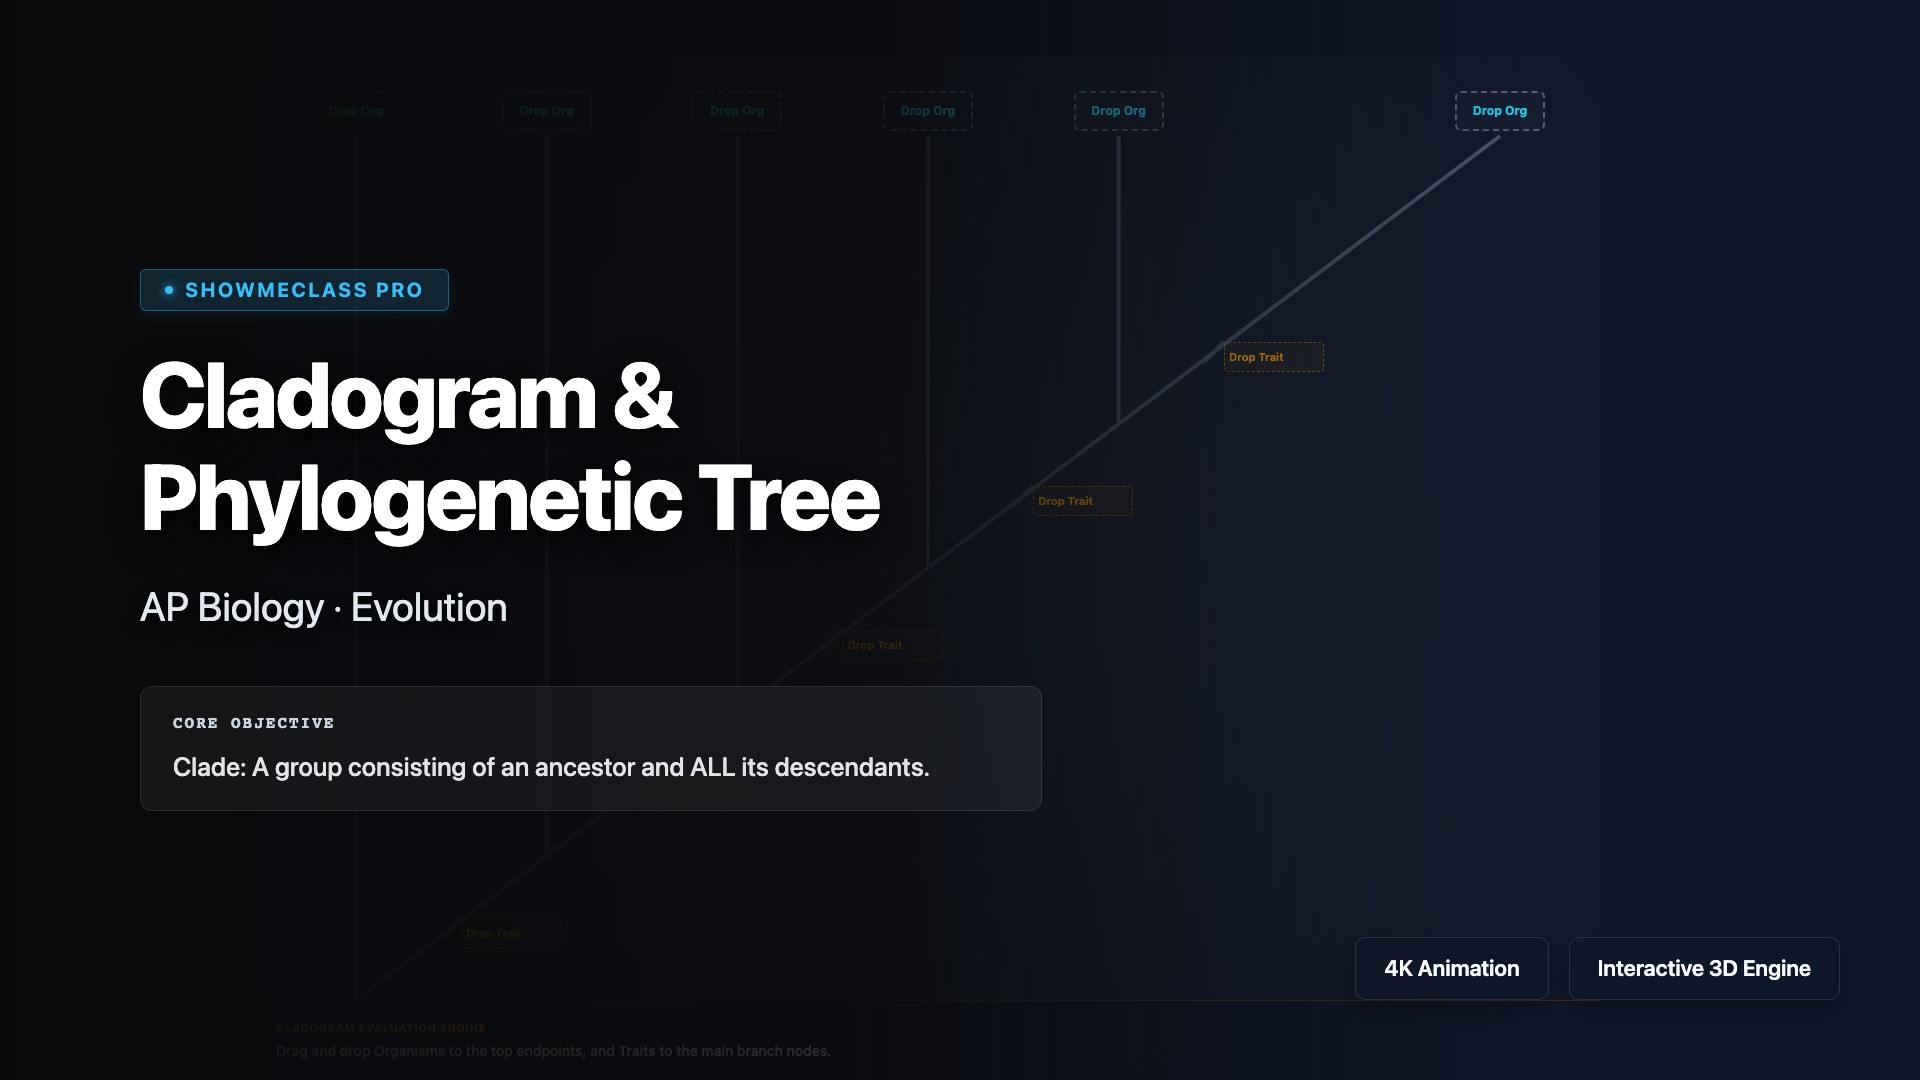
Cladogram & Phylogenetic Tree
Build cladograms and phylogenetic trees to visualize evolutionary relationships between organisms based on shared derived characteristics. Explore how cladistics uses synapomorphies to determine common ancestry, construct branching diagrams, and interpret evolutionary history through the principle of parsimony.
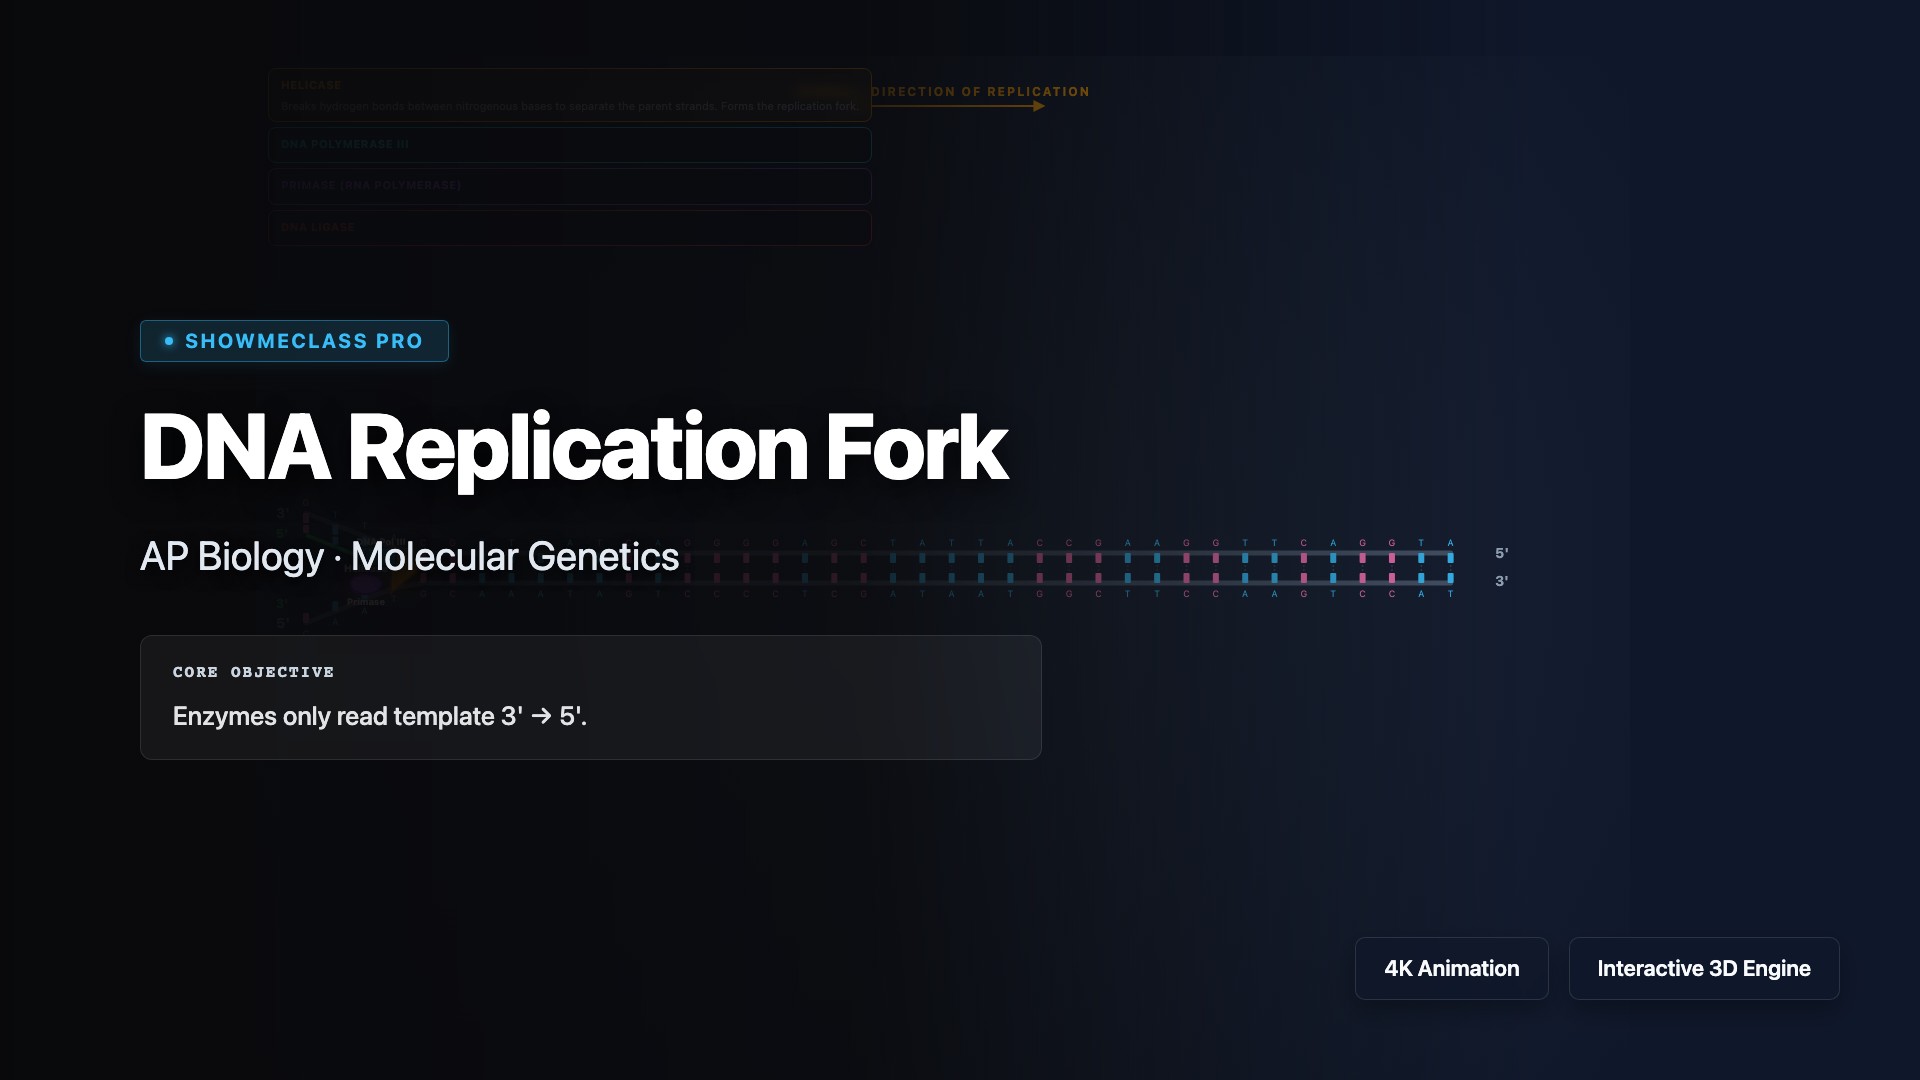
DNA Replication Fork
Visualize the semiconservative DNA replication process at the replication fork, including the roles of helicase, primase, DNA polymerase III, and ligase. Explore how the leading strand is synthesized continuously 5' to 3' while the lagging strand forms discontinuous Okazaki fragments, and understand the proofreading mechanisms that ensure replication fidelity.
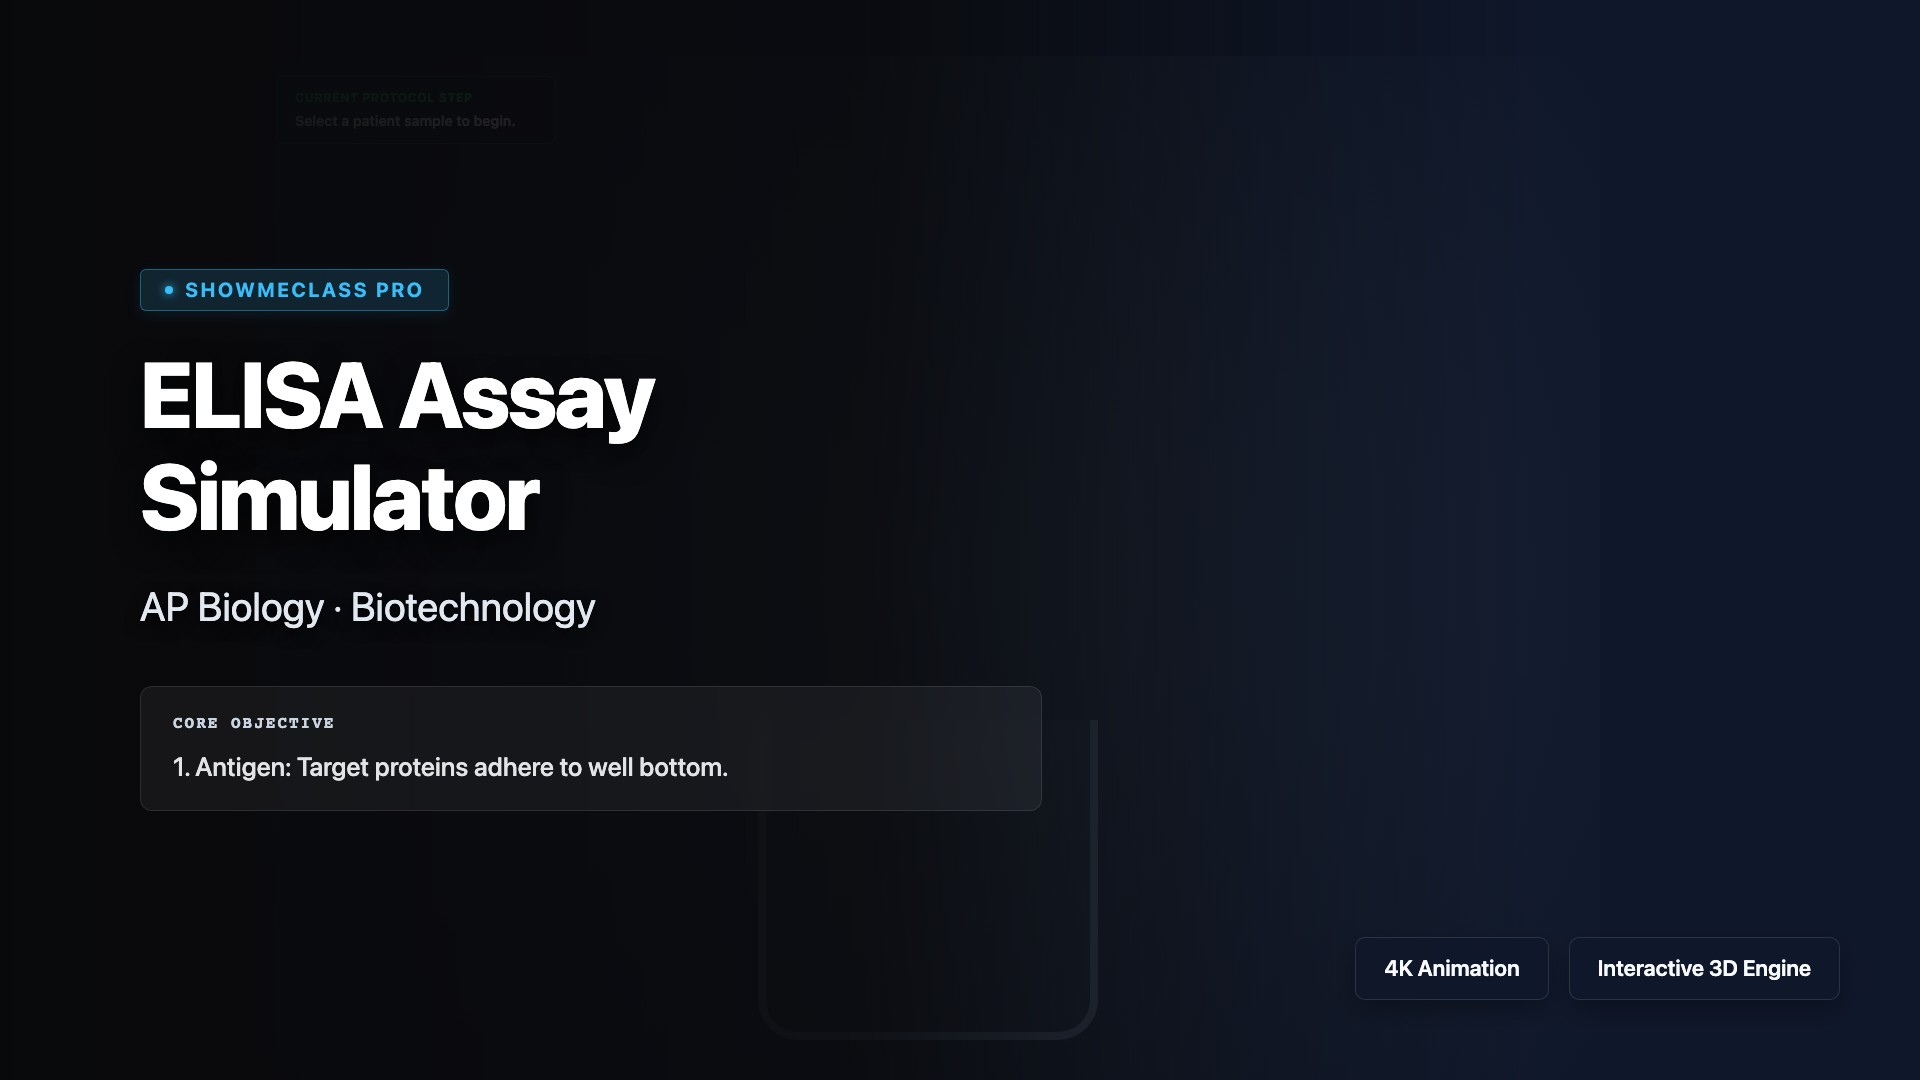
ELISA Assay Simulator
Simulate the enzyme-linked immunosorbent assay (ELISA) technique used to detect and quantify specific antigens or antibodies in biological samples. Explore the sandwich ELISA method, understand antibody-antigen binding specificity, and learn how colorimetric detection enables diagnostic applications in medicine, research, and disease screening.
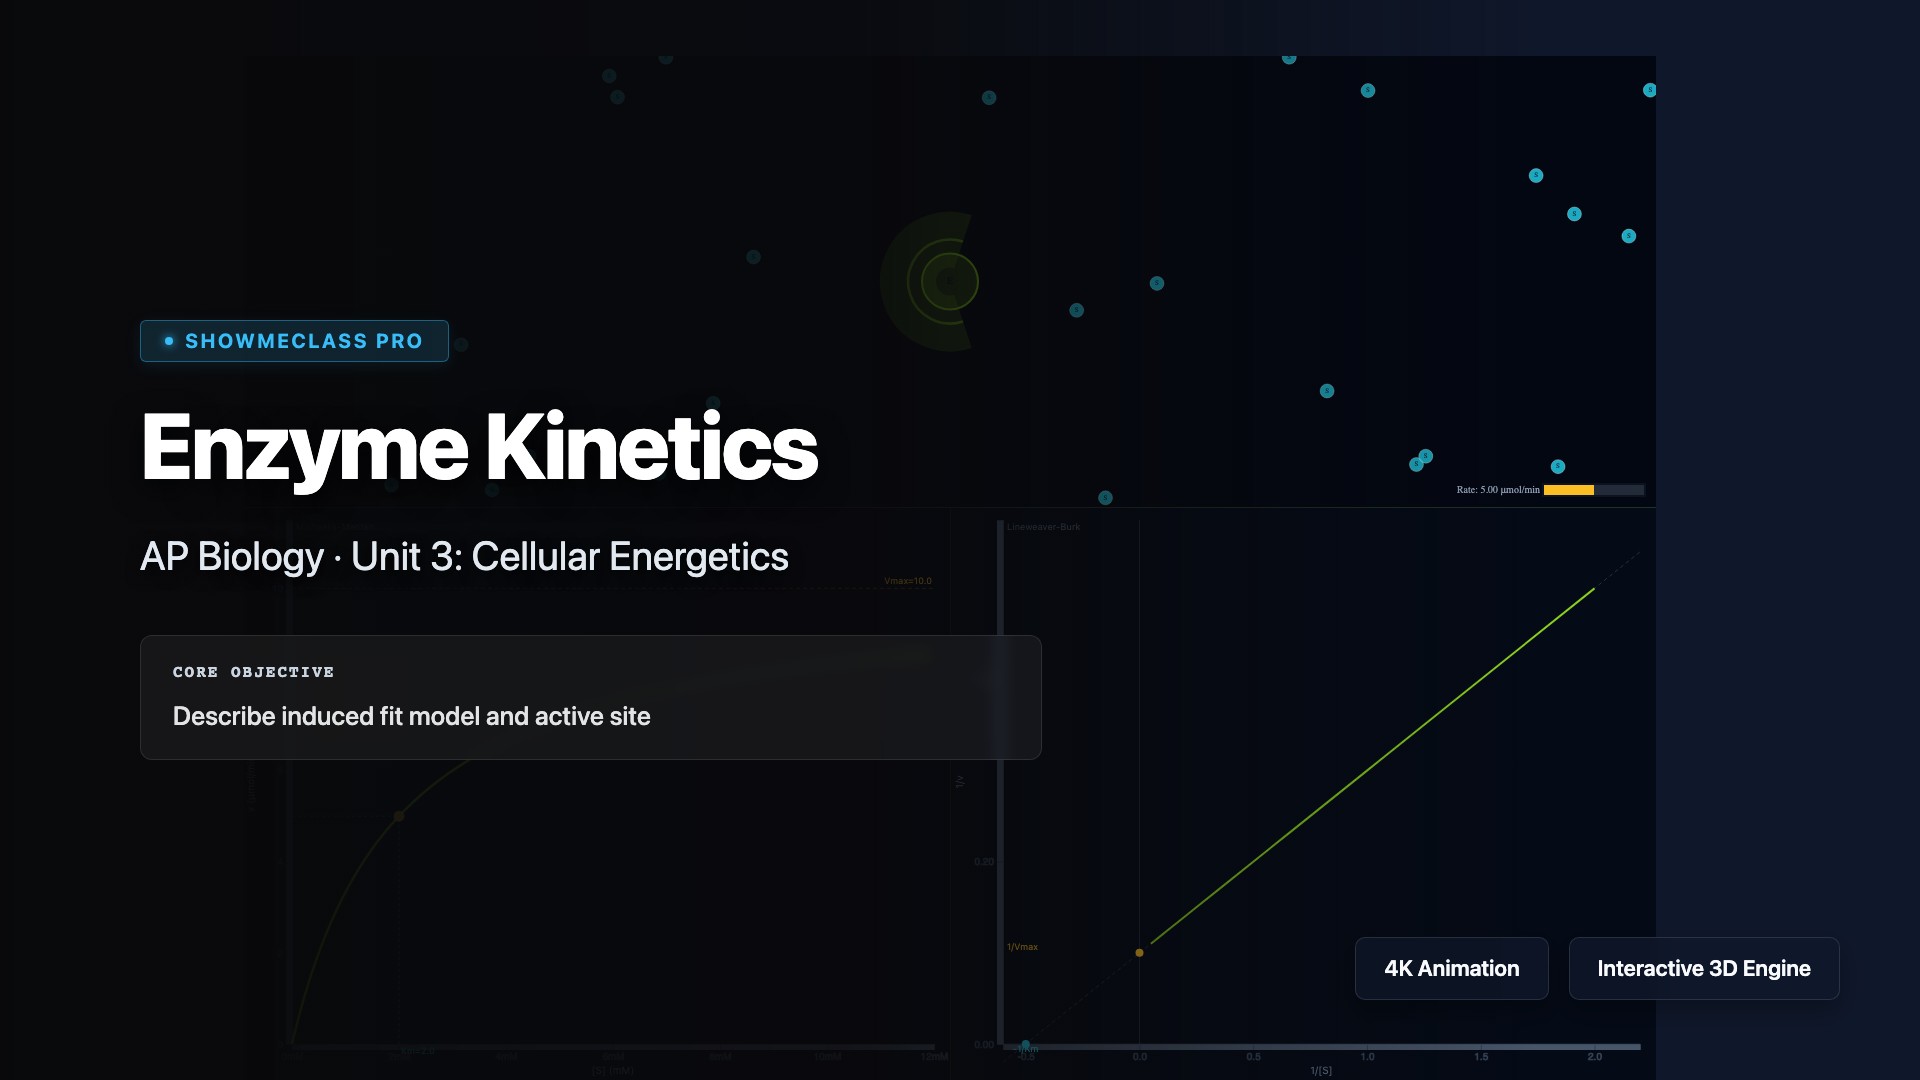
Enzyme Kinetics
Explore enzyme kinetics through Michaelis-Menten models, visualizing how substrate concentration affects reaction velocity. Understand key parameters including Vmax (maximum velocity), Km (Michaelis constant), and how competitive and non-competitive inhibitors alter enzyme activity by affecting substrate binding and catalytic efficiency.
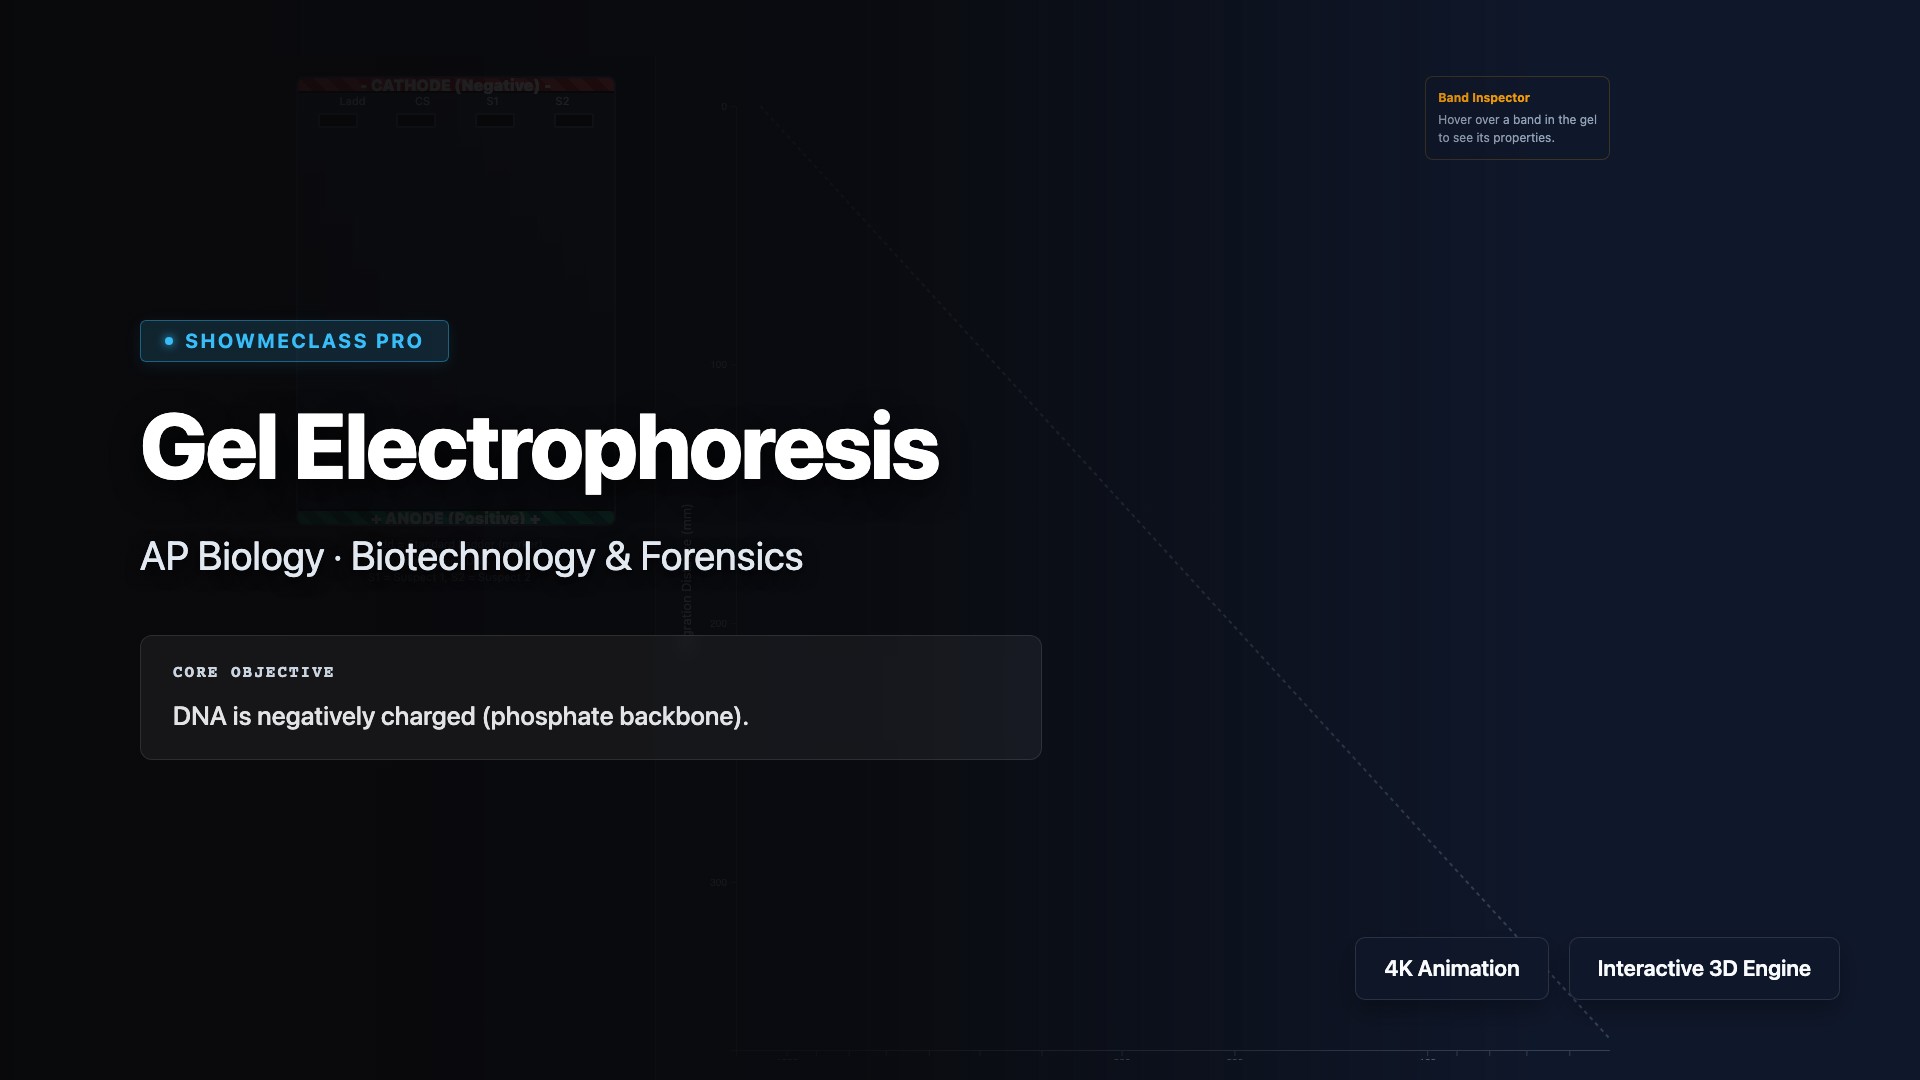
Gel Electrophoresis
Simulate gel electrophoresis to separate DNA fragments by size using an electric field through an agarose gel matrix. Visualize how negatively charged DNA molecules migrate toward the positive electrode, with smaller fragments traveling faster and farther than larger ones. Learn applications in DNA fingerprinting, RFLP analysis, and forensic identification.