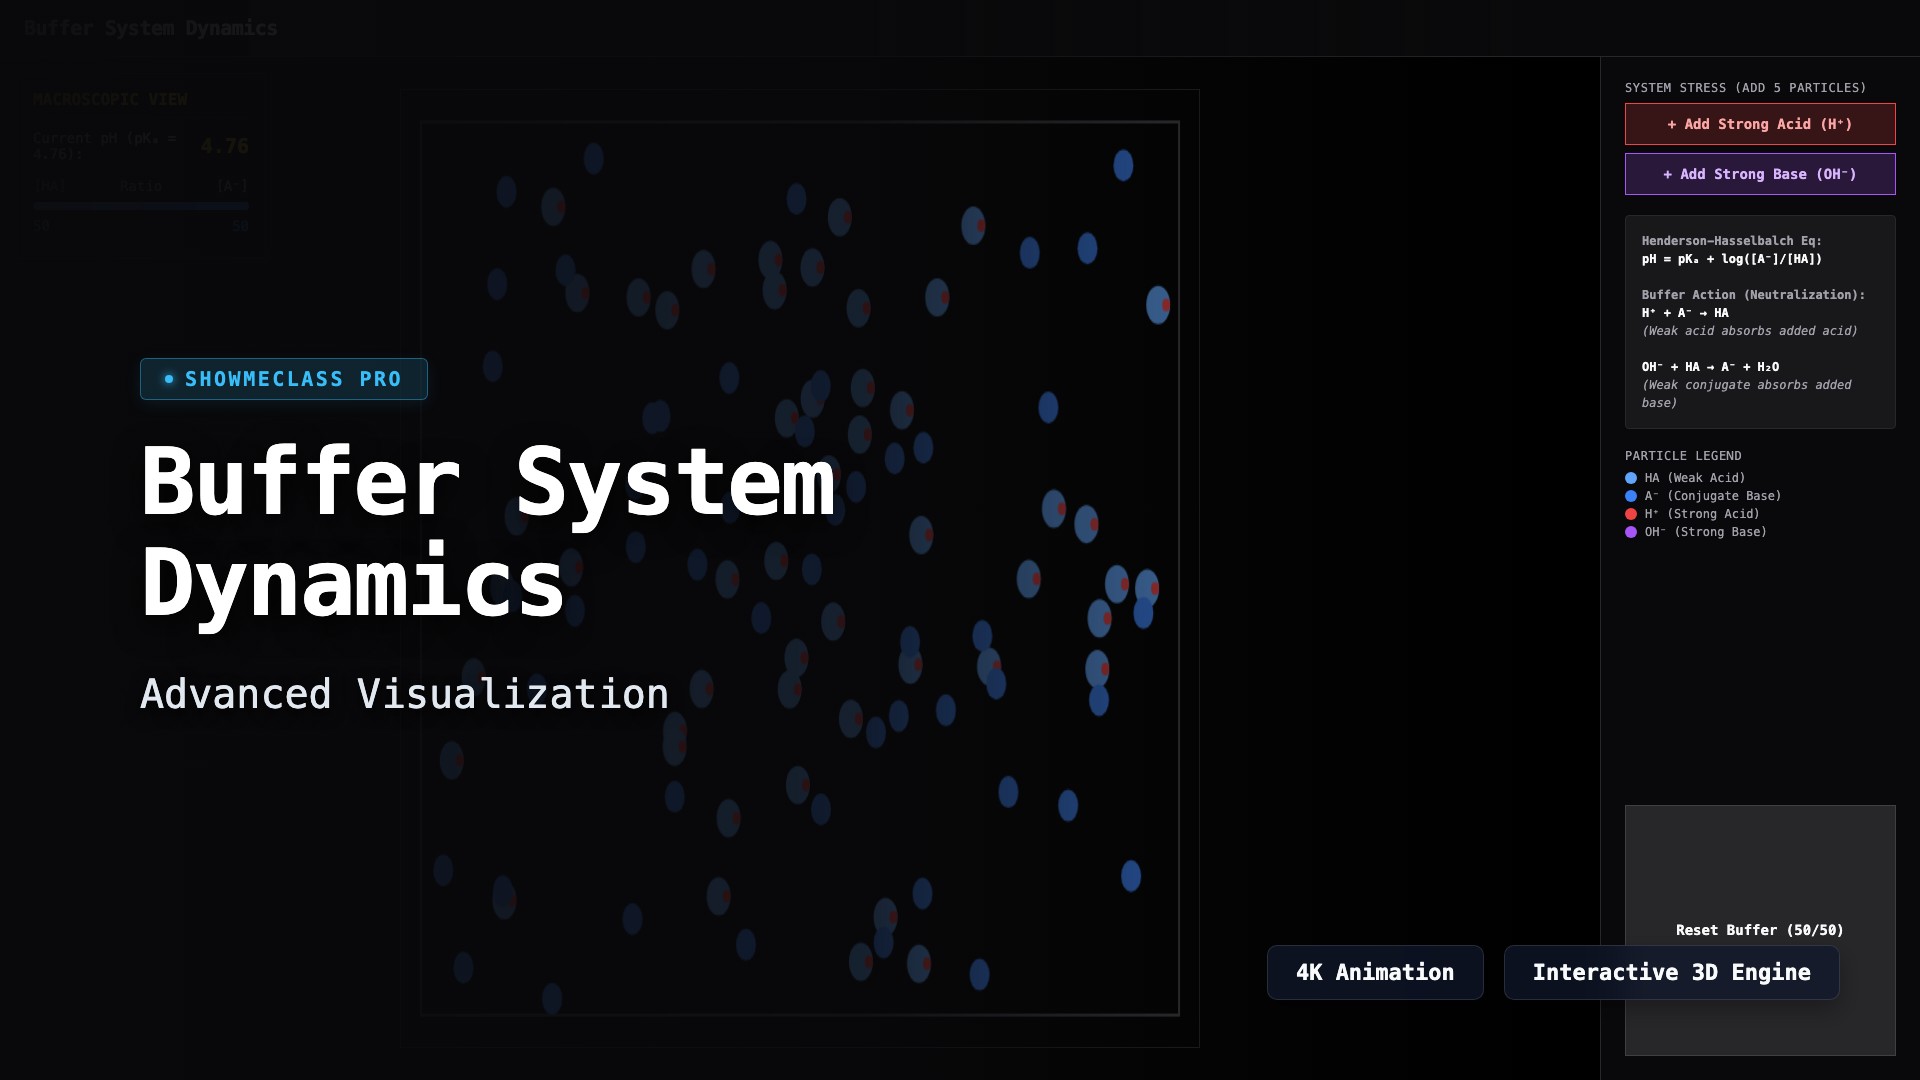
Buffer System Dynamics
Visualize a macroscopic particle-level buffer system reacting to the influx of strong acids (H⁺) or strong bases (OH⁻). Observe Henderson-Hasselbalch equations dynamically adapt as the buffer capacity successfully resists dramatic pH changes.
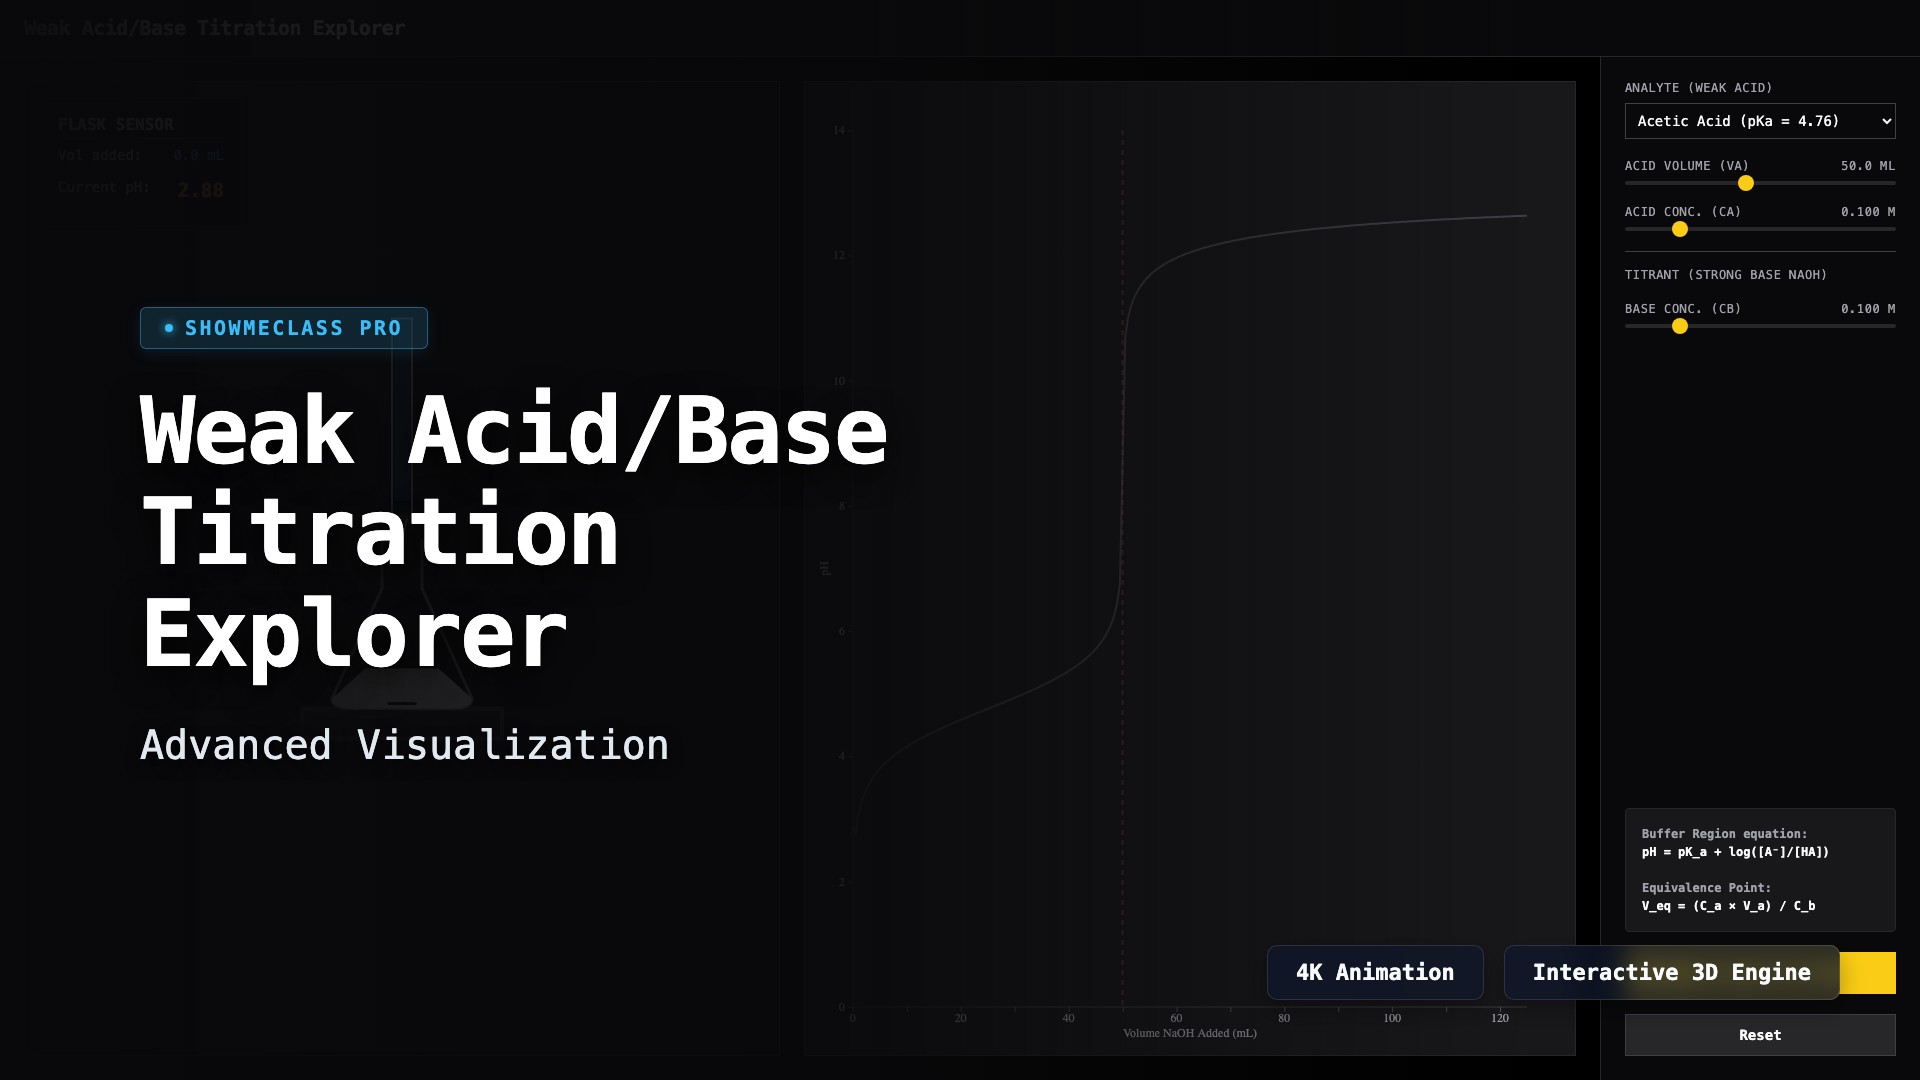
Weak Acid/Base Titration Explorer
Perform a simulated titration dropping strong base into a weak acid. The simulator mathematically calculates real-time buffer regions, half-equivalence points, and post-equivalence spikes dynamically, plotting the exact sigmoidal pH titration curve.
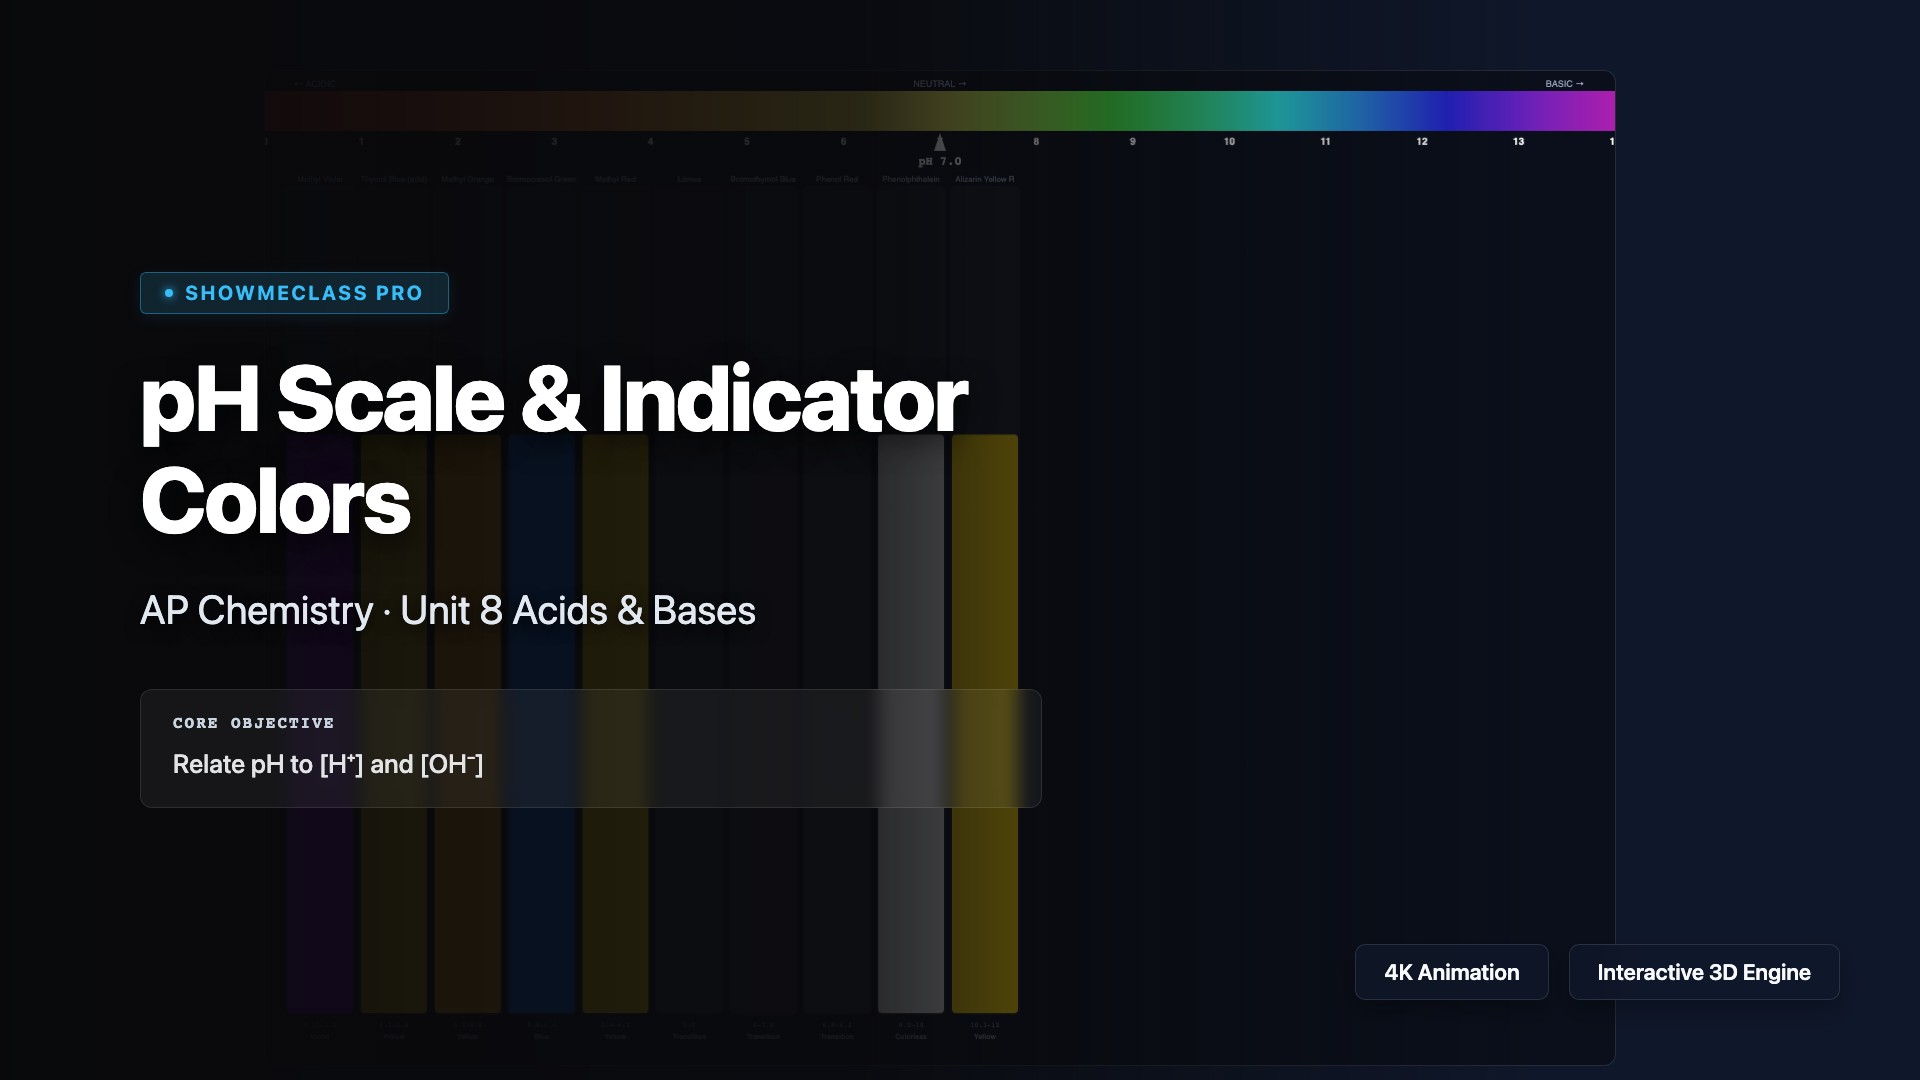
pH Scale & Indicator Color Simulator
Interactive pH scale with 10 common acid-base indicators displayed as color-changing test tubes. Slide pH from 0-14 to see real-time color transitions for methyl violet, thymol blue, methyl orange, bromocresol green, methyl red, litmus, bromothymol blue, phenol red, phenolphthalein, and alizarin yellow R. Calculates [H⁺], [OH⁻], and pOH.