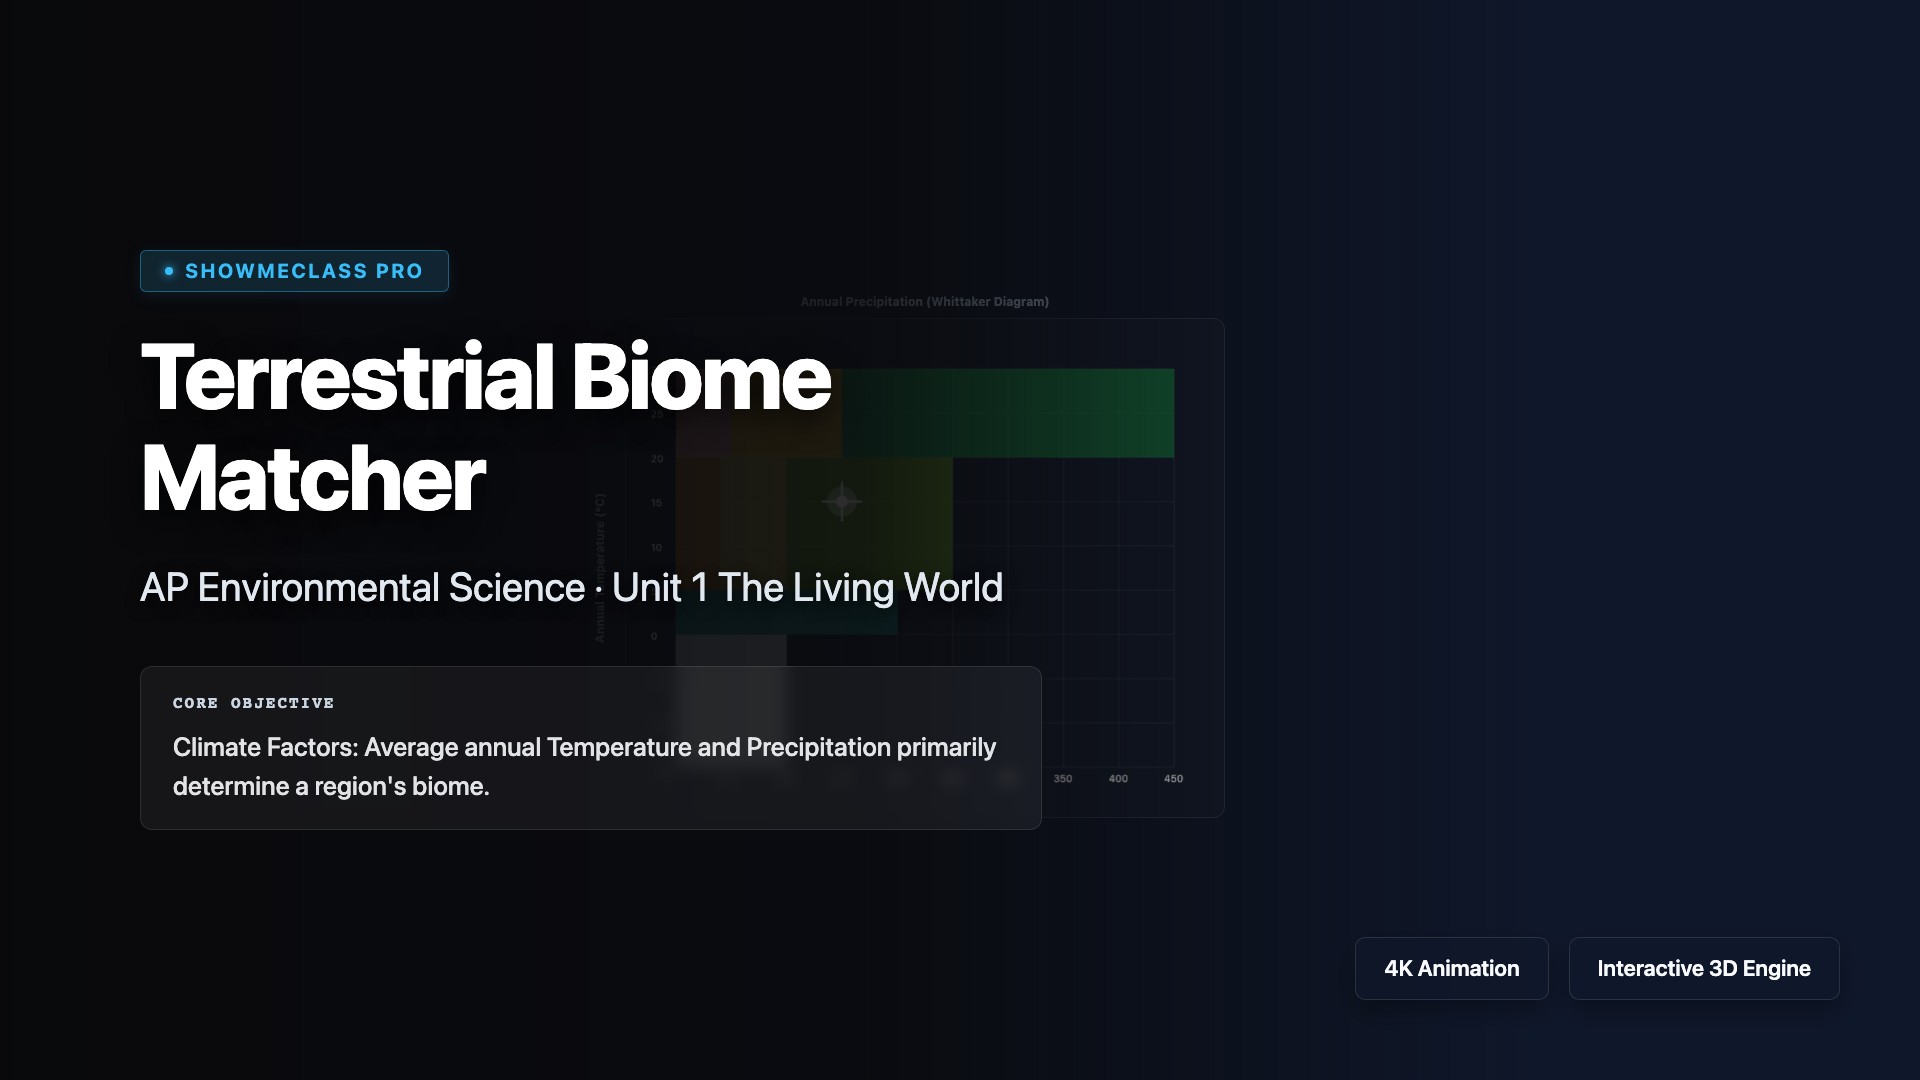
Terrestrial Biome Matcher
Interactive Whittaker Biome Plot mapping average annual temperature and precipitation to global terrestrial biomes, from Tundra to Tropical Rainforest.
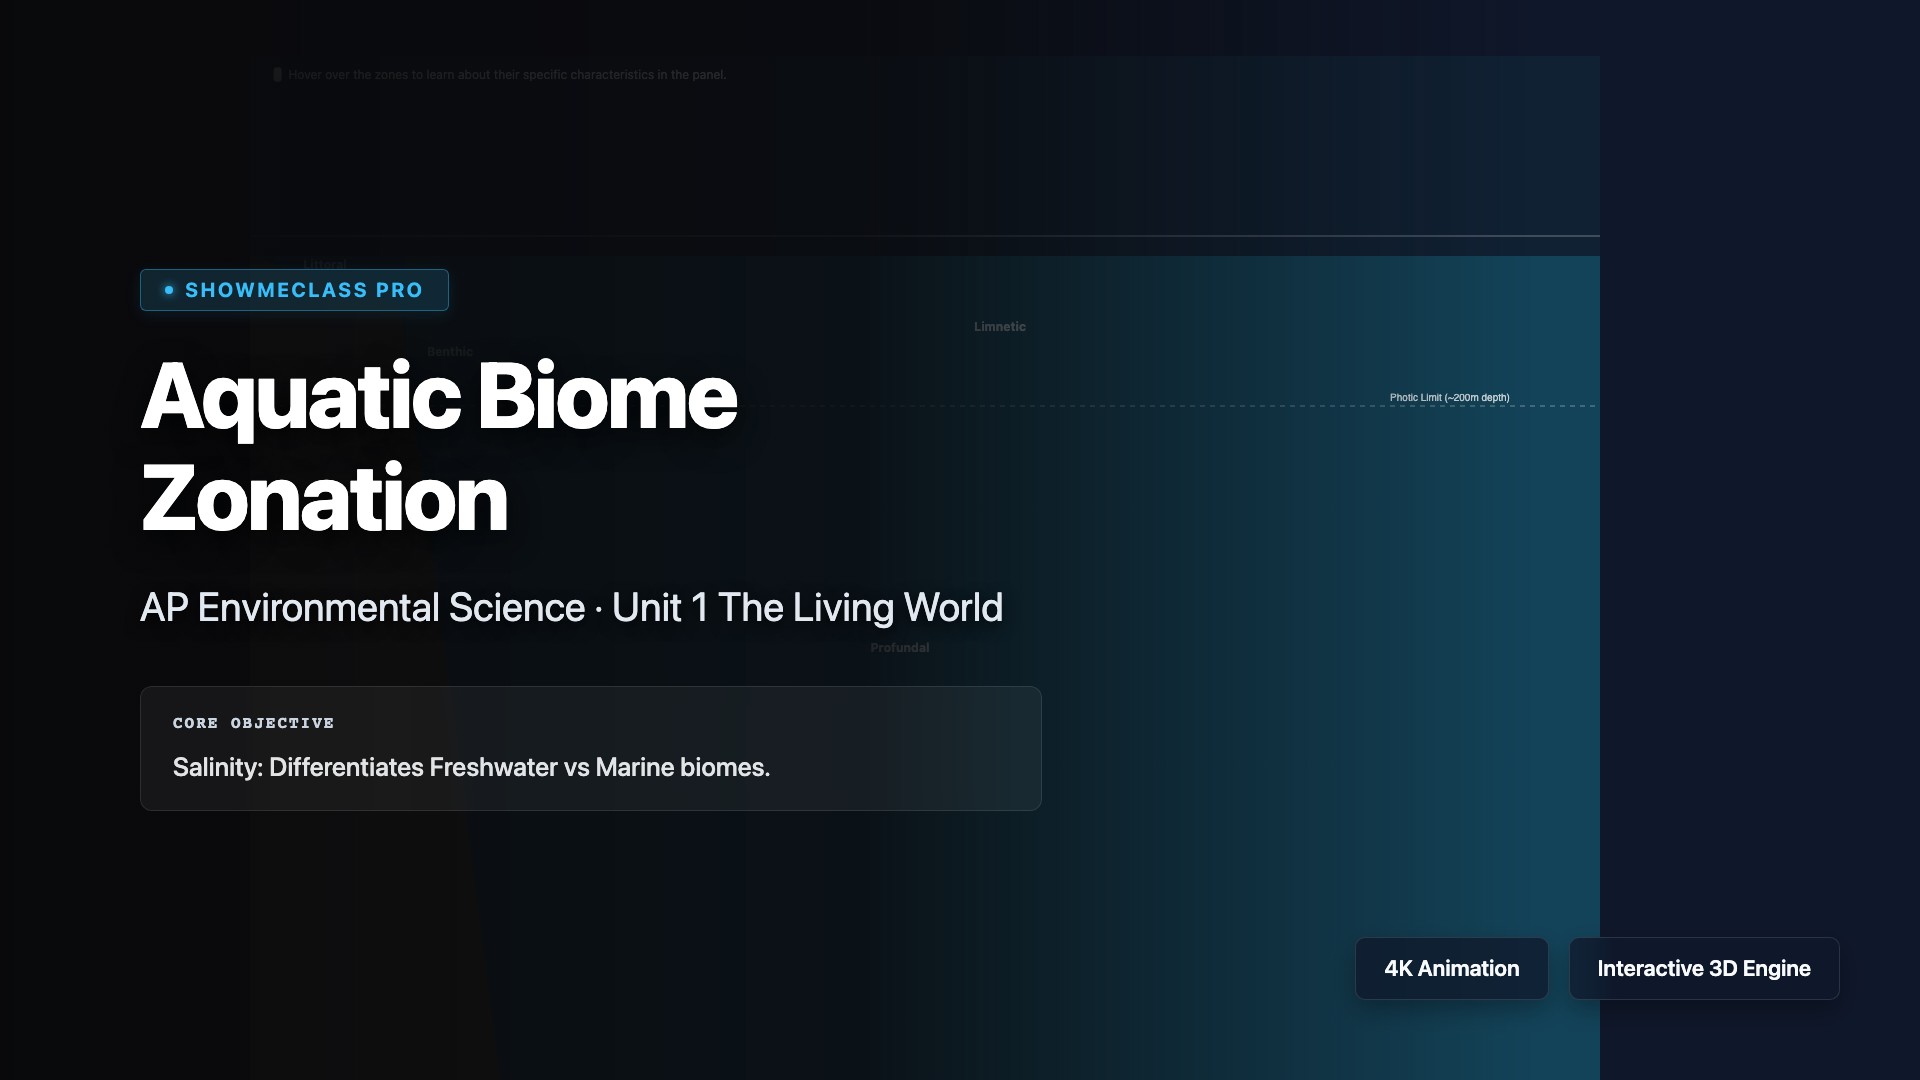
Aquatic Biome Zonation
Interactive diagram dividing Lakes and Oceans into standard ecological zones (Littoral, Limnetic, Benthic, Pelagic, Intertidal). Hover-based learning tool.
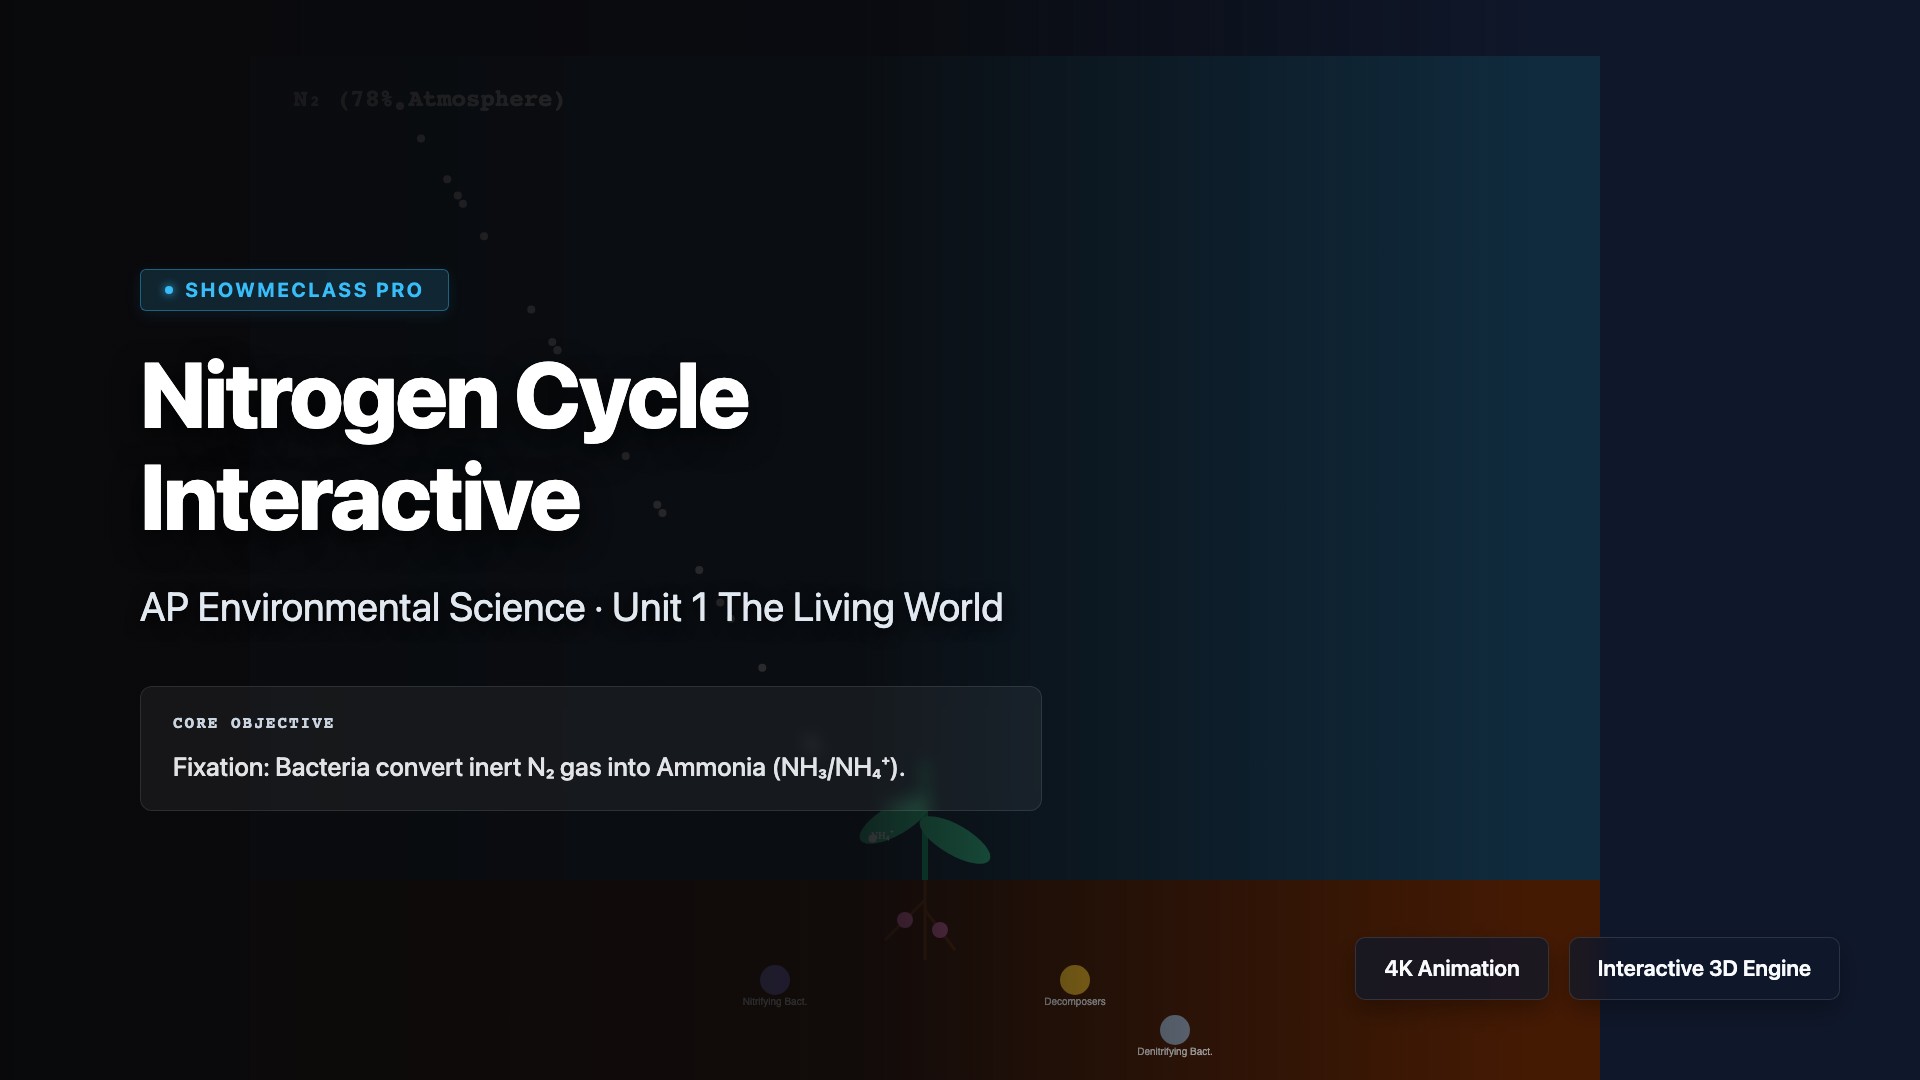
Nitrogen Cycle Interactive
Detailed APES Nitrogen Cycle interactive mapping the 5 chemical steps: Fixation, Nitrification, Assimilation, Ammonification, and Denitrification involving specific bacterial functions.
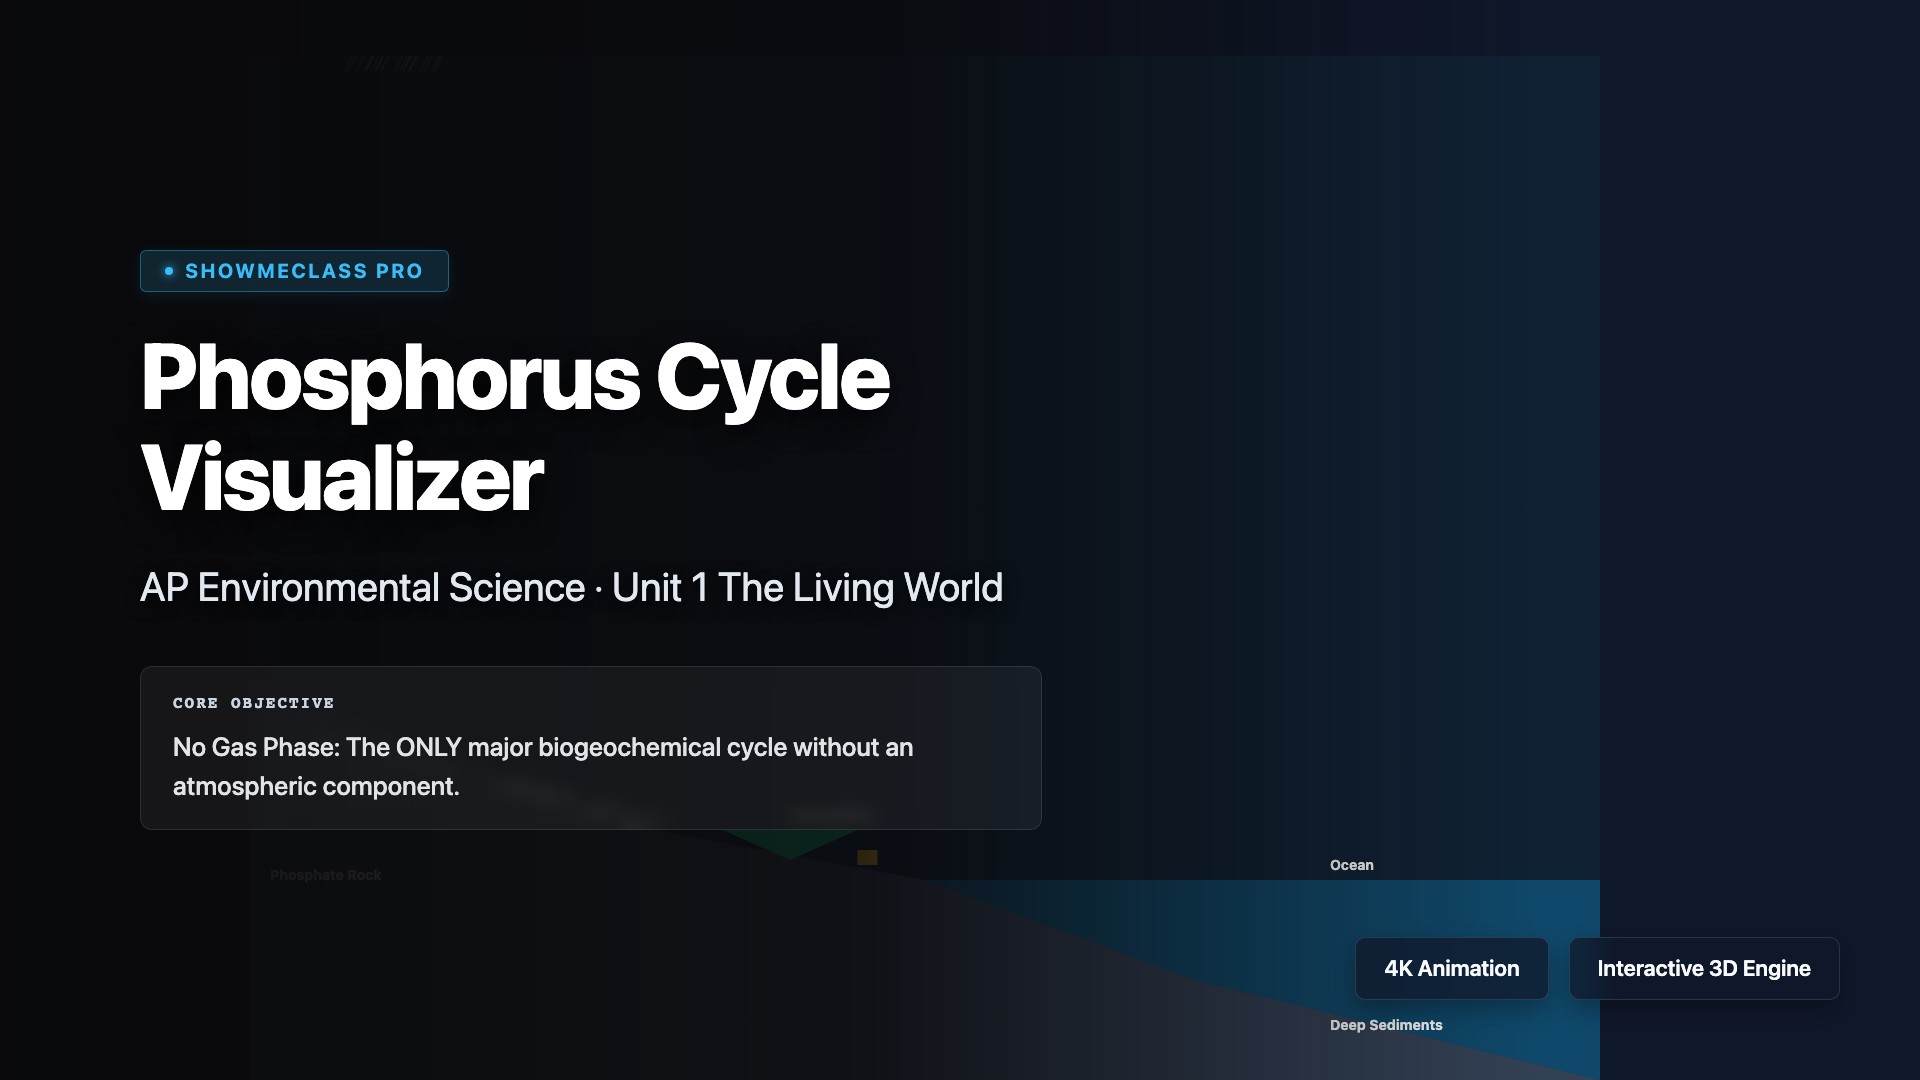
Phosphorus Cycle Visualizer
Phosphorus Cycle showing the absence of an atmospheric phase, slow rock weathering, biological assimilation into DNA/ATP, marine sedimentation, and long-term geologic uplift.
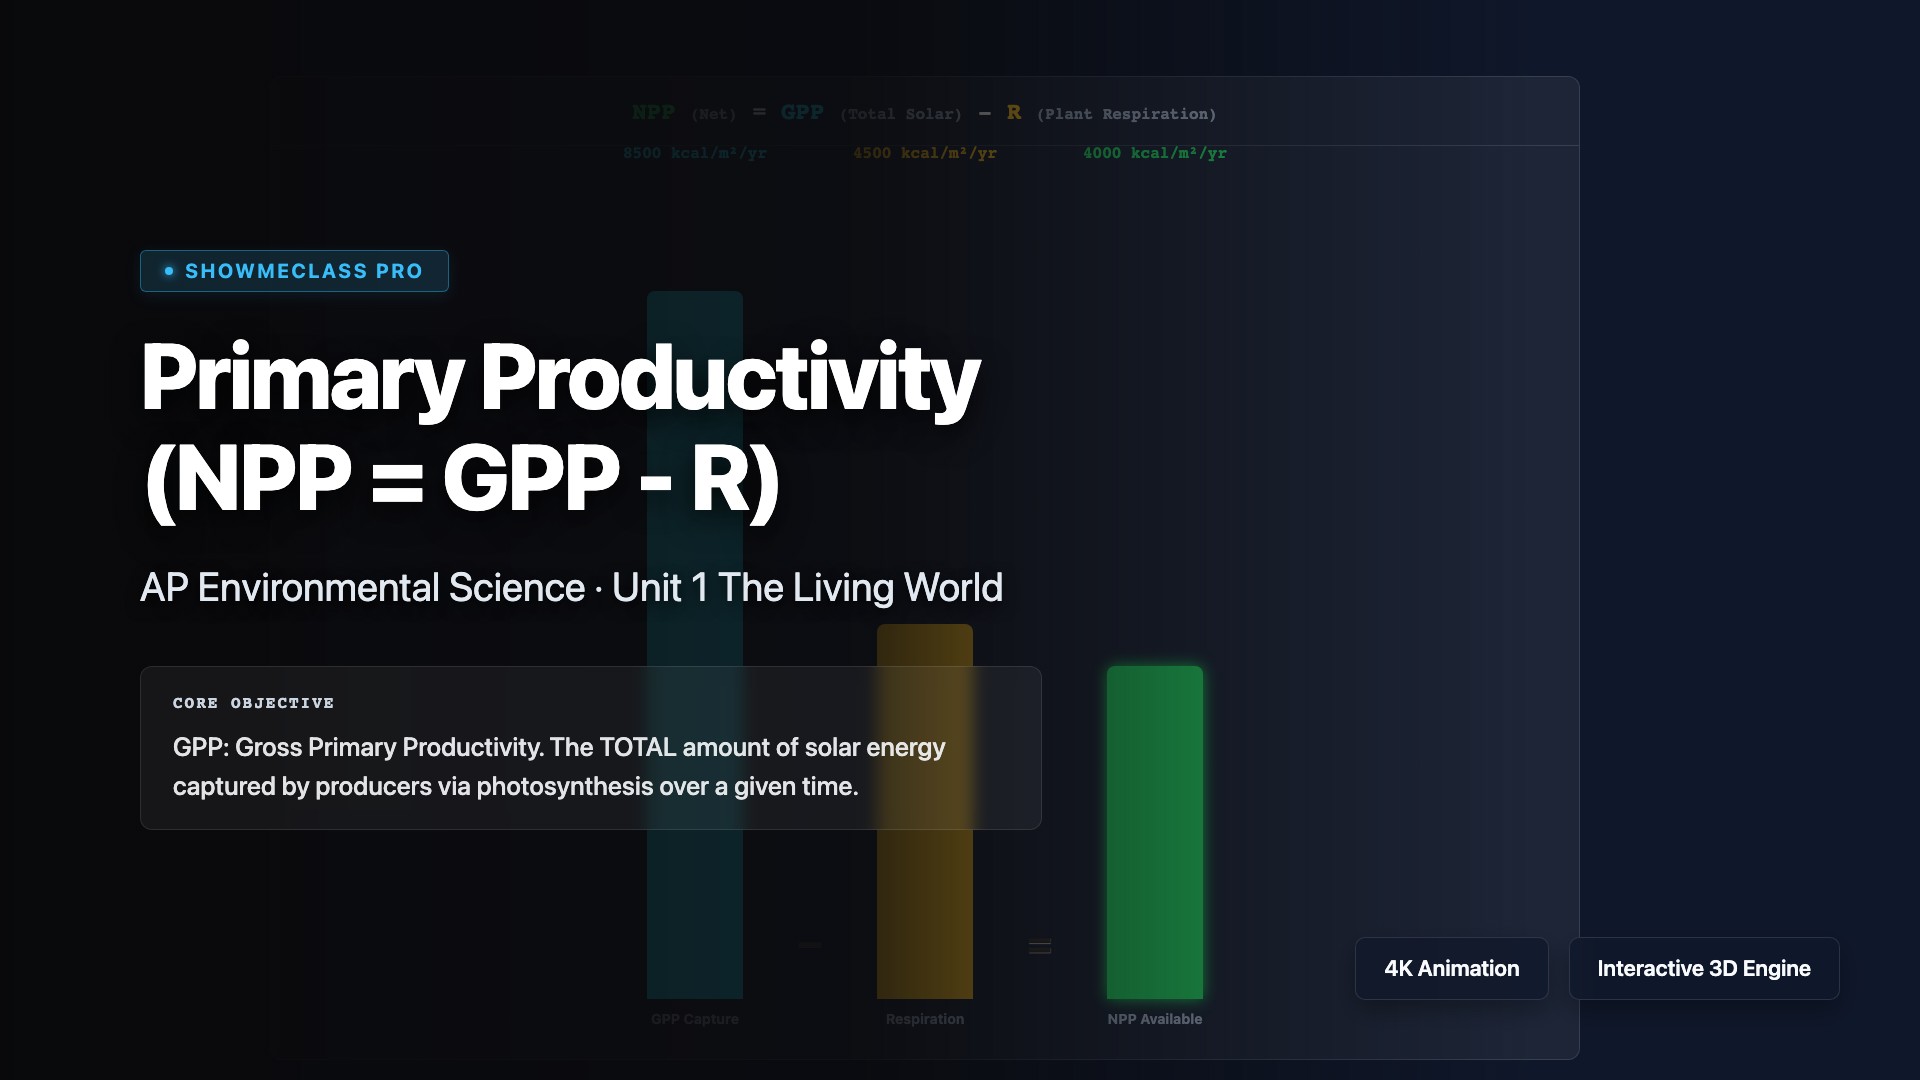
NPP & GPP Calculator
Tool to calculate and visualize Net Primary Productivity (NPP = GPP - Respiration). Explores the distinct productivity rates across various global biomes.