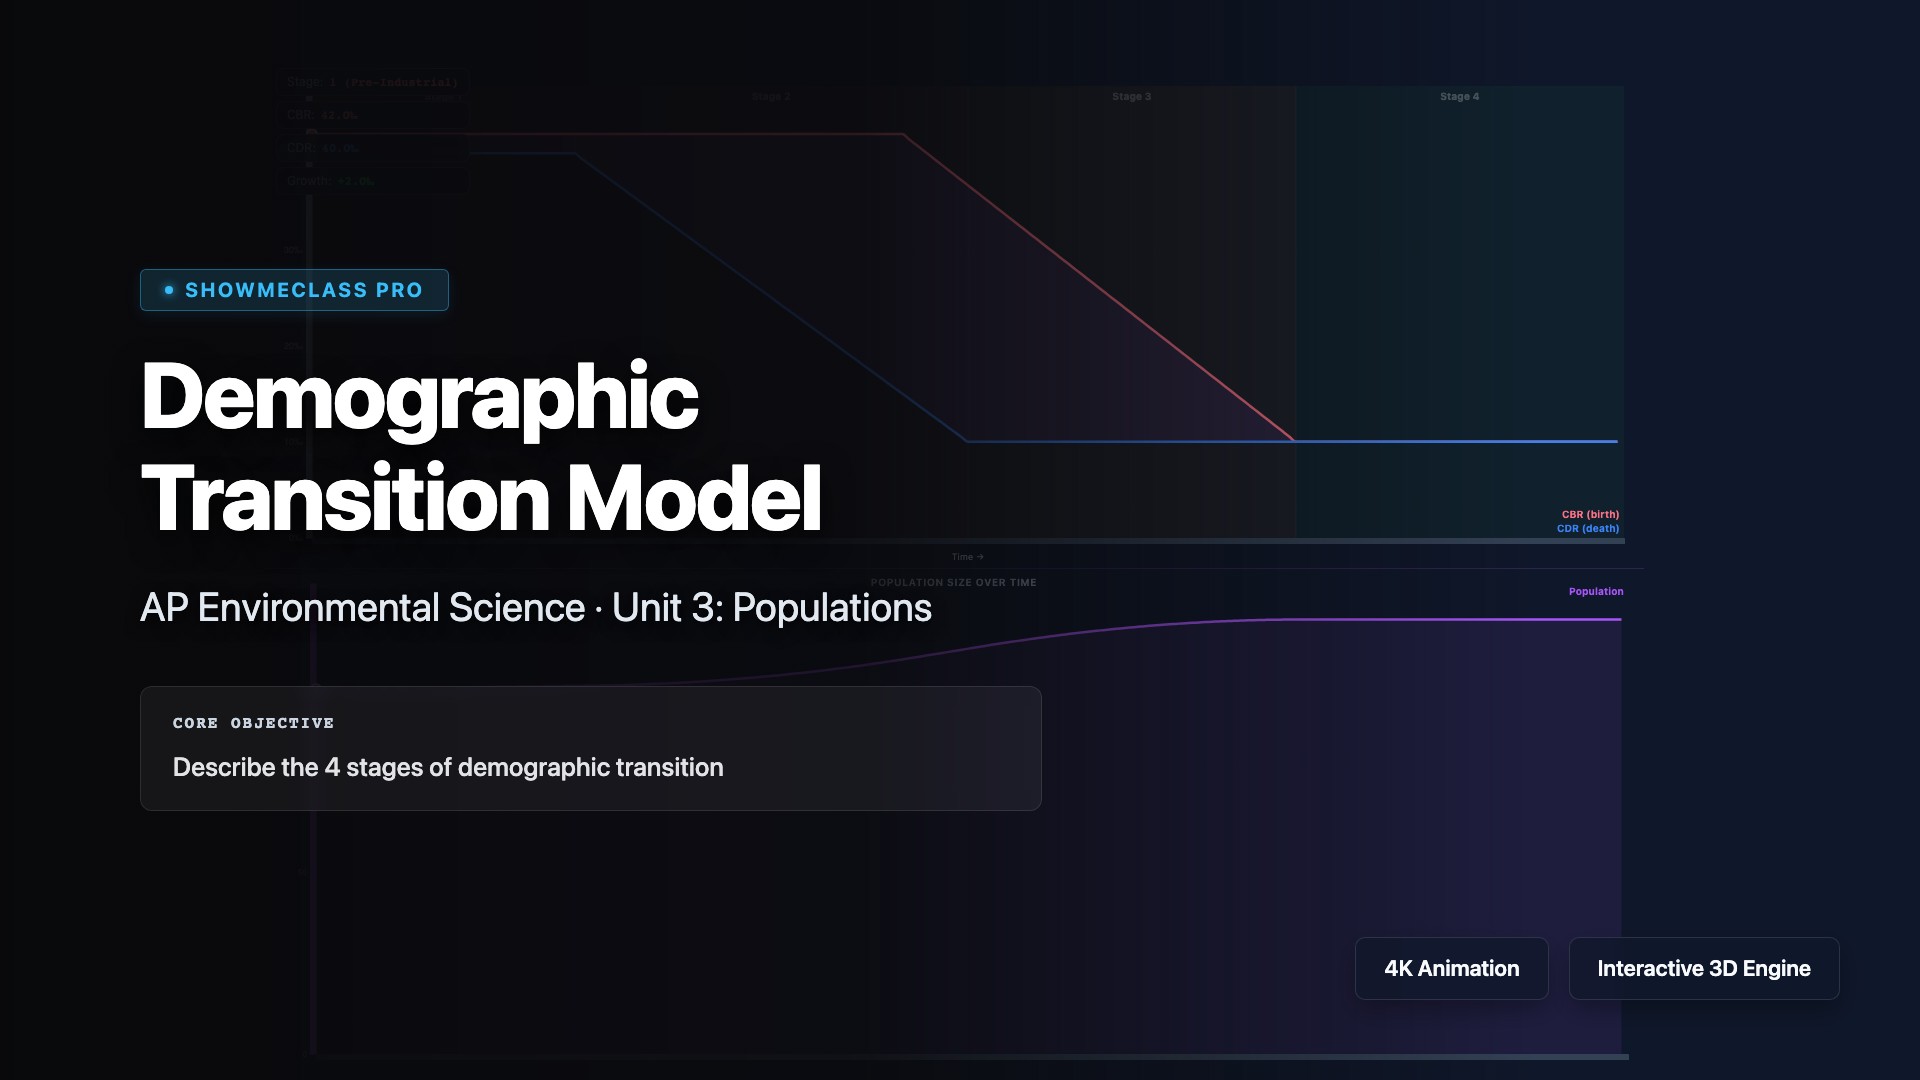
Demographic Transition Model
Explore the Demographic Transition Model (DTM) that describes population changes as countries develop economically. Visualize the five stages: Stage 1 (high birth and death rates, stable population), Stage 2 (declining death rates, population explosion), Stage 3 (declining birth rates, slowing growth), Stage 4 (low birth and death rates, stable population), and Stage 5 (declining population). Understand how industrialization, healthcare, education, and women's empowerment drive demographic shifts.
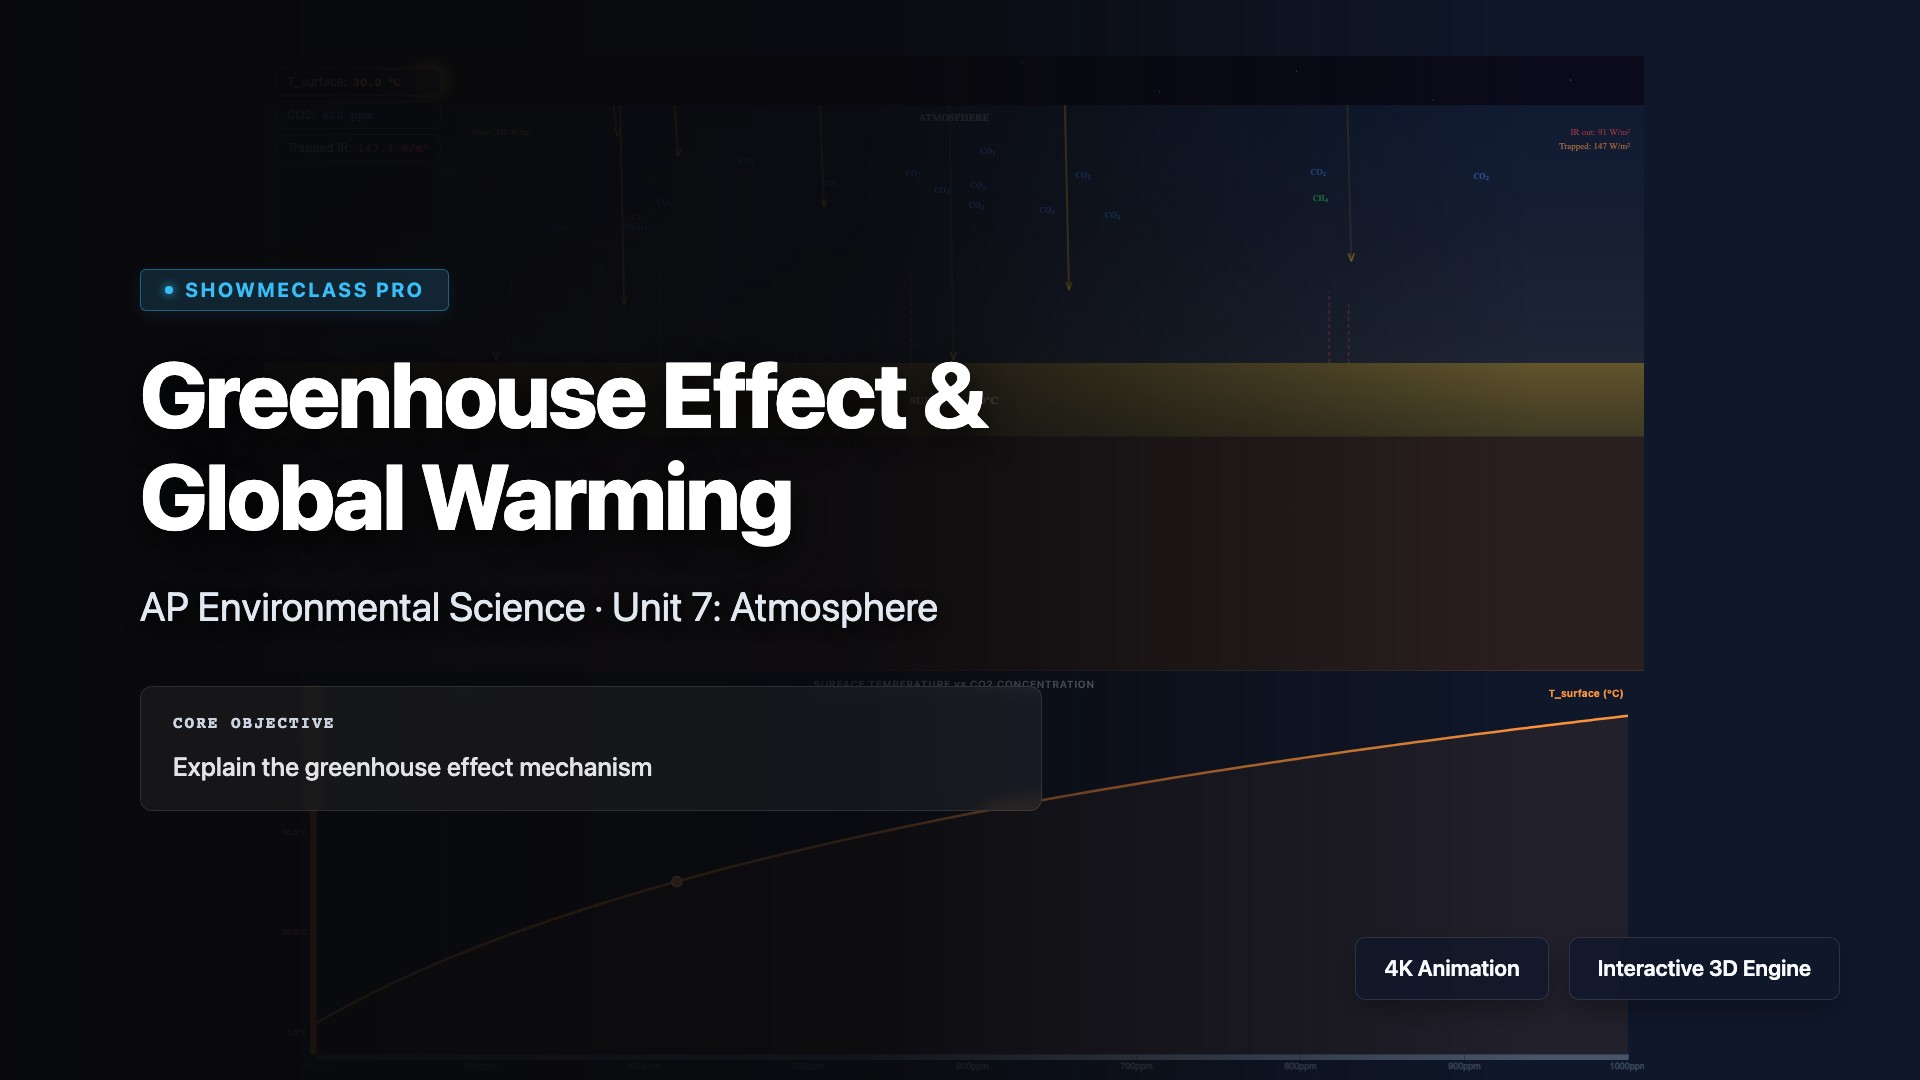
Greenhouse Effect & Global Warming
Understand the greenhouse effect where atmospheric gases trap infrared radiation, warming Earth's surface. Visualize how solar radiation passes through the atmosphere, Earth absorbs and re-emits it as infrared, and greenhouse gases (CO₂, CH₄, N₂O, water vapor) absorb this heat. Explore how increased greenhouse gas concentrations from human activities enhance this natural effect, causing global warming, climate change, sea level rise, and ecosystem disruption.
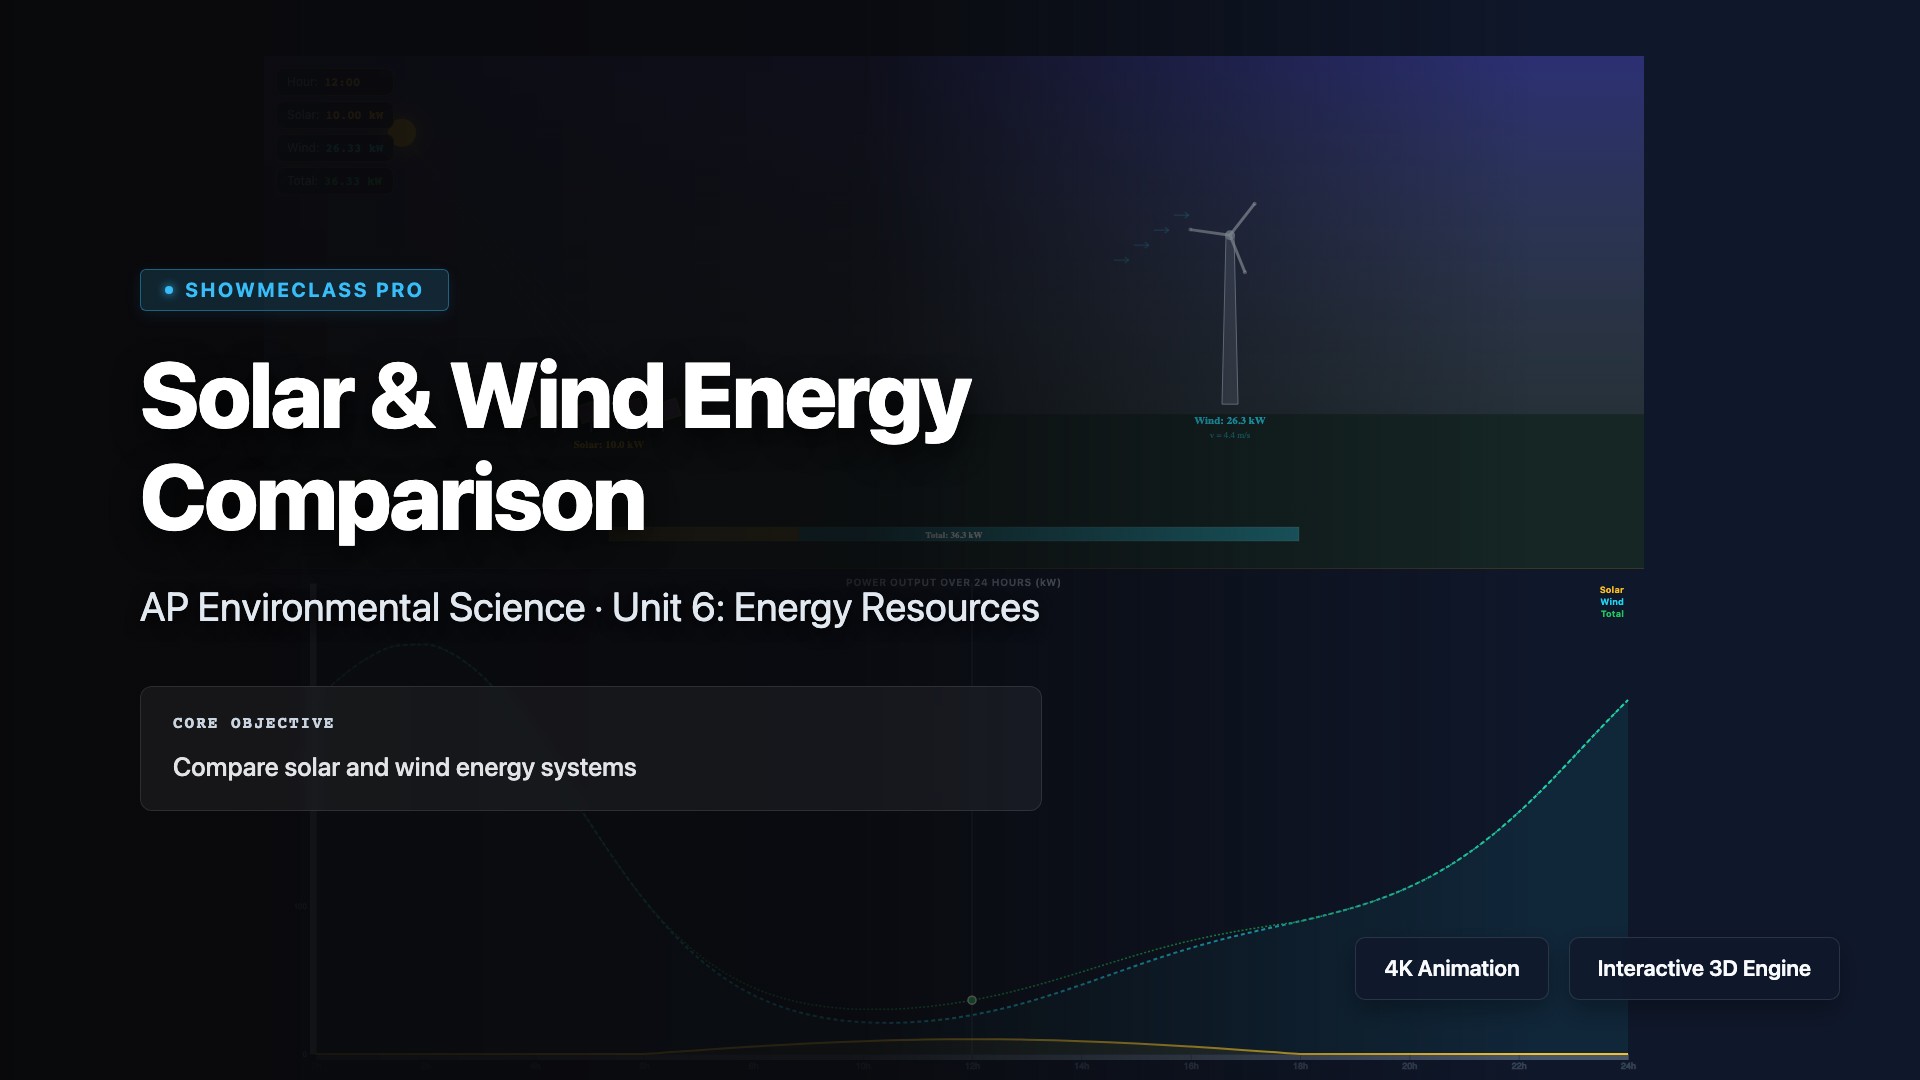
Solar & Wind Energy Comparison
Compare solar and wind energy as renewable alternatives to fossil fuels. Analyze photovoltaic cells converting sunlight to electricity versus wind turbines harnessing kinetic energy. Evaluate advantages (clean, renewable, decreasing costs) and disadvantages (intermittency, land use, initial investment, energy storage needs). Understand capacity factors, geographic suitability, environmental impacts, and how these technologies contribute to sustainable energy transitions and climate change mitigation.
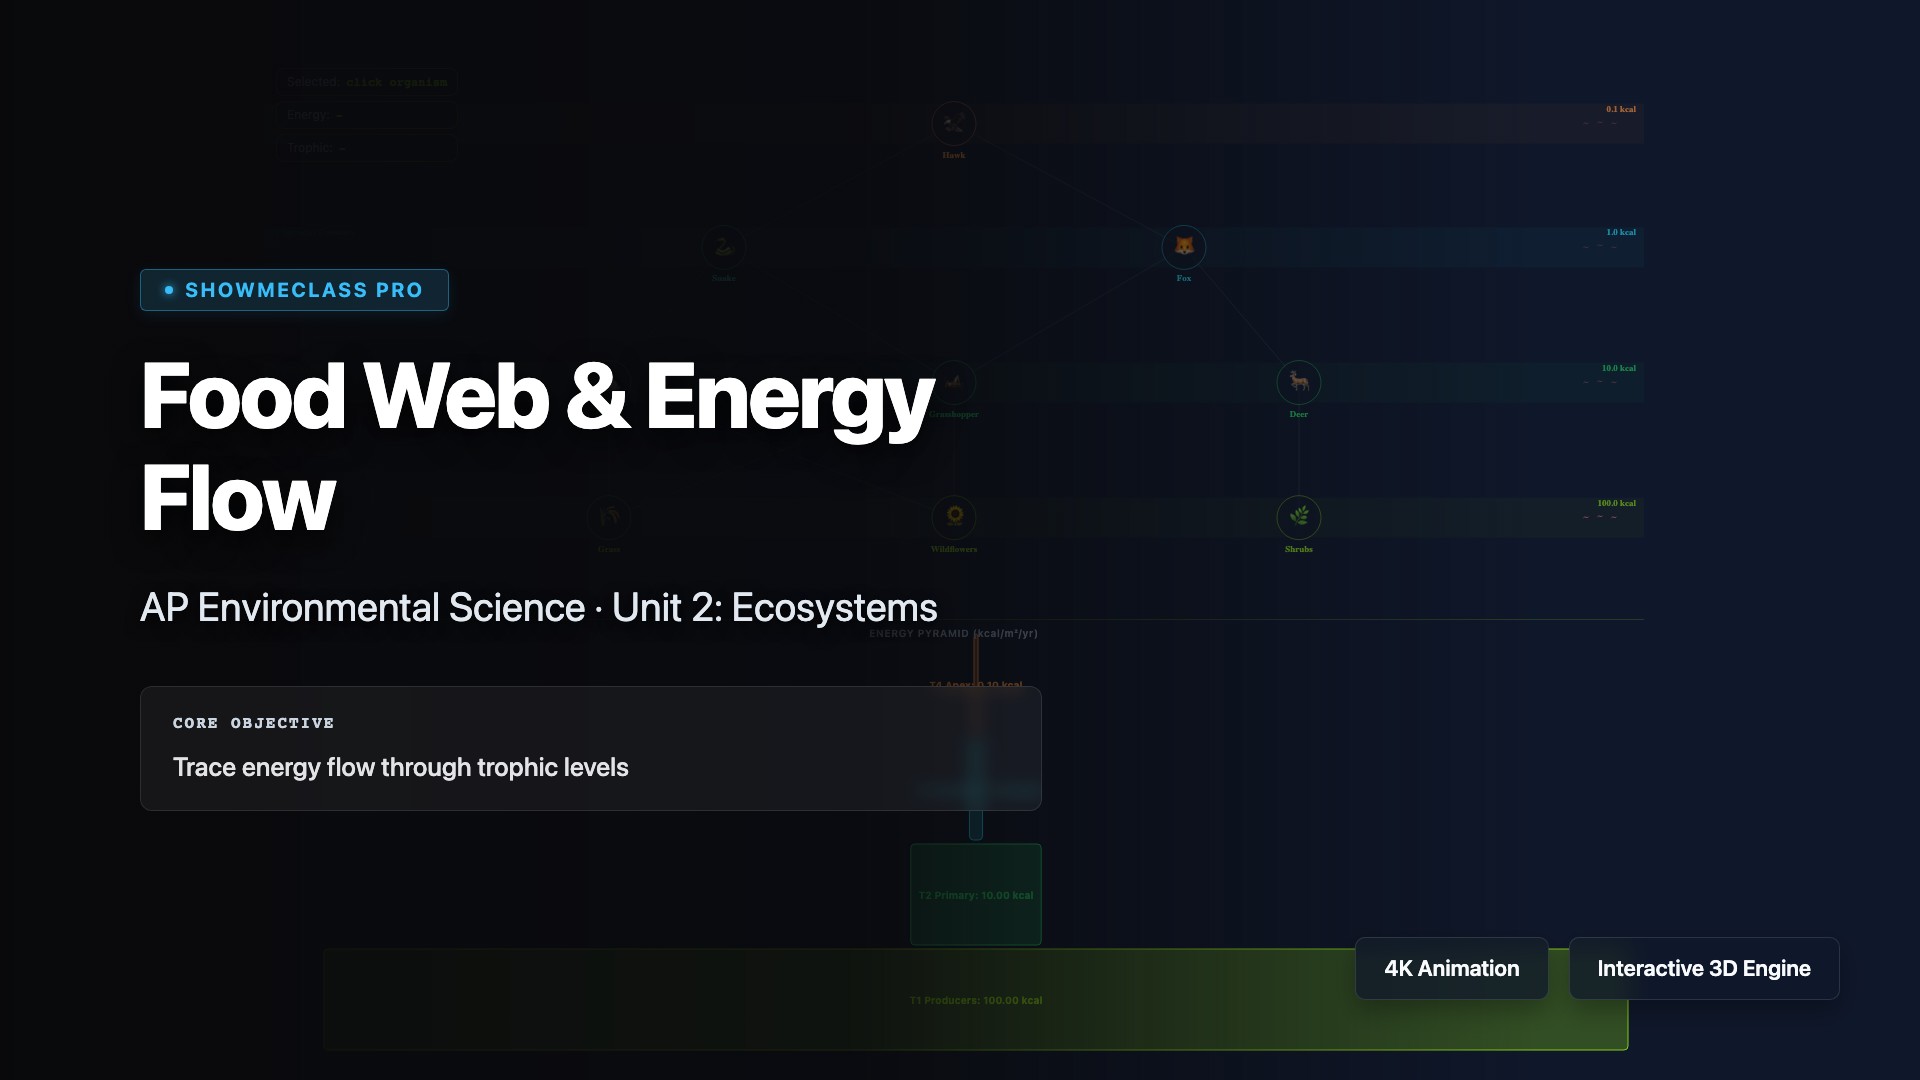
Food Web & Energy Flow
Visualize food webs showing feeding relationships and energy flow through ecosystems. Explore trophic levels from producers (autotrophs capturing solar energy) through primary consumers (herbivores), secondary consumers (carnivores), tertiary consumers, and decomposers. Understand the 10% rule where only about 10% of energy transfers between trophic levels, explaining why food chains rarely exceed 4-5 levels and why biomass pyramids taper toward top predators.
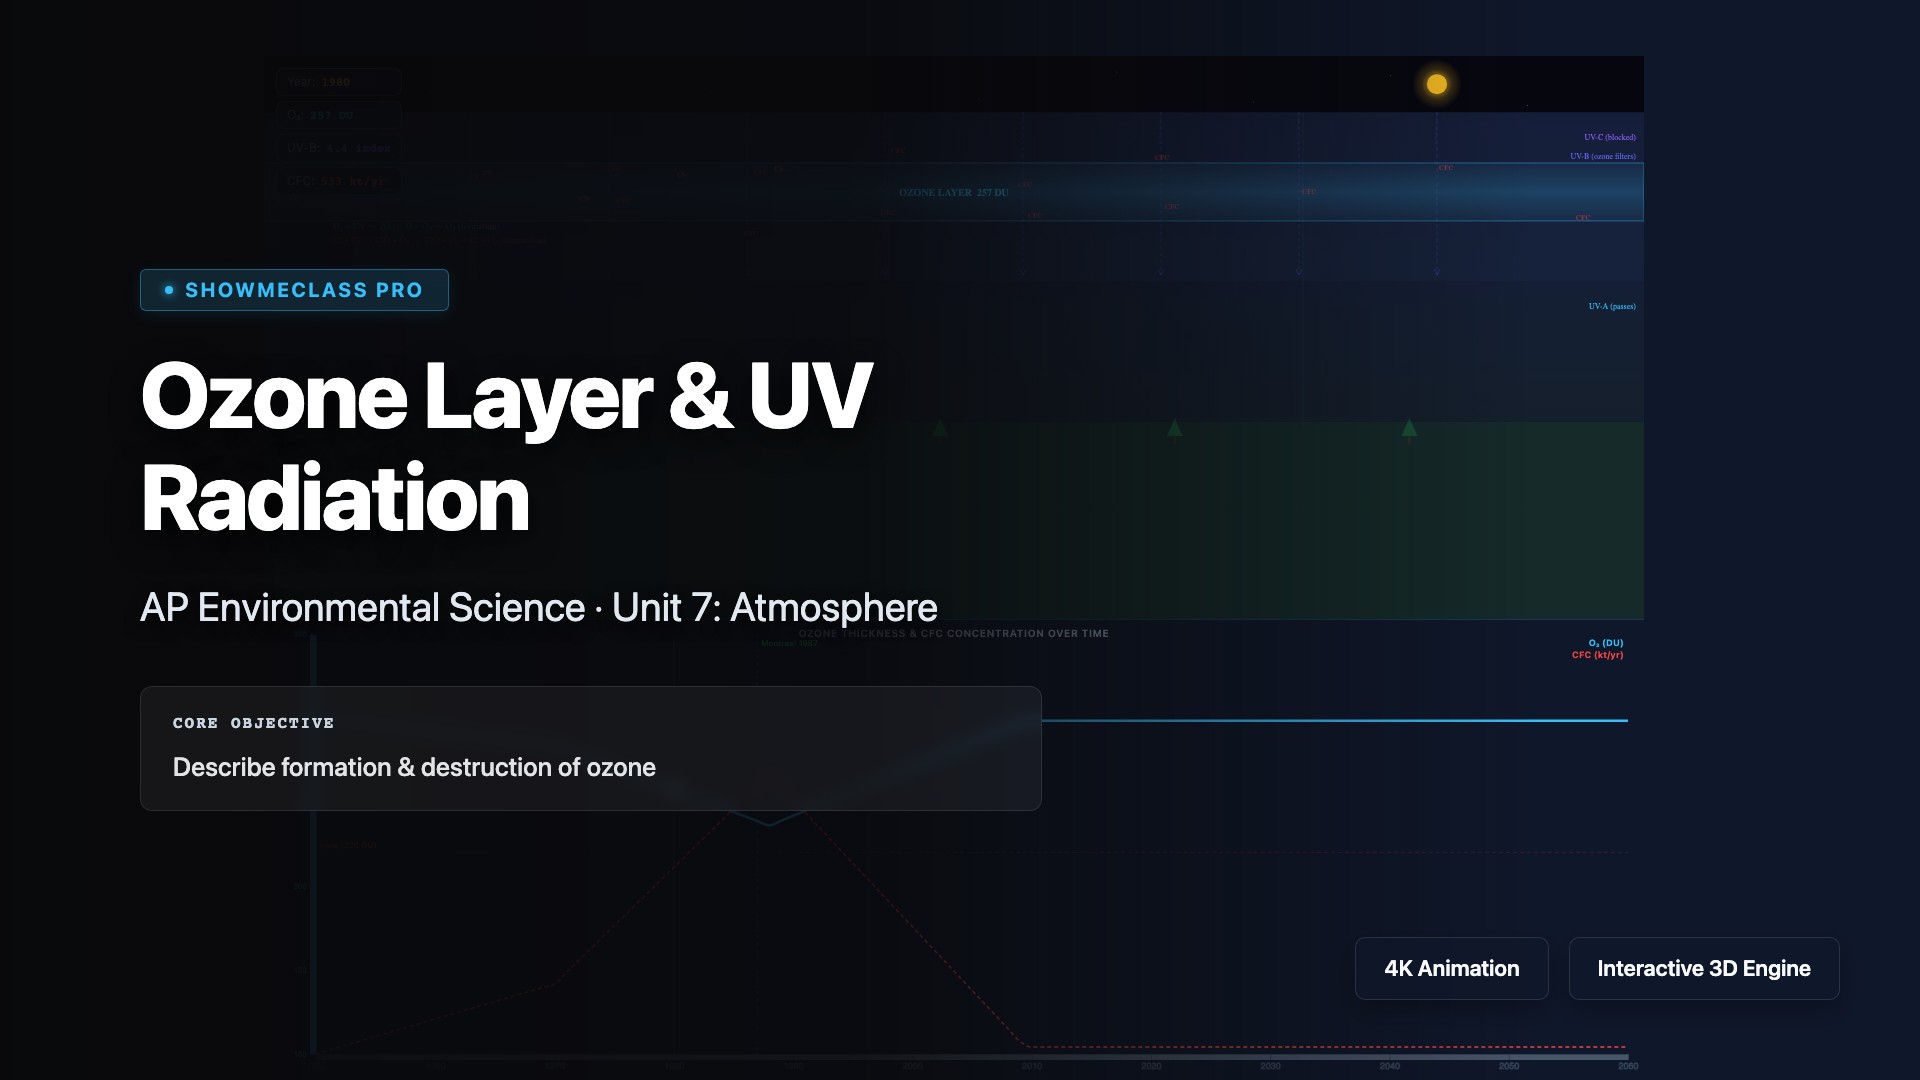
Ozone Layer & UV Radiation
Explore the stratospheric ozone layer that absorbs harmful ultraviolet (UV) radiation, protecting life on Earth. Understand how chlorofluorocarbons (CFCs) from aerosols and refrigerants catalytically destroy ozone molecules, creating the ozone hole over Antarctica. Learn about the Montreal Protocol (1987), the most successful international environmental agreement, which phased out ozone-depleting substances and enabled ozone layer recovery.
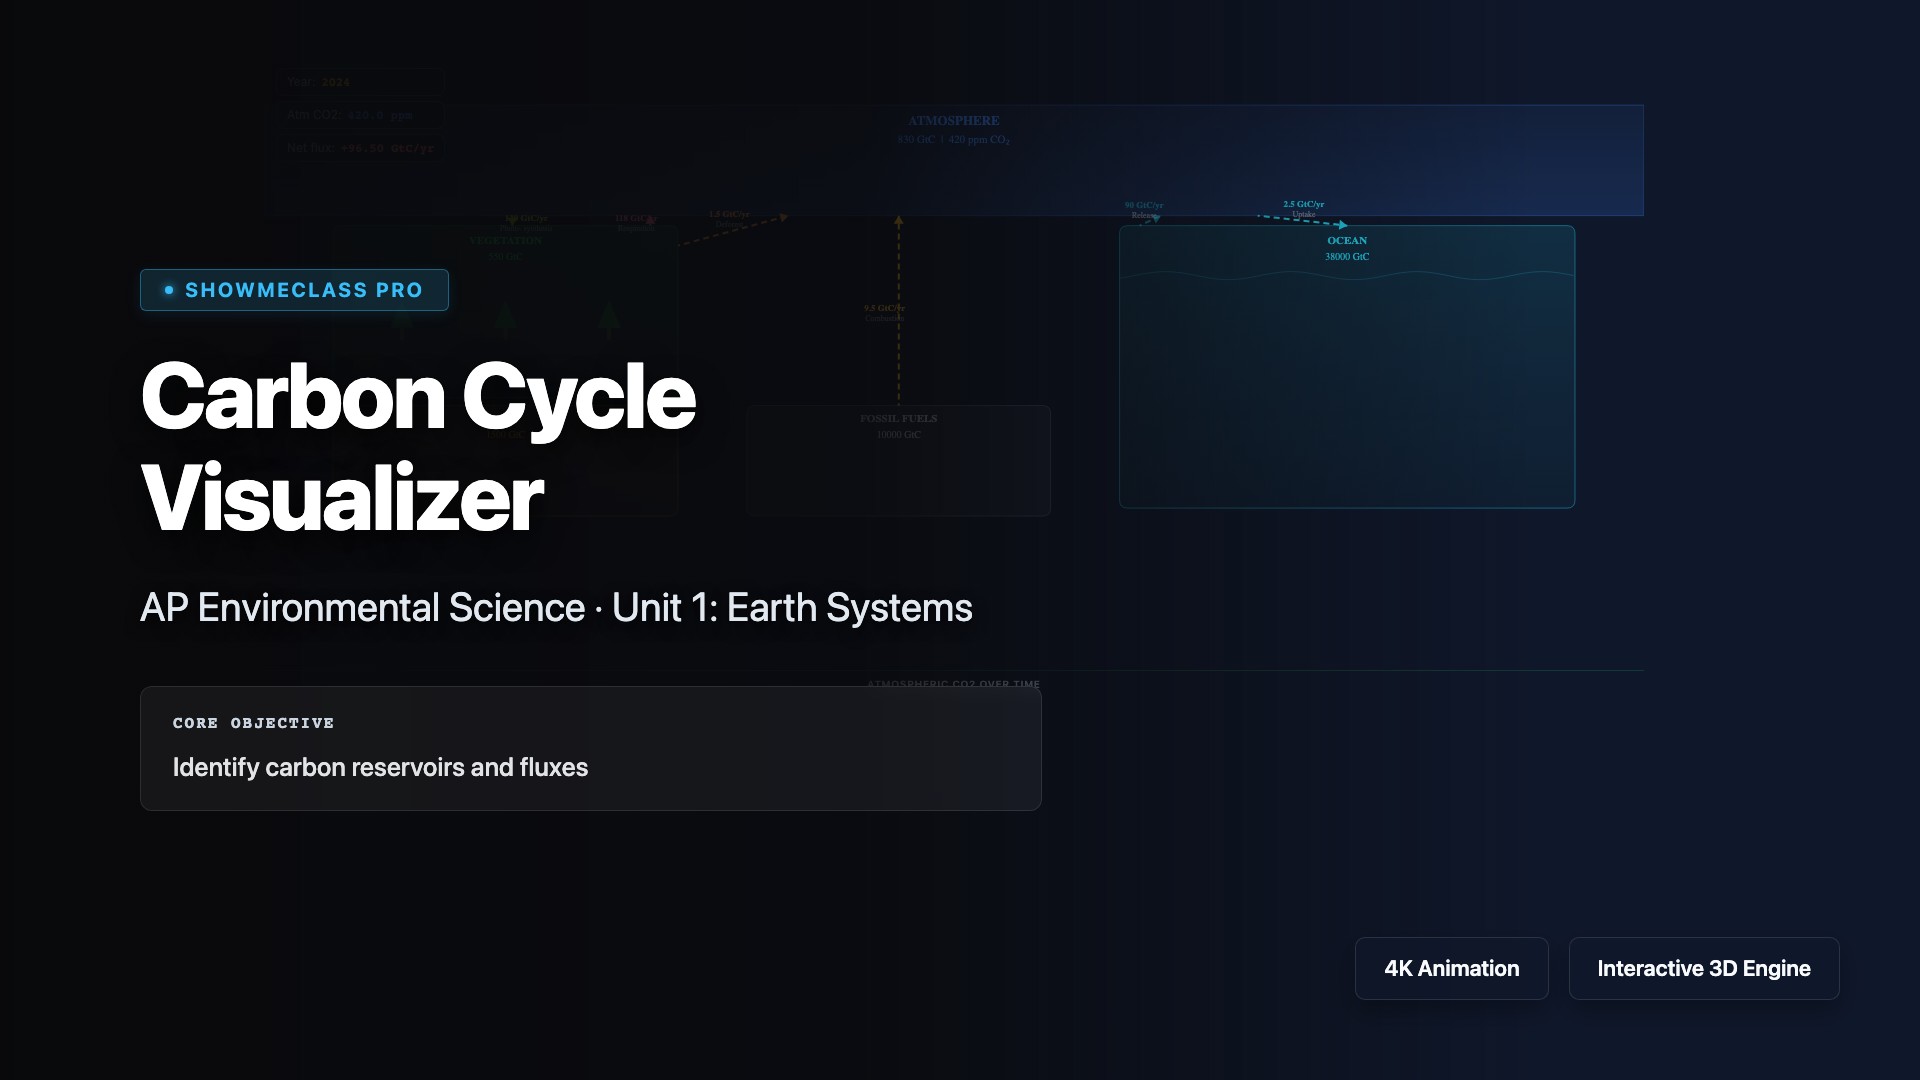
Carbon Cycle Visualizer
Visualize the carbon cycle showing how carbon moves between the atmosphere, biosphere, hydrosphere, and geosphere. Explore processes including photosynthesis (carbon fixation), cellular respiration (carbon release), decomposition, fossil fuel combustion, ocean absorption, and geological sequestration. Understand how human activities like deforestation and burning fossil fuels disrupt the natural carbon balance, contributing to increased atmospheric CO₂ and climate change.