
Velocity
Analyze velocity-time graphs to understand motion characteristics. Learn that the slope of a v-t graph gives acceleration, and the area under the curve represents displacement. Practice interpreting constant velocity (horizontal line), constant acceleration (straight slope), and changing acceleration (curved line). Understand how positive/negative slopes indicate speeding up/slowing down, and how the graph connects to position-time and acceleration-time representations of motion.
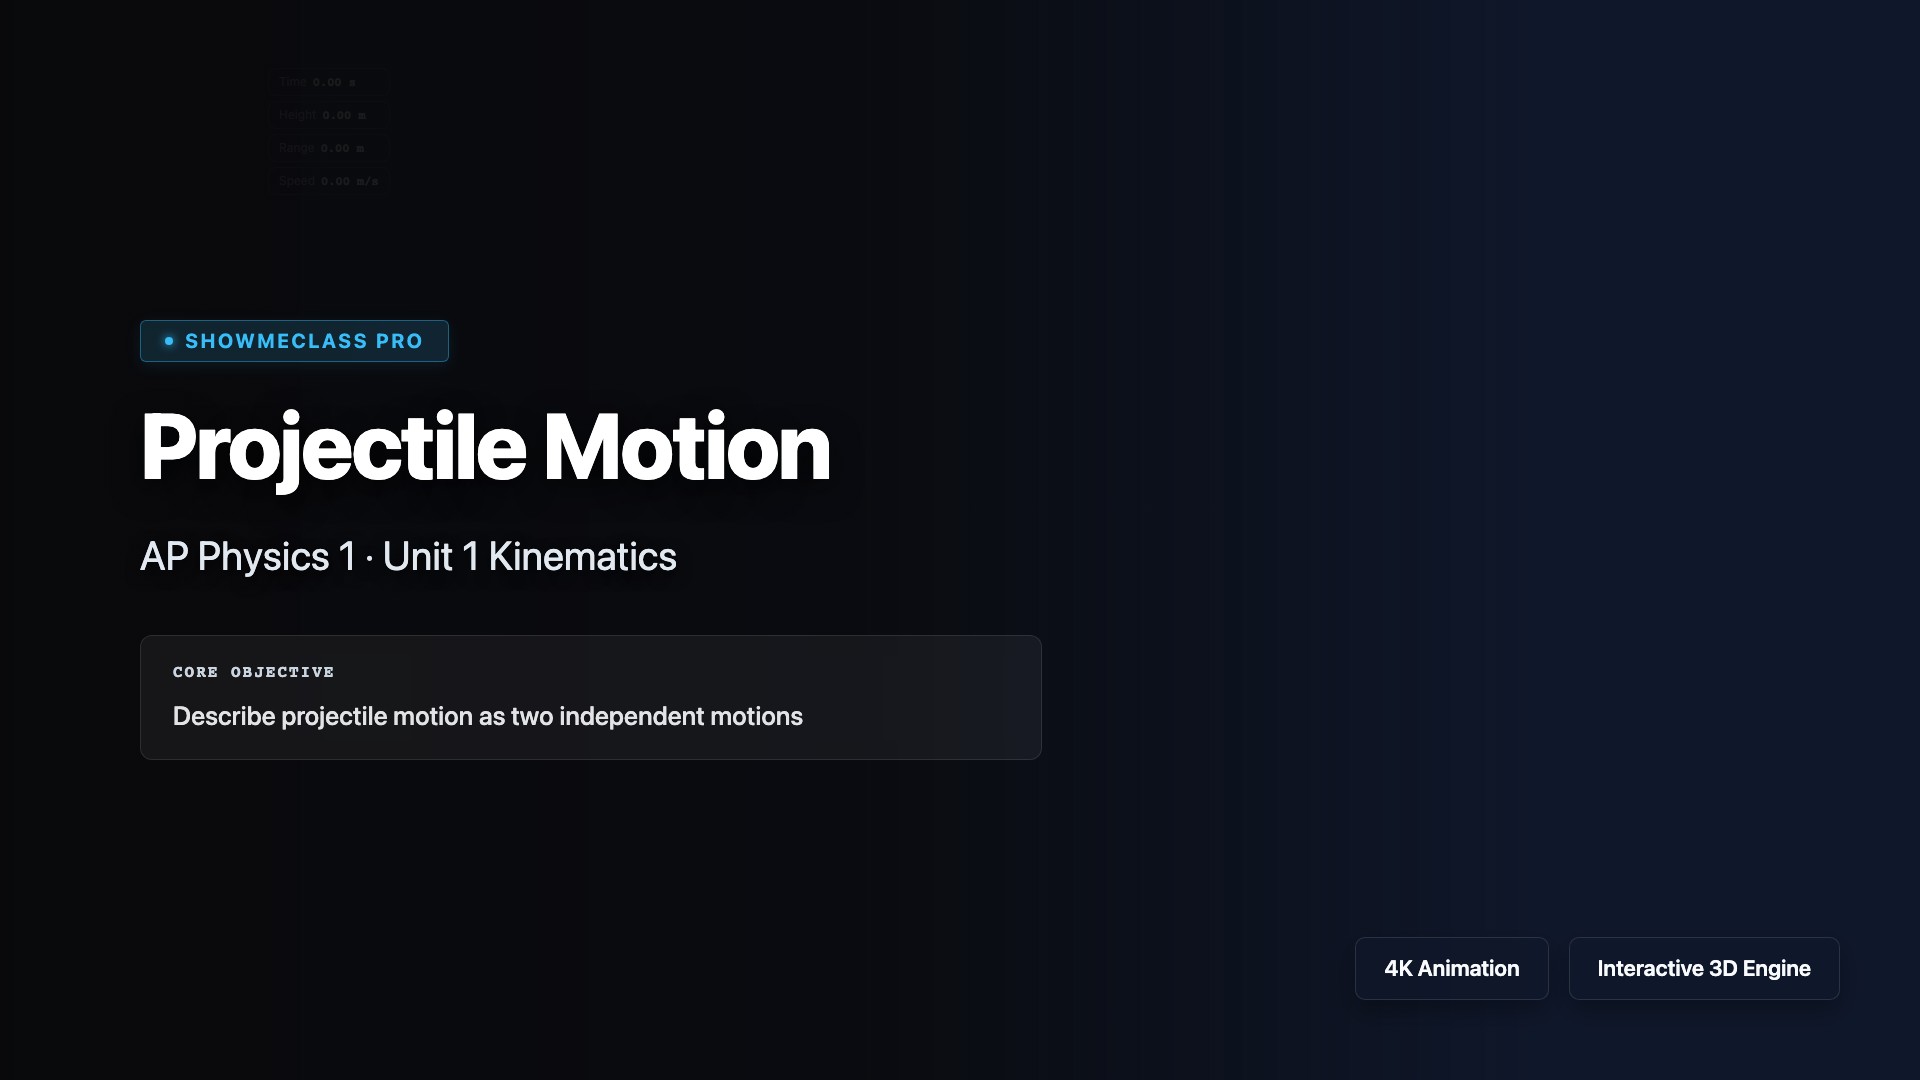
Projectile Motion
Visualize 2D projectile trajectories with adjustable launch angle, initial velocity, and gravitational acceleration. Observe how each parameter affects range, maximum height, and time of flight in real time.
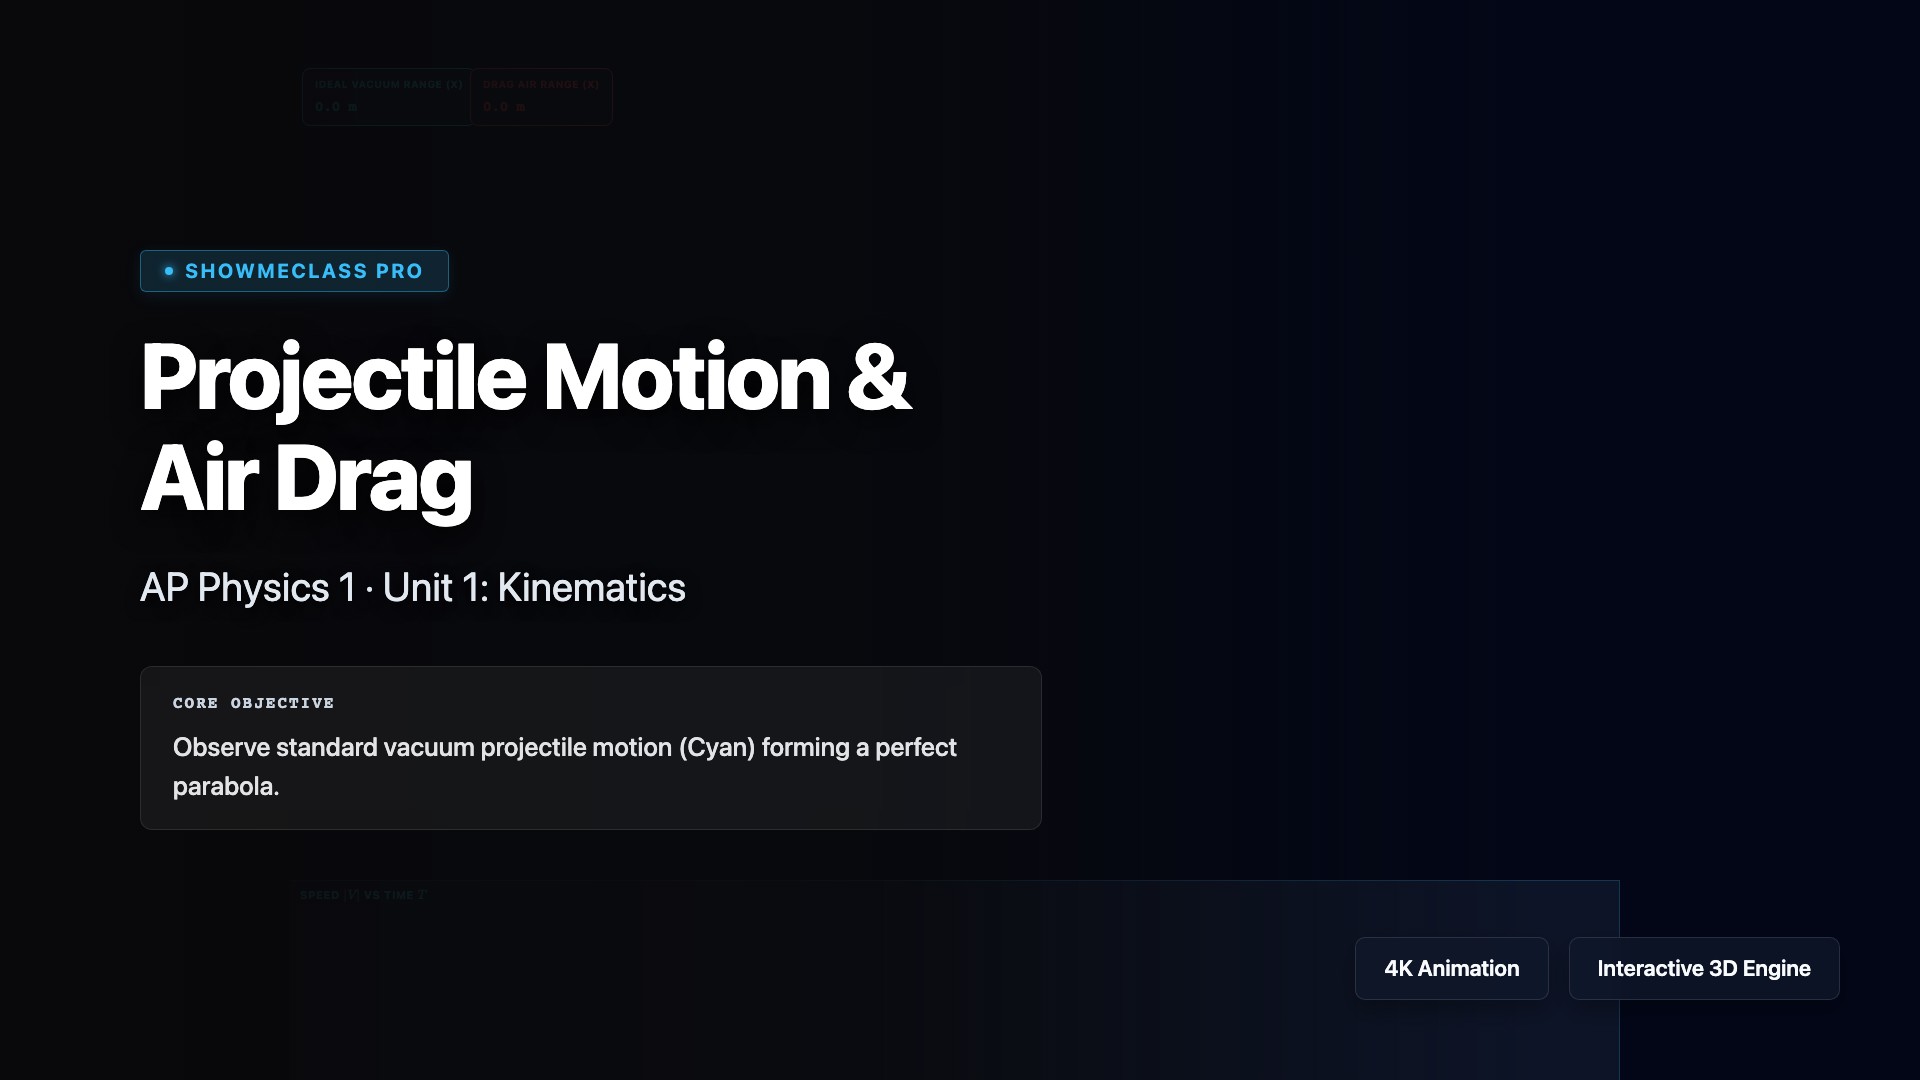
Projectile Motion & Air Drag
Interactive 3D physics simulator comparing ideal projectile motion to realistic air resistance. Graph terminal velocity and explore nonlinear trajectories.
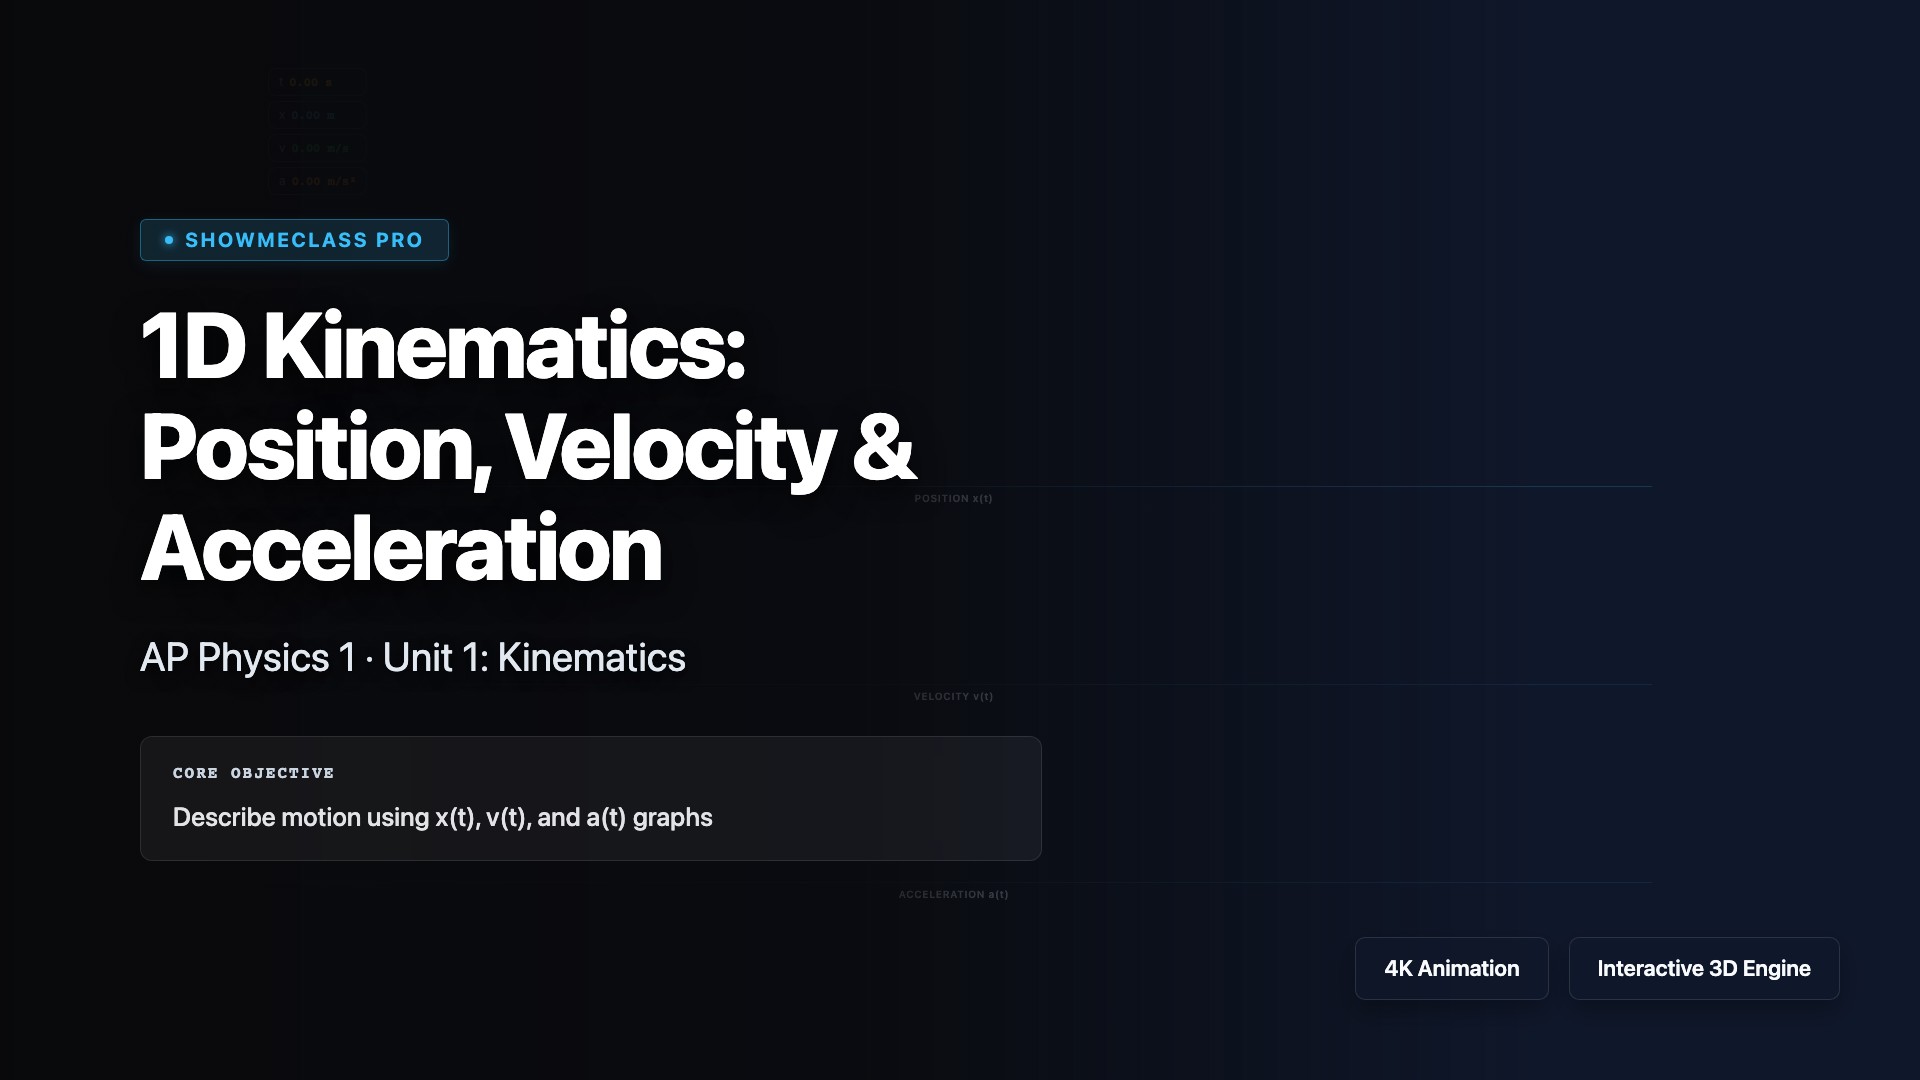
1D Kinematics: Position, Velocity & Acceleration
Explore one-dimensional motion through position-time, velocity-time, and acceleration-time graphs. Understand that velocity is the derivative of position (v = dx/dt) and acceleration is the derivative of velocity (a = dv/dt). Practice using kinematic equations for constant acceleration: v = v₀ + at, x = x₀ + v₀t + ½at², and v² = v₀² + 2aΔx. Interpret graph slopes and areas to analyze motion, and solve problems involving free fall, braking, and accelerating objects.
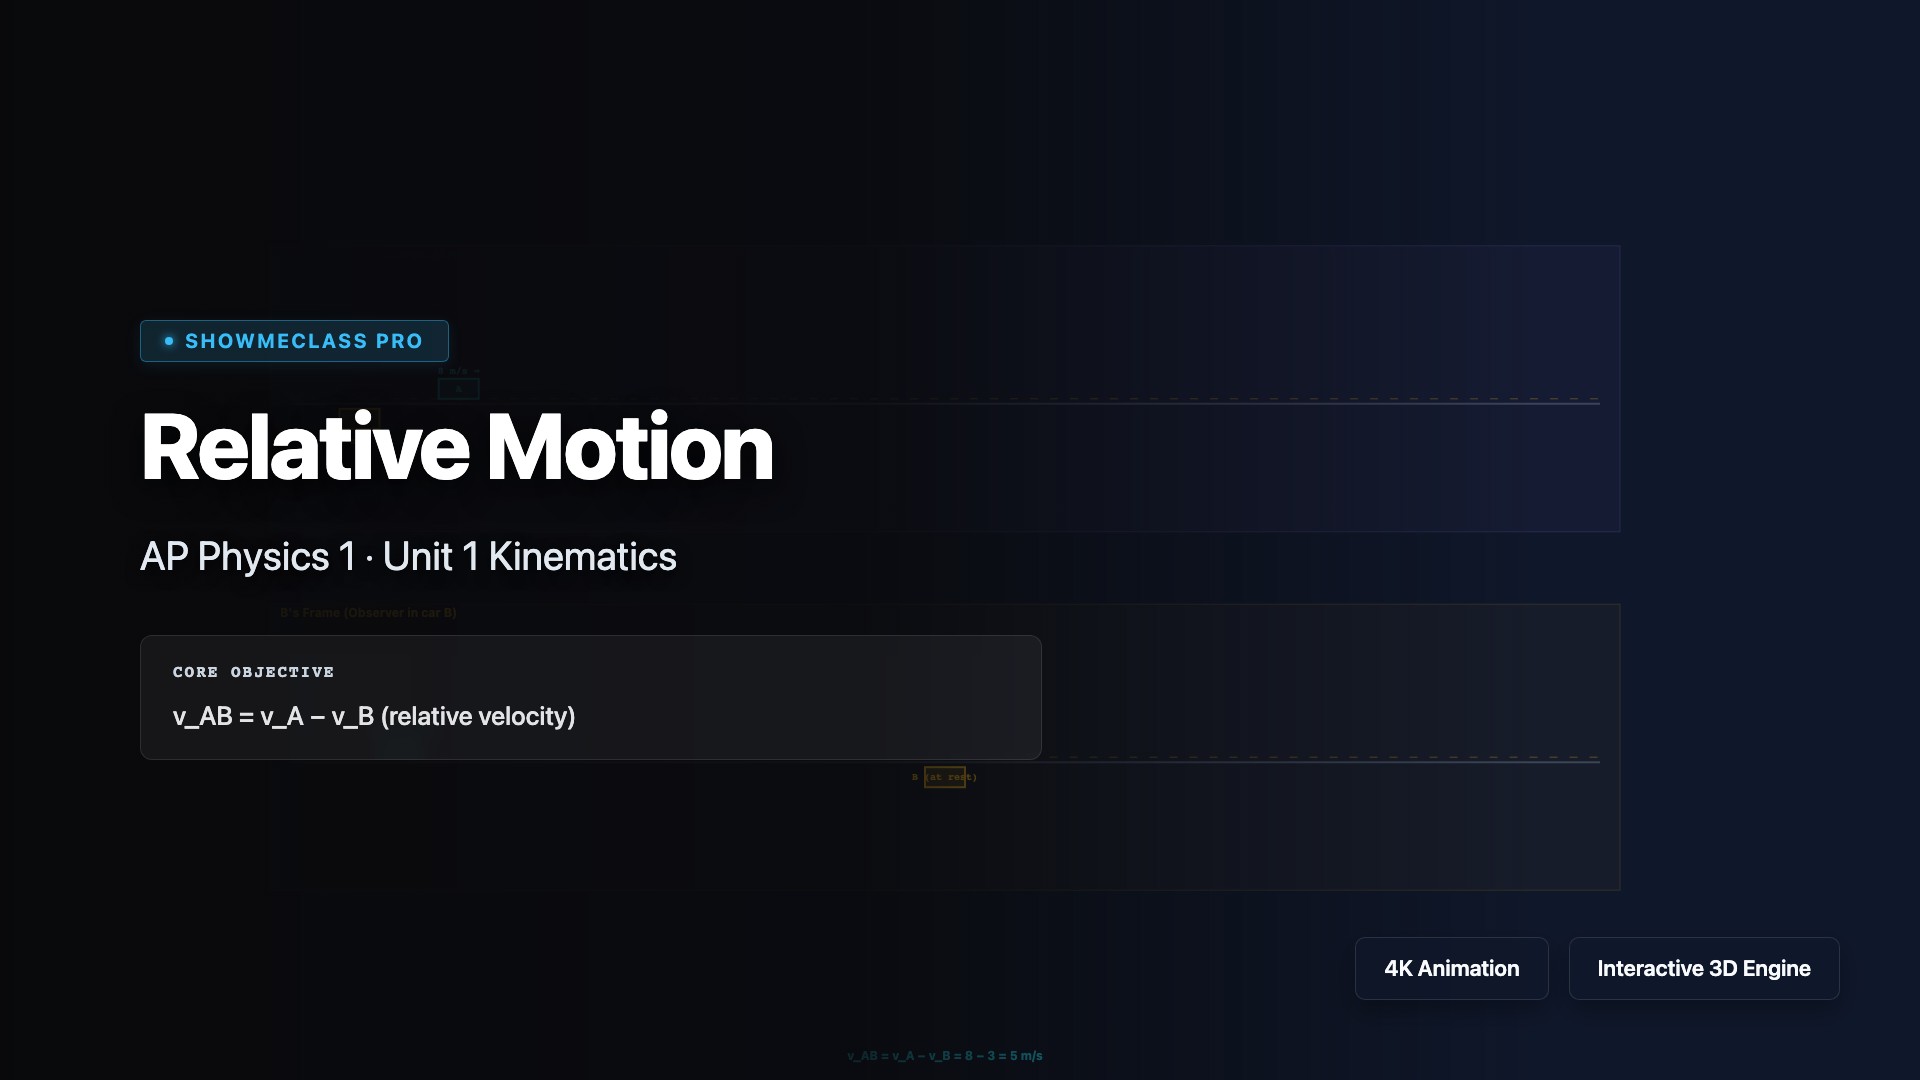
Relative Motion & Reference Frames
Compare same motion from ground frame vs moving observer frame. v_AB = v_A − v_B. Two cars animated side-by-side in both perspectives.