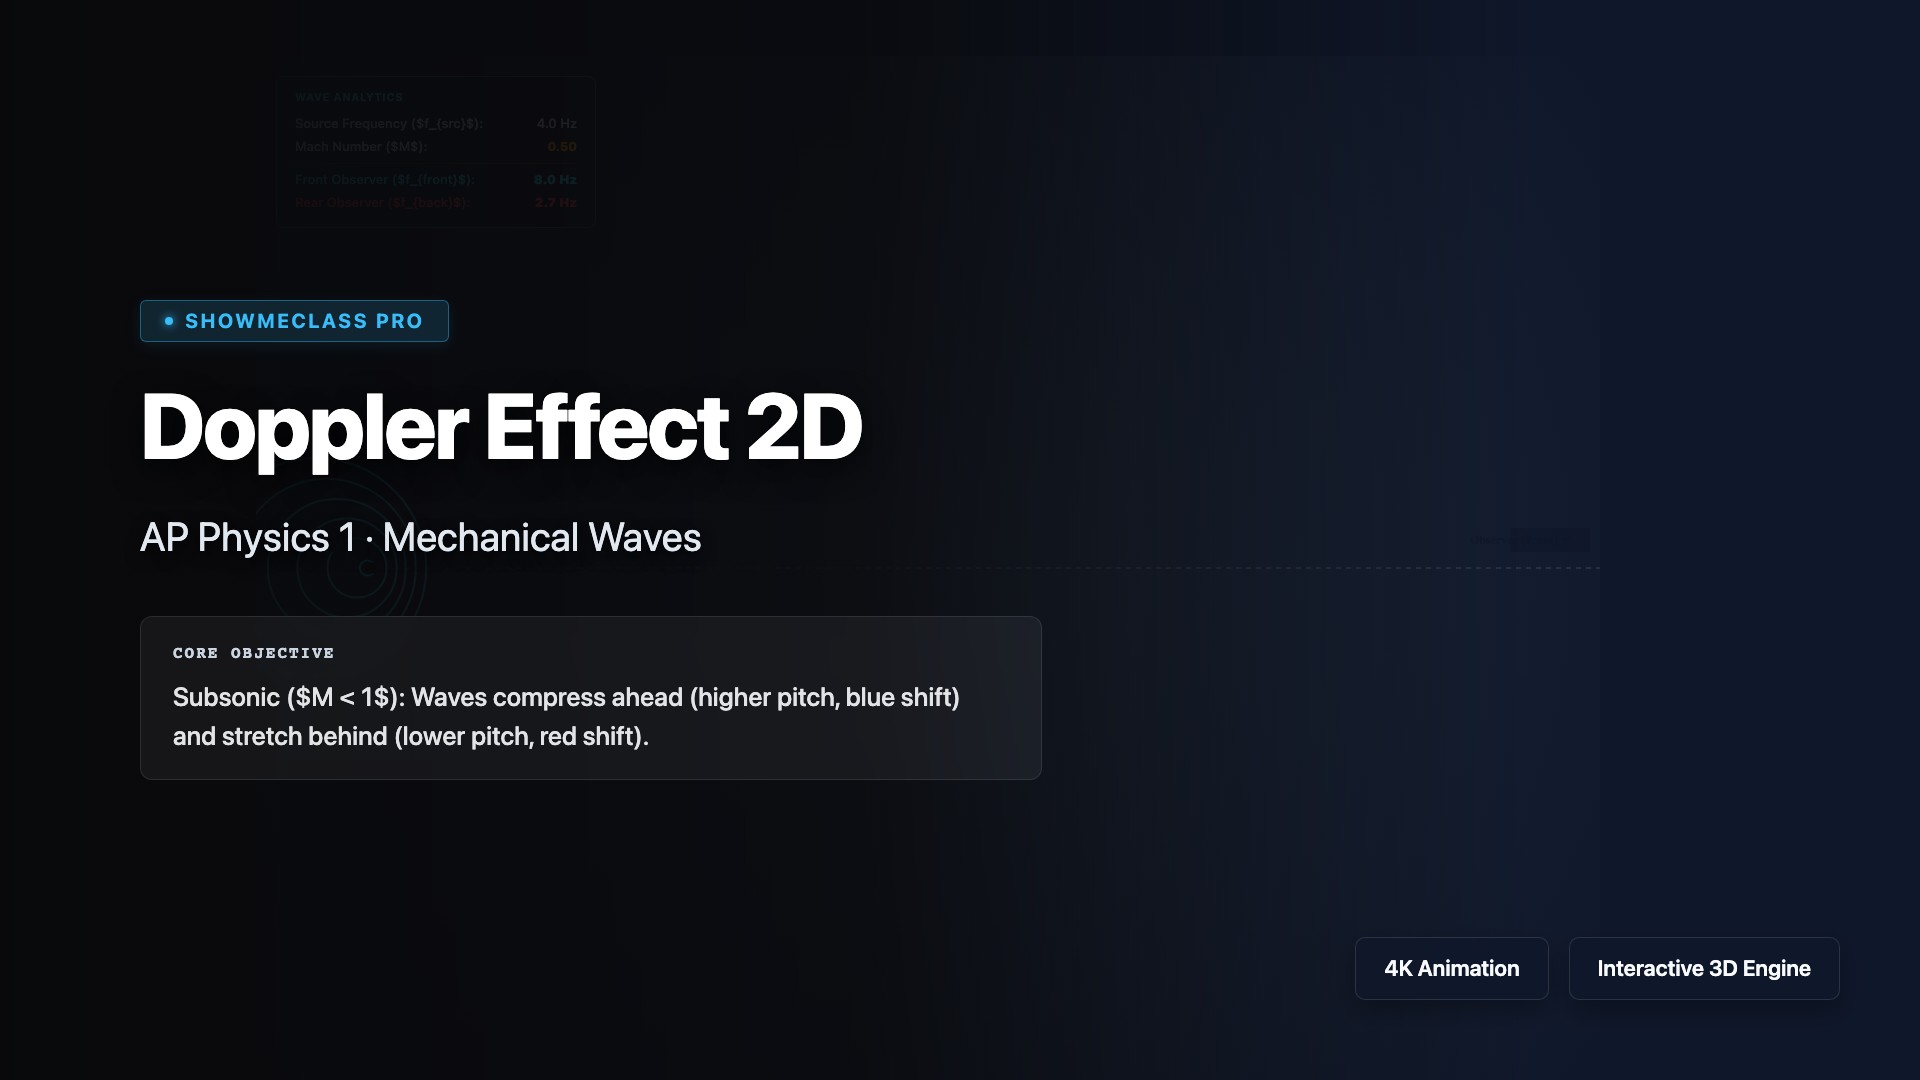
Doppler Effect 2D
Simulate sound wave propagation from a moving source. Calculate perceived frequencies for front and rear observers, and explore the Mach Cone (sonic boom) during supersonic flight.
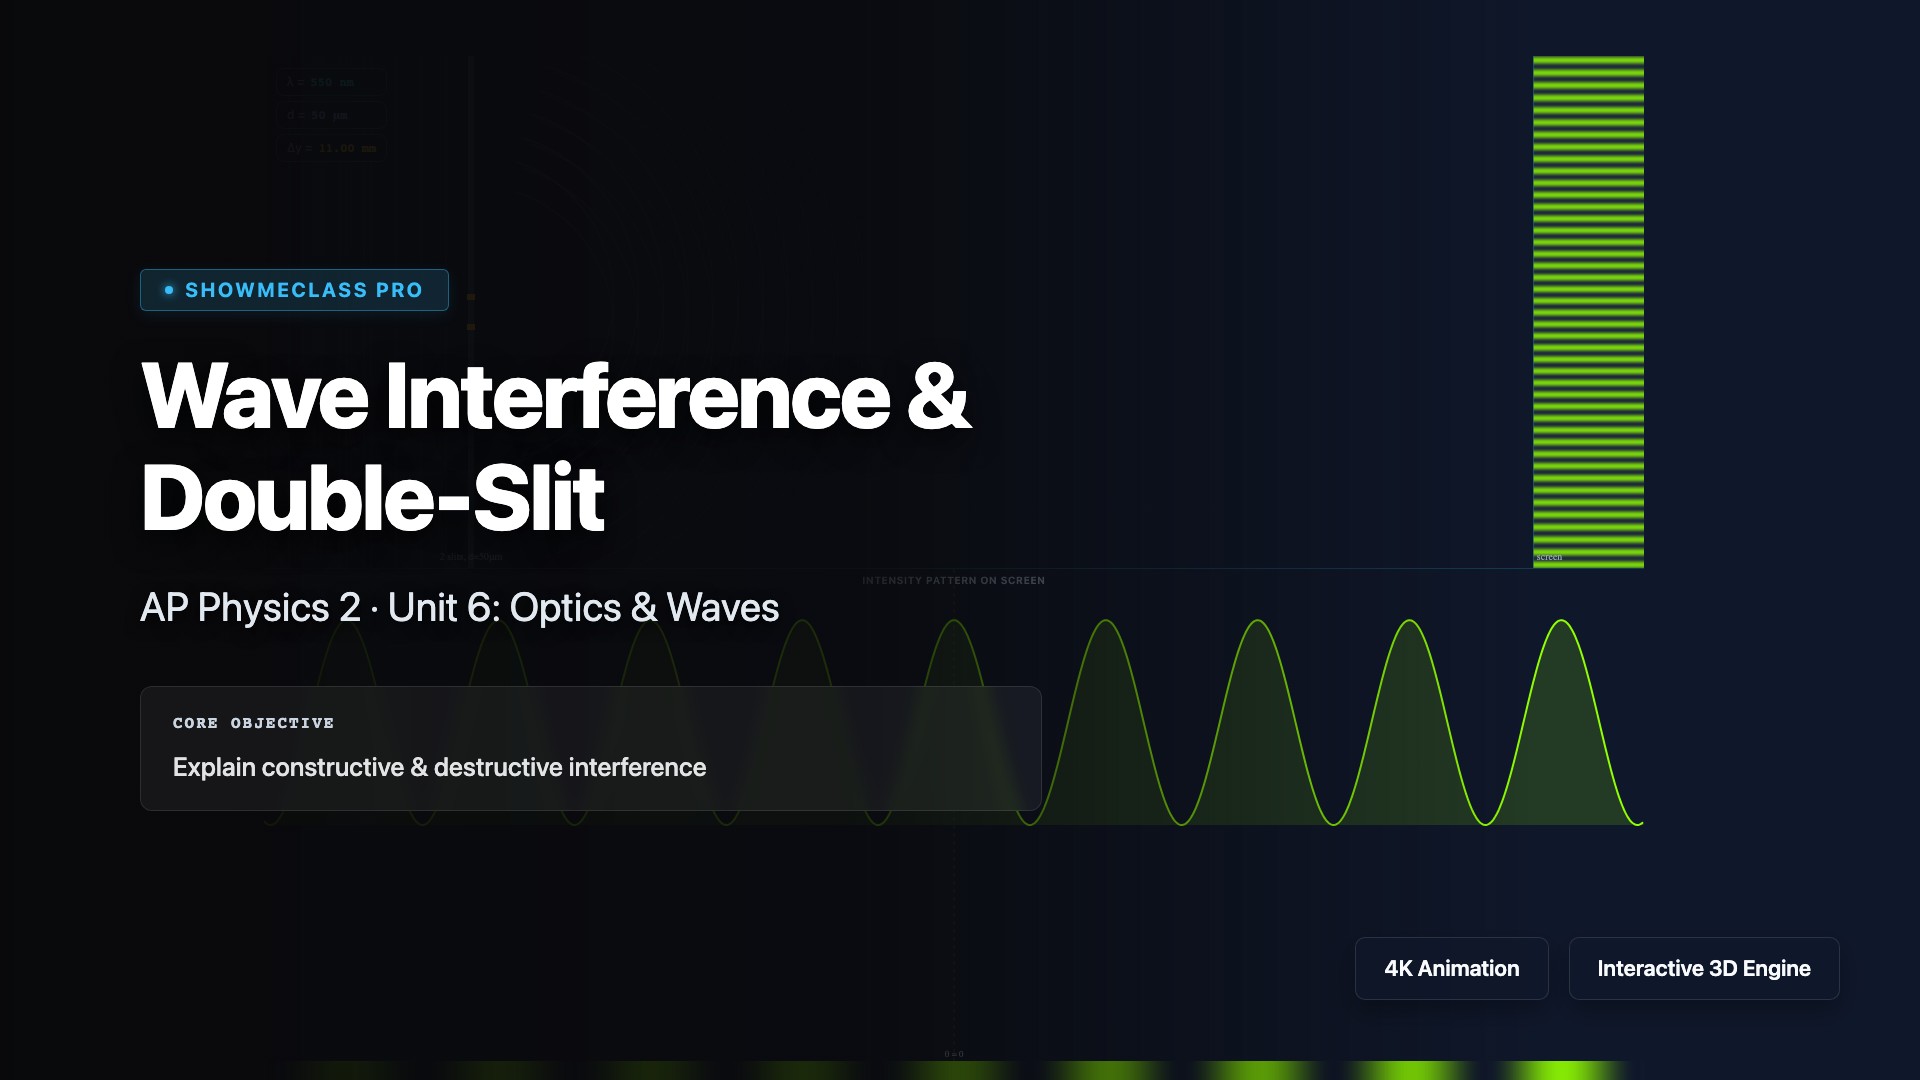
Wave Interference & Superposition
Interactive 3D ripple tank for studying mechanical wave interference. Manipulate wavelength, frequency, and source distance to observe nodal lines and superposition.
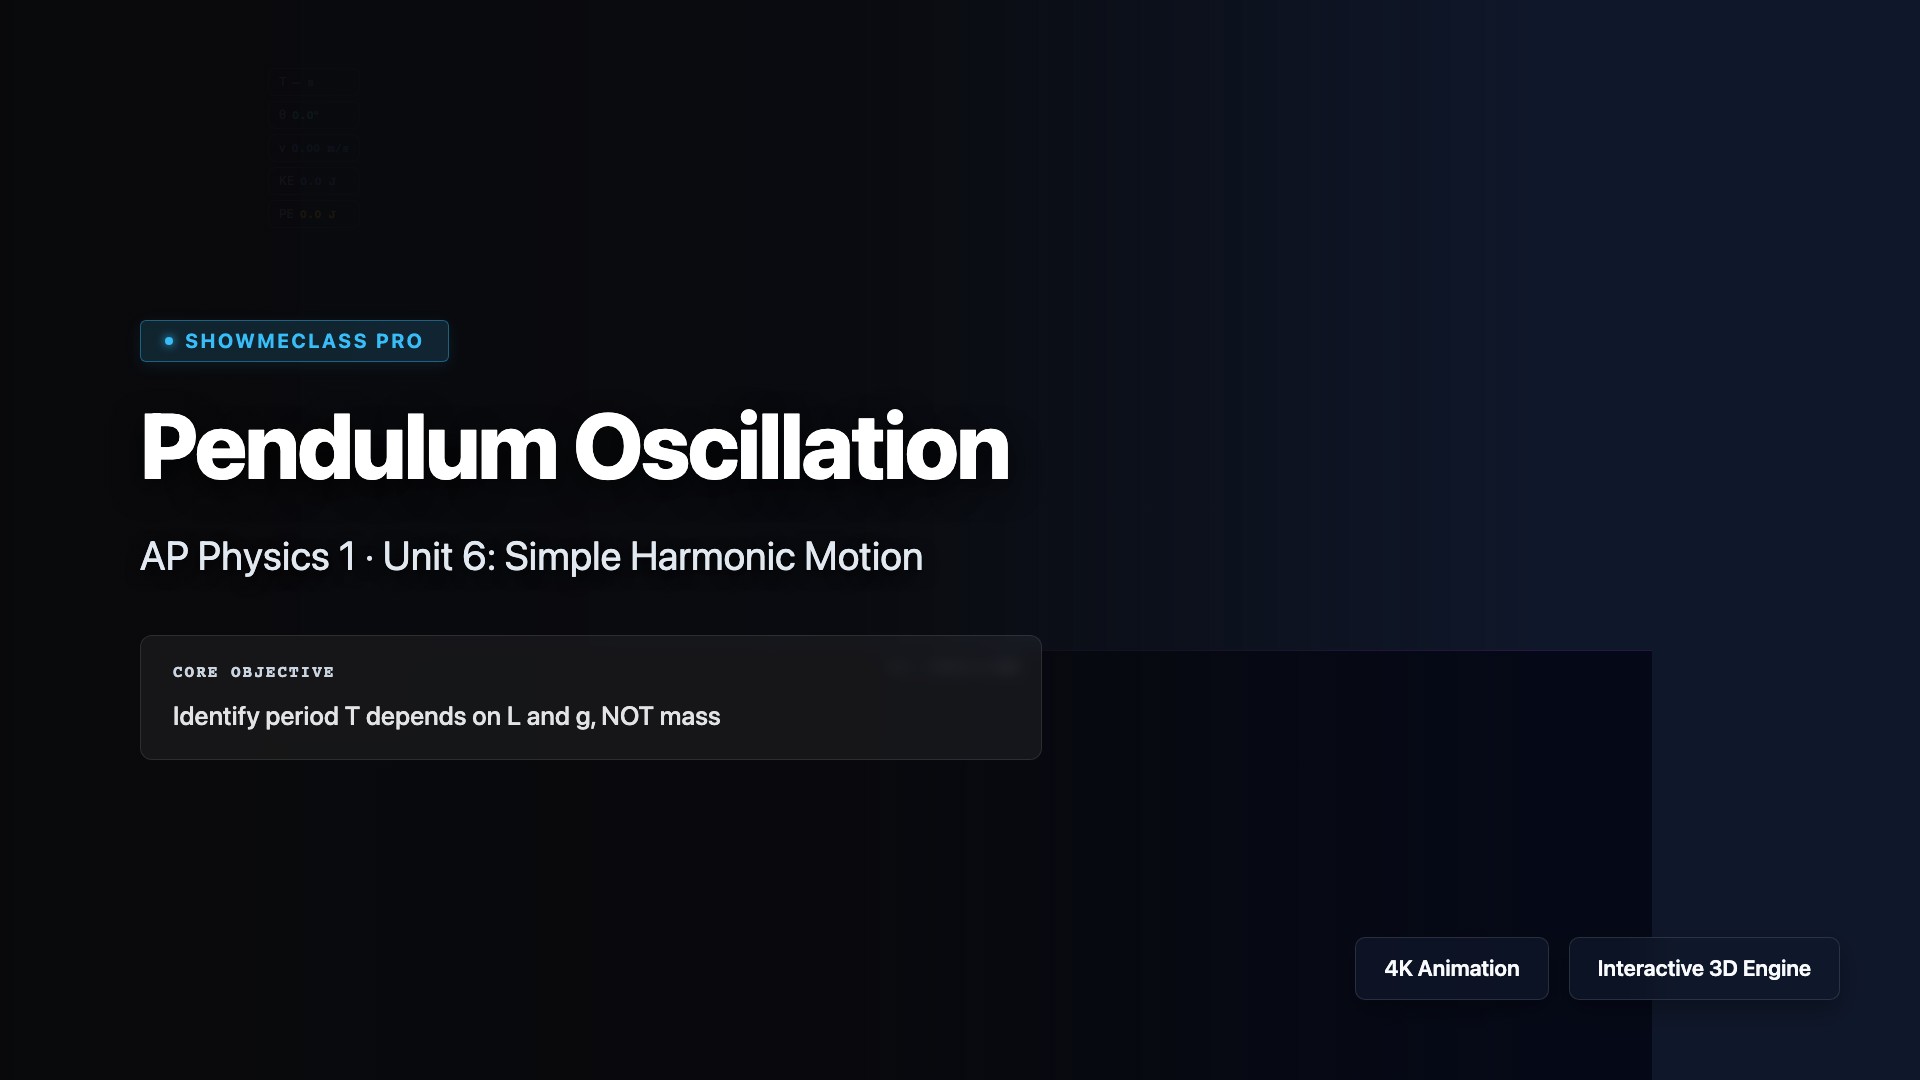
Pendulum Oscillation
Visualize the simple pendulum and its harmonic motion. Investigate how length, gravity, and mass affect the period and frequency, complete with real-time energy bar charts.
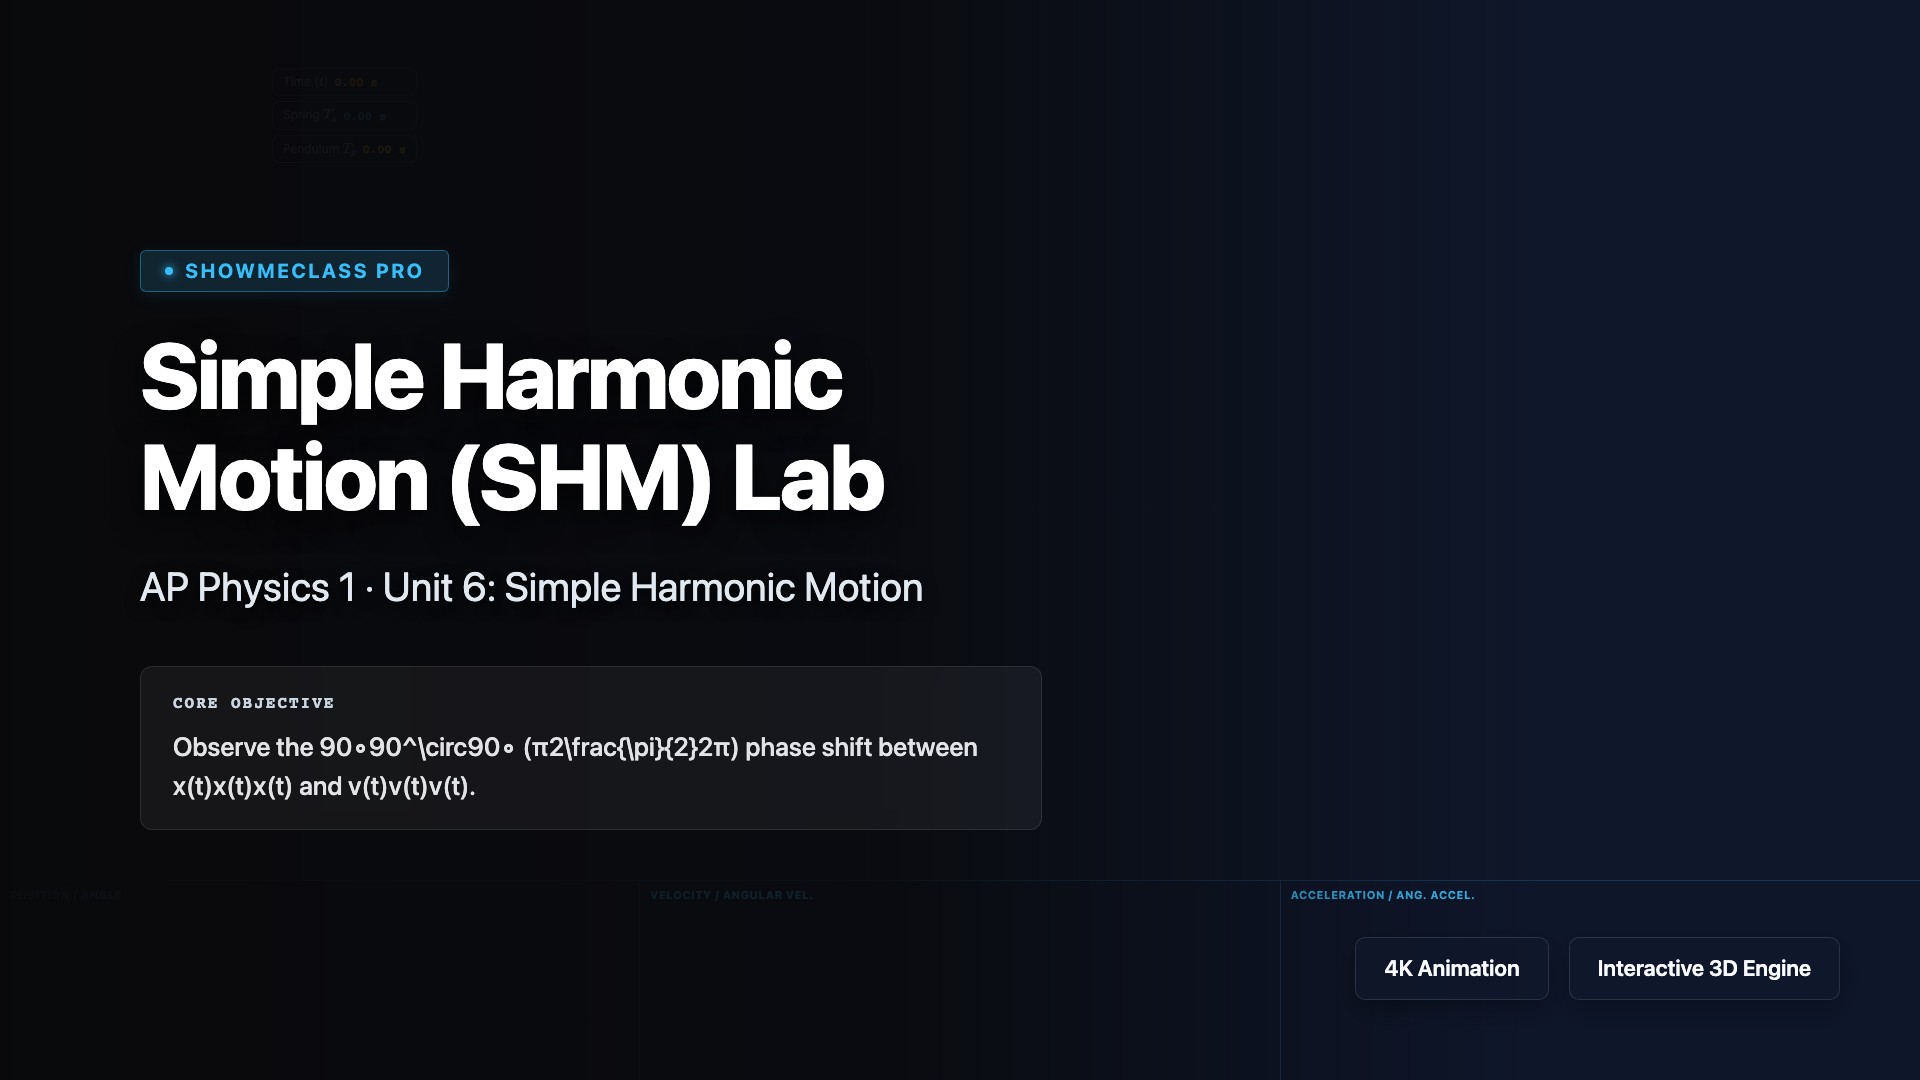
Simple Harmonic Motion
Explore mass-spring oscillations and energy transformations. Adjust mass, spring constant, and damping to observe how frequency, amplitude, and energy interchange between kinetic and potential forms.
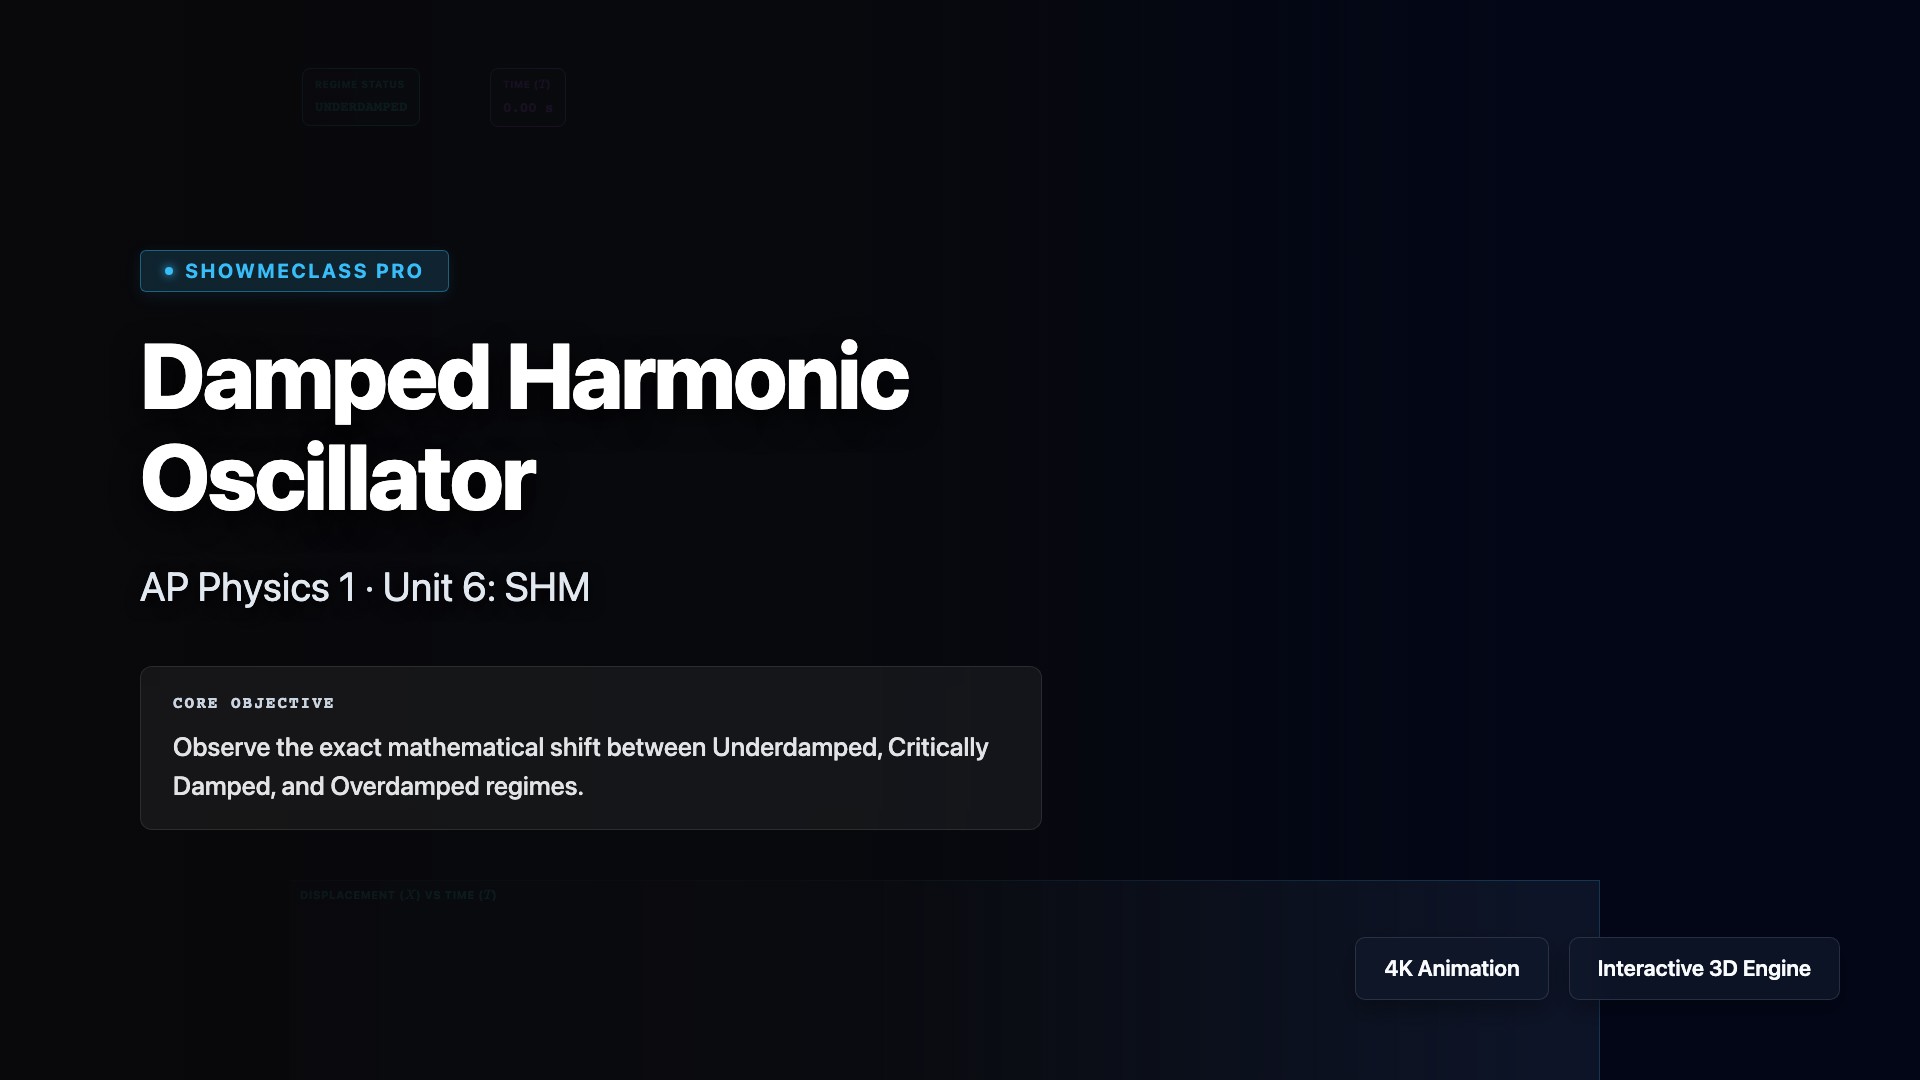
Damped Harmonic Oscillation
Interactive 3D damped spring-mass simulator. Explore underdamped, critically damped, and overdamped regimes with live analytical charting and decay envelopes.
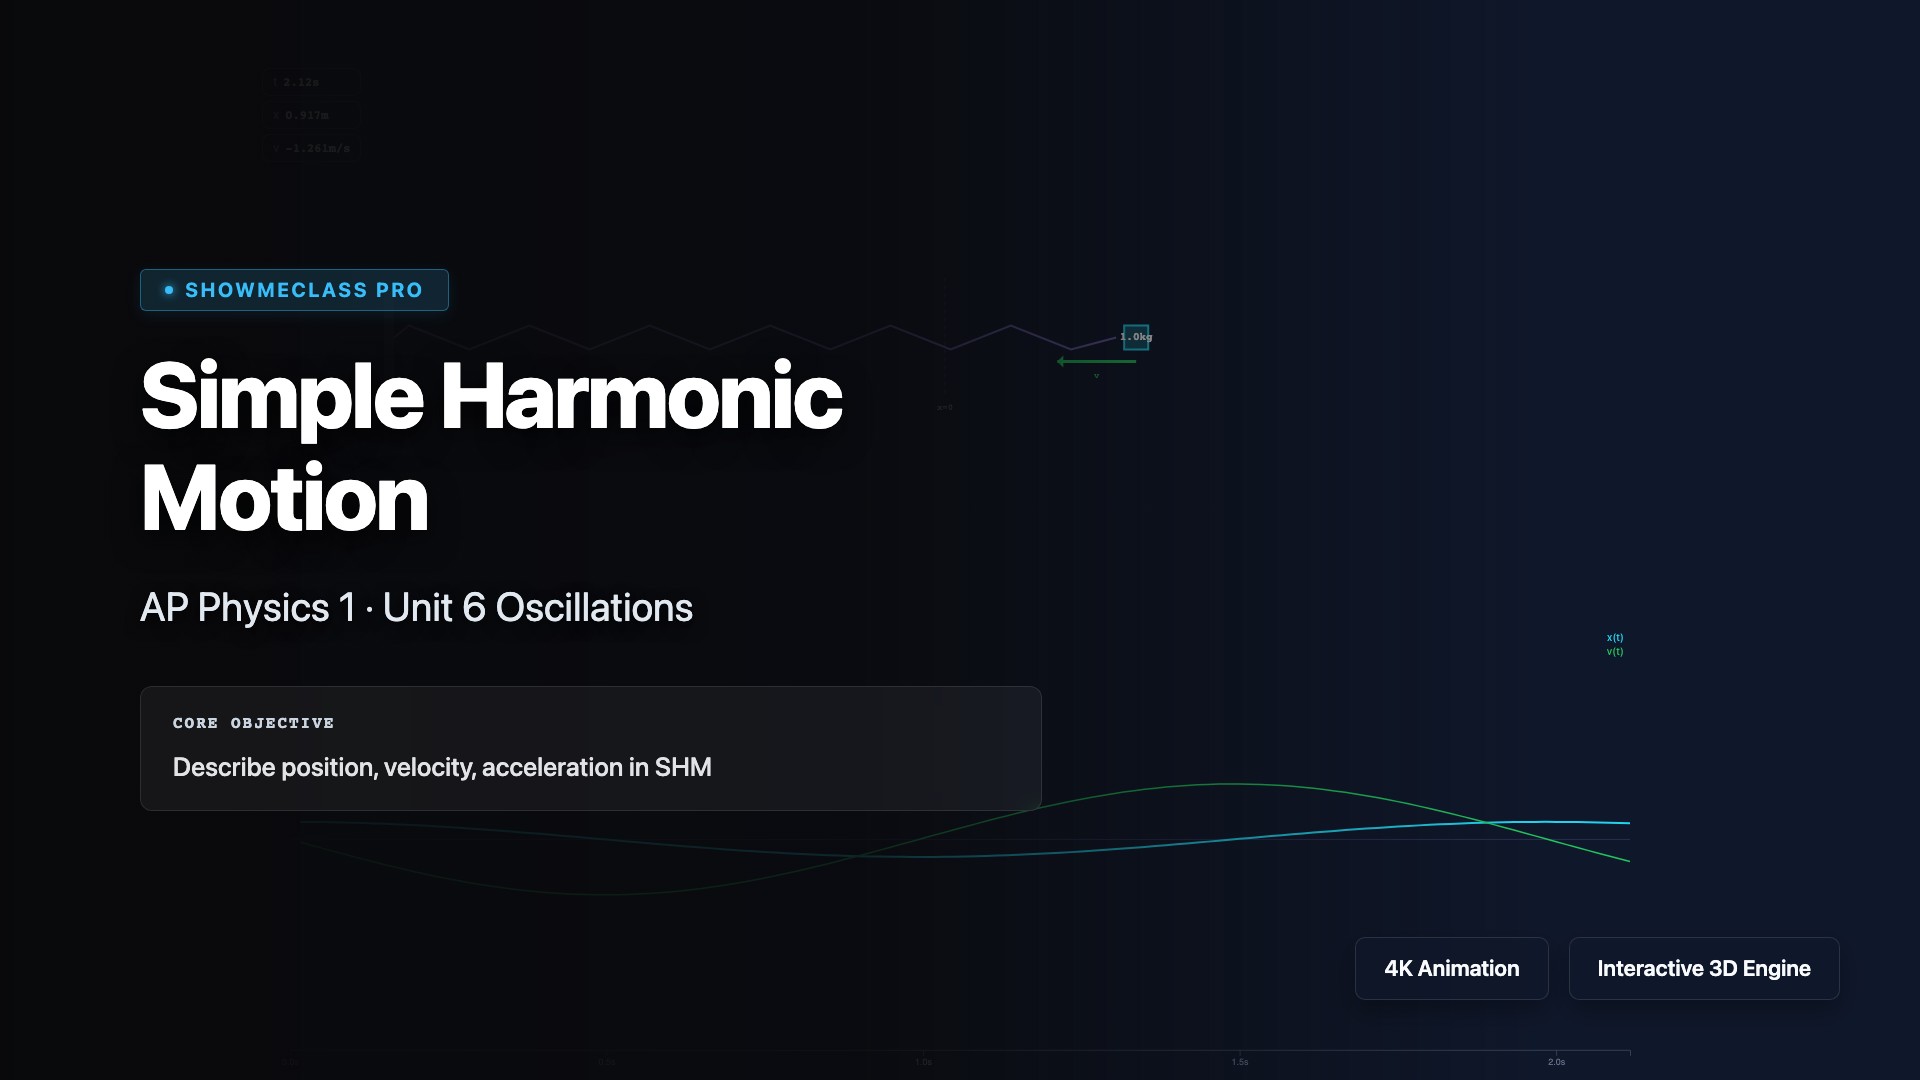
Simple Harmonic Motion Explorer
Animate a spring-mass system in SHM with real-time x(t), v(t), a(t) graphs. Adjust amplitude, mass, and spring constant to see how period, frequency, and energy change.
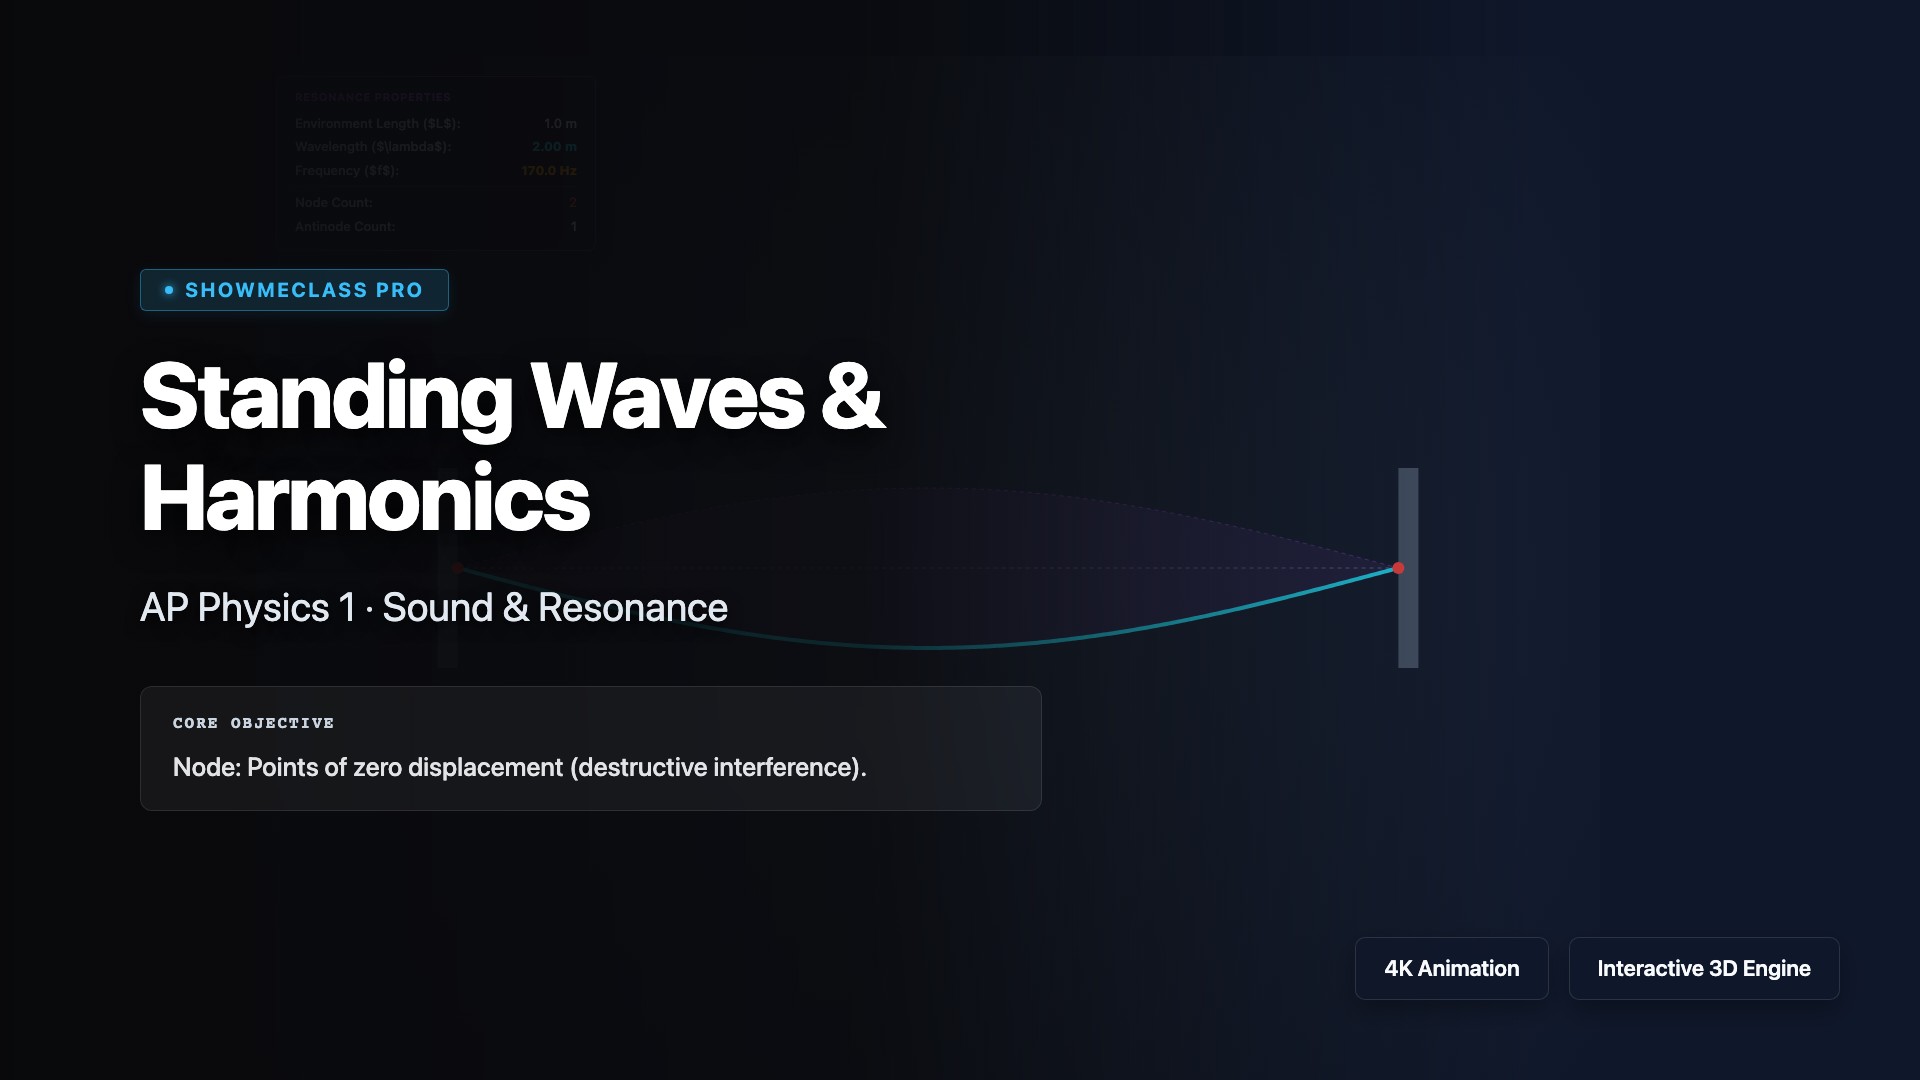
Standing Waves Generator
Visualize standing wave harmonics on a fixed string. Adjust harmonic number, amplitude, and wave speed to see nodes, antinodes, wavelength, and frequency in real time.
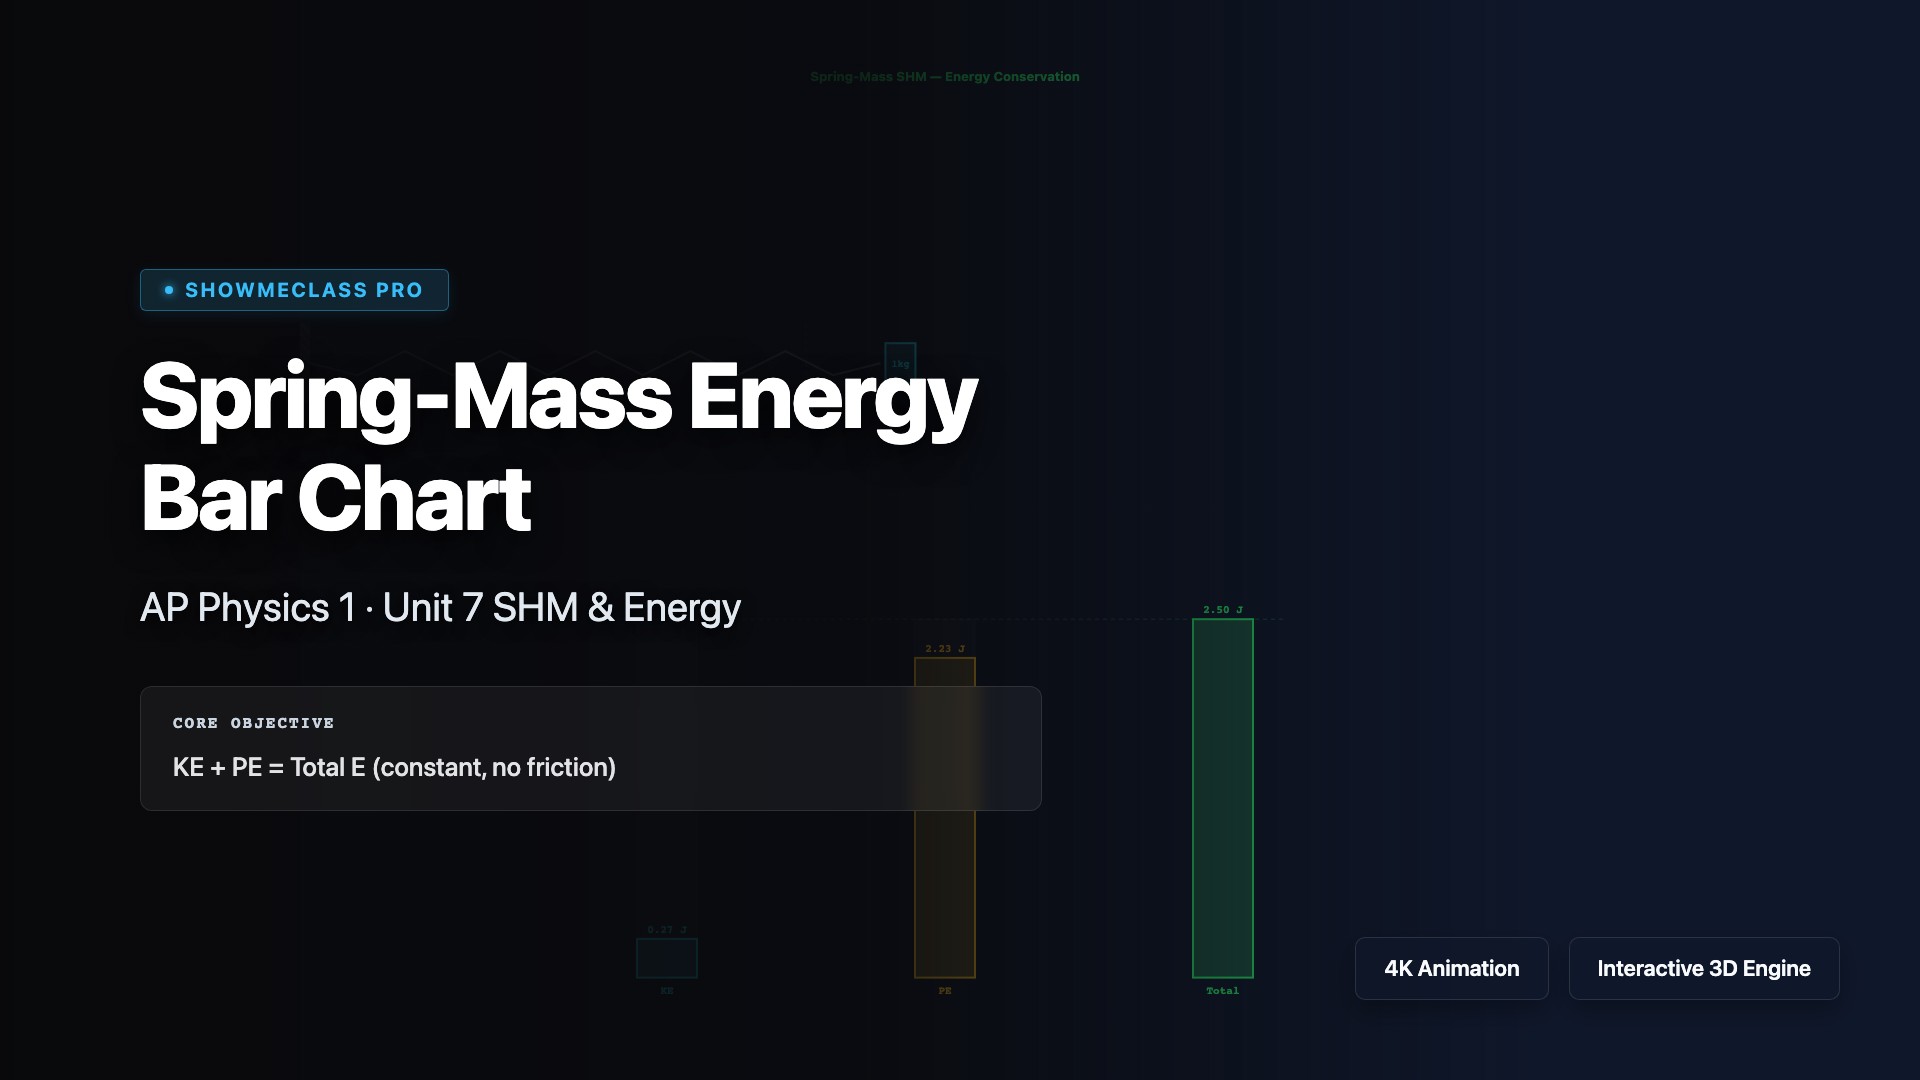
Spring-Mass Energy Bar Chart
Animated spring-mass SHM with real-time KE/PE/Total energy bar chart. PE = ½kx², KE = ½mv². Optional damping shows energy loss.
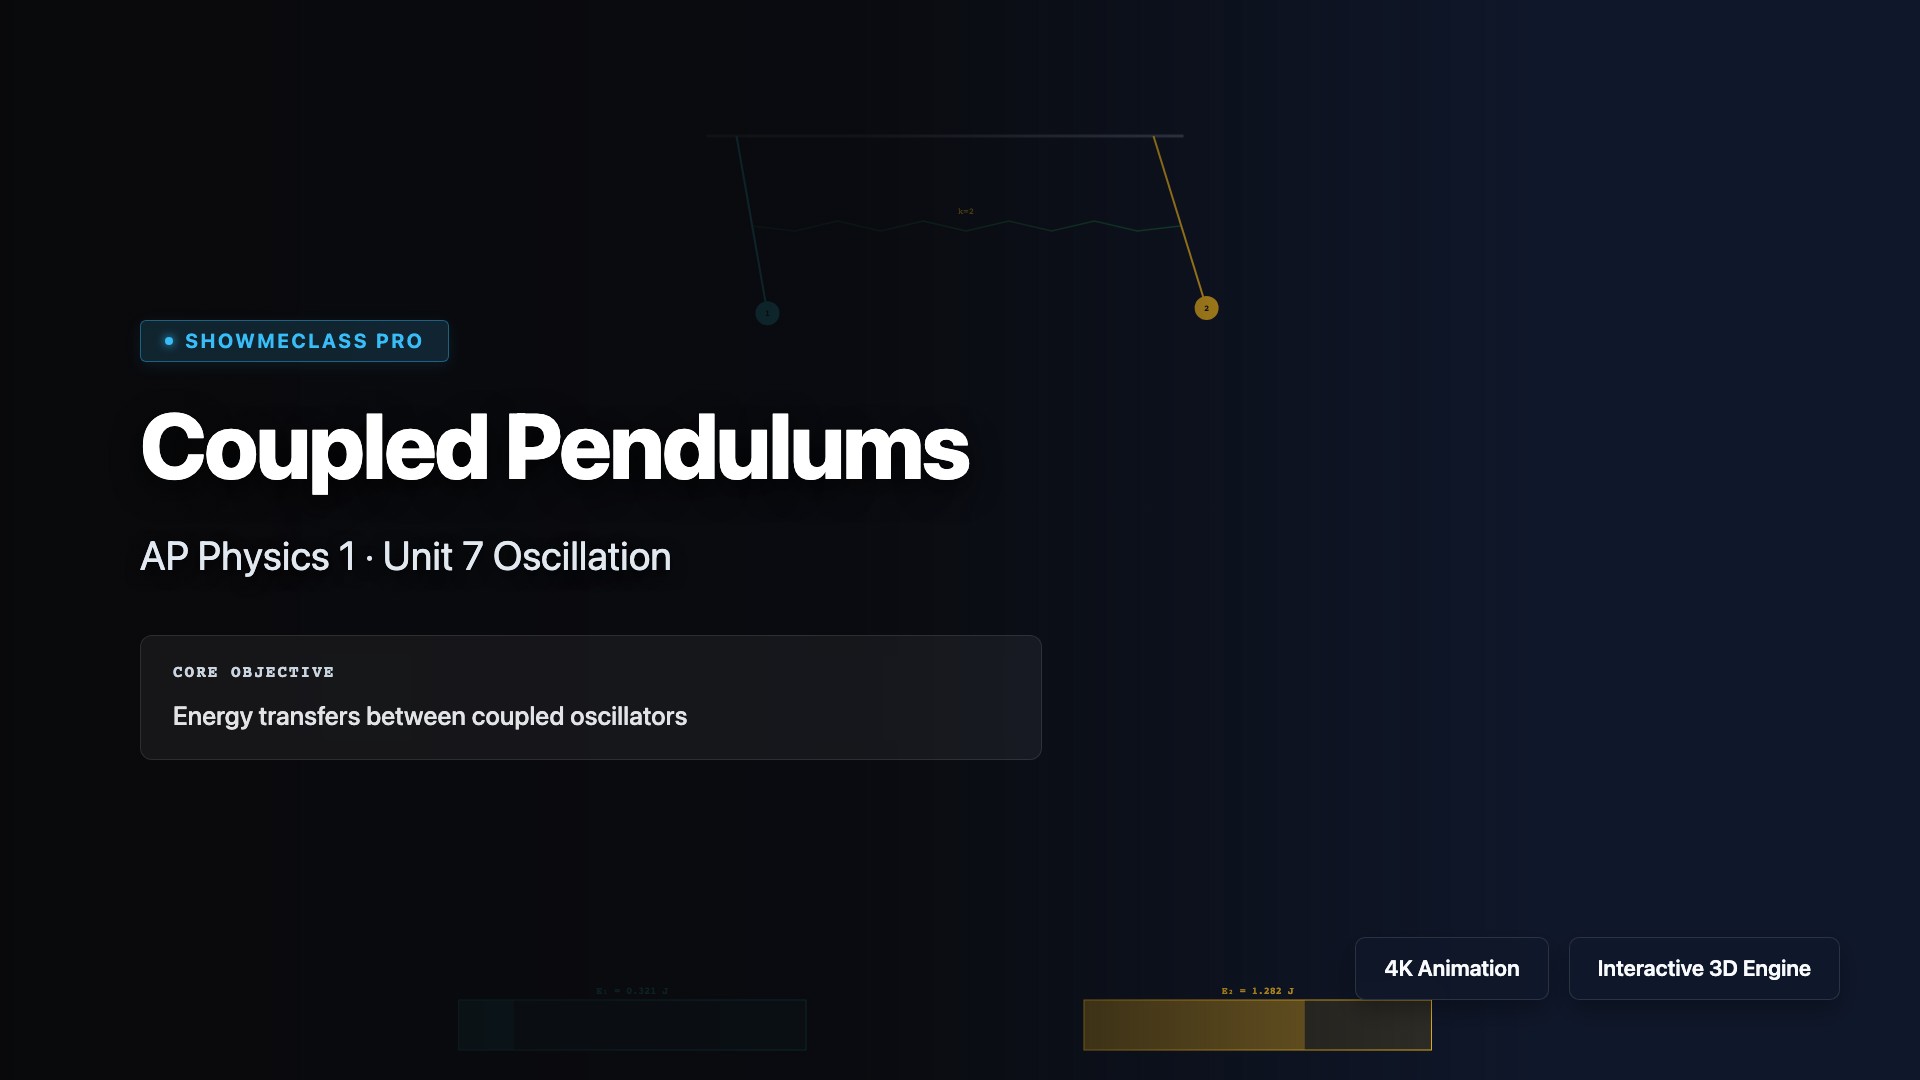
Coupled Pendulums & Energy Transfer
Two pendulums coupled by a spring exchange energy via beat oscillation. Adjust coupling strength to see faster/slower energy transfer between normal modes.
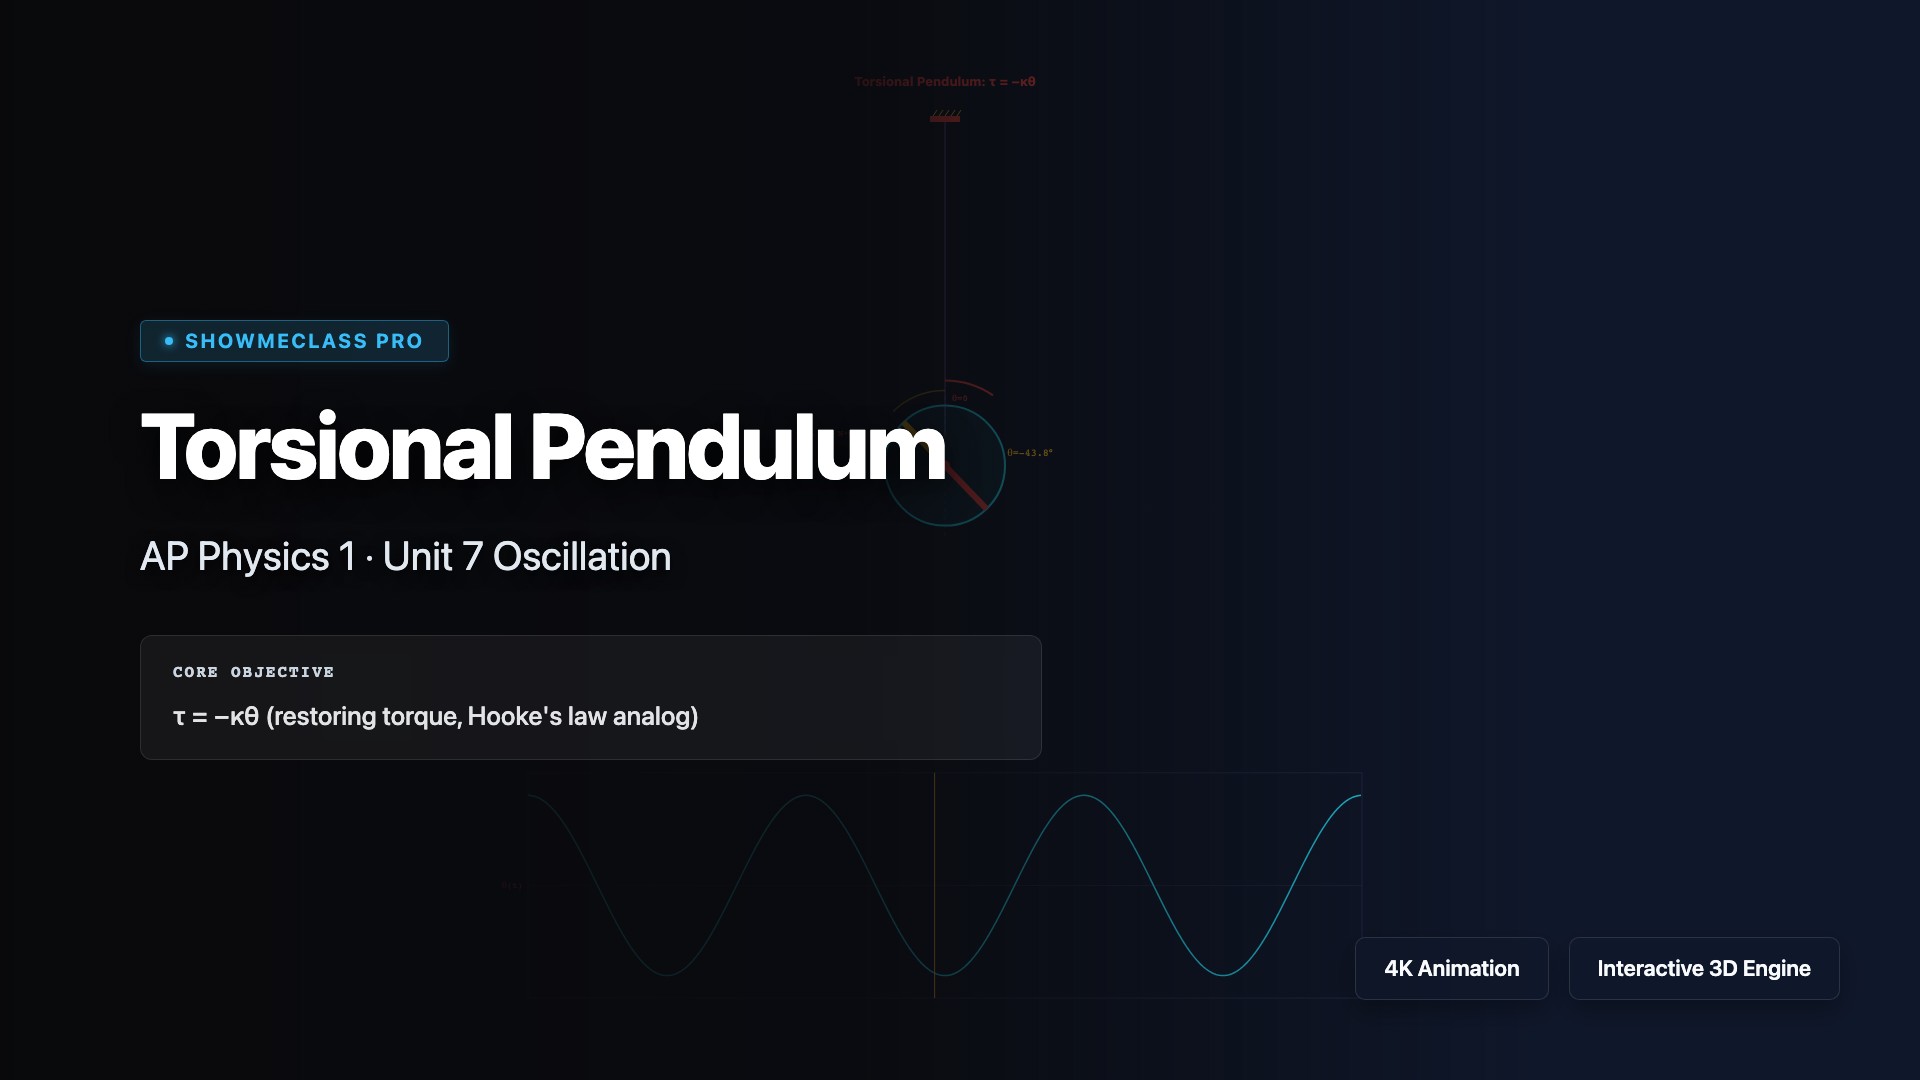
Torsional Pendulum
Rotating disk with τ = −κθ restoring torque. Angular SHM: T = 2π√(I/κ). Real-time θ(t) graph with adjustable torsion constant, moment of inertia, and damping.
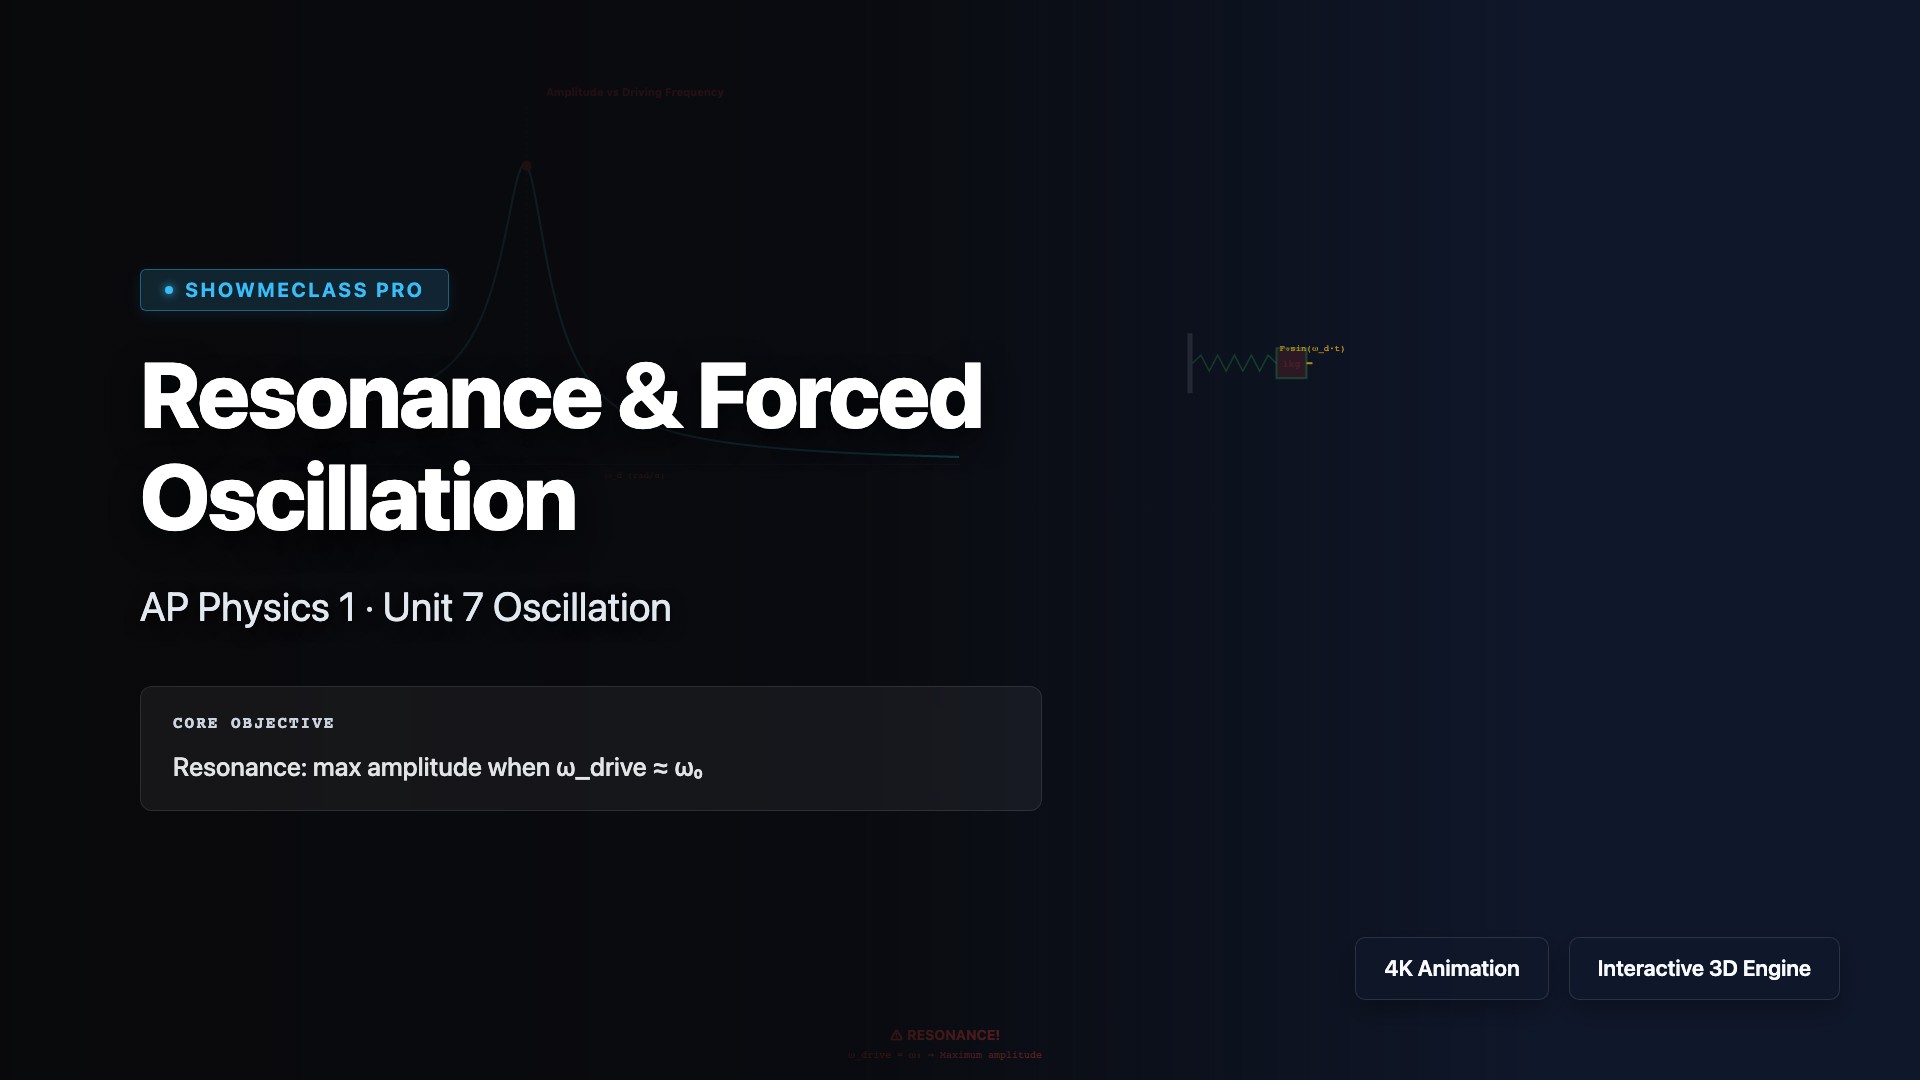
Resonance & Forced Oscillation
Amplitude vs driving frequency resonance curve. Maximum amplitude at ω_drive ≈ ω₀. Adjustable damping, spring constant, mass, and driving force.