Interactive visualizations for AP Statistics
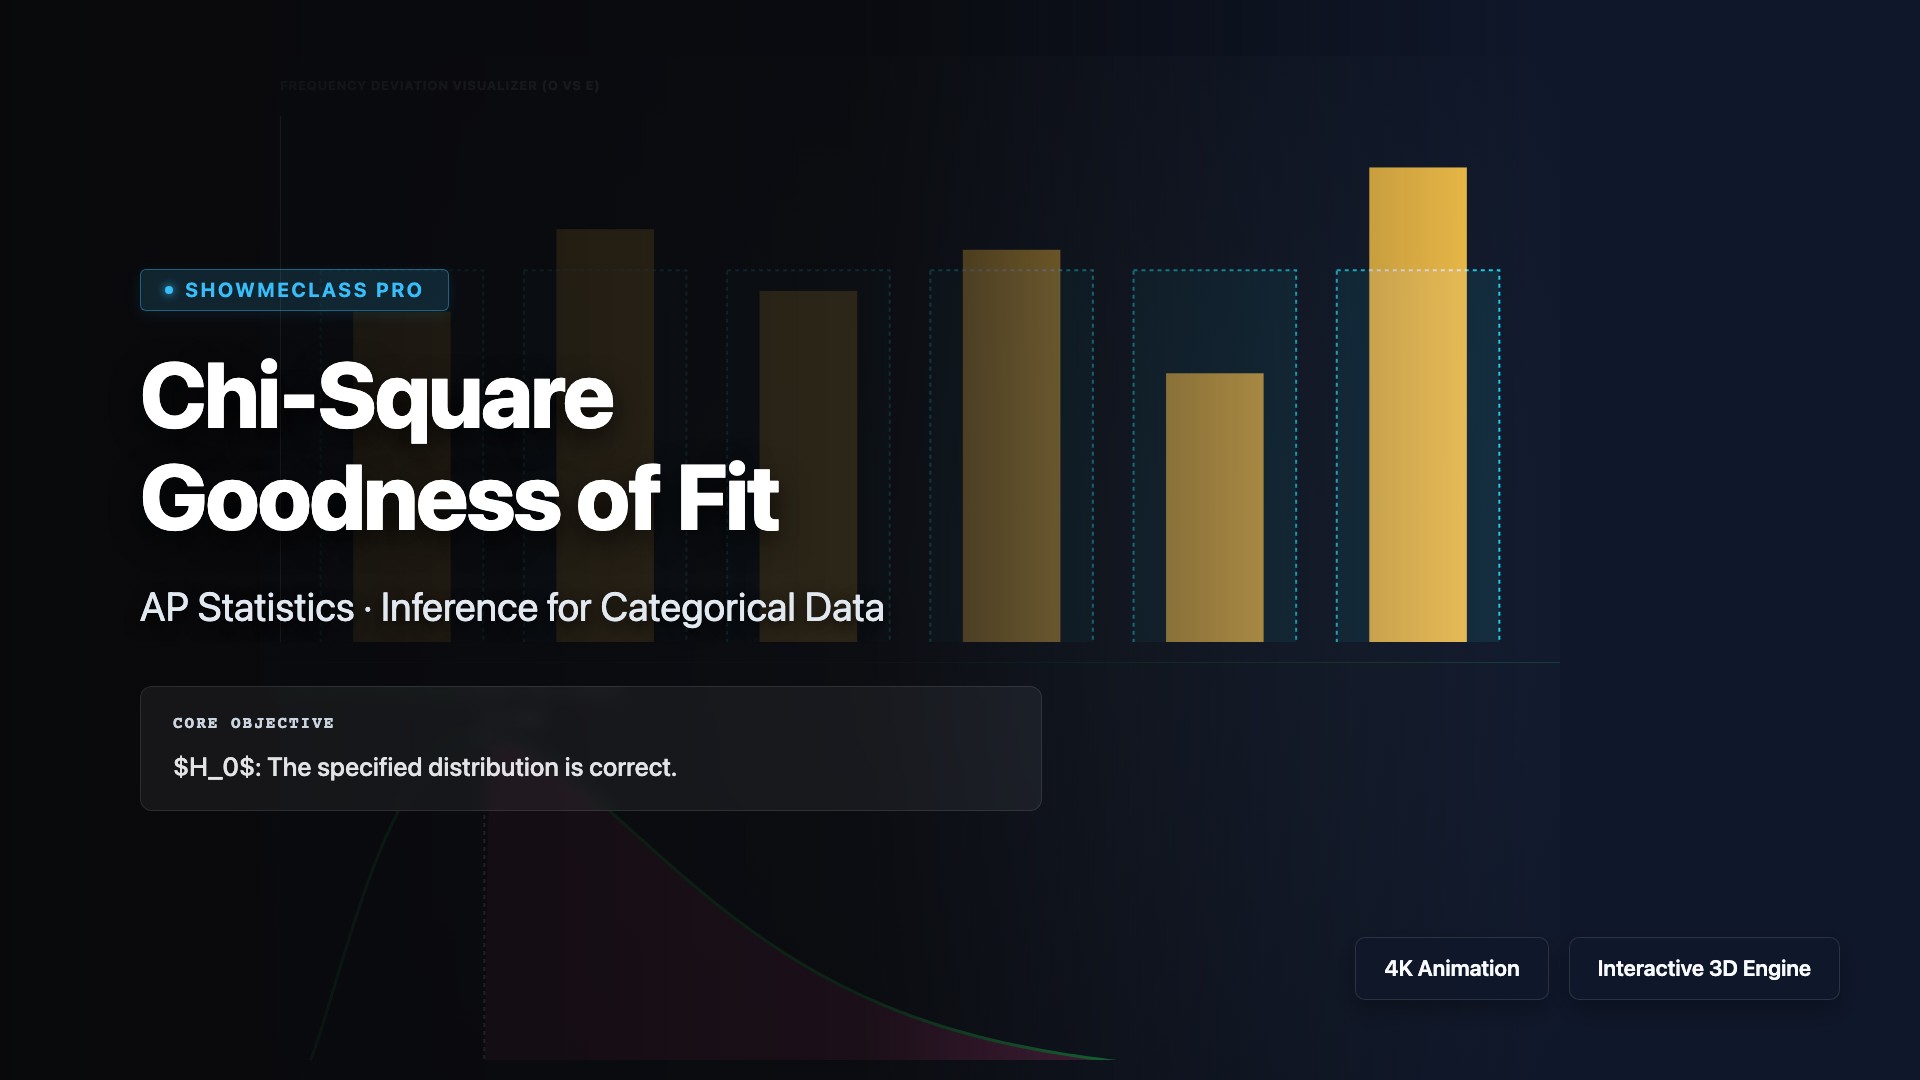
Calculate and visualize the Chi-Square test statistic. Compare expected vs observed dice rolls across categories and plot how deviations force the P-value into the rejection region.