Interactive visualizations for AP Statistics
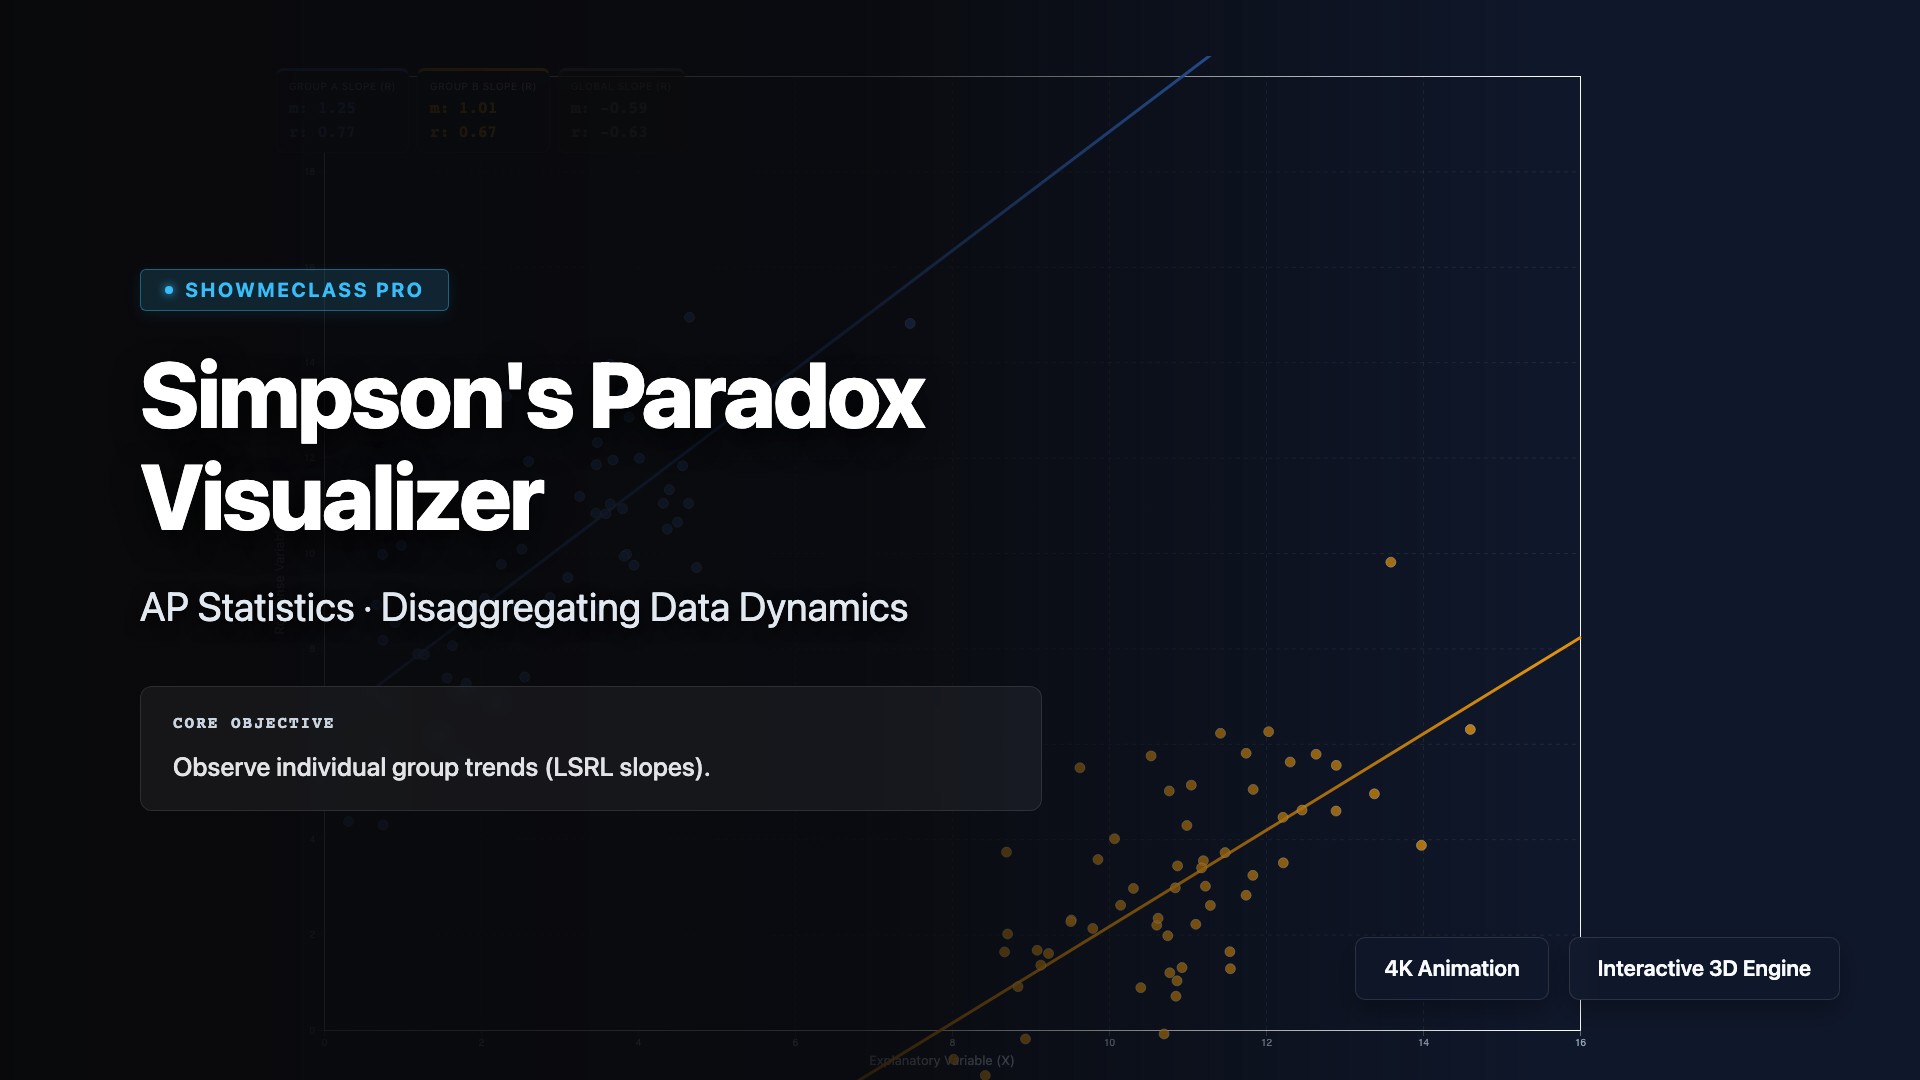
Examine confounding variables dynamically. Toggle between global and clustered regression data to observe mathematical trends magically reverse polarity (Pearson r) when separated.