AP STATISTICS
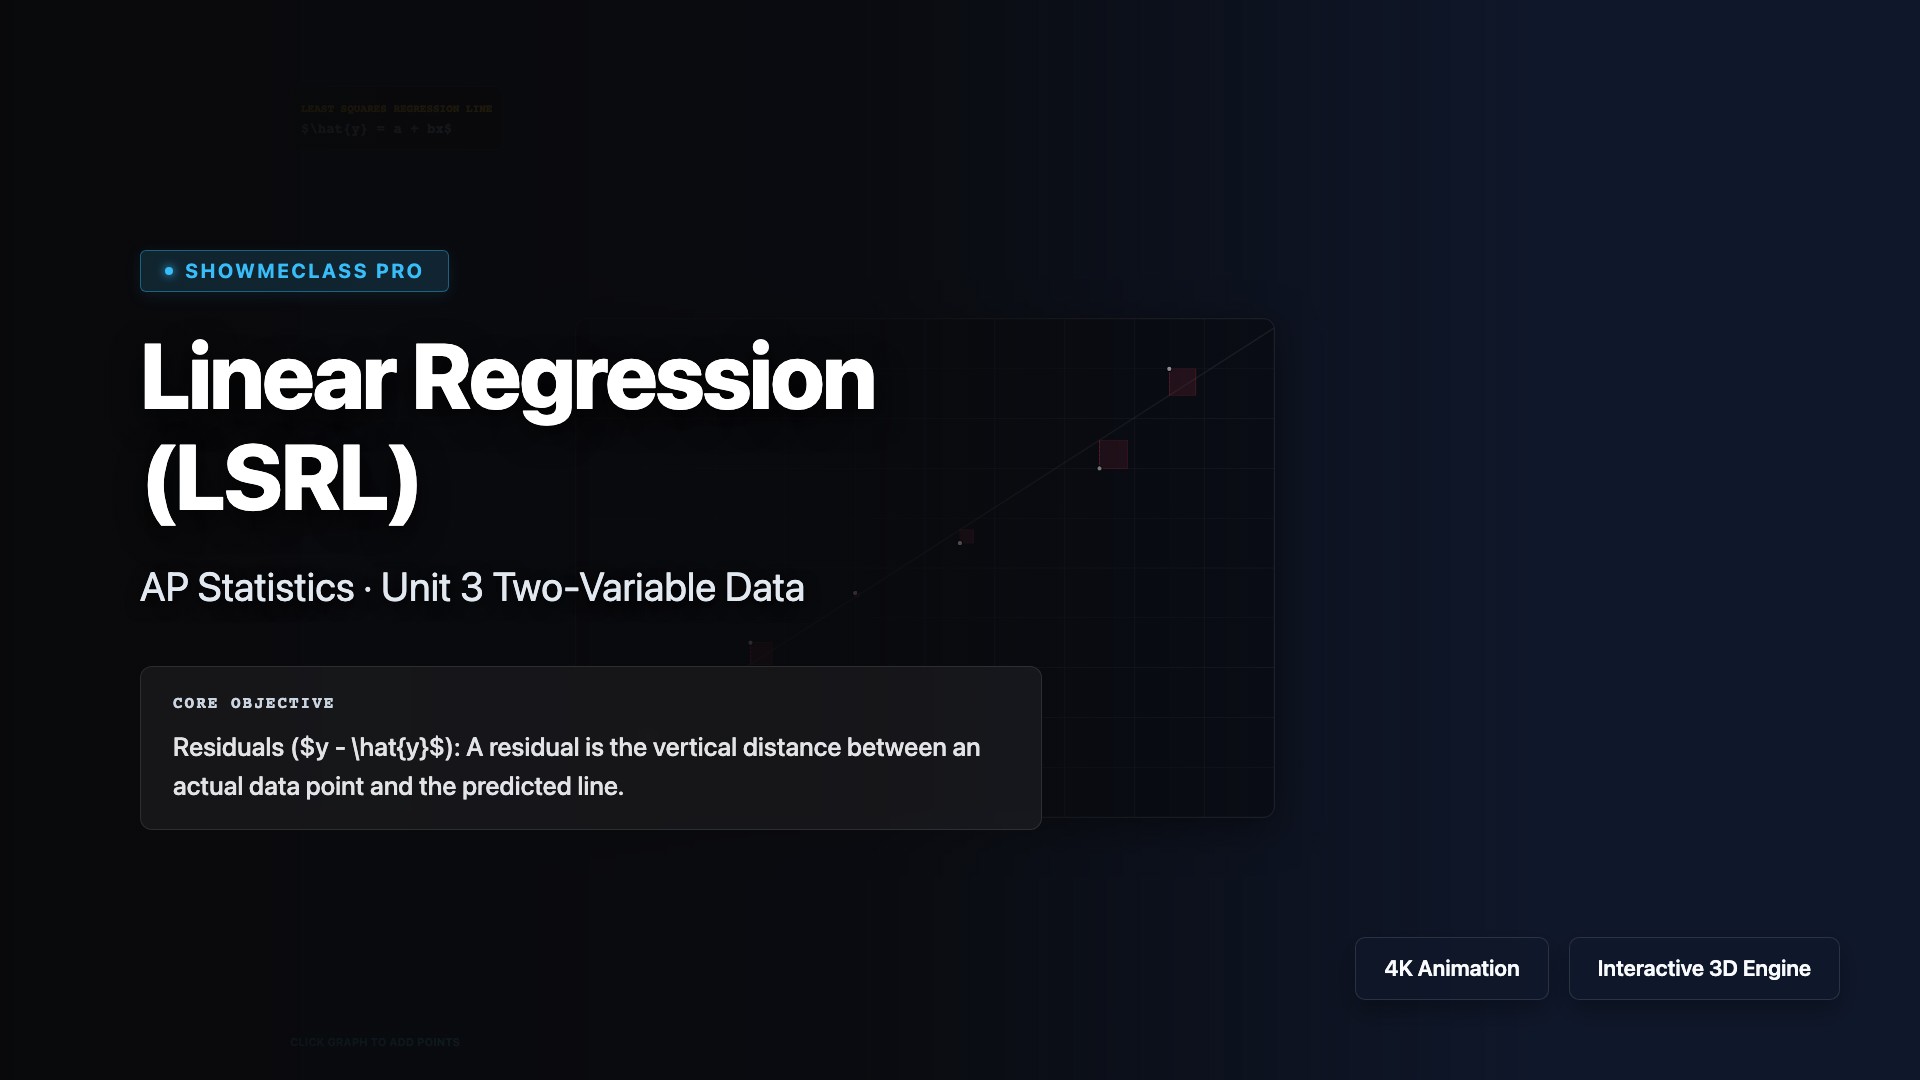
Linear Regression (LSRL)
Interactive graphical Least Squares regression engine visually proving the $e^2$ square-area minimization property via manual vs automatic fitting while actively mapping high leverage outlier penalties.
AP STATISTICS
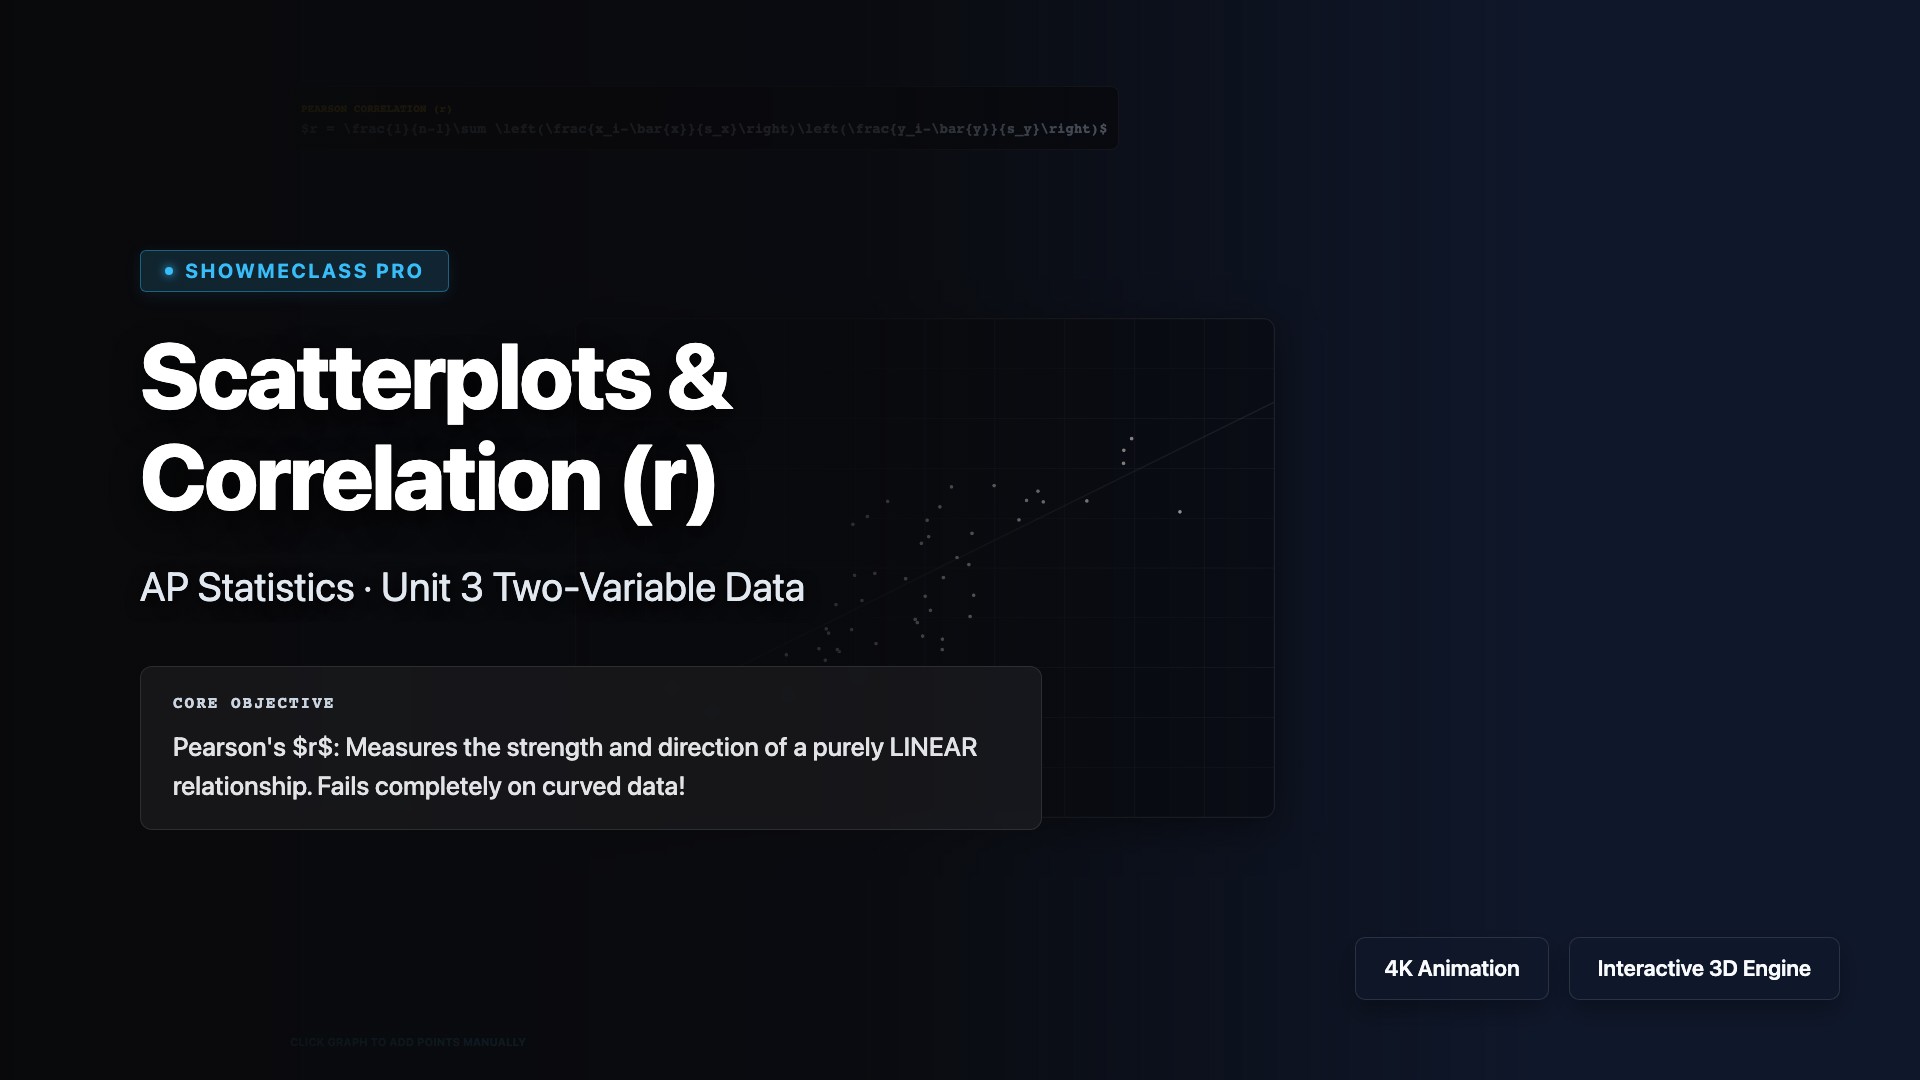
Scatterplots & Correlation (r)
Interactive scatterplot geometry demonstrating Pearson's correlation coefficient mapping bounds ($|r| \to 1$). Employs bivariate normal Box-Muller transformations to visually generate dynamic density clouds calculating $R^2$ determination variances overlaid mathematically on LSRL projection planes natively.