AP STATISTICS
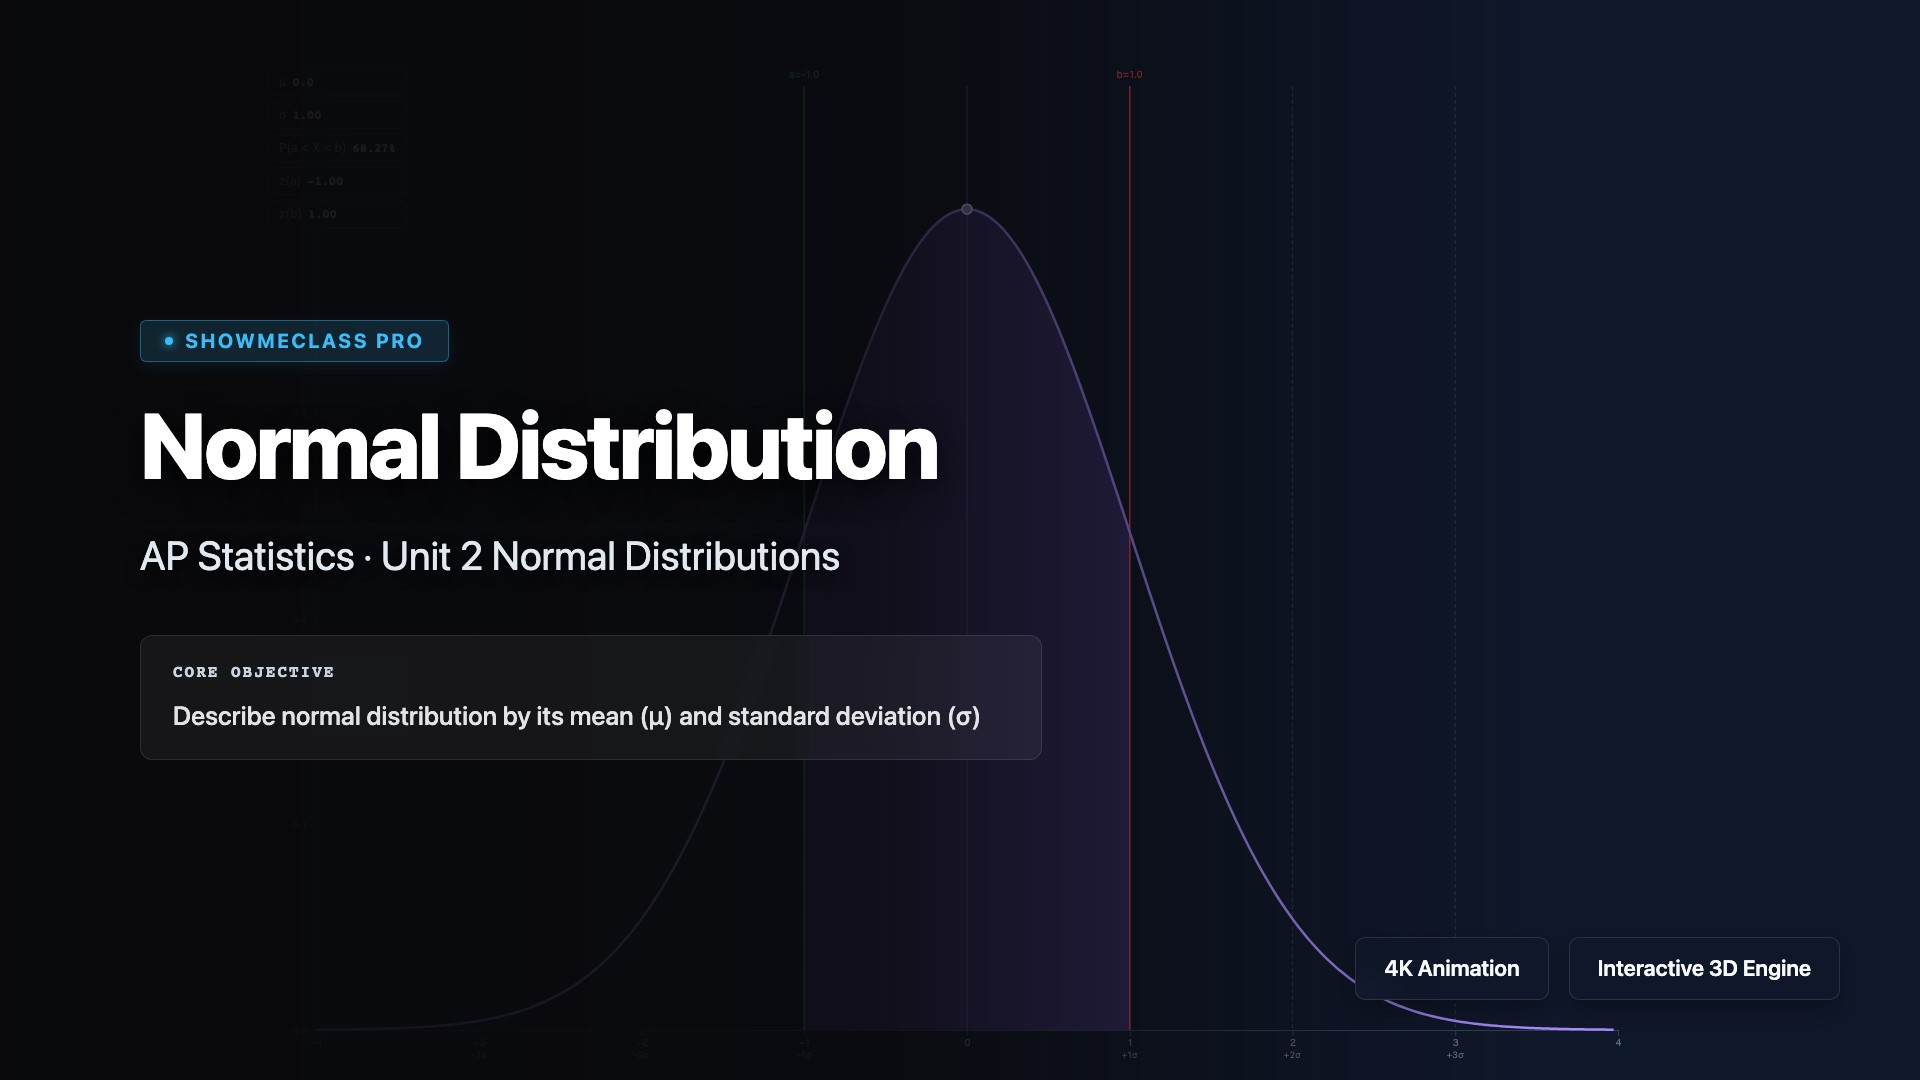
Normal Distribution Explorer
Adjust mean and standard deviation to see how the normal distribution bell curve shifts and stretches. Shade probability regions to compute areas under the curve and connect z-scores to percentiles.
AP STATISTICS
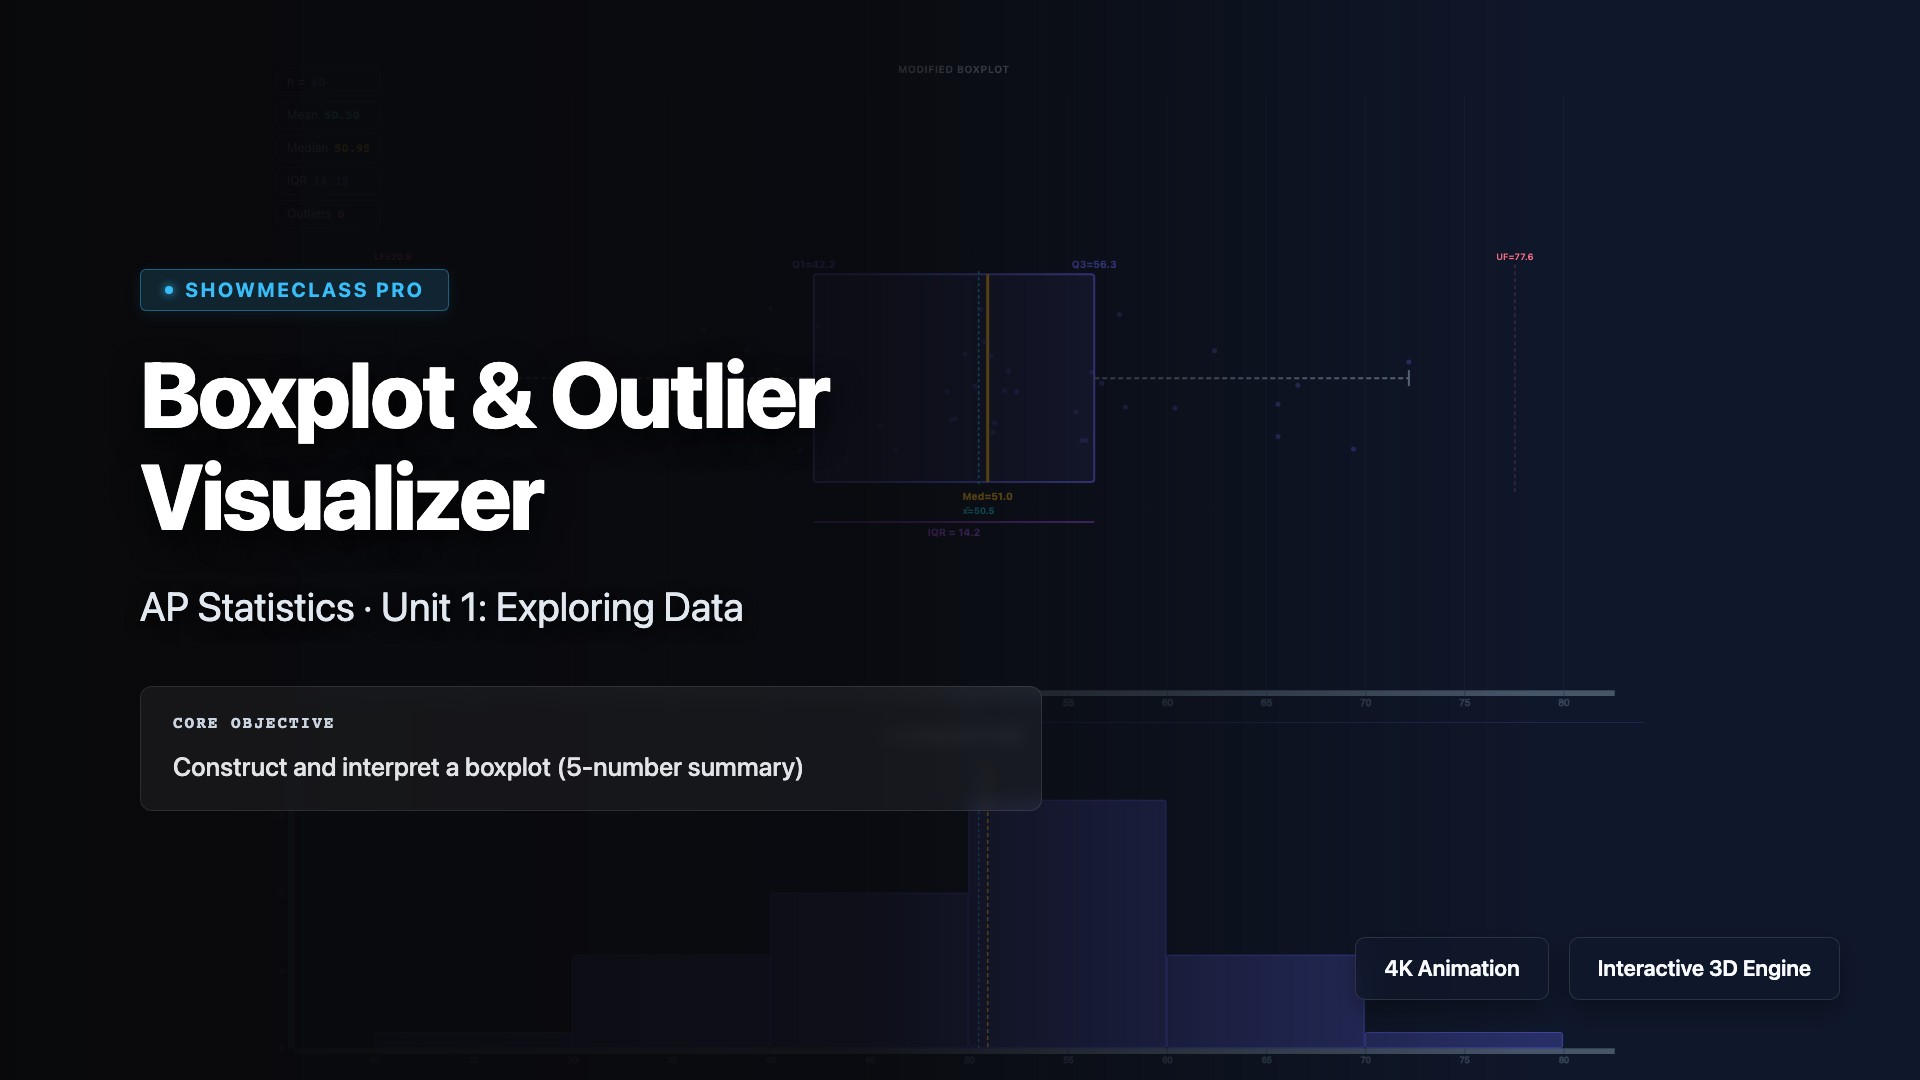
Boxplot & Outlier Visualizer
Visualize five-number summaries (minimum, Q1, median, Q3, maximum) in boxplots and identify outliers using the IQR rule. Explore how outliers beyond $Q1 - 1.5 imes IQR$ or $Q3 + 1.5 imes IQR$ affect data distribution and summary statistics.