Showing 12 results
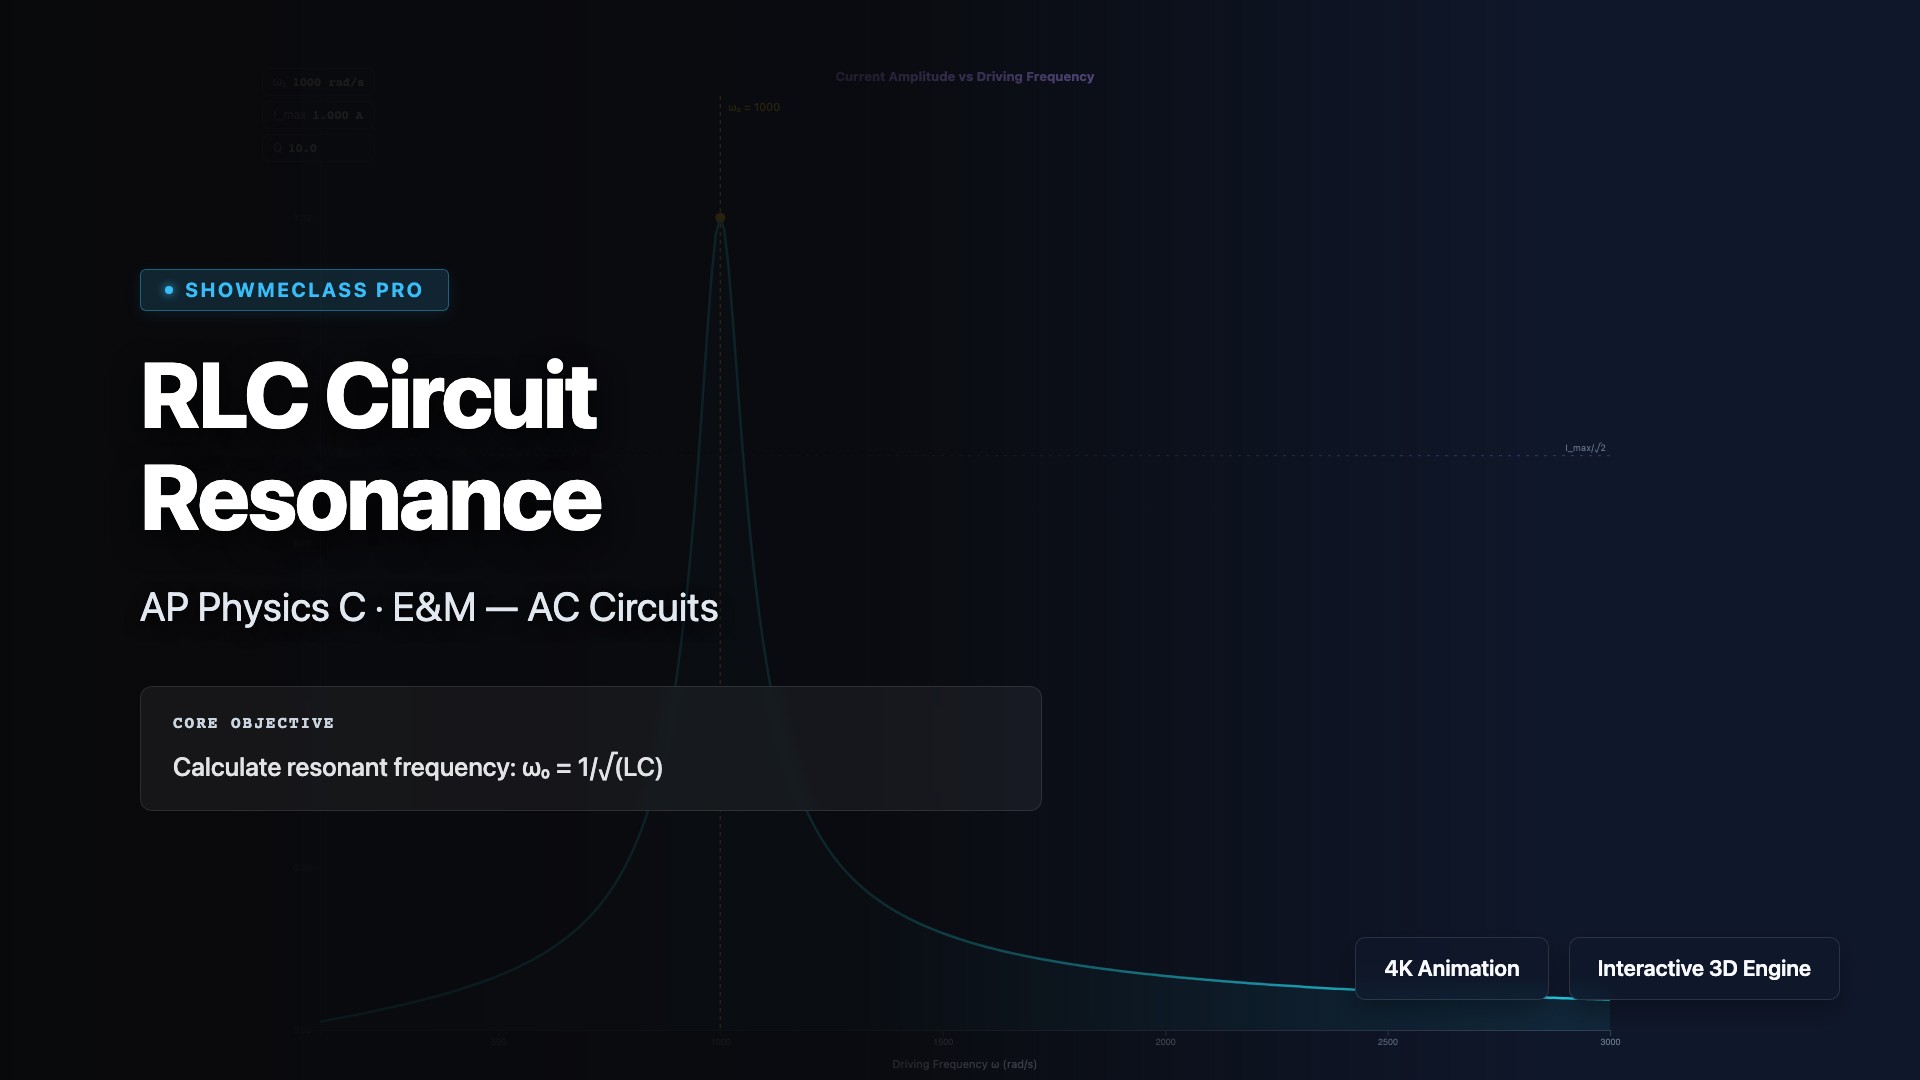
RLC Circuit Resonance
Explore series RLC resonance by sweeping driving frequency. See current amplitude peak at ω₀ = 1/√(LC), impedance minimum at Z = R, and quality factor determining bandwidth.
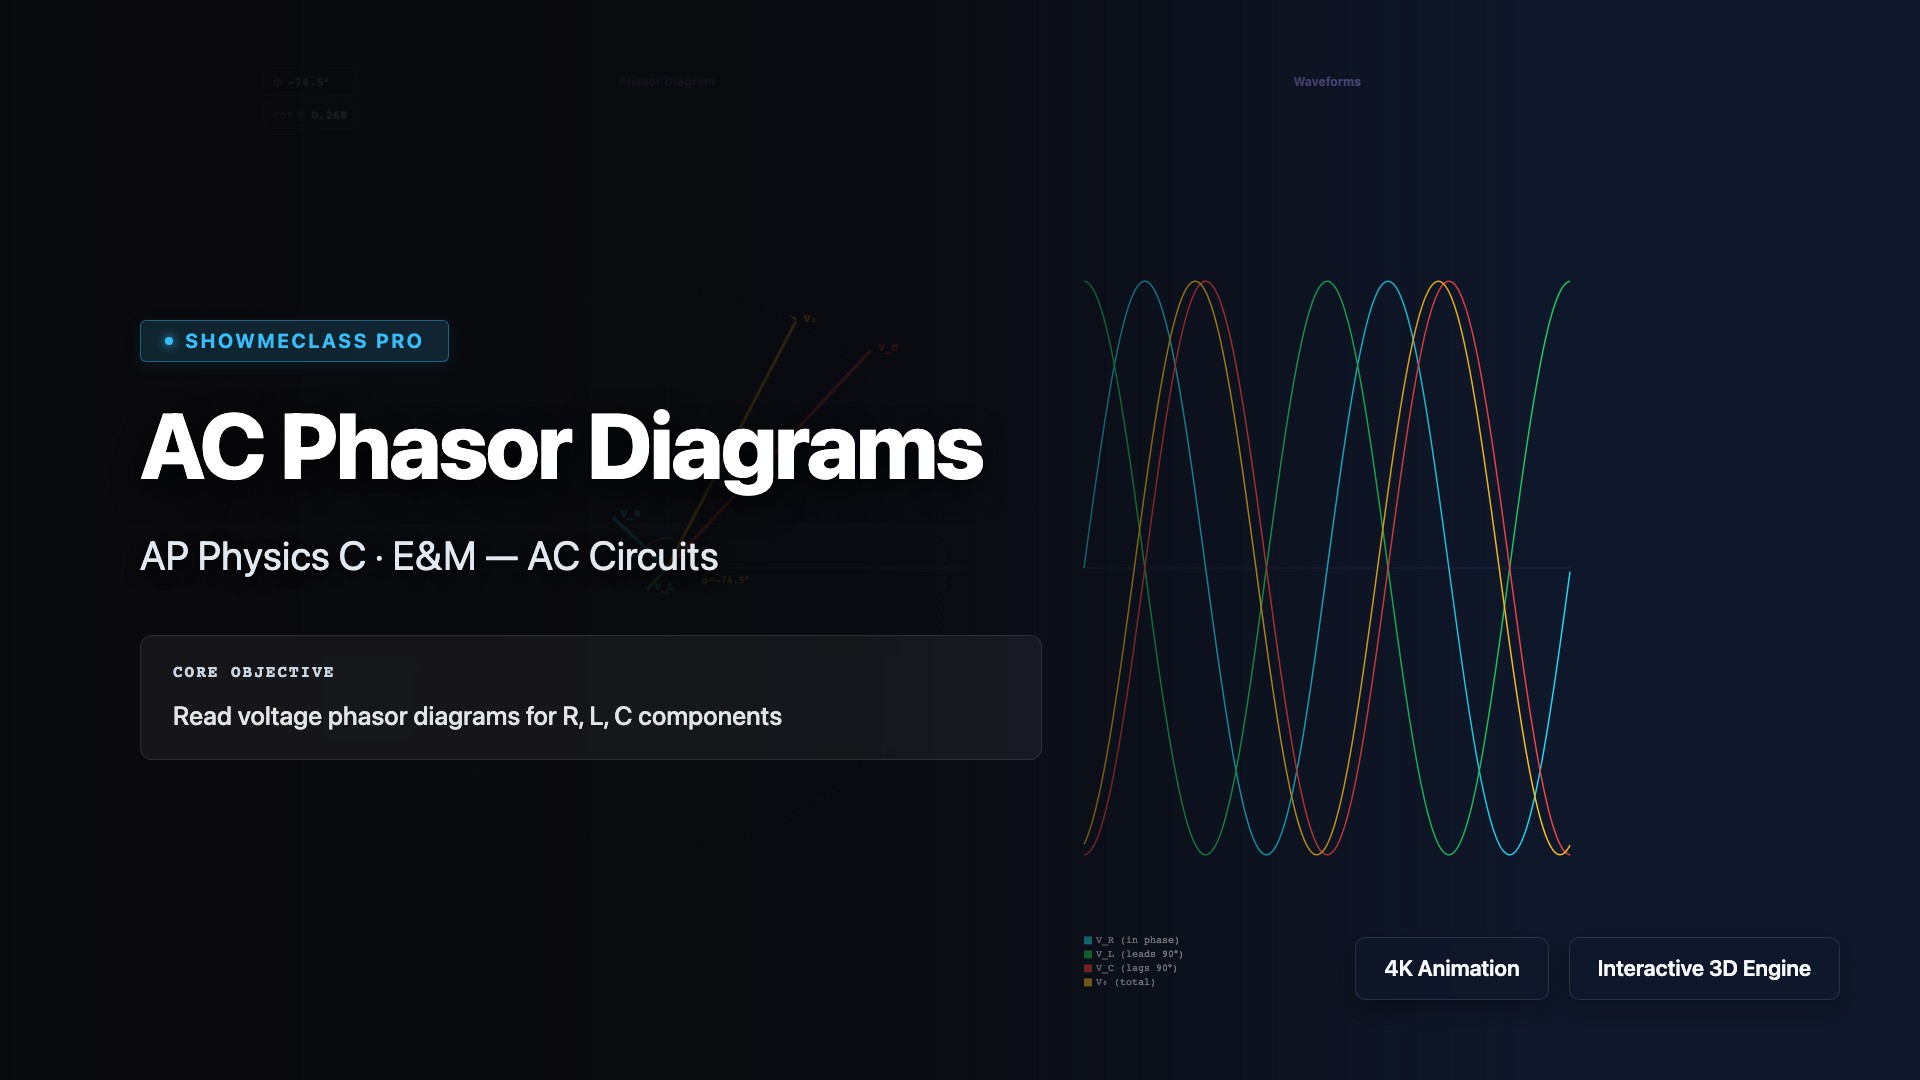
AC Circuit Phasor Diagrams
Animated phasor diagram showing V_R, V_L, V_C rotating vectors with real-time waveforms. Adjust ω, R, L, C to see phase angle φ and power factor change dynamically.
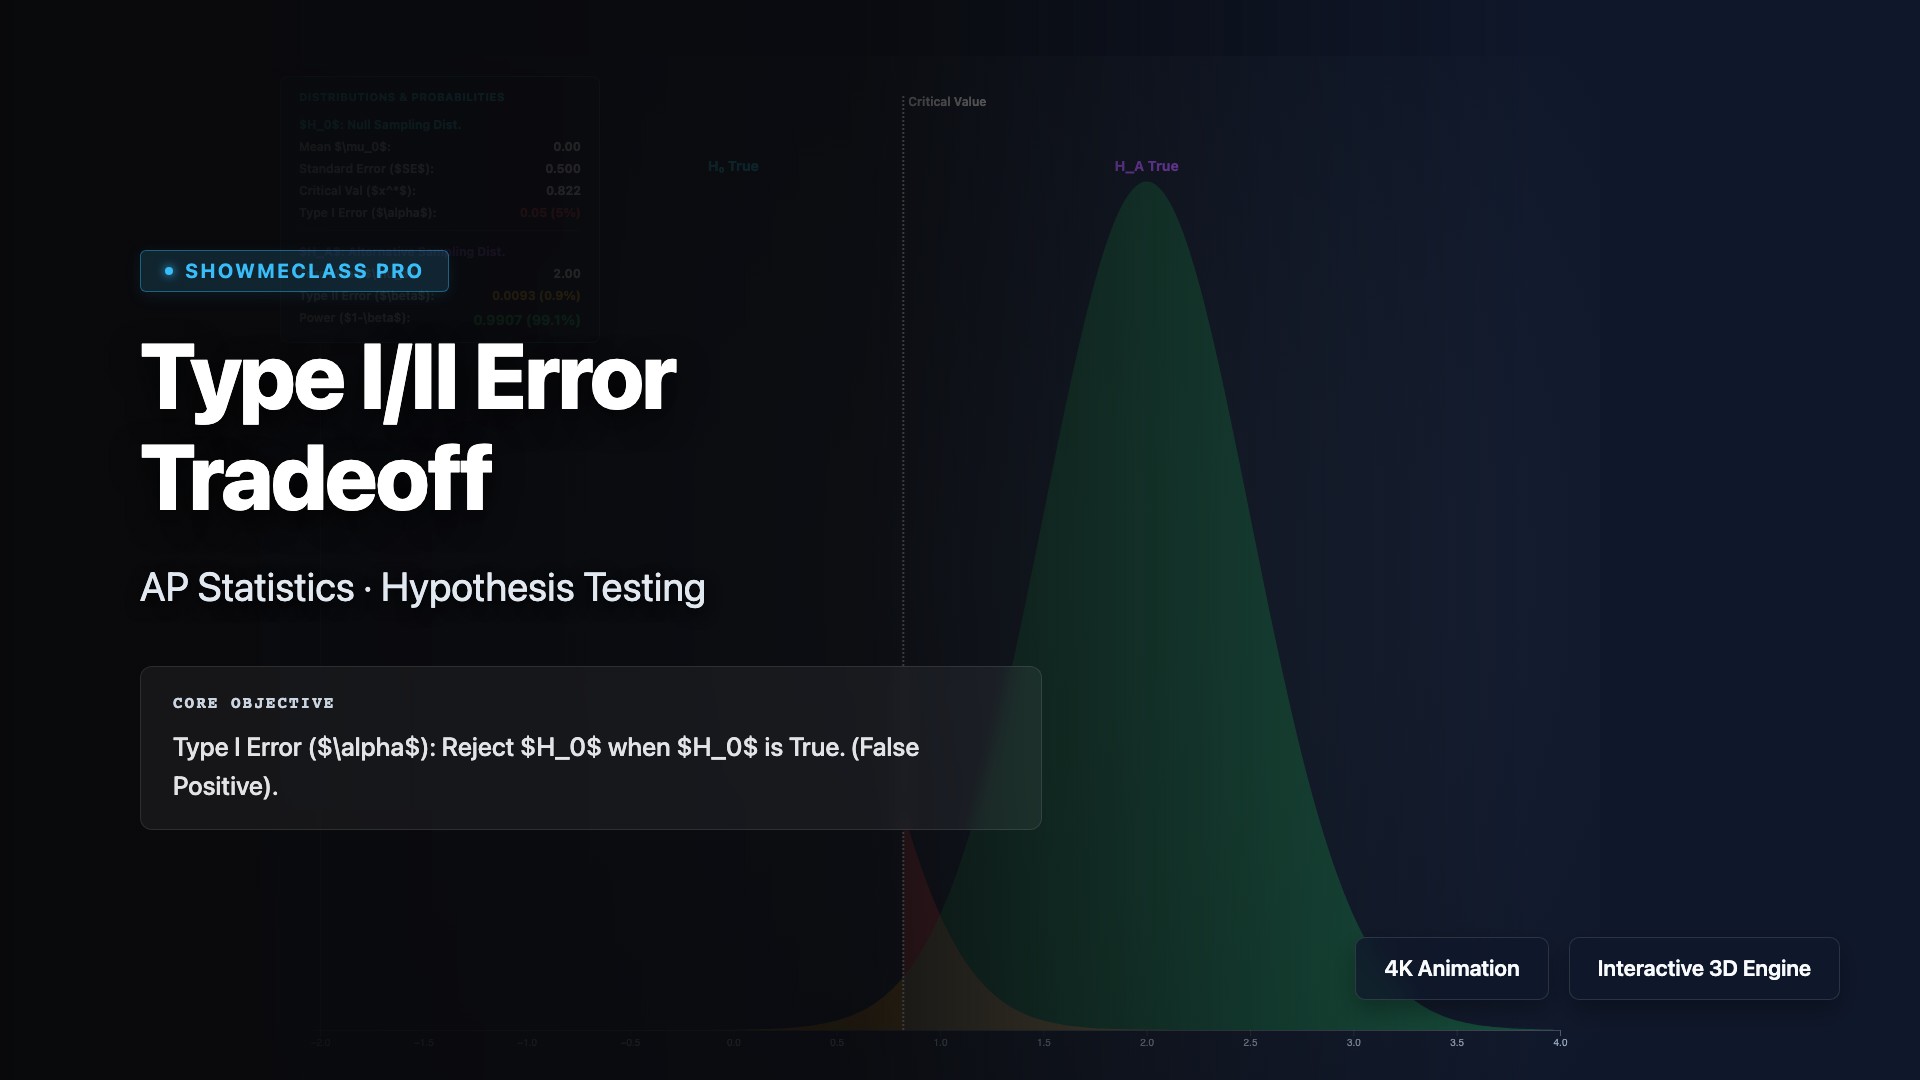
Type I/II Error & Statistical Power
Interactive hypothesis testing visualizer. Adjust Effect Size, Sample Size, and Alpha to instantly see the tradeoff balance between Type I Error, Type II Error, and Statistical Power.

Simpson's Paradox Visualizer
Examine confounding variables dynamically. Toggle between global and clustered regression data to observe mathematical trends magically reverse polarity (Pearson r) when separated.
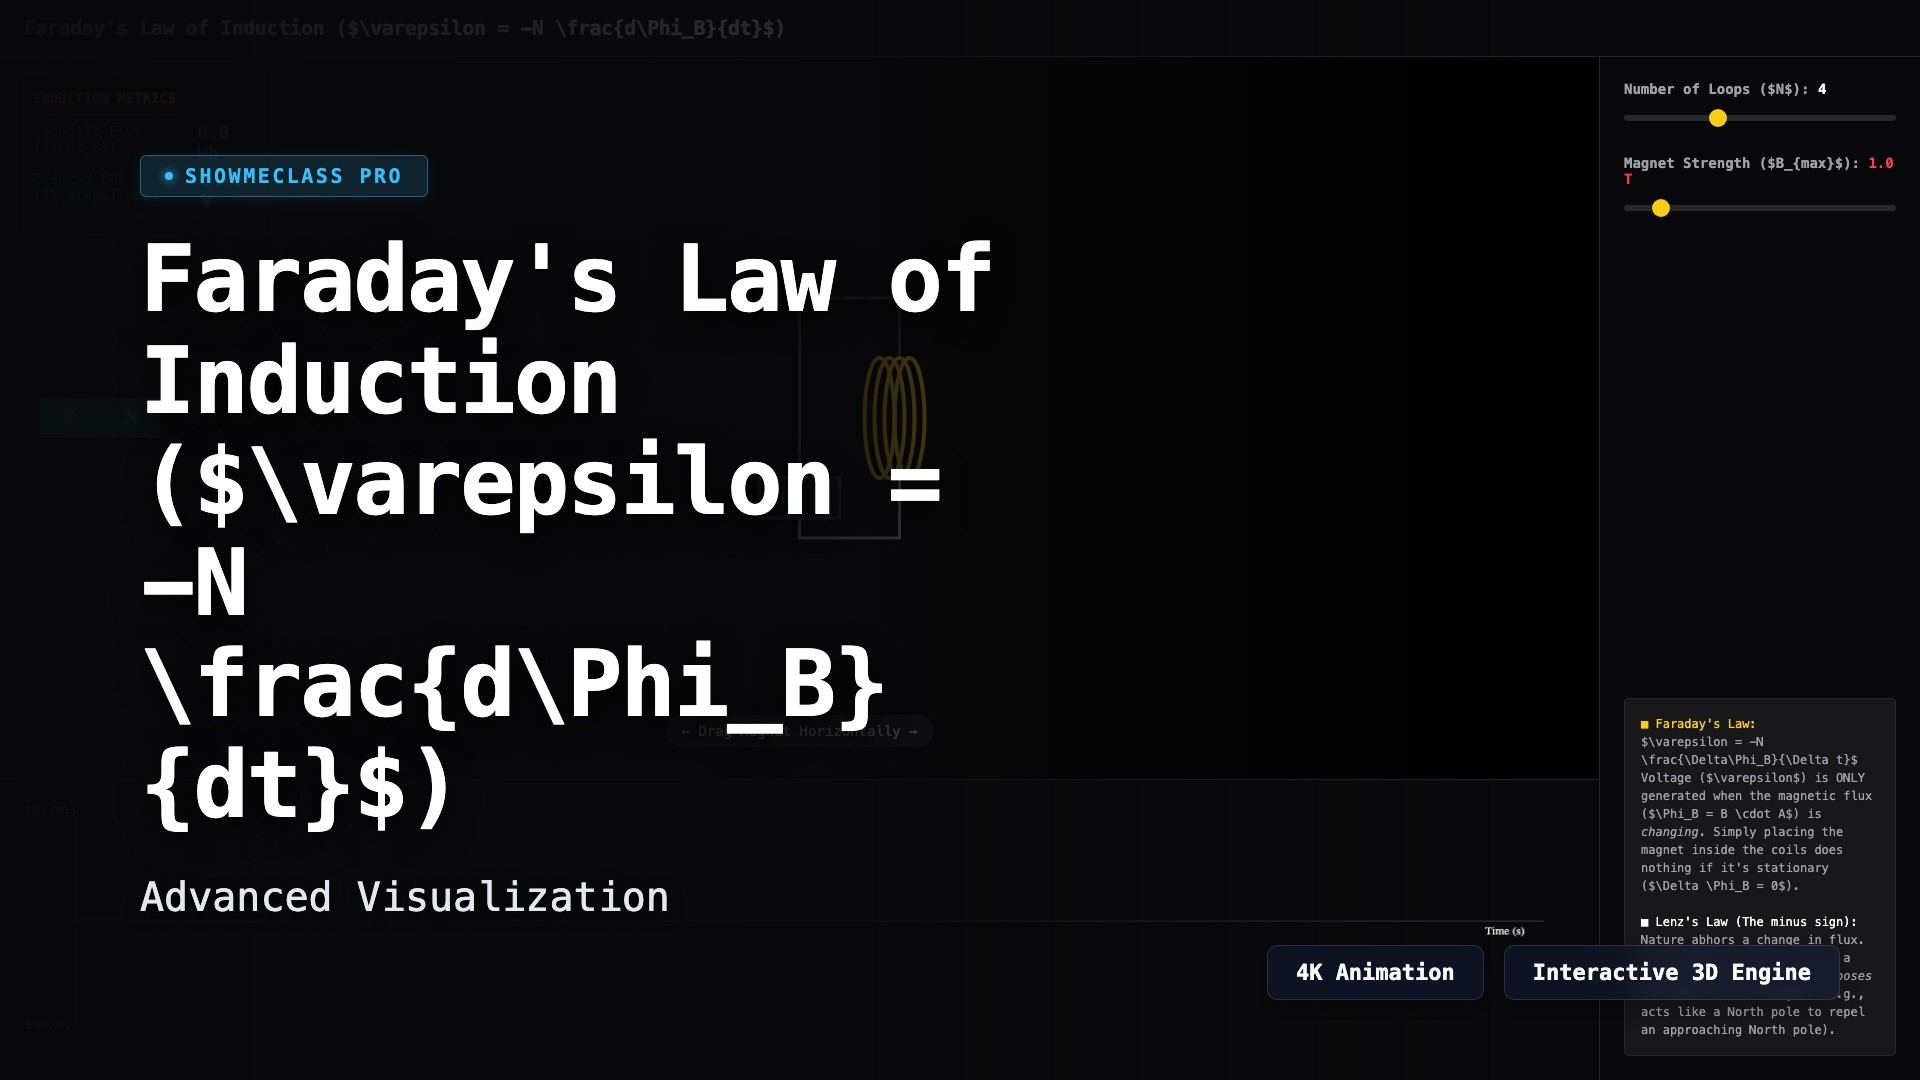
Magnetic Flux & Faraday/Lenz's Law
Visualize Maxwell's equations in action. Drag a permanent magnet through an Amperian coil and observe how dΦ/dt directly induces an opposing EMF spike dictated by Lenz's Law.
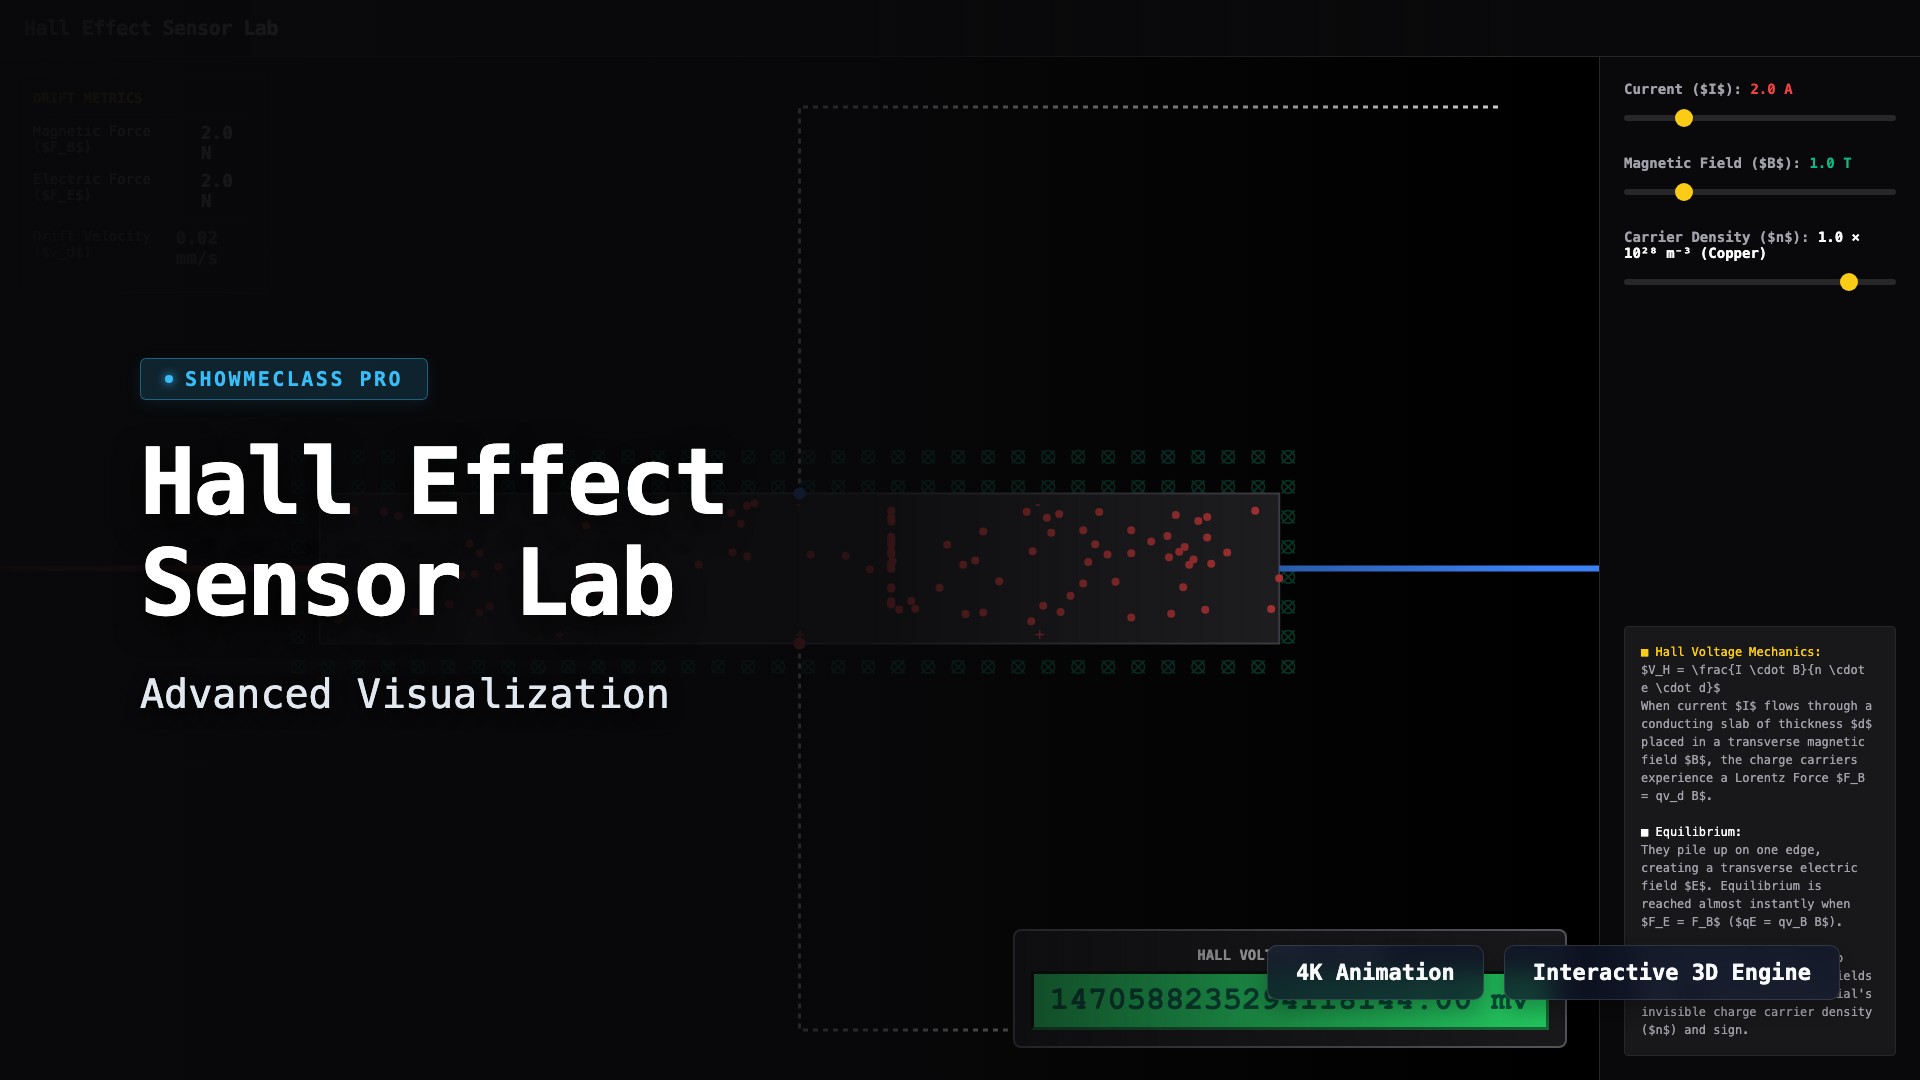
Hall Effect Sensor Lab
Inject current through a conducting slab placed in a transverse magnetic field to visualize the buildup of charge on the edges, generating the measuarble, transverse Hall Voltage.
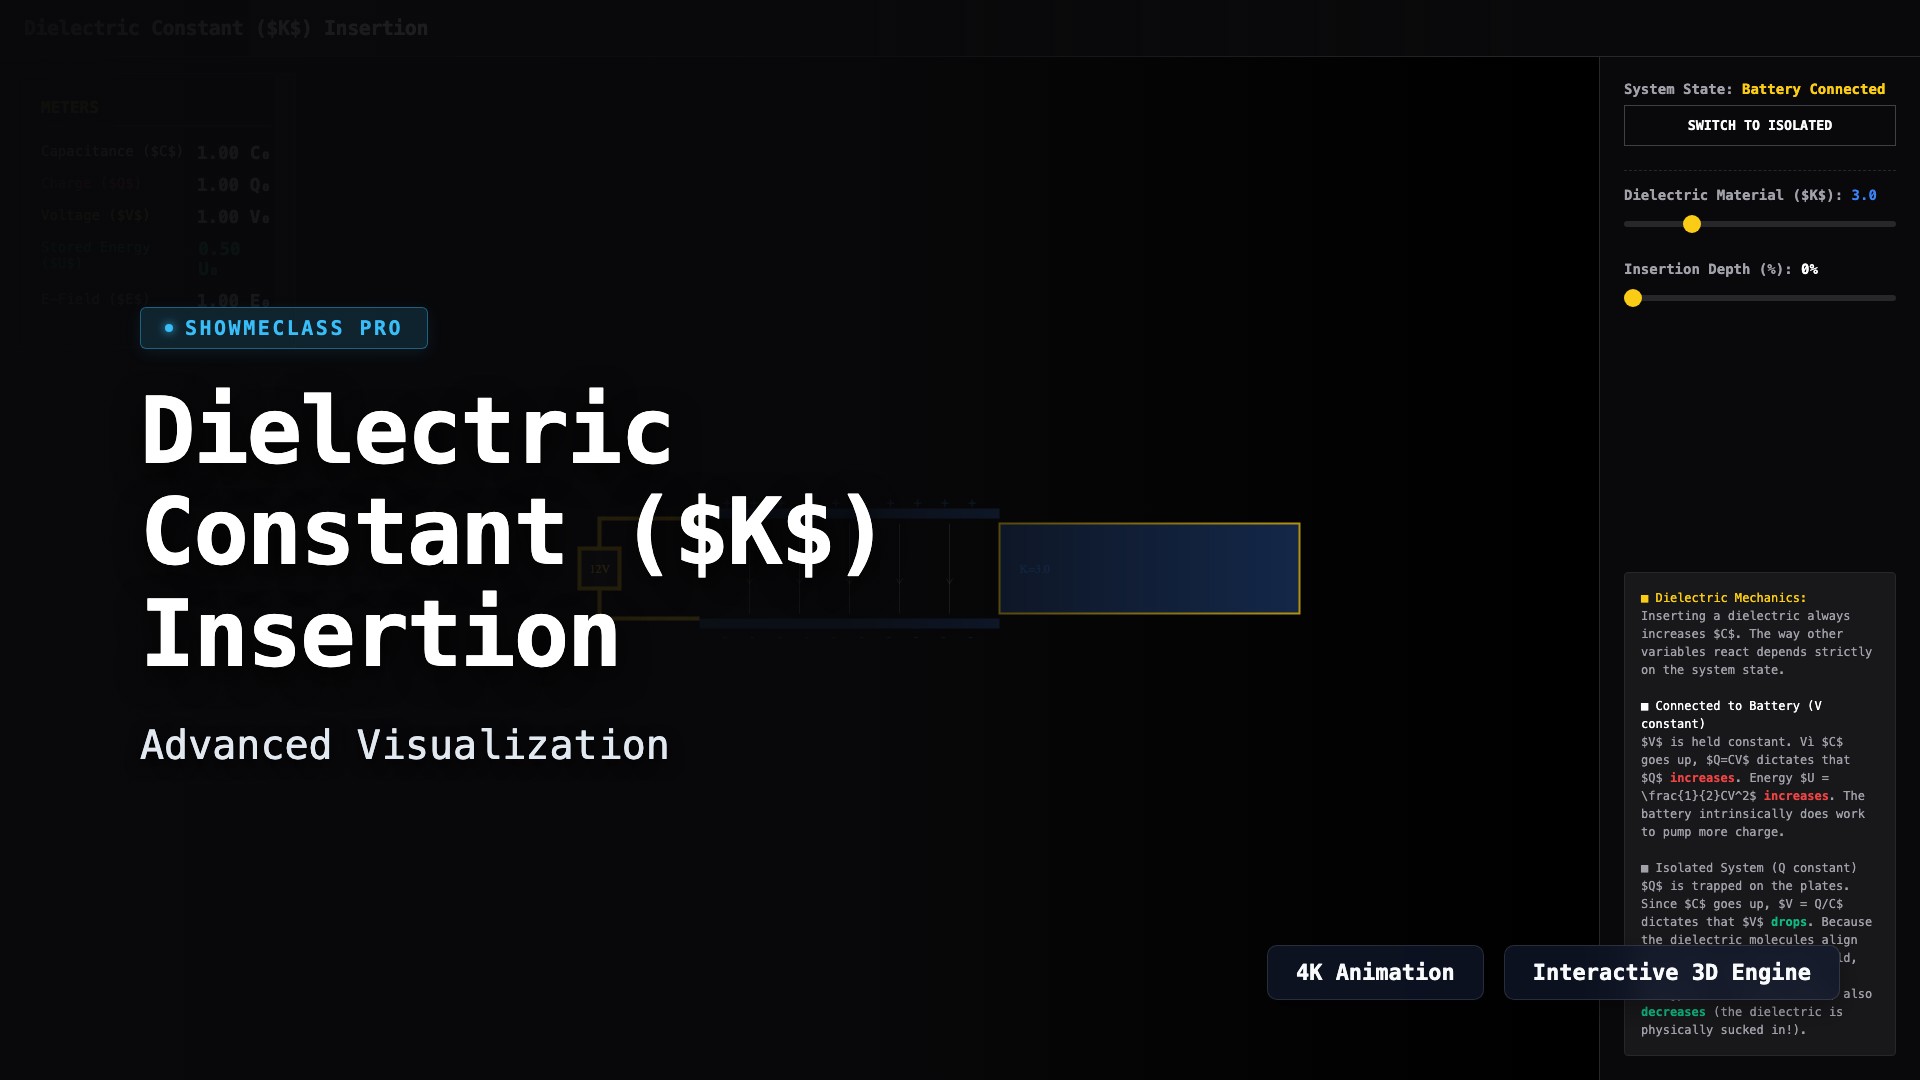
Capacitors with Dielectric Insertion
Visualize how pushing a dielectric constant (K) between parallel plates dynamically shifts Capacitance, Charge, Voltage, stored Energy (U), and E-Field intensity. Compare connected vs isolated scenarios.

Variable Mass System (Rocket Equation)
Explore the Tsiolkovsky Rocket Equation. Model continuous thrust as mass exponentially decreases due to fuel burn, comparing standard linear kinematic acceleration against variable-mass exponential acceleration.
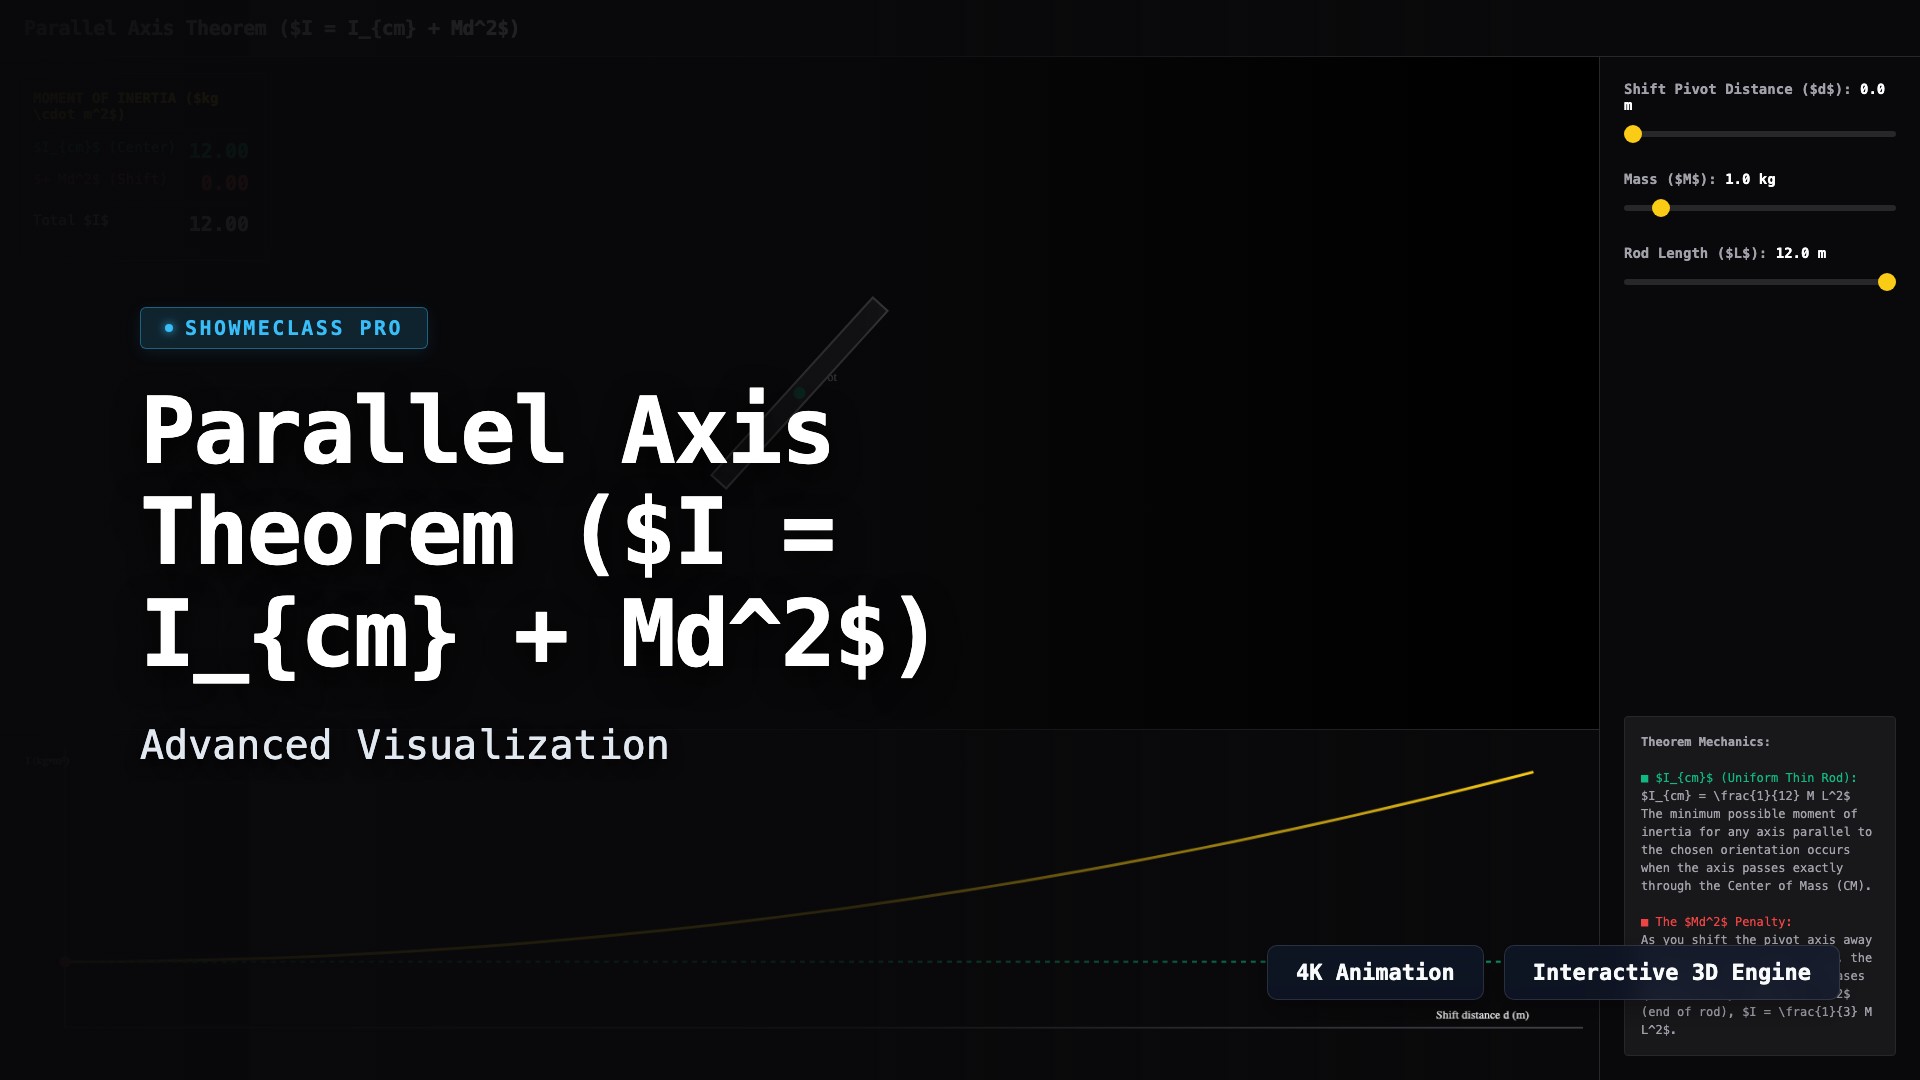
Parallel Axis Theorem Visualizer
Visualize how the moment of inertia scales quadratically as the rotation axis shifts away from the center of mass. Interactively drag the pivot point along a rigid rod and plot the Md² penalty.
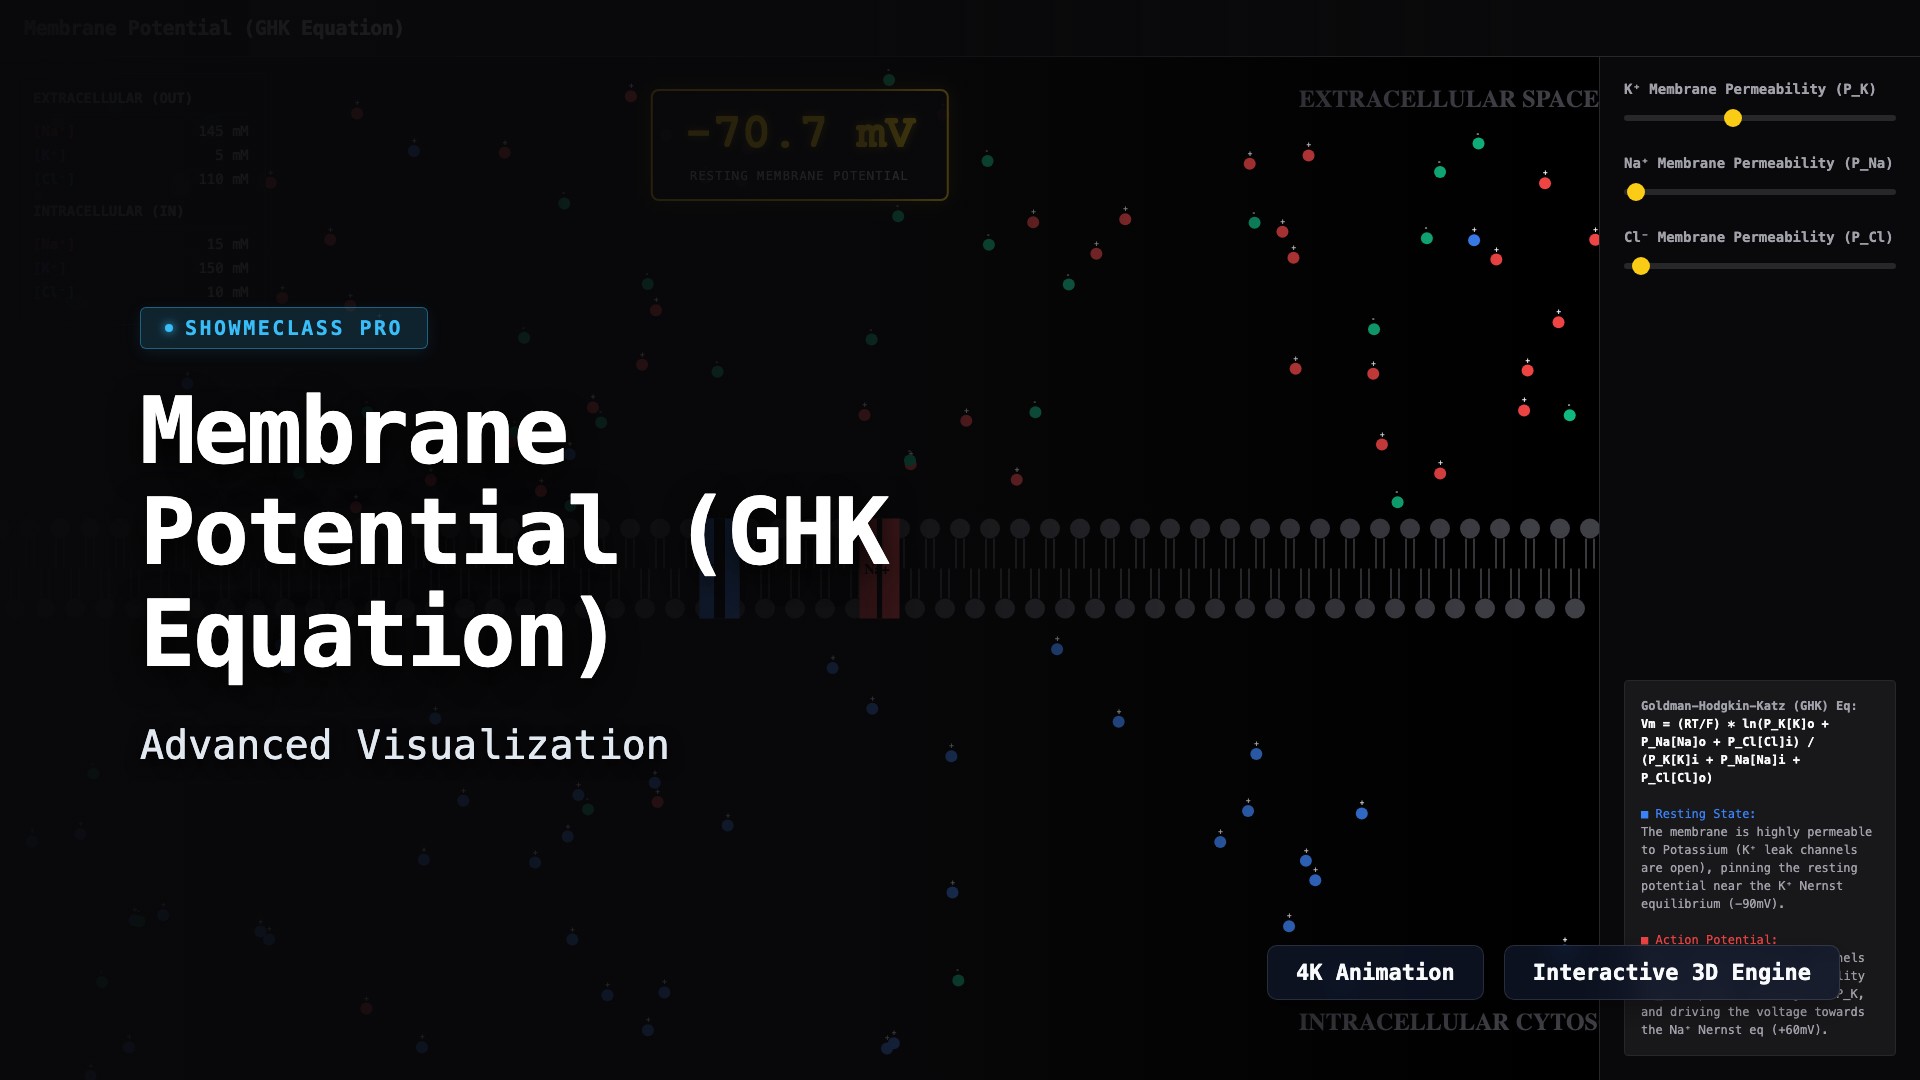
Membrane Potential & Nernst Equation
Calculate the resting membrane potential using the Goldman-Hodgkin-Katz equation. Visualize Na⁺ and K⁺ leak channels, actively tweak permeabilities, and trigger simulated action potentials.
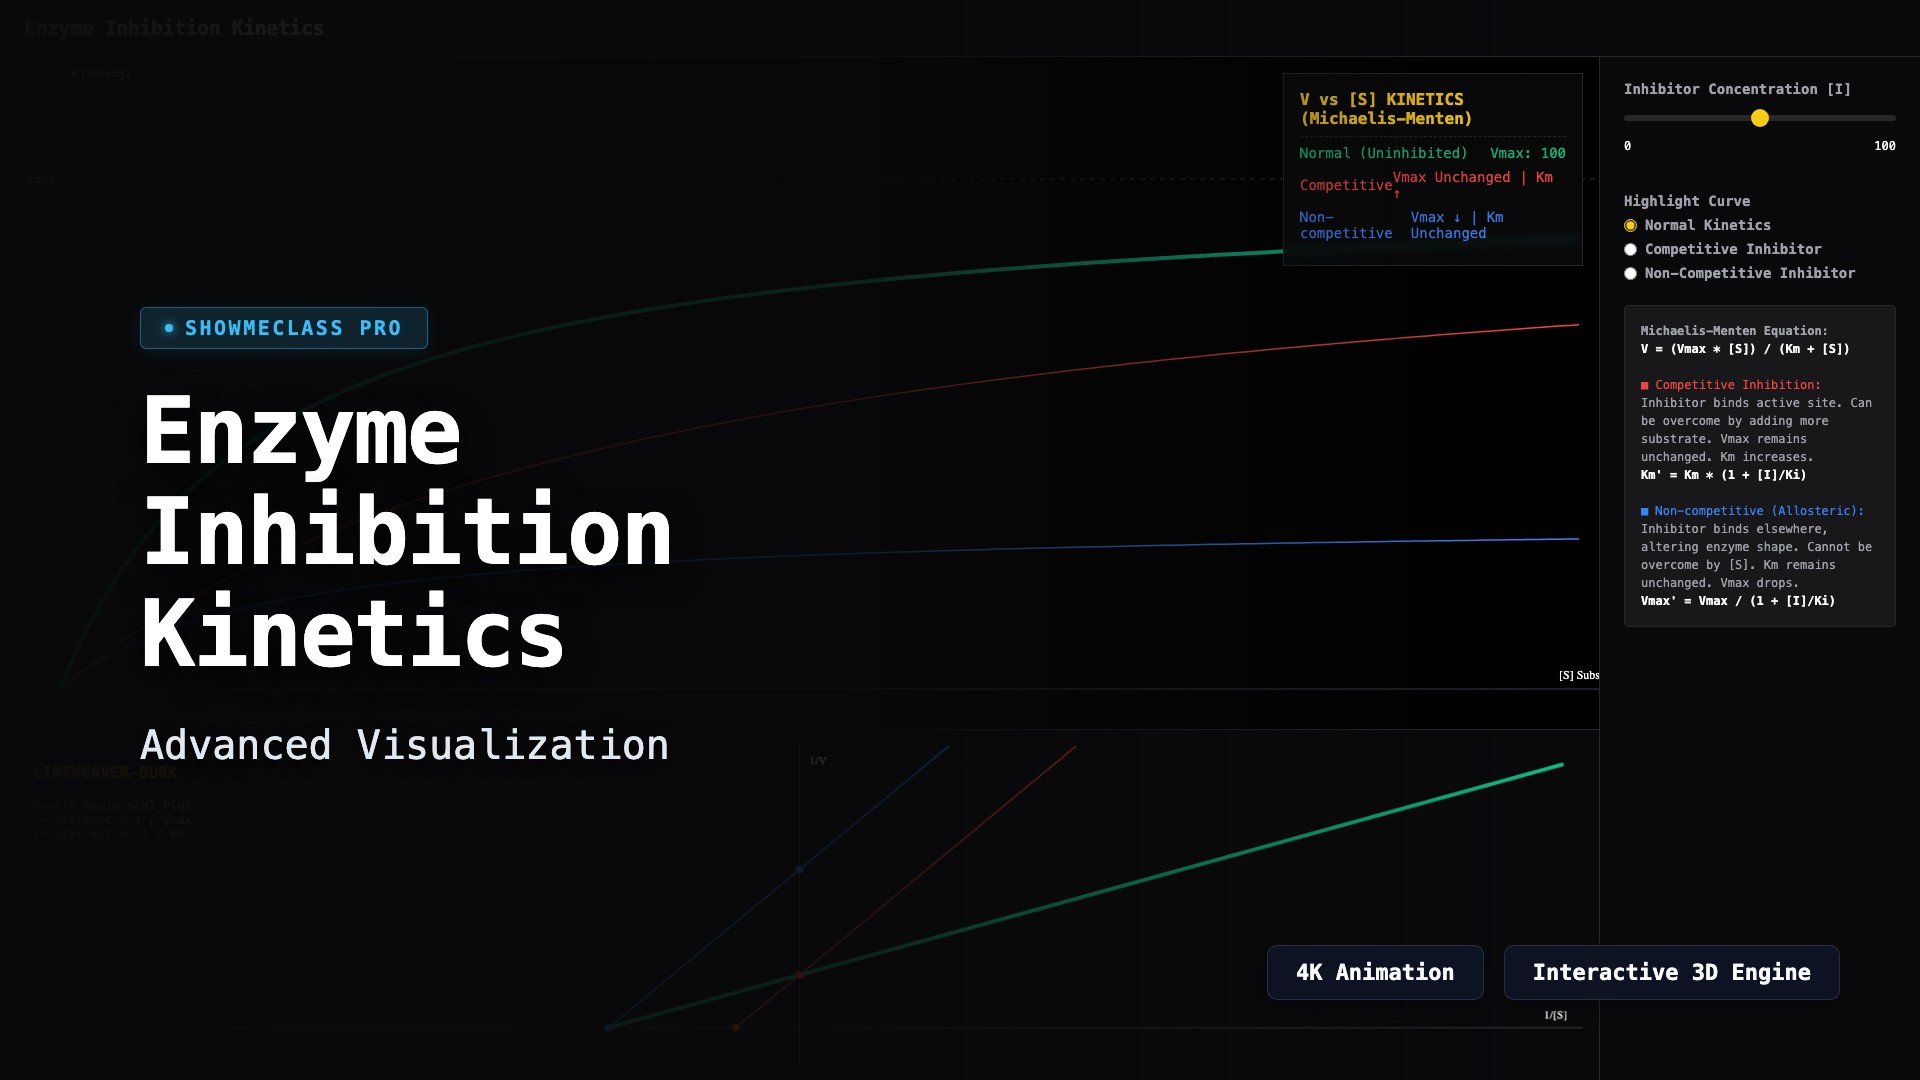
Enzyme Inhibition Kinetics
Analyze Michaelis-Menten kinetics and Lineweaver-Burk double reciprocal plots. Dynamically compare Normal, Competitive, and Non-competitive (Allosteric) inhibition by altering substrate and inhibitor concentrations.

Immune System Clonal Selection
Simulate the Lock-and-Key mechanism of the immune system. Inject various pathogen epitopes and observe how massive clonal expansion and antibody production is triggered only when a naive B-Cell matches the exact molecular geometry.