Showing 12 results

Ballistic Pendulum Conservation
Analyze the classic dual-phase conservation problem. Shoot a bullet into a block to visualize the entirely inelastic momentum transfer and instantaneous loss of kinetic energy, followed by the pendulum swing where mechanical energy is perfectly conserved.

Meselson-Stahl DNA Replication
Replicate the most beautiful experiment in biology. Centrifuge radioactive nitrogen isotopes (15N vs 14N) across bacterial generations to generate heavy, hybrid, and light DNA bands proving semi-conservative replication.

EROI Energy Return
Comparator for Energy Return on Investment (EROI), mapping the high yields of early oil and hydro against the modern low-yield reality of tar sands and corn ethanol.
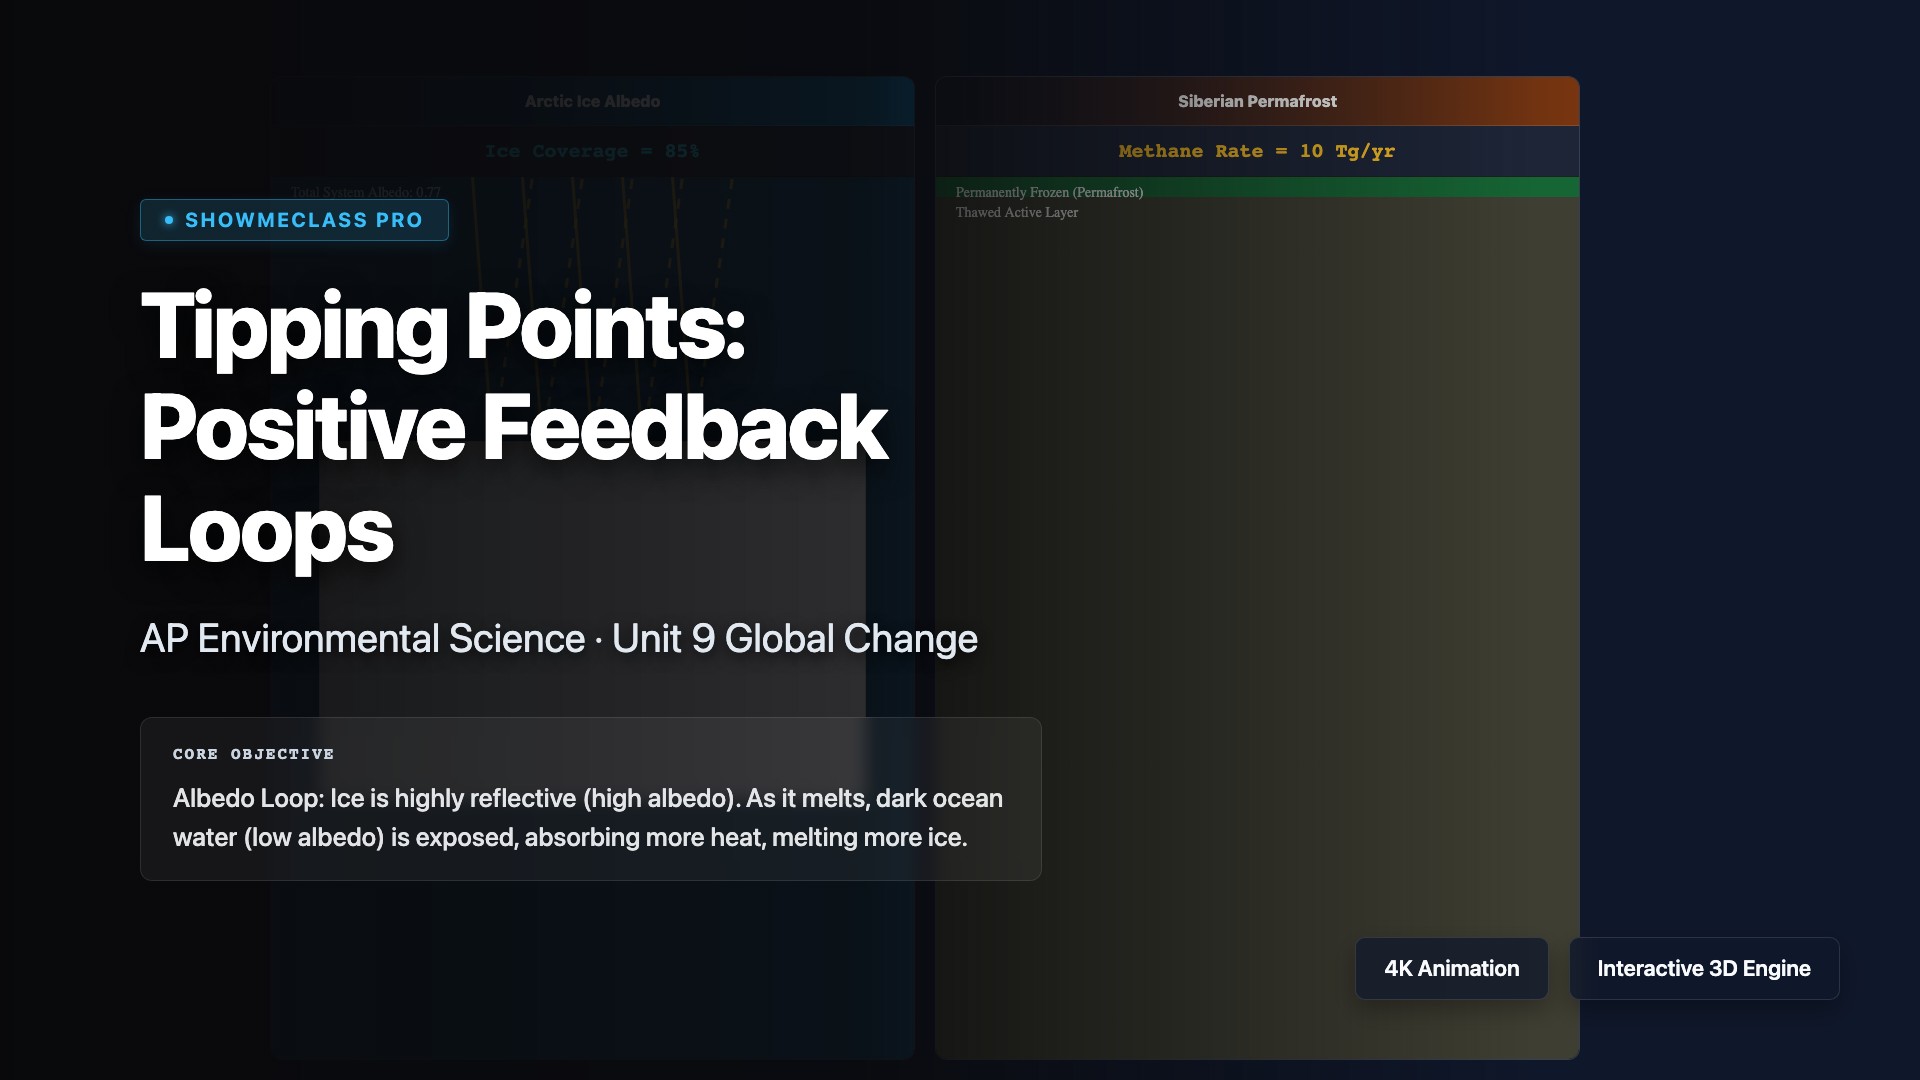
Tipping Points: Positive Feedback Loops
Dual-simulator visualizing physical positive climate tipping points: the exponential loss of sea-ice reflectivity (Albedo) alongside explosive methane expulsion from thawing Siberian permafrost.
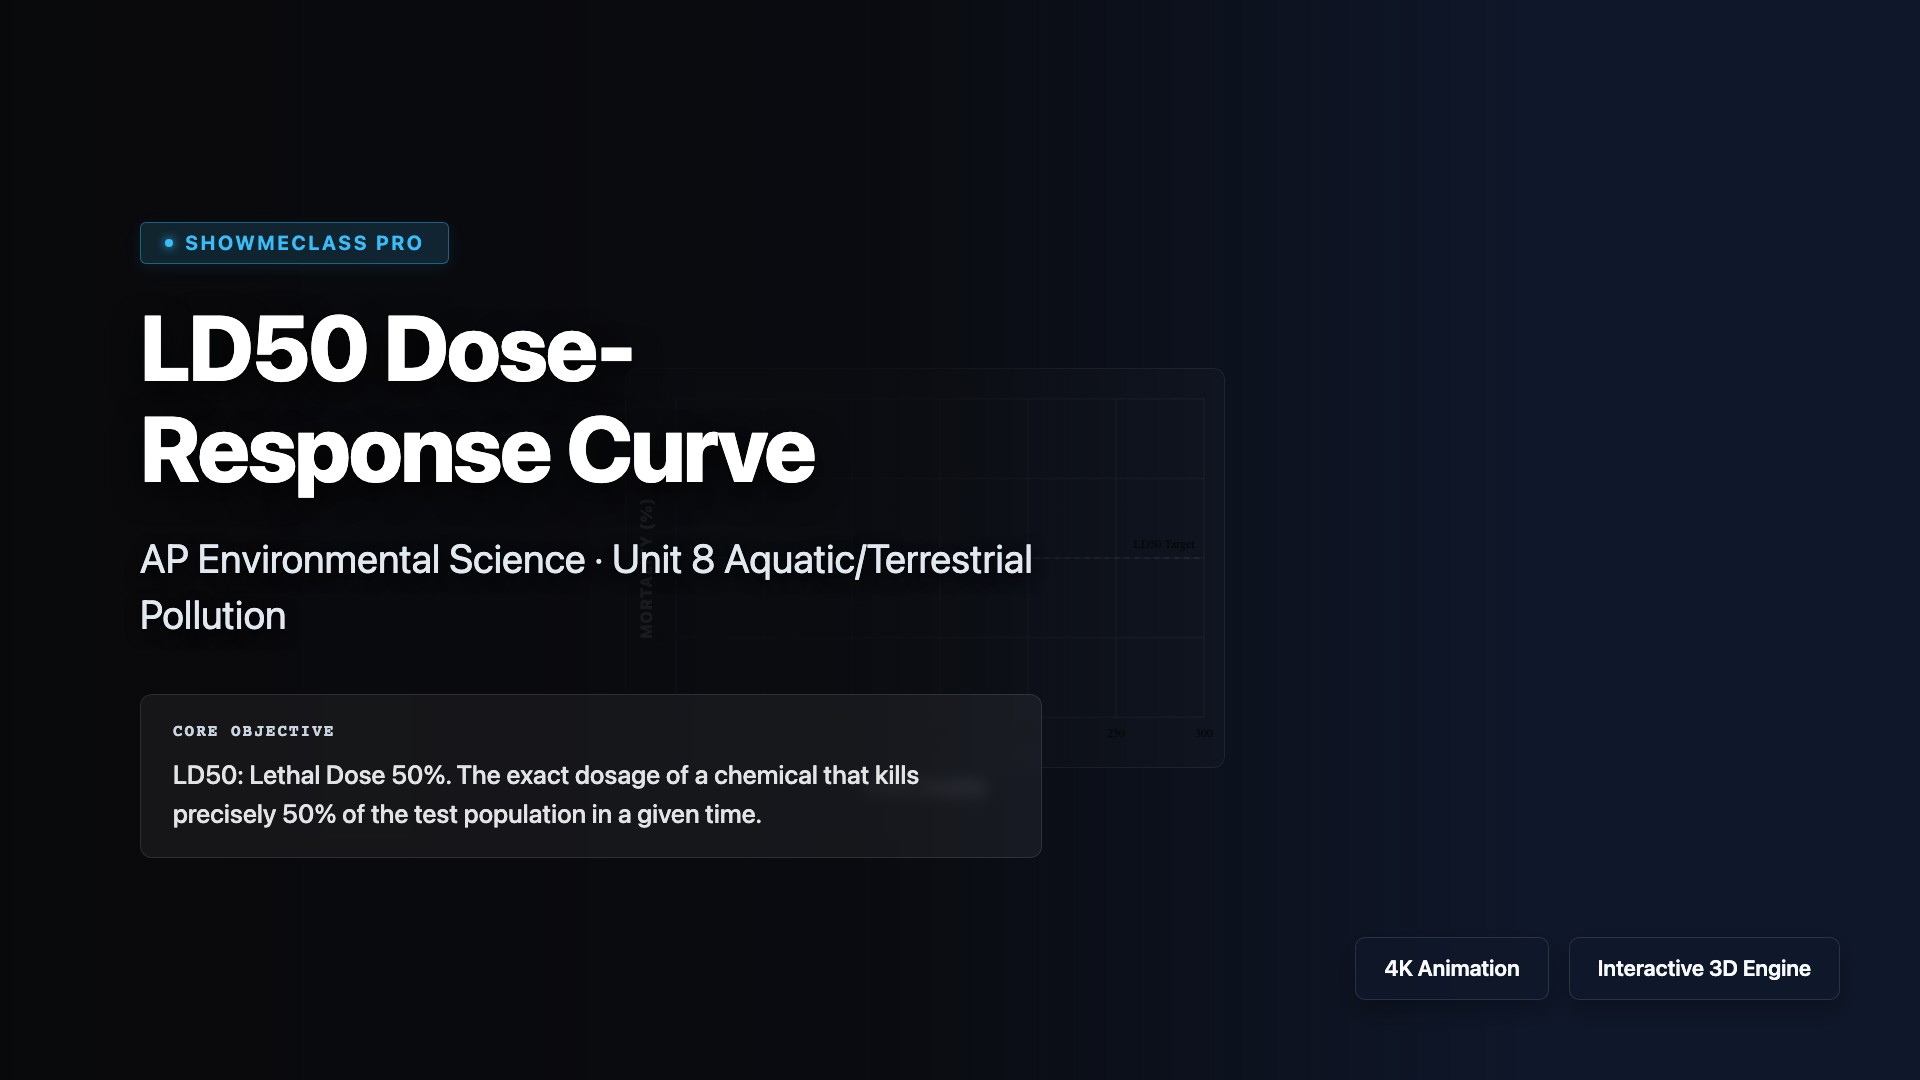
LD50 Dose-Response Curve
Toxicological laboratory test plotting the classic S-shaped dose-response curve to mathematically isolate the lethal dose 50% (LD50) threshold constraint.

Tax Incidence & Deadweight Loss Simulator
Settle the debate over who actually pays taxes. Adjust Supply/Demand elasticities and apply an Excise Tax to instantaneously visualize the Consumer Burden (Blue), Producer Burden (Red), and the inefficient Deadweight Loss (Yellow).

Newton-Raphson Method Root Finder
Track the wild convergence of Newton's Method. Place an initial guess x0 and watch iterative tangent lines slice toward the true polynomial root. Place the guess at a local minimum (f'(x)=0) to provoke absolute visual divergence.

Simpson's Paradox Visualizer
Unlock one of statistics' most counter-intuitive phenomenons. Observe two completely separate datasets that both exhibit strong POSITIVE correlations. Merge them together and watch the global line of best fit instantly reverse into a NEGATIVE correlation.

Millikan Oil Drop Experiment
Recreate the 1909 Nobel-winning experiment. Adjust the voltage across two capacitor plates to suspend falling oil drops in mid-air (qE = mg). Fire the X-Ray ionizer to randomly step the charge up or down in discrete quantized increments of 'e'.
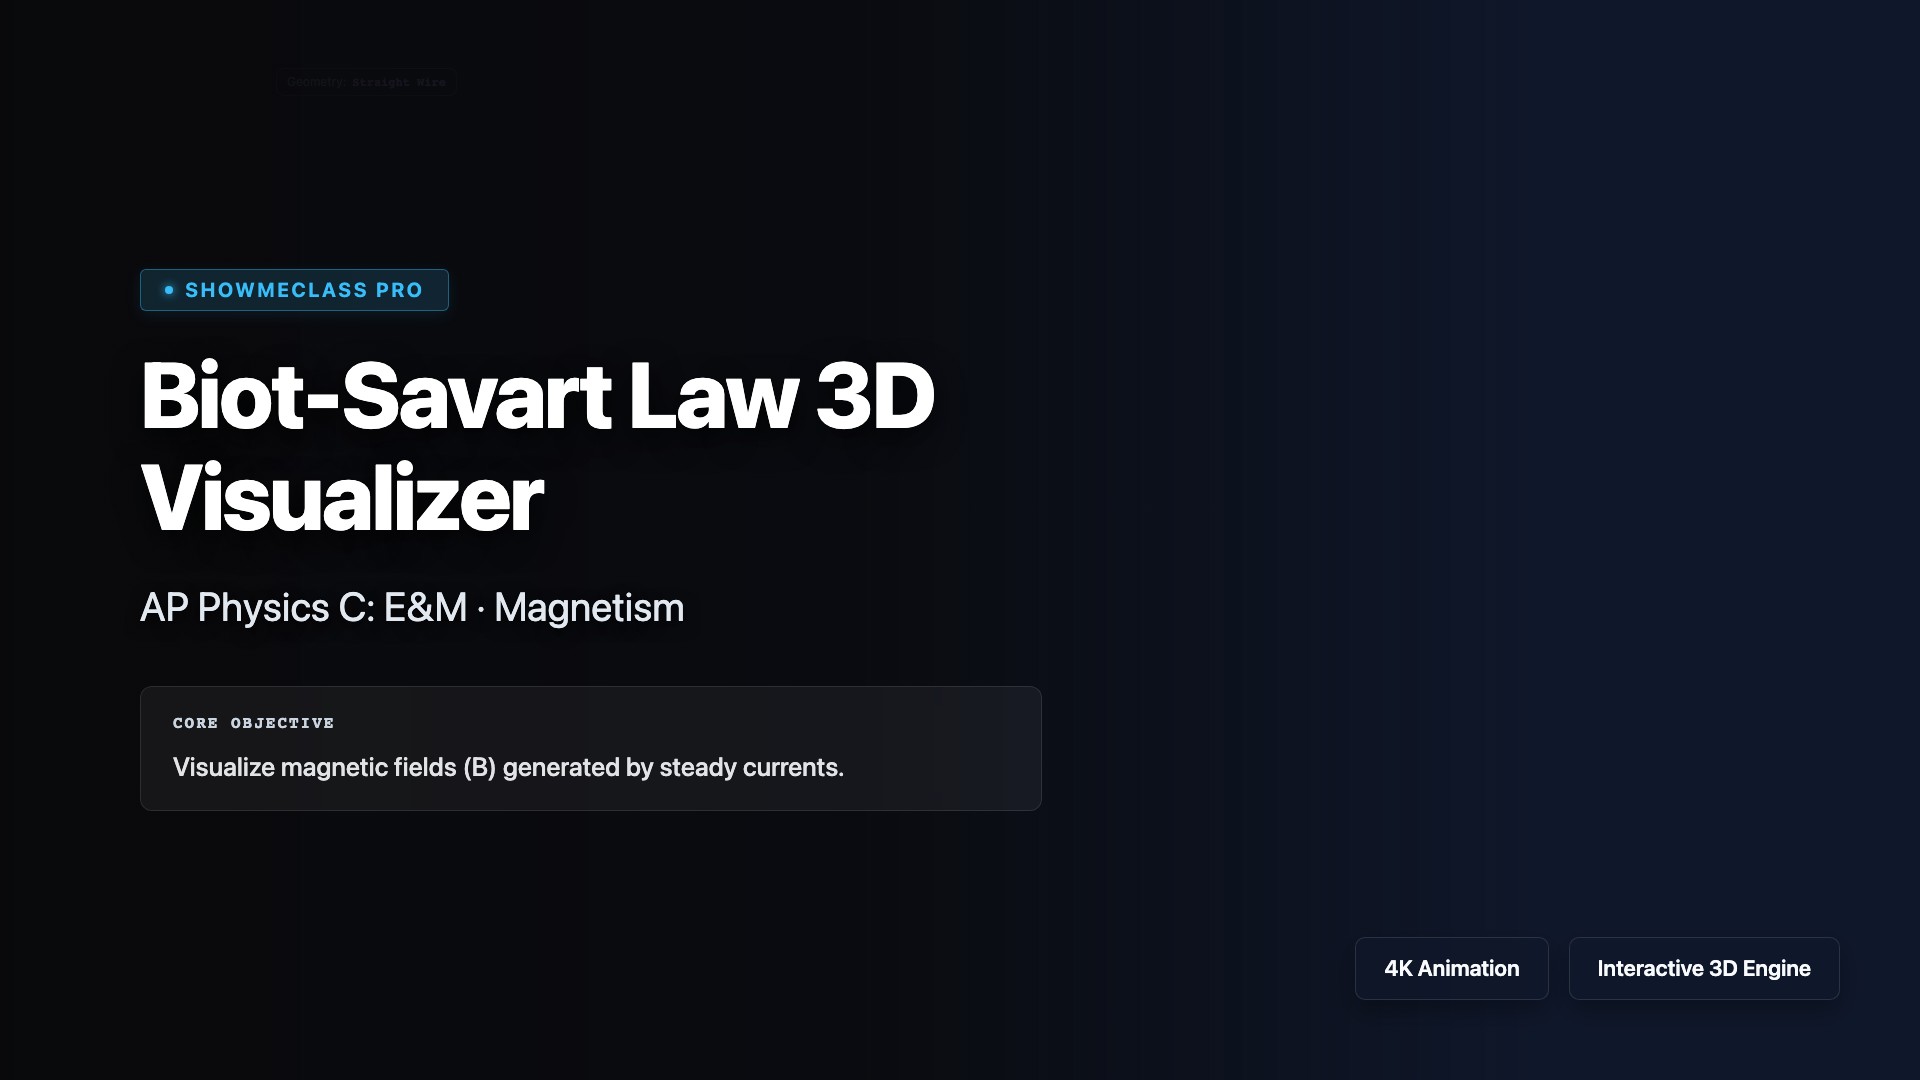
Biot-Savart Law 3D Visualizer
Visualize the 3D magnetic field vectors B generated by steady currents. Switch between straight conductive wires, circular loops, and solenoids to understand the Right Hand Rule and spatial 1/r² decay.

Taylor Series Approximation
Watch Maclaurin series polynomials geometrically 'hug' a target original curve. Drag the slider to add higher-degree polynomial terms to sine, cosine, e^x, and ln(1+x), witnessing convergence intervals.

SN1 vs SN2 Mechanisms 3D
Interactive 3D simulation of nucleophilic substitution reactions. Compare the concerted backside attack of an SN2 mechanism (inversion) with the stepwise planar carbocation of an SN1 mechanism (racemization).