Showing 12 results
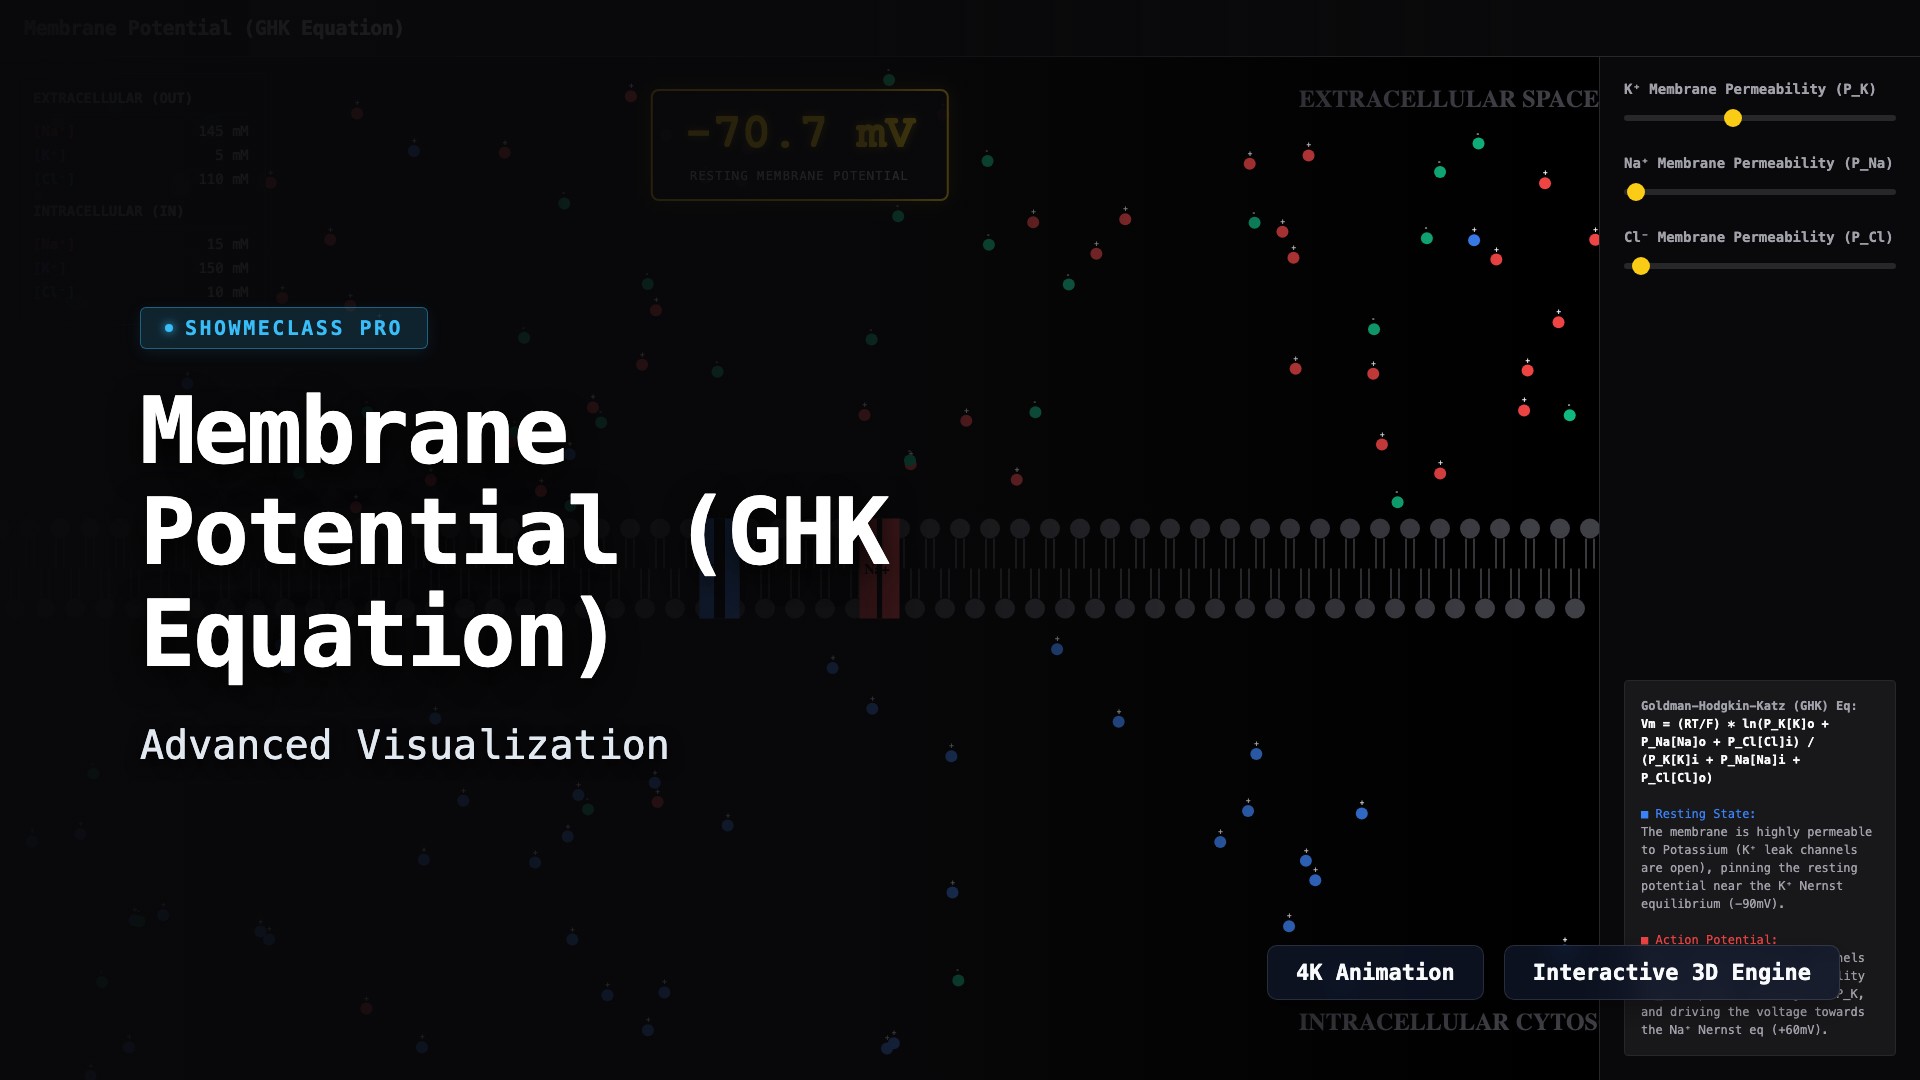
Membrane Potential & Nernst Equation
Calculate the resting membrane potential using the Goldman-Hodgkin-Katz equation. Visualize Na⁺ and K⁺ leak channels, actively tweak permeabilities, and trigger simulated action potentials.
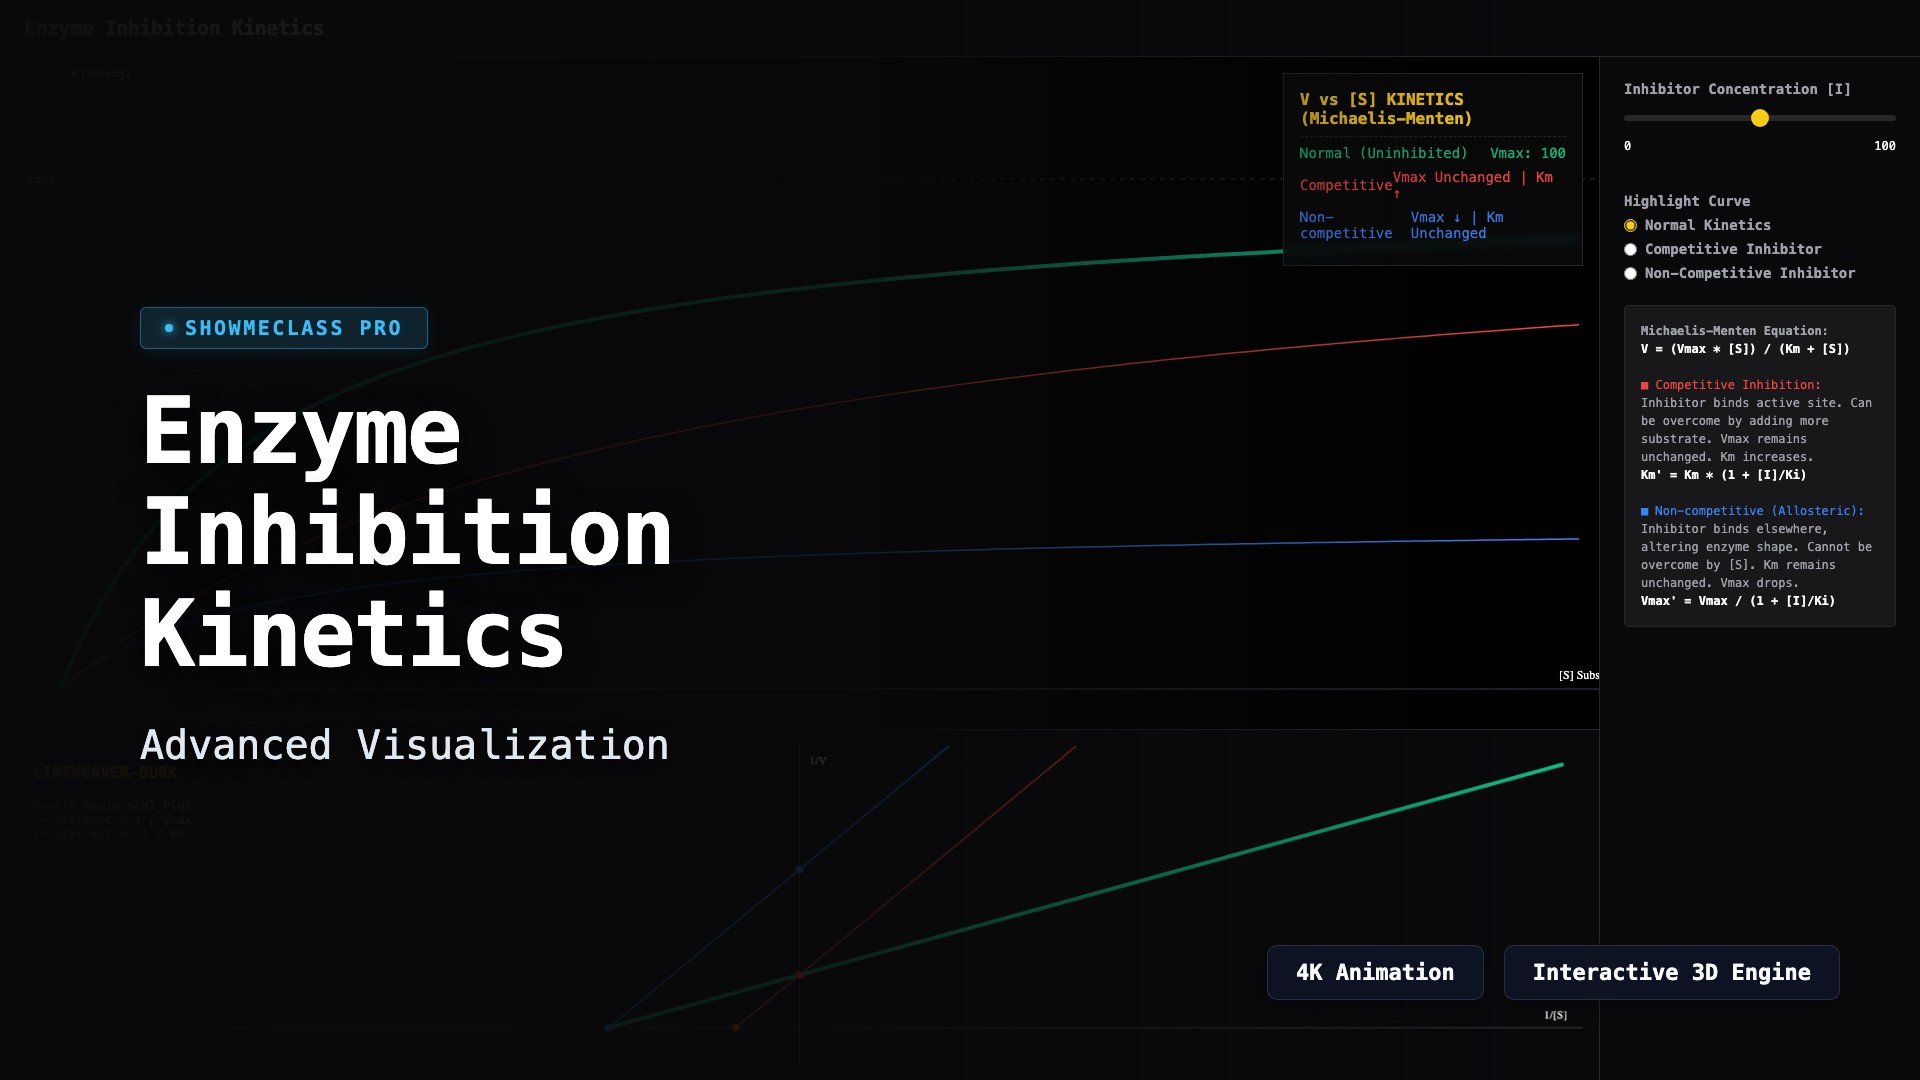
Enzyme Inhibition Kinetics
Analyze Michaelis-Menten kinetics and Lineweaver-Burk double reciprocal plots. Dynamically compare Normal, Competitive, and Non-competitive (Allosteric) inhibition by altering substrate and inhibitor concentrations.
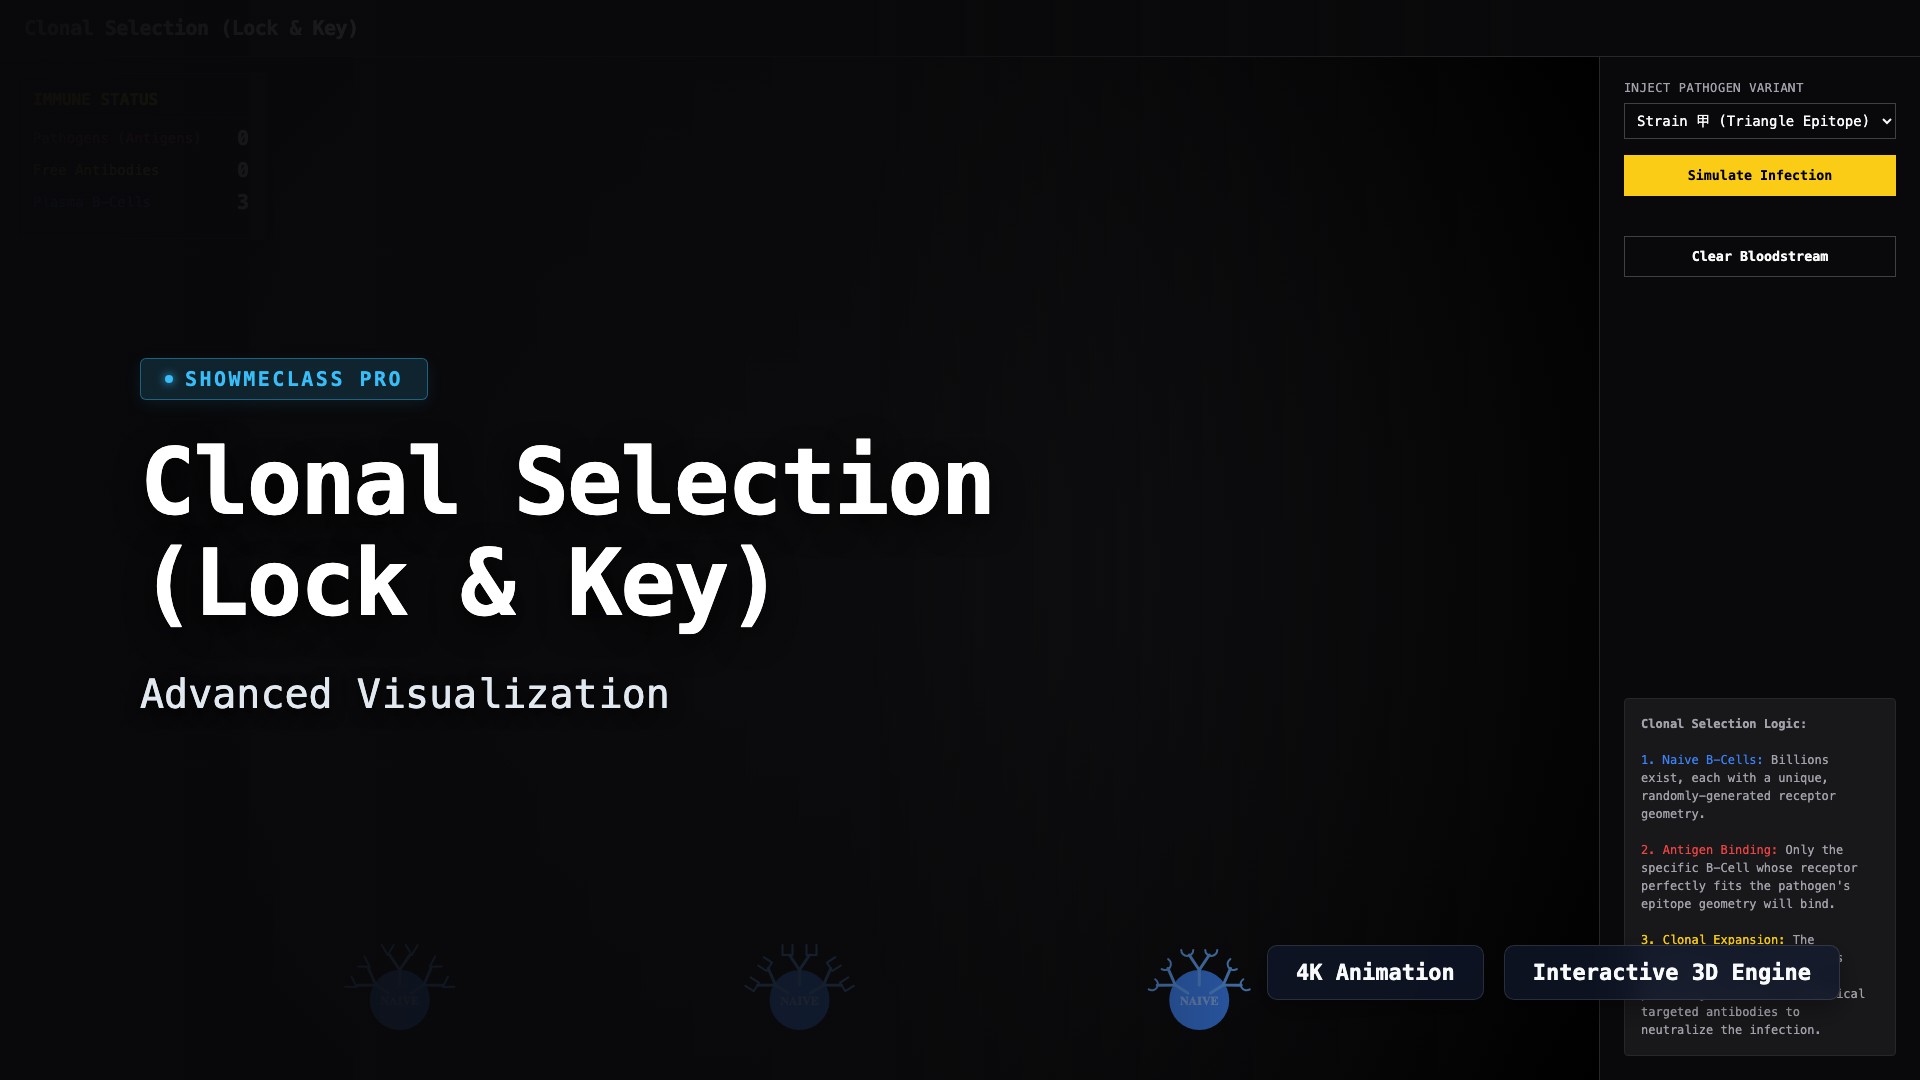
Immune System Clonal Selection
Simulate the Lock-and-Key mechanism of the immune system. Inject various pathogen epitopes and observe how massive clonal expansion and antibody production is triggered only when a naive B-Cell matches the exact molecular geometry.

Kidney Nephron Countercurrent Multiplier
Visualize the complex osmotic gradients of the Loop of Henle. Observe how the active transport of NaCl in the ascending limb drives the passive reabsorption of H2O in the descending limb and collecting duct via ADH regulation.
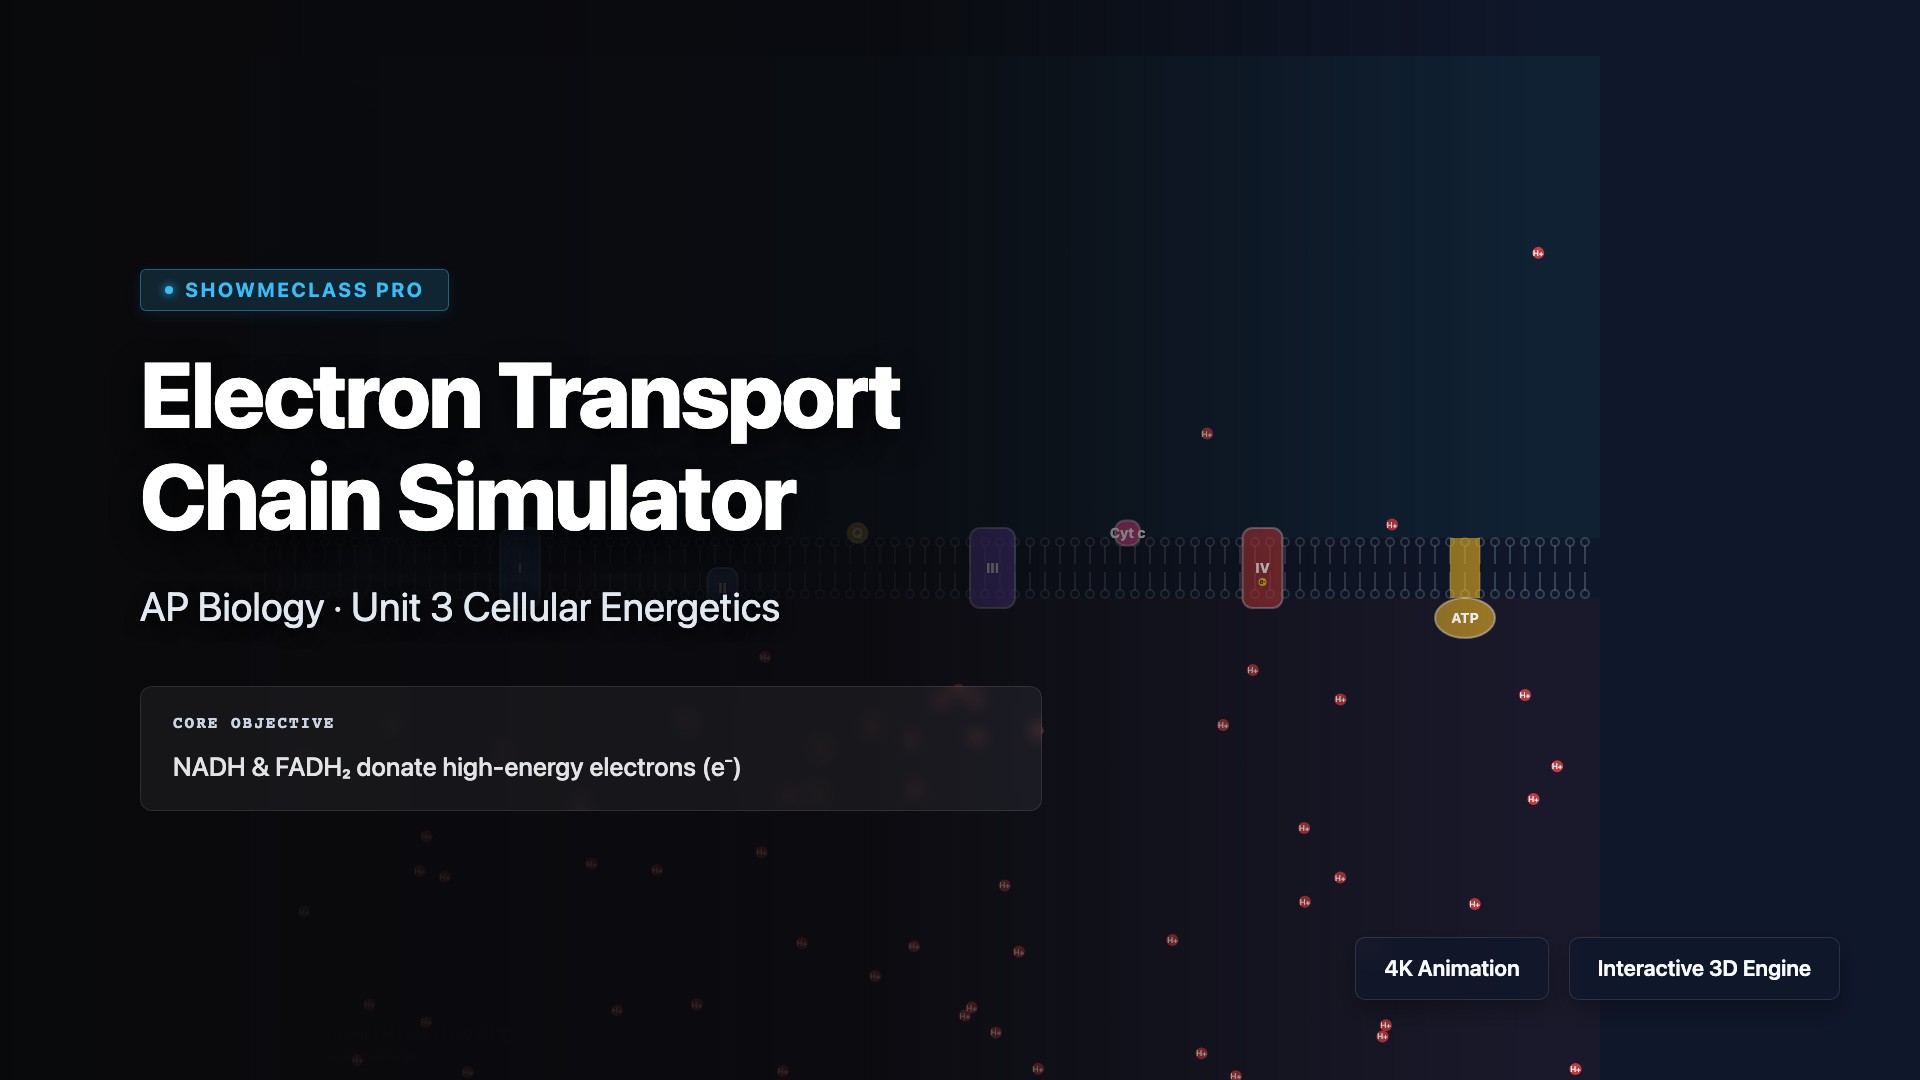
Electron Transport Chain Simulator
Interact with Mitochondrion Complexes I-IV and ATP Synthase. Adjust NADH/O₂ supplies and apply inhibitors (Cyanide, DNP) to observe effects on the proton motive force.
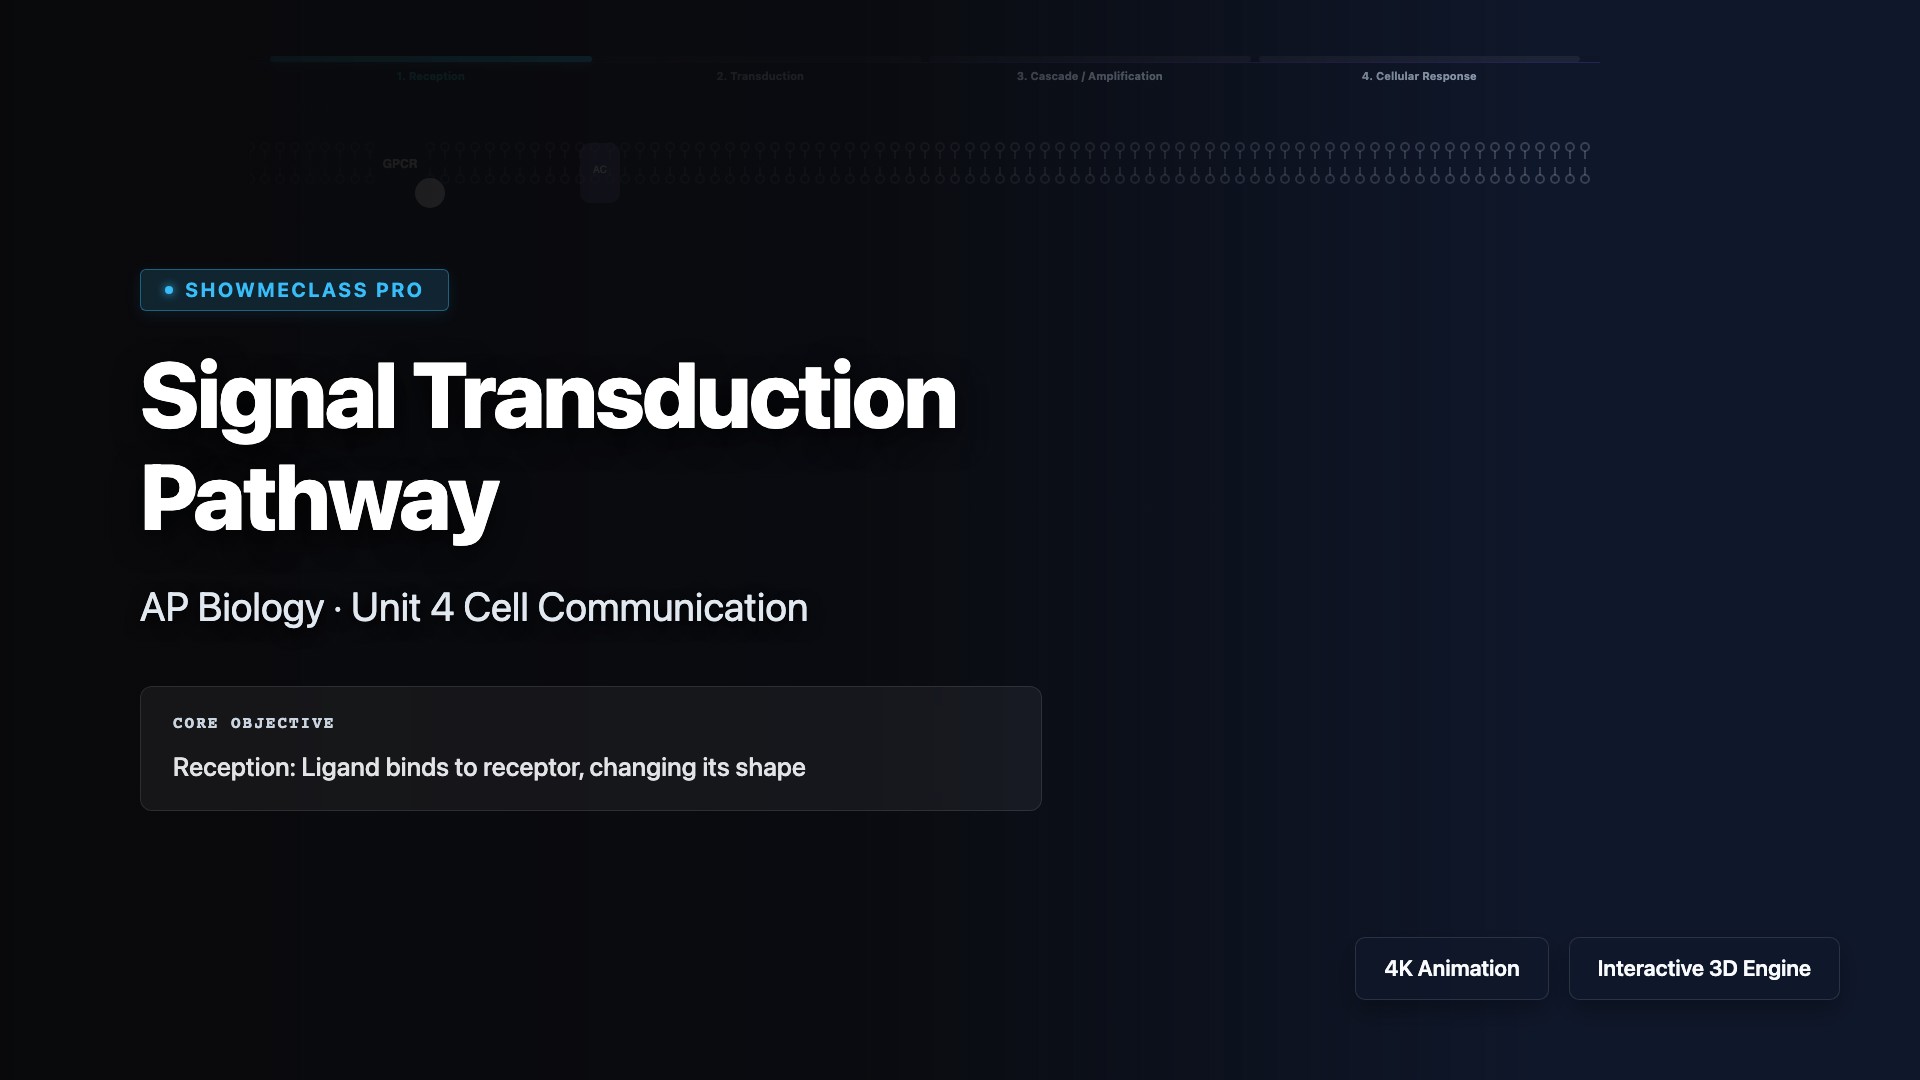
Signal Transduction Pathway
Trigger an epinephrine signaling cascade spanning Reception (GPCR), Transduction (G-protein, Adenylyl Cyclase, cAMP), and Response (PKA kinase amplification).
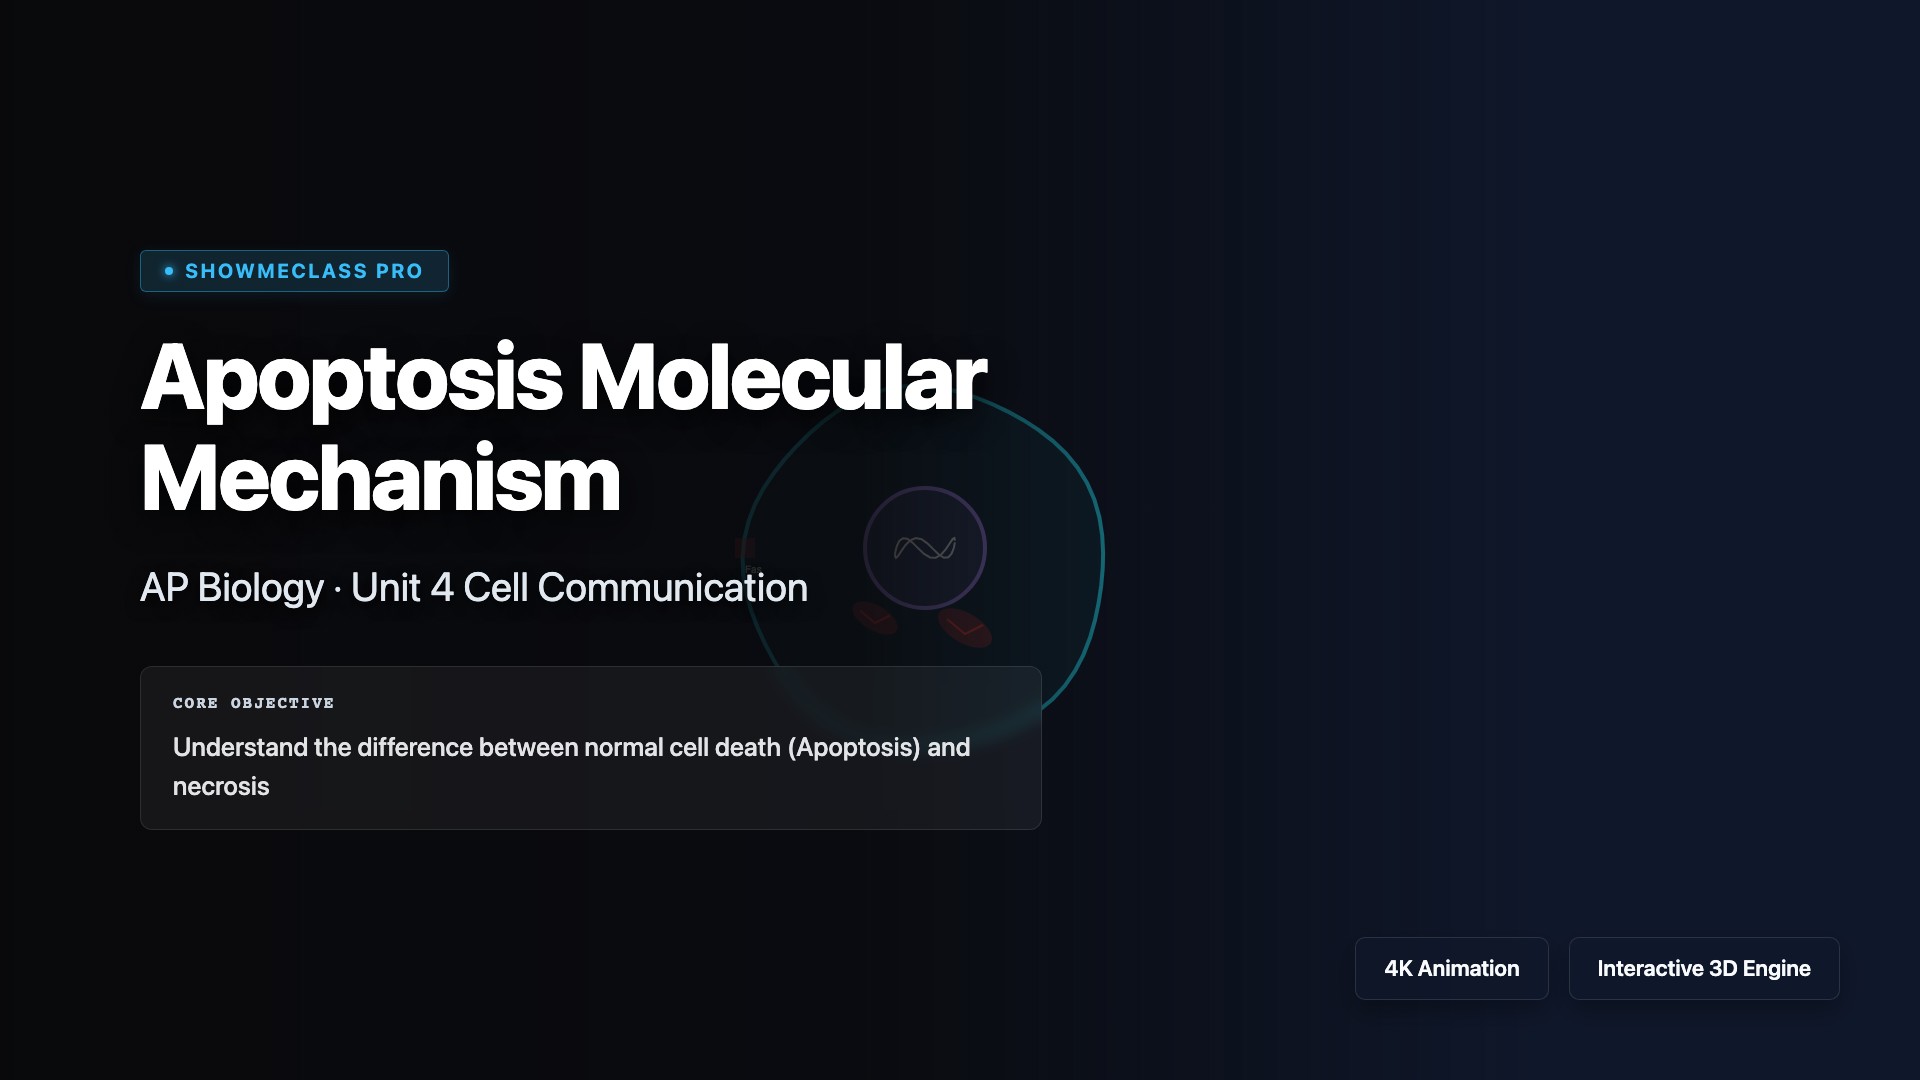
Apoptosis Molecular Mechanism
Trigger the intrinsic (mitochondrial/cytochrome c leakage) or extrinsic pathways of programmed cell death leading to the destructive Caspase cascade and cellular blebbing.
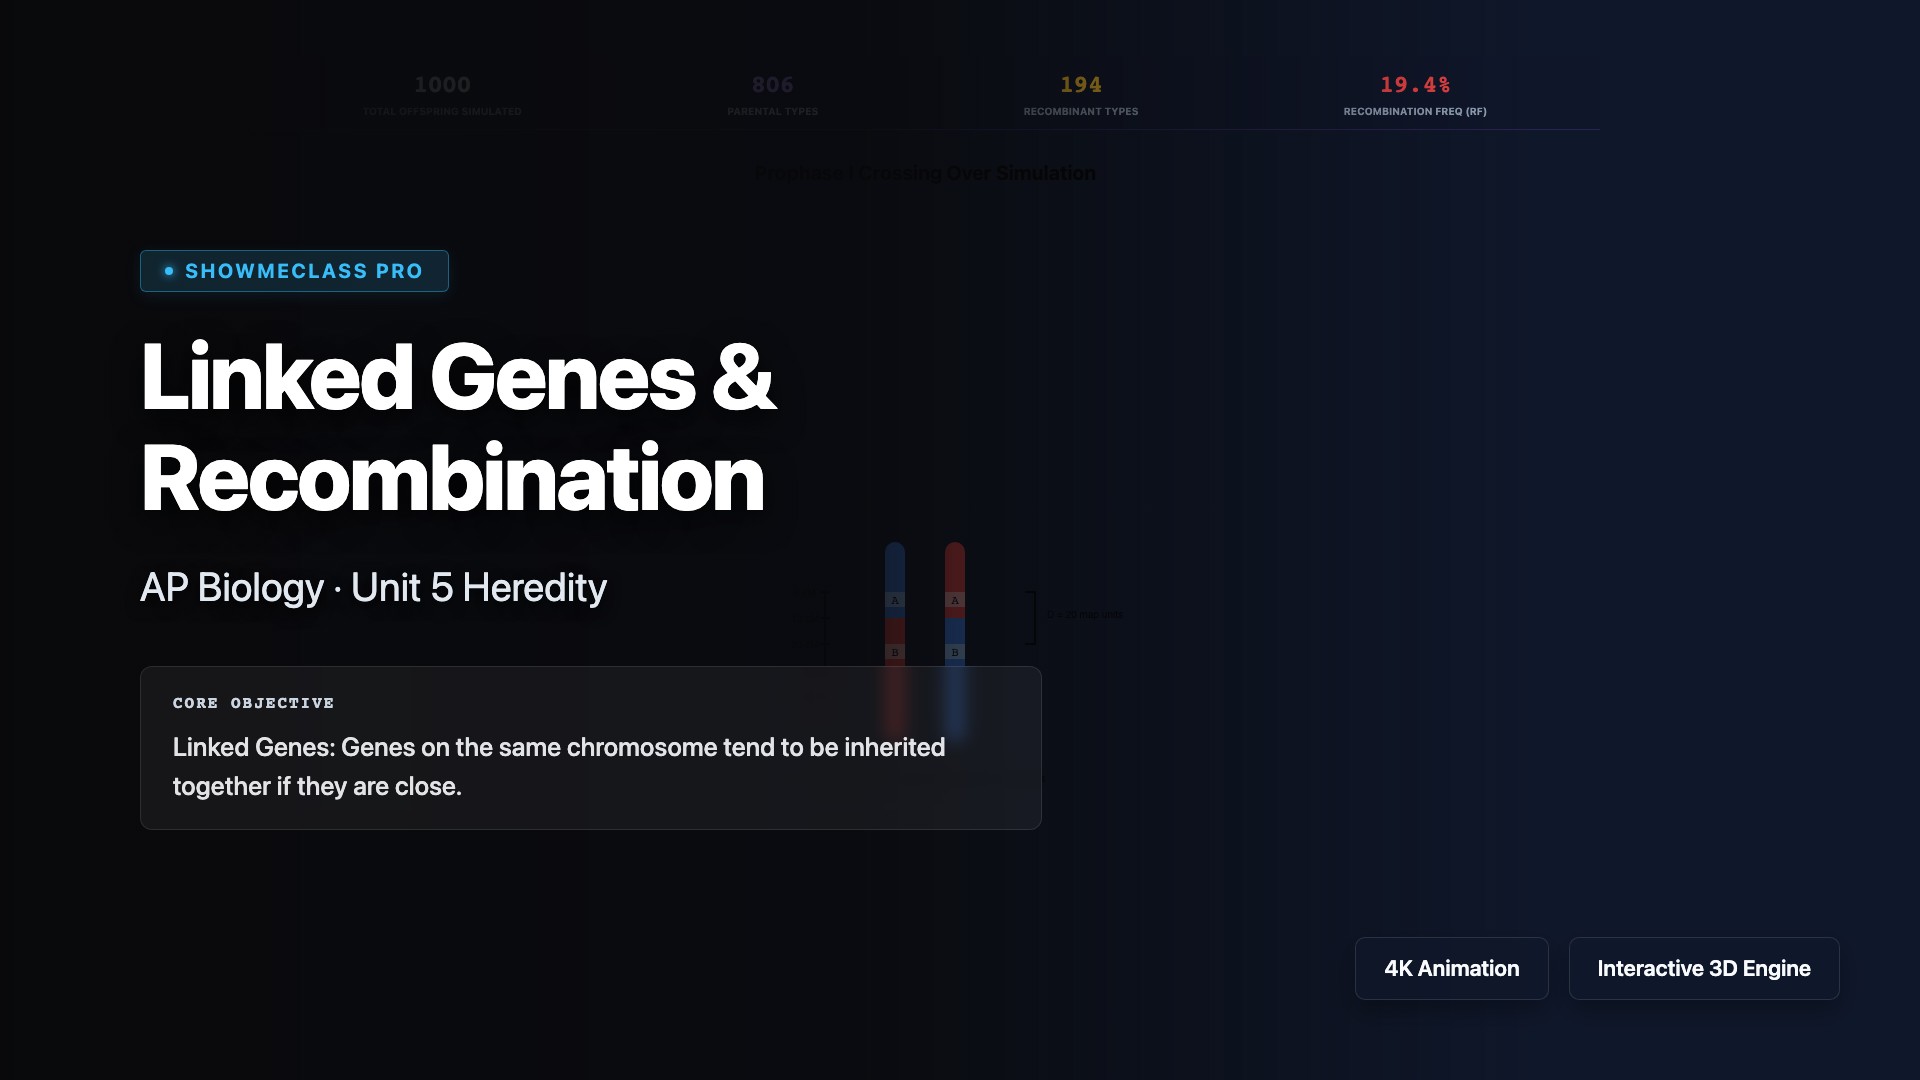
Linked Genes & Recombination
Adjust the physical map units between two genes to observe the dynamic probability of Prophase I crossing over and mathematically predict offspring Recombination Frequency.
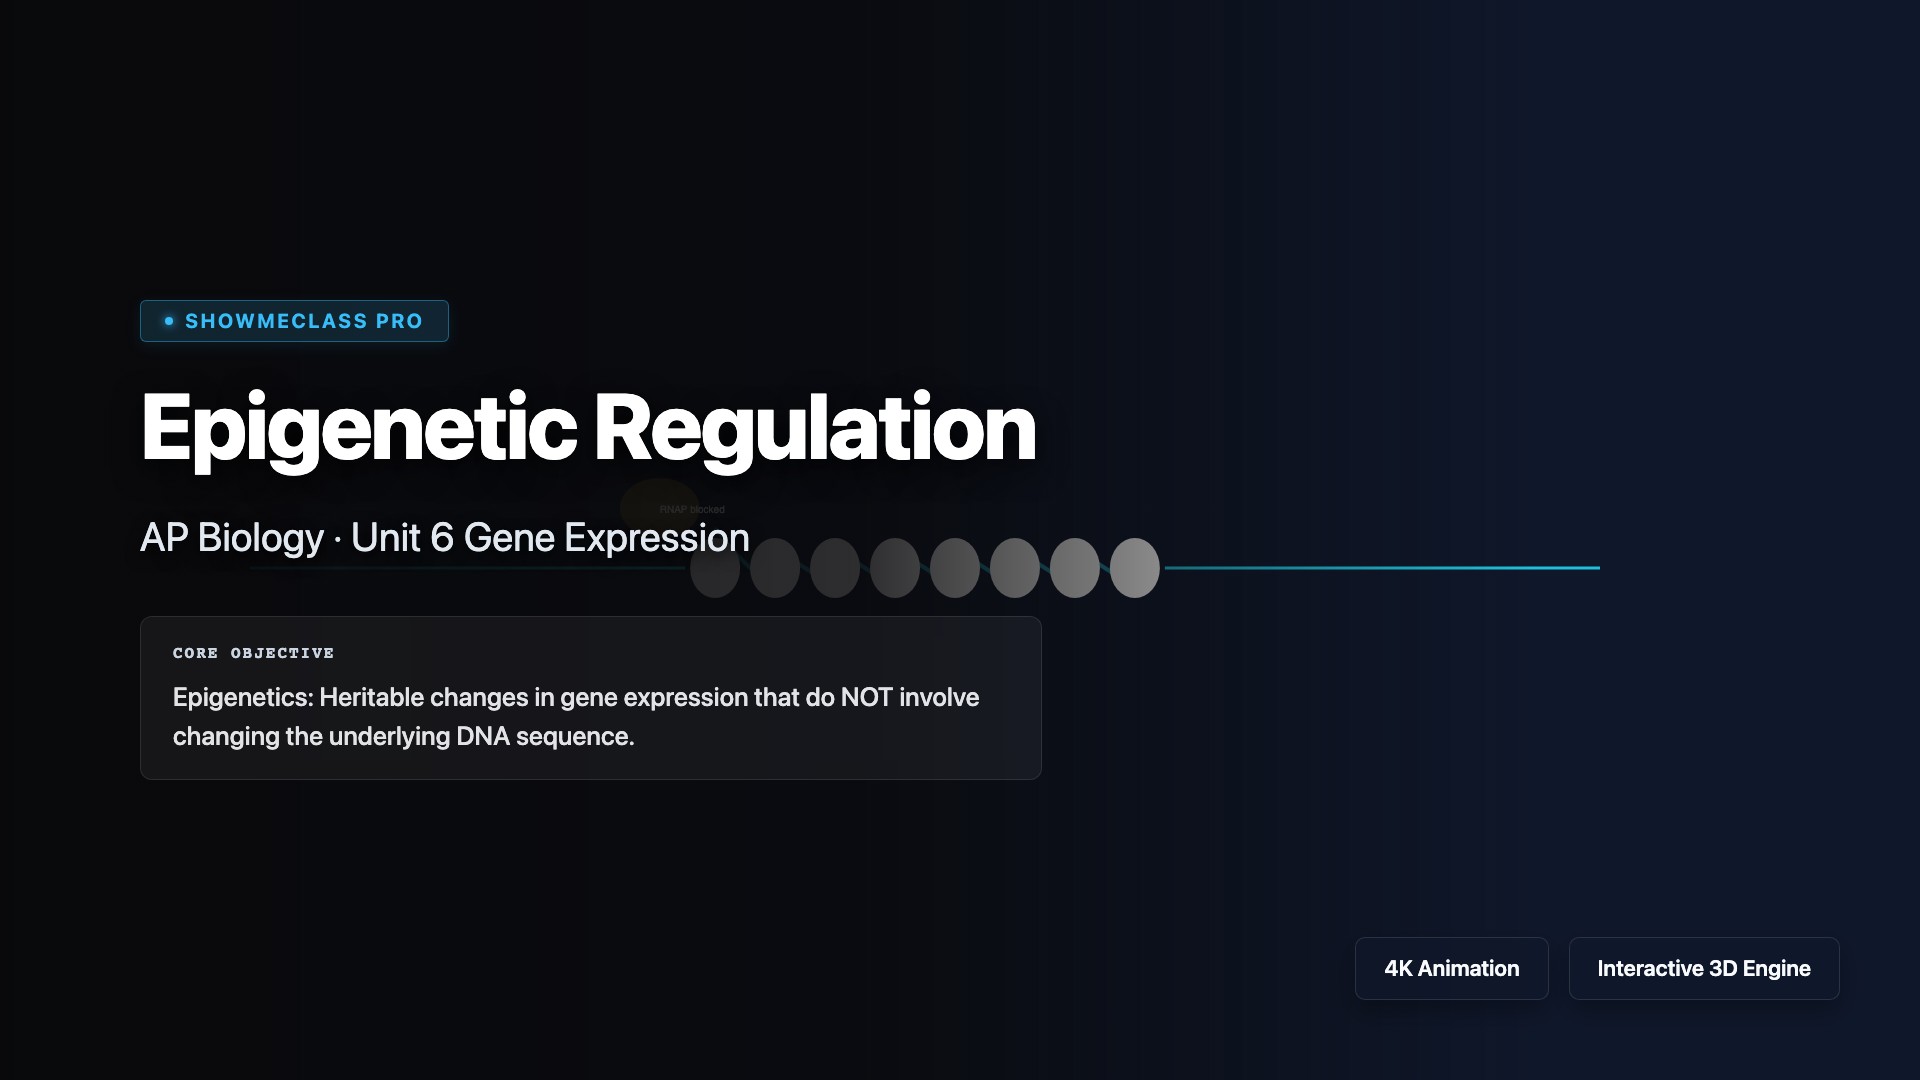
Epigenetic Regulation
Visualize how DNA Methylation tightly coils chromatin (turning genes OFF) and Histone Acetylation loosens chromatin (turning genes ON), bypassing the underlying DNA sequence.
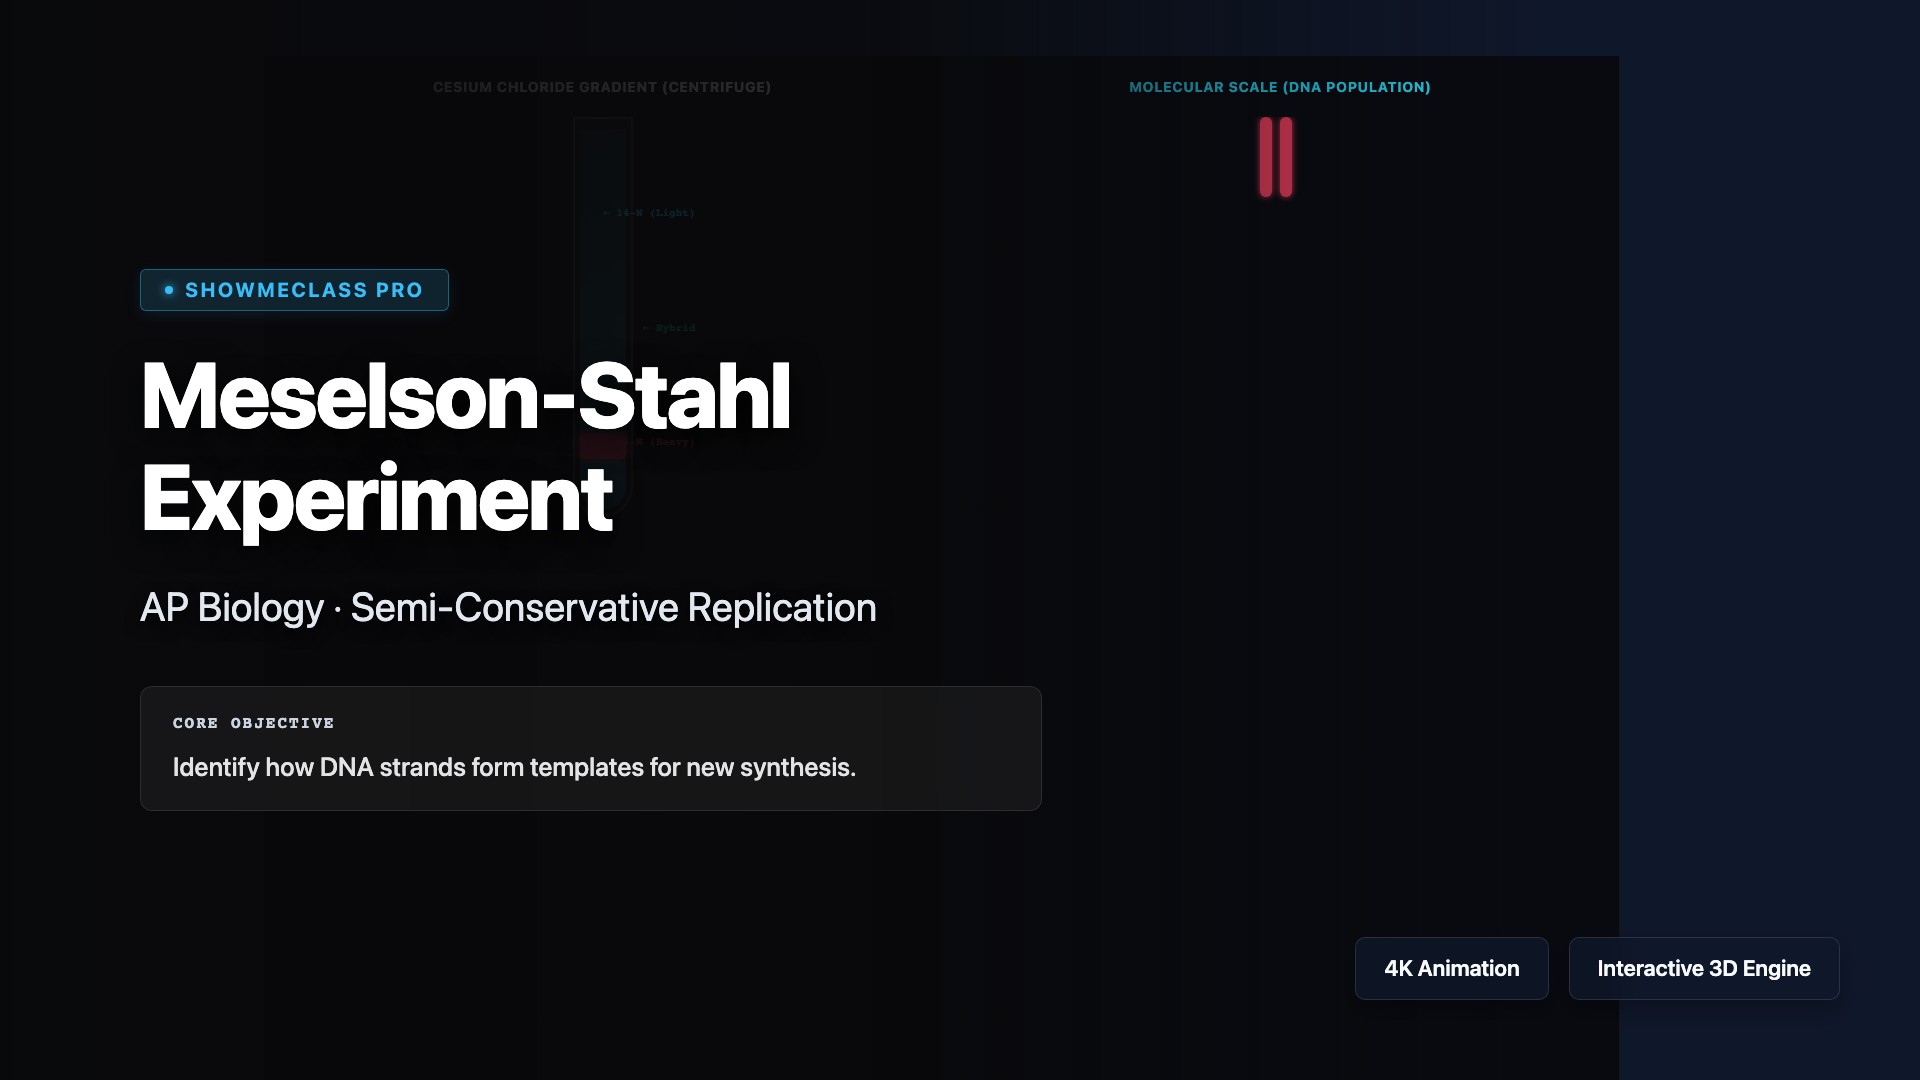
Meselson-Stahl DNA Replication
Replicate the most beautiful experiment in biology. Centrifuge radioactive nitrogen isotopes (15N vs 14N) across bacterial generations to generate heavy, hybrid, and light DNA bands proving semi-conservative replication.

CRISPR-Cas9 Mechanism 3D Visualizer
Visualizes the complete CRISPR-Cas9 genome editing process, tracking PAM recognition, DNA unwinding, gRNA matching, and the double-strand break in 3D.

Lotka-Volterra Predator-Prey Dynamics
Mathematical ecology simulator charting the cyclic phase space between predators and prey. Manipulate birth/death rates to find stable orbits or extinction events.