Showing 10 results
Type I/II Error & Statistical Power
Interactive hypothesis testing visualizer. Adjust Effect Size, Sample Size, and Alpha to instantly see the tradeoff balance between Type I Error, Type II Error, and Statistical Power.
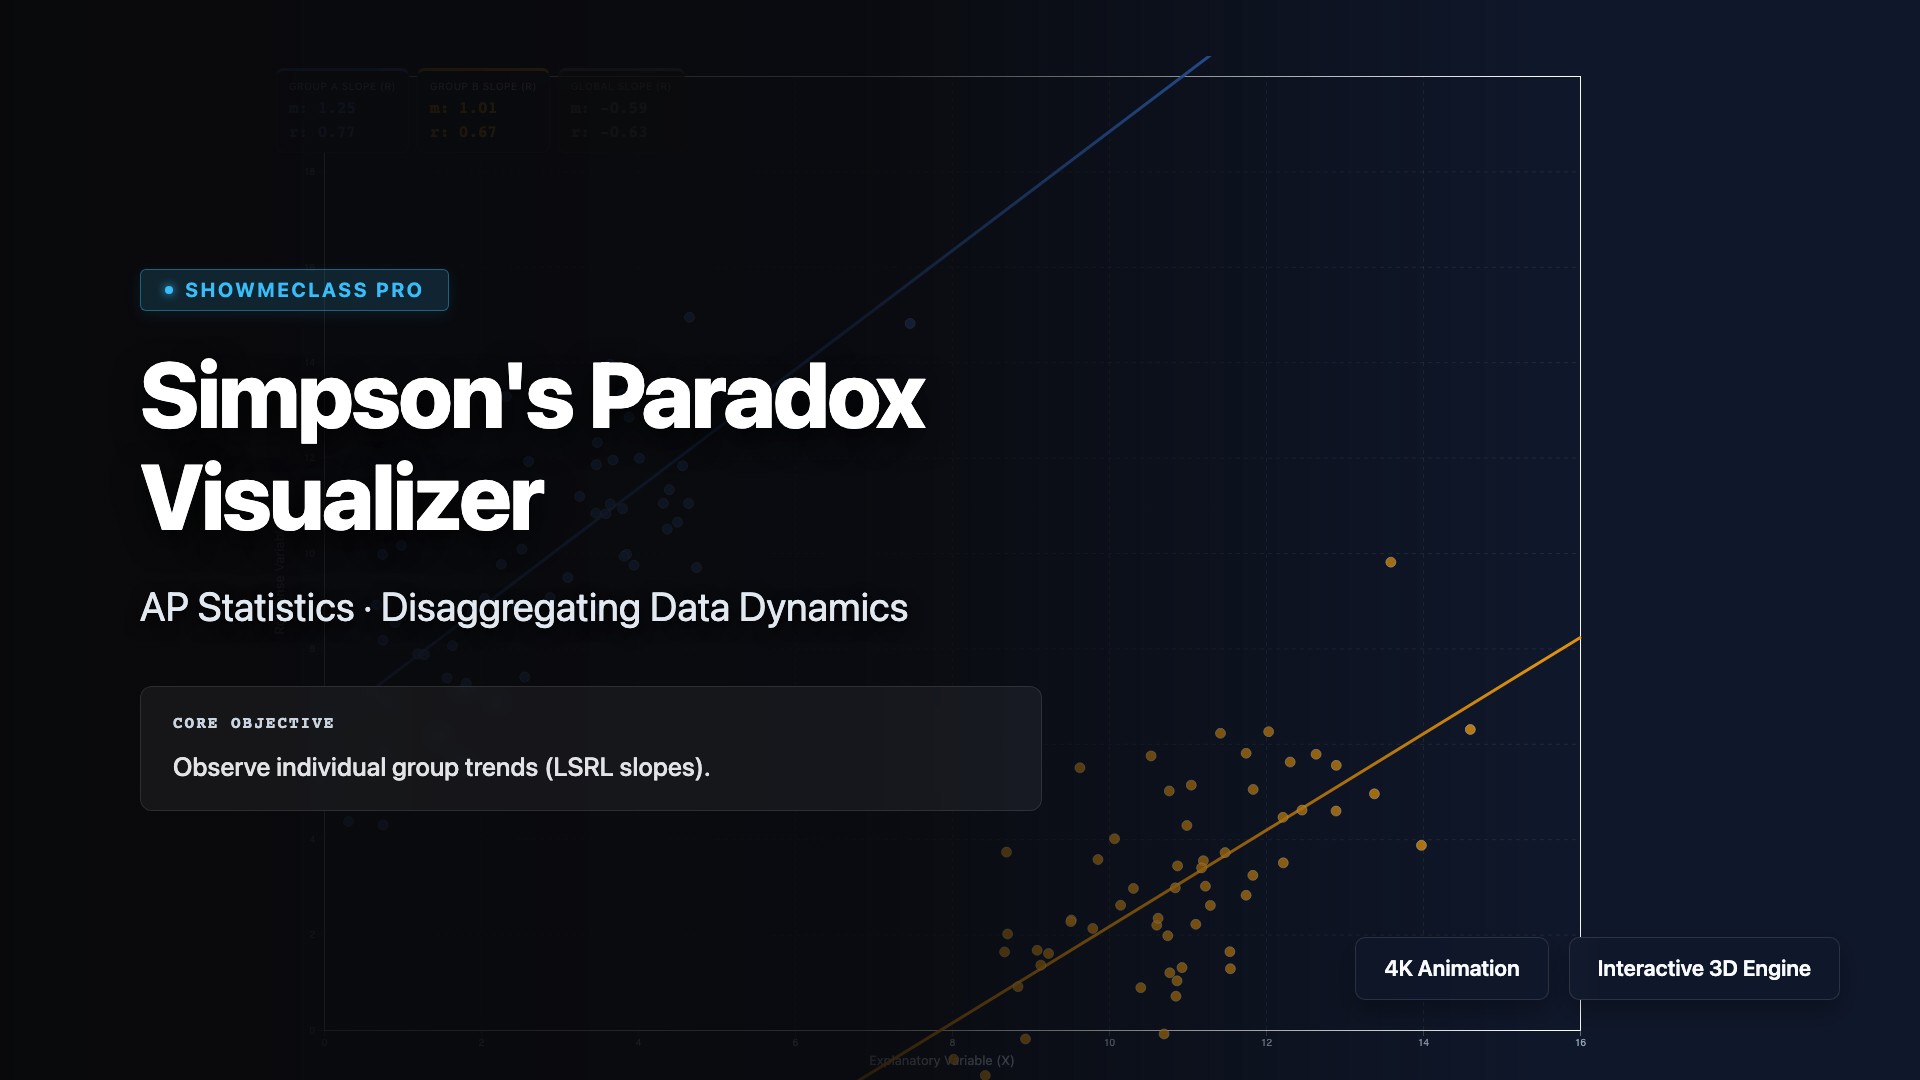
Simpson's Paradox Visualizer
Examine confounding variables dynamically. Toggle between global and clustered regression data to observe mathematical trends magically reverse polarity (Pearson r) when separated.
Simpson's Paradox Visualizer
Unlock one of statistics' most counter-intuitive phenomenons. Observe two completely separate datasets that both exhibit strong POSITIVE correlations. Merge them together and watch the global line of best fit instantly reverse into a NEGATIVE correlation.
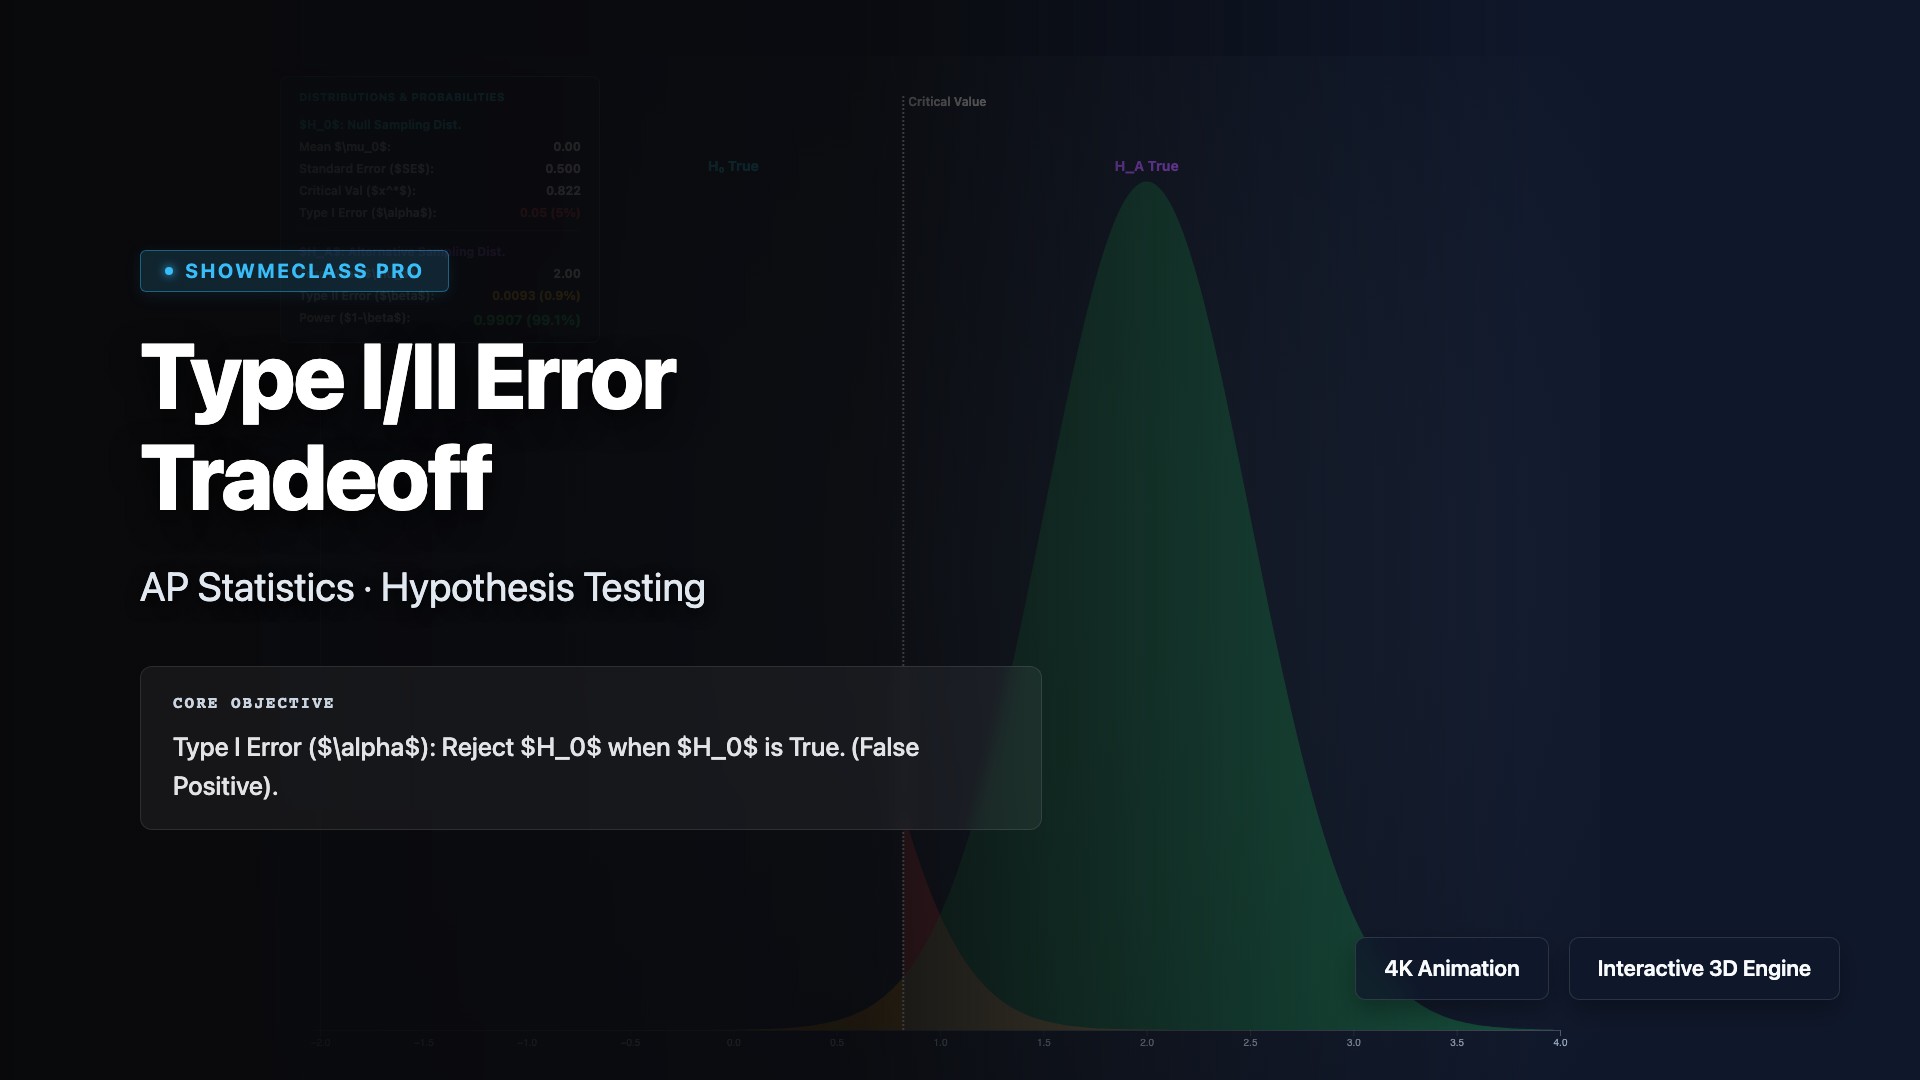
Type I/II Error Tradeoff & Power
Visualize the fundamental tradeoff between alpha, beta, and statistical power in Hypothesis Testing. Interactive normal distribution sampling curves.
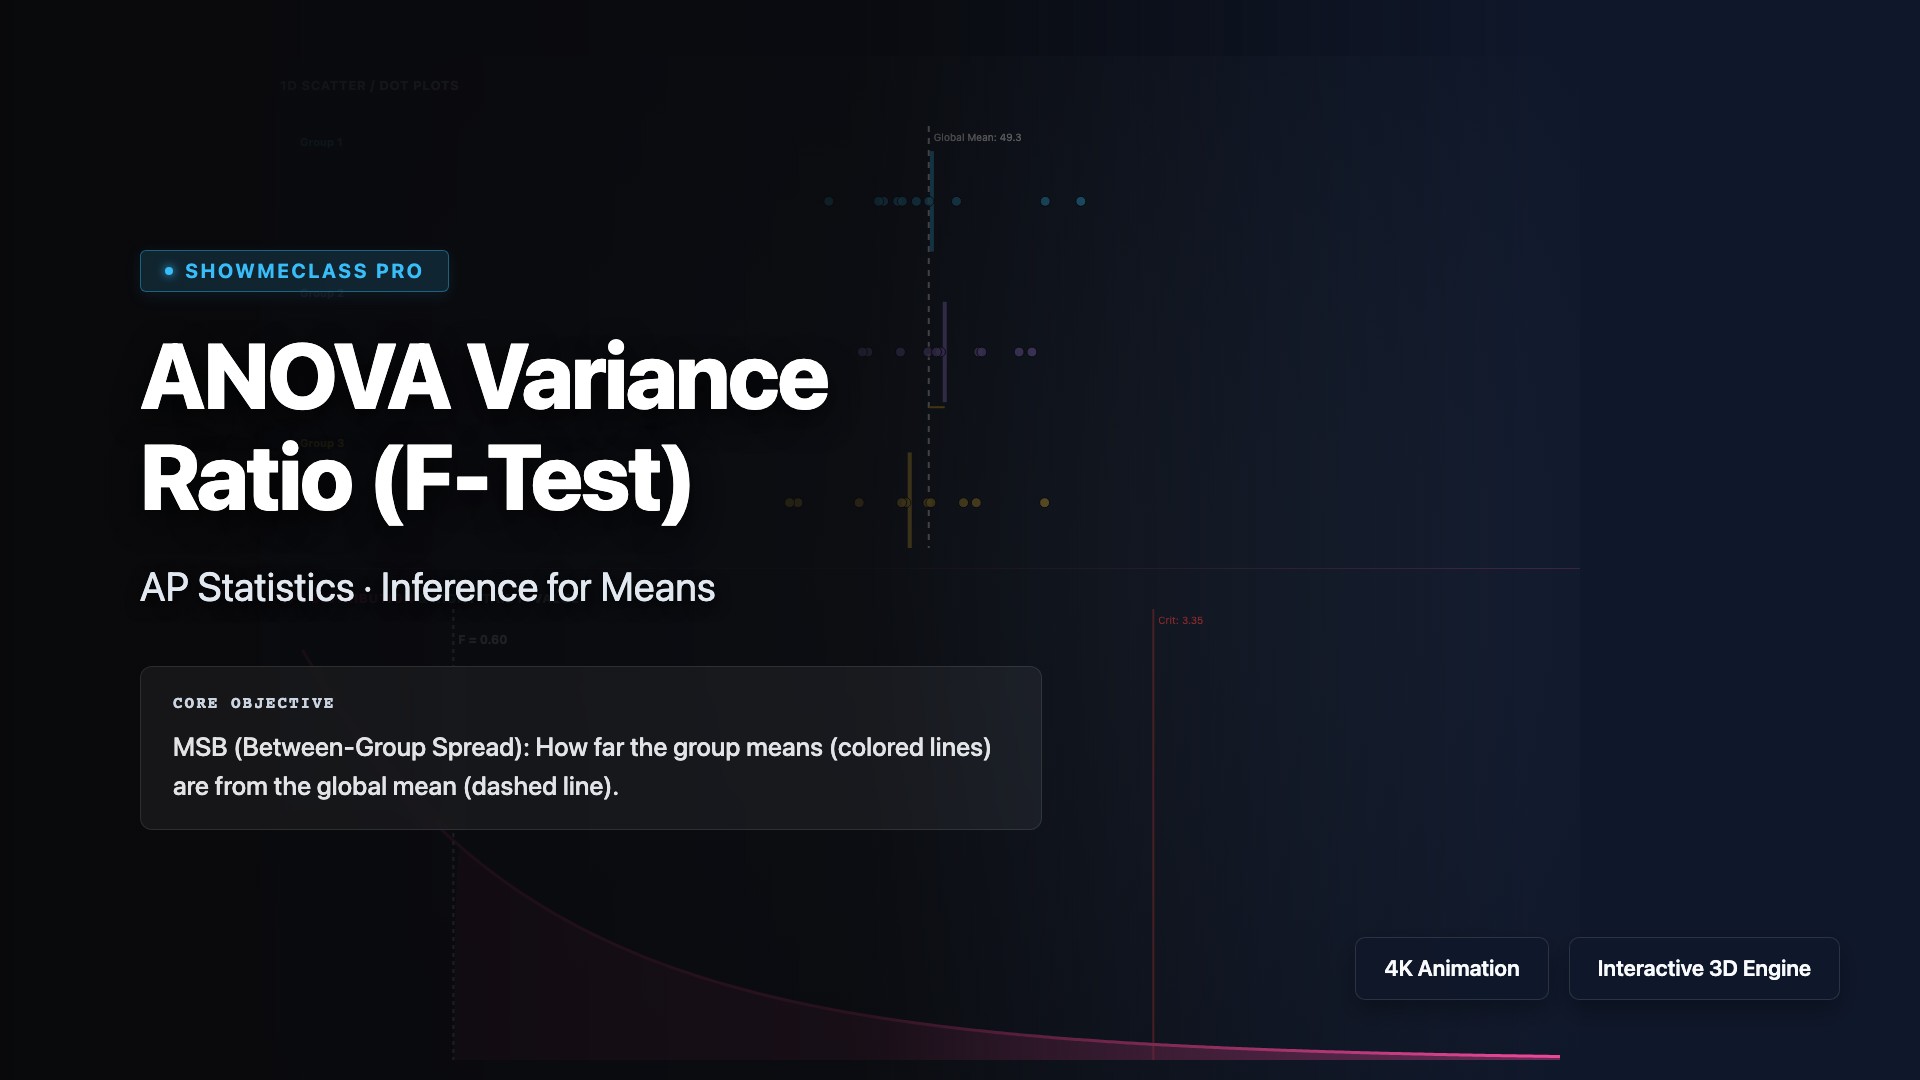
ANOVA Variance Ratio
Deconstruct Analysis of Variance geometrically. Shift group means (MSB) and internal scatter (MSW) to see the massive impact on the F-statistic and P-value.
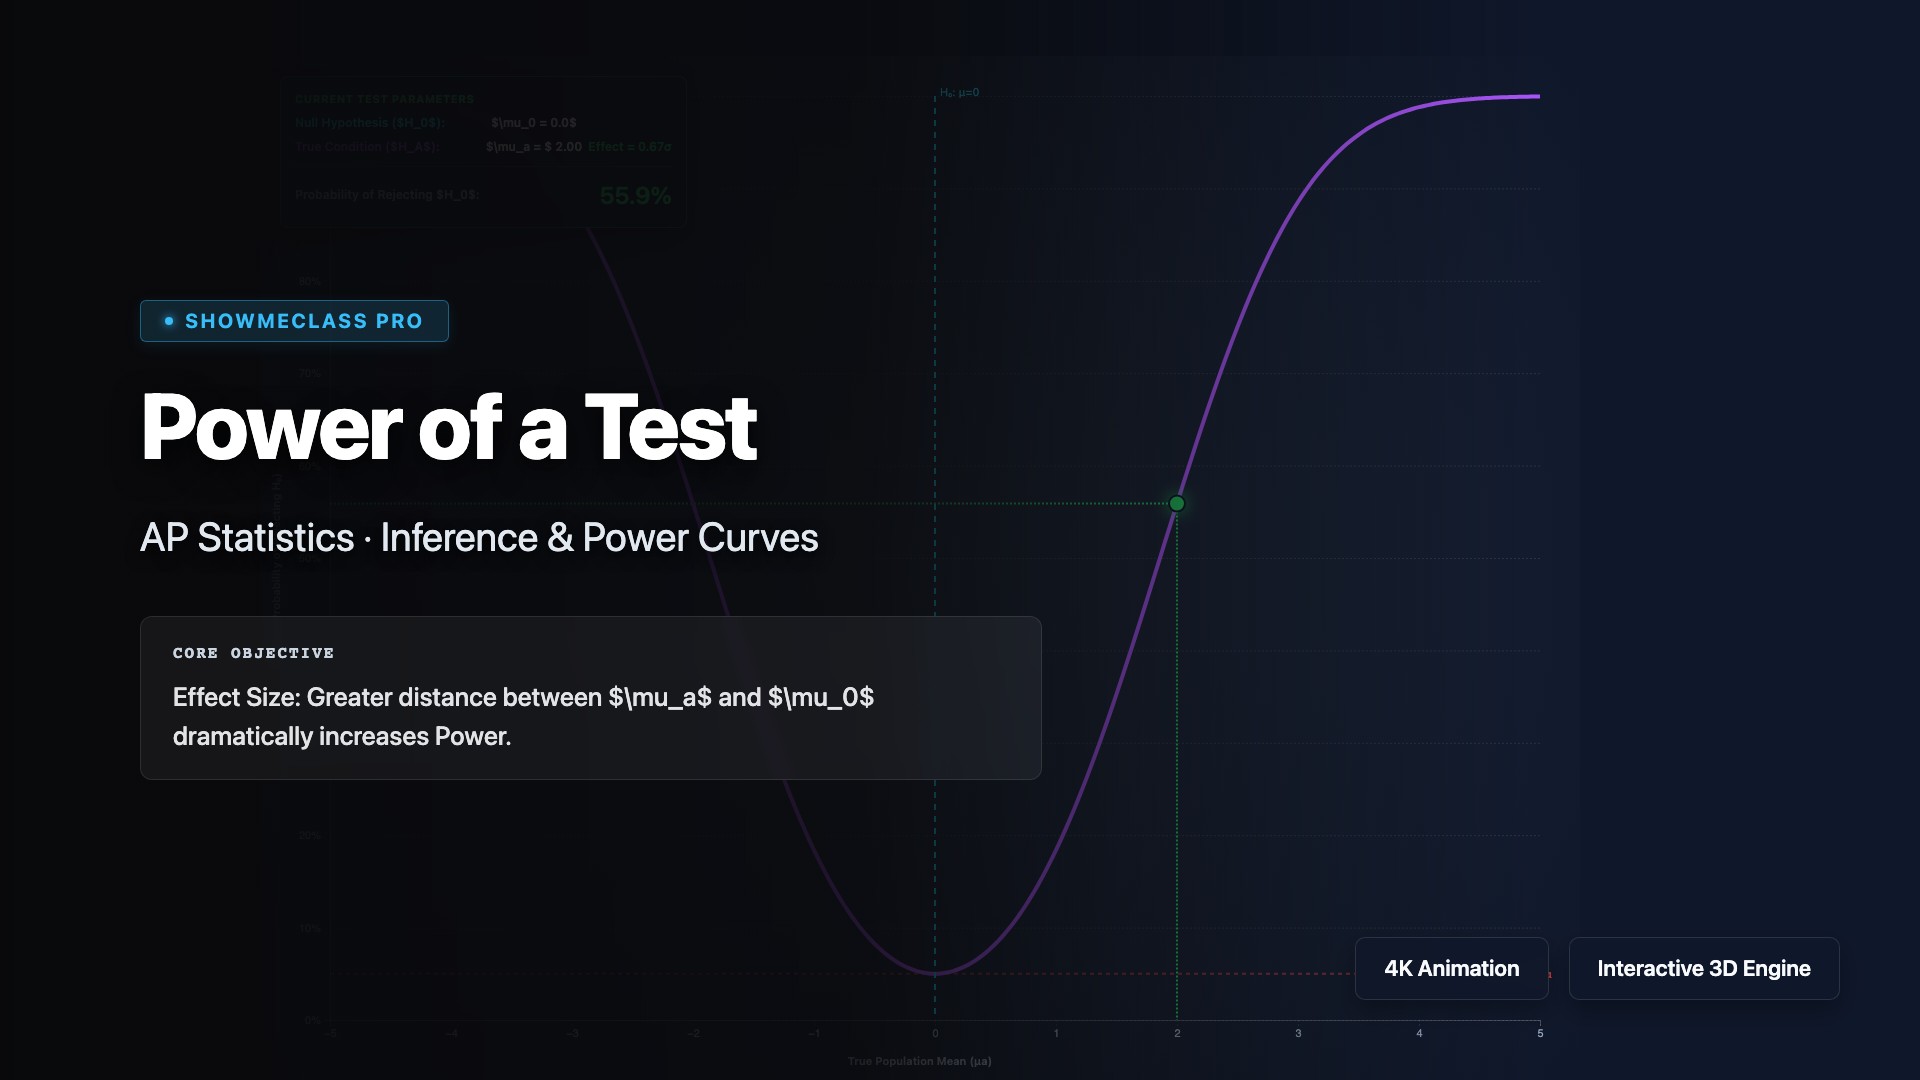
Power of a Test Curve
Visualize how Statistical Power responds dynamically to Effect Size (mu_a), Sample Size, and Alpha. Plot the complete functional power curve.
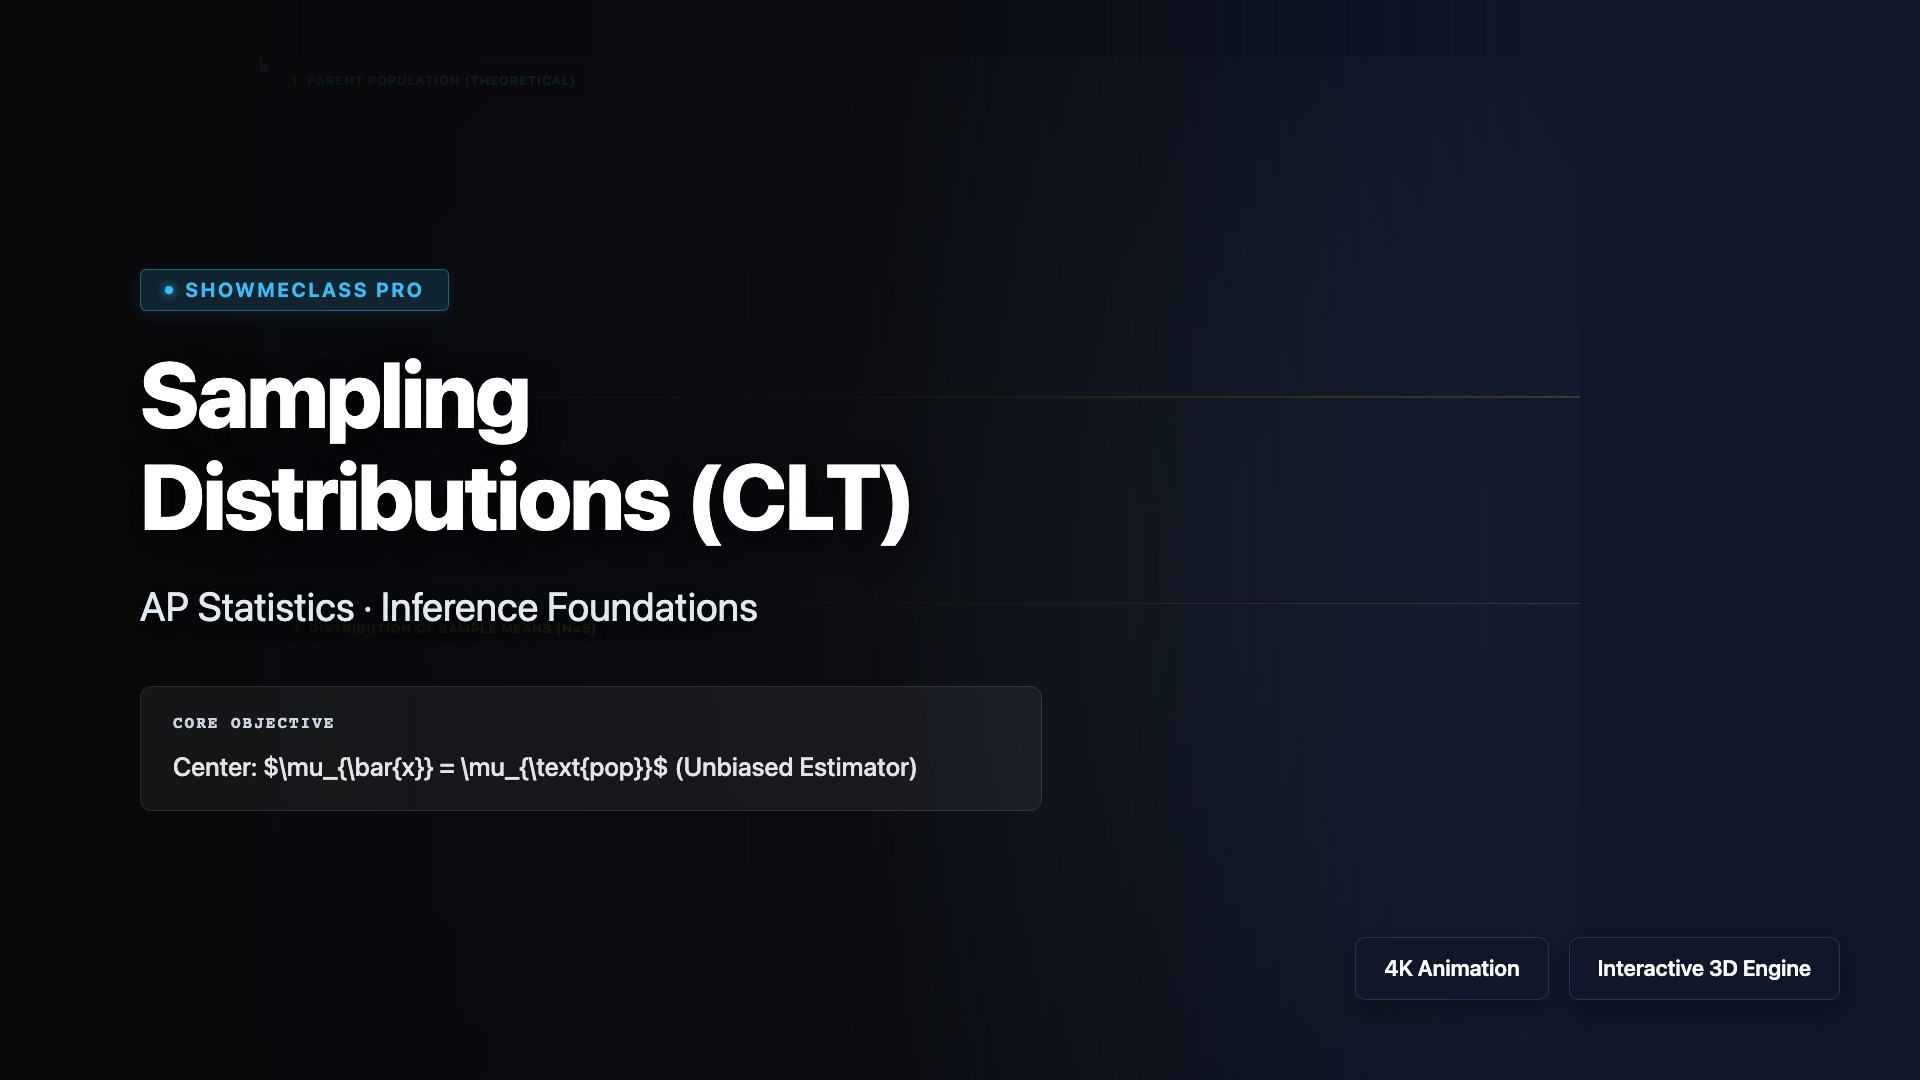
Sampling Distributions (CLT)
Dual-canvas integration rendering Central Limit Theorem convergence. Draws random Monte Carlo datasets mapping sample size variance crushing ($n \geq 30$ rule) converting arbitrary shapes (skewed/bimodal) into stable Gaussian sample-mean distributions.
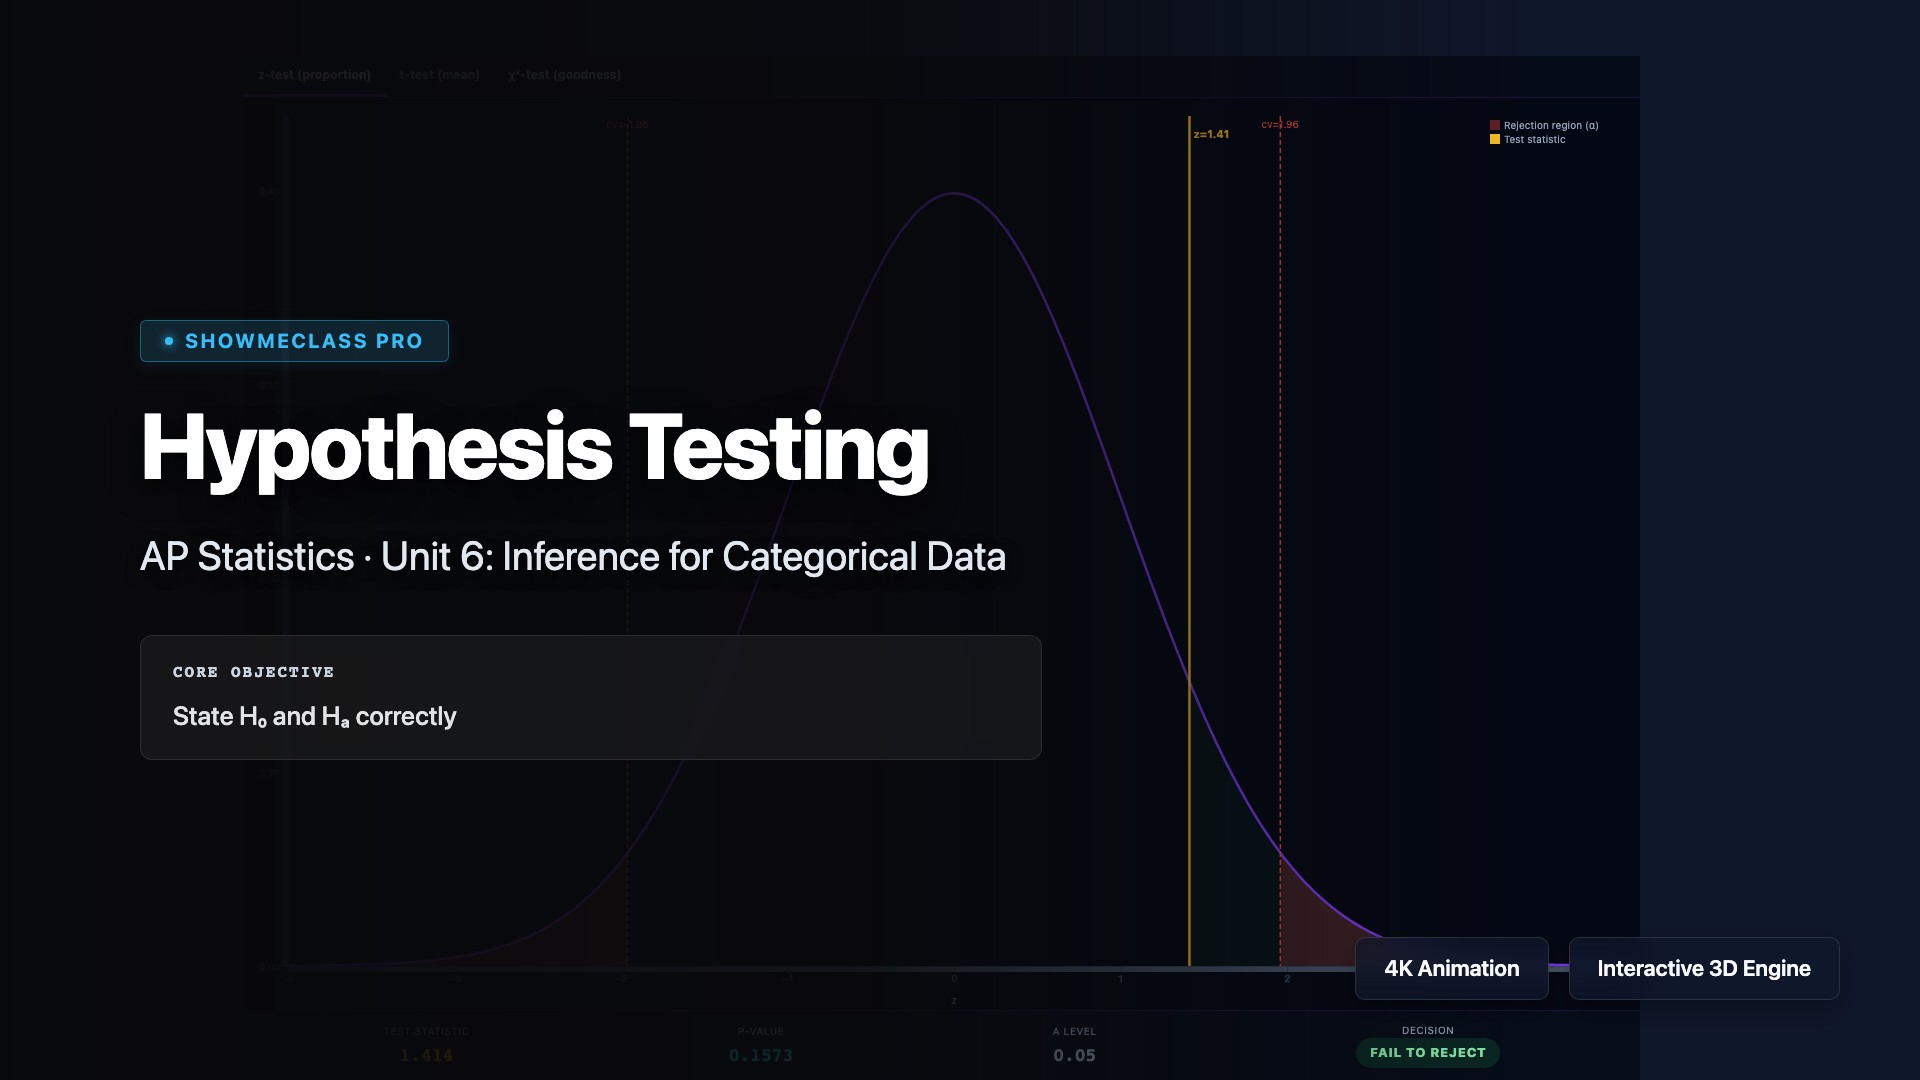
Hypothesis Testing Rules
Inferential hypothesis engine animating null model rejection thresholds vs interactive sample observed P-Value tails. Illuminates the deterministic binary conclusion states driven by fixed Alpha lines mapping Type I geometric error bounds visually.
ANOVA Variance Analysis
Interactive ANOVA interaction plotting $MS_{bet}$ vs $MS_{wit}$ signal-to-noise calculations natively. Combines adjustable uniform variance blocks mathematically linking structural layout changes actively to precise numerical F-Distribution test thresholds.
Type I & II Errors & Power
Interactive structural dual-distribution rendering plotting absolute hypothesis decision bounds. Animates the zero-sum mathematical see-saw between Alpha (Type I) restrictions severely punishing statistical Power translating into elevated Type II failures explicitly under sample size constrictions.