Showing 12 results
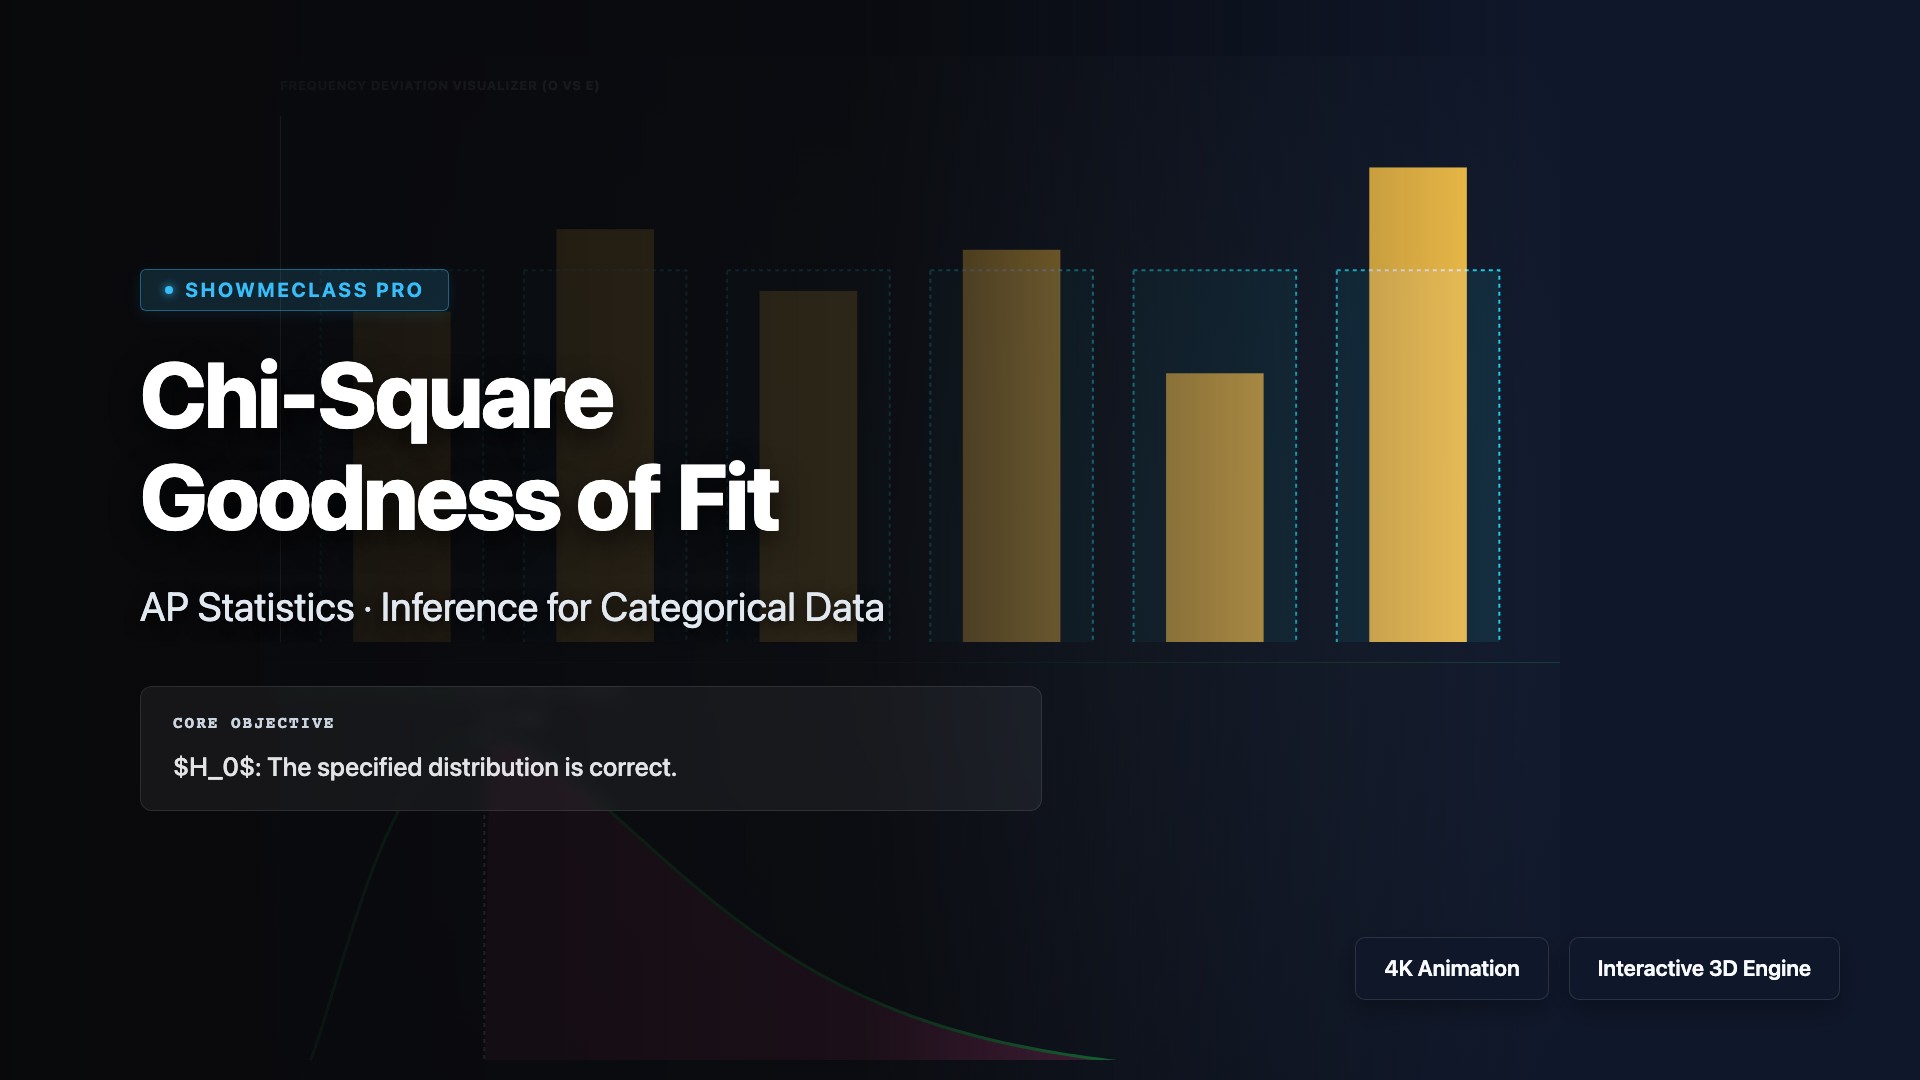
Chi-Square Goodness of Fit
Calculate and visualize the Chi-Square test statistic. Compare expected vs observed dice rolls across categories and plot how deviations force the P-value into the rejection region.
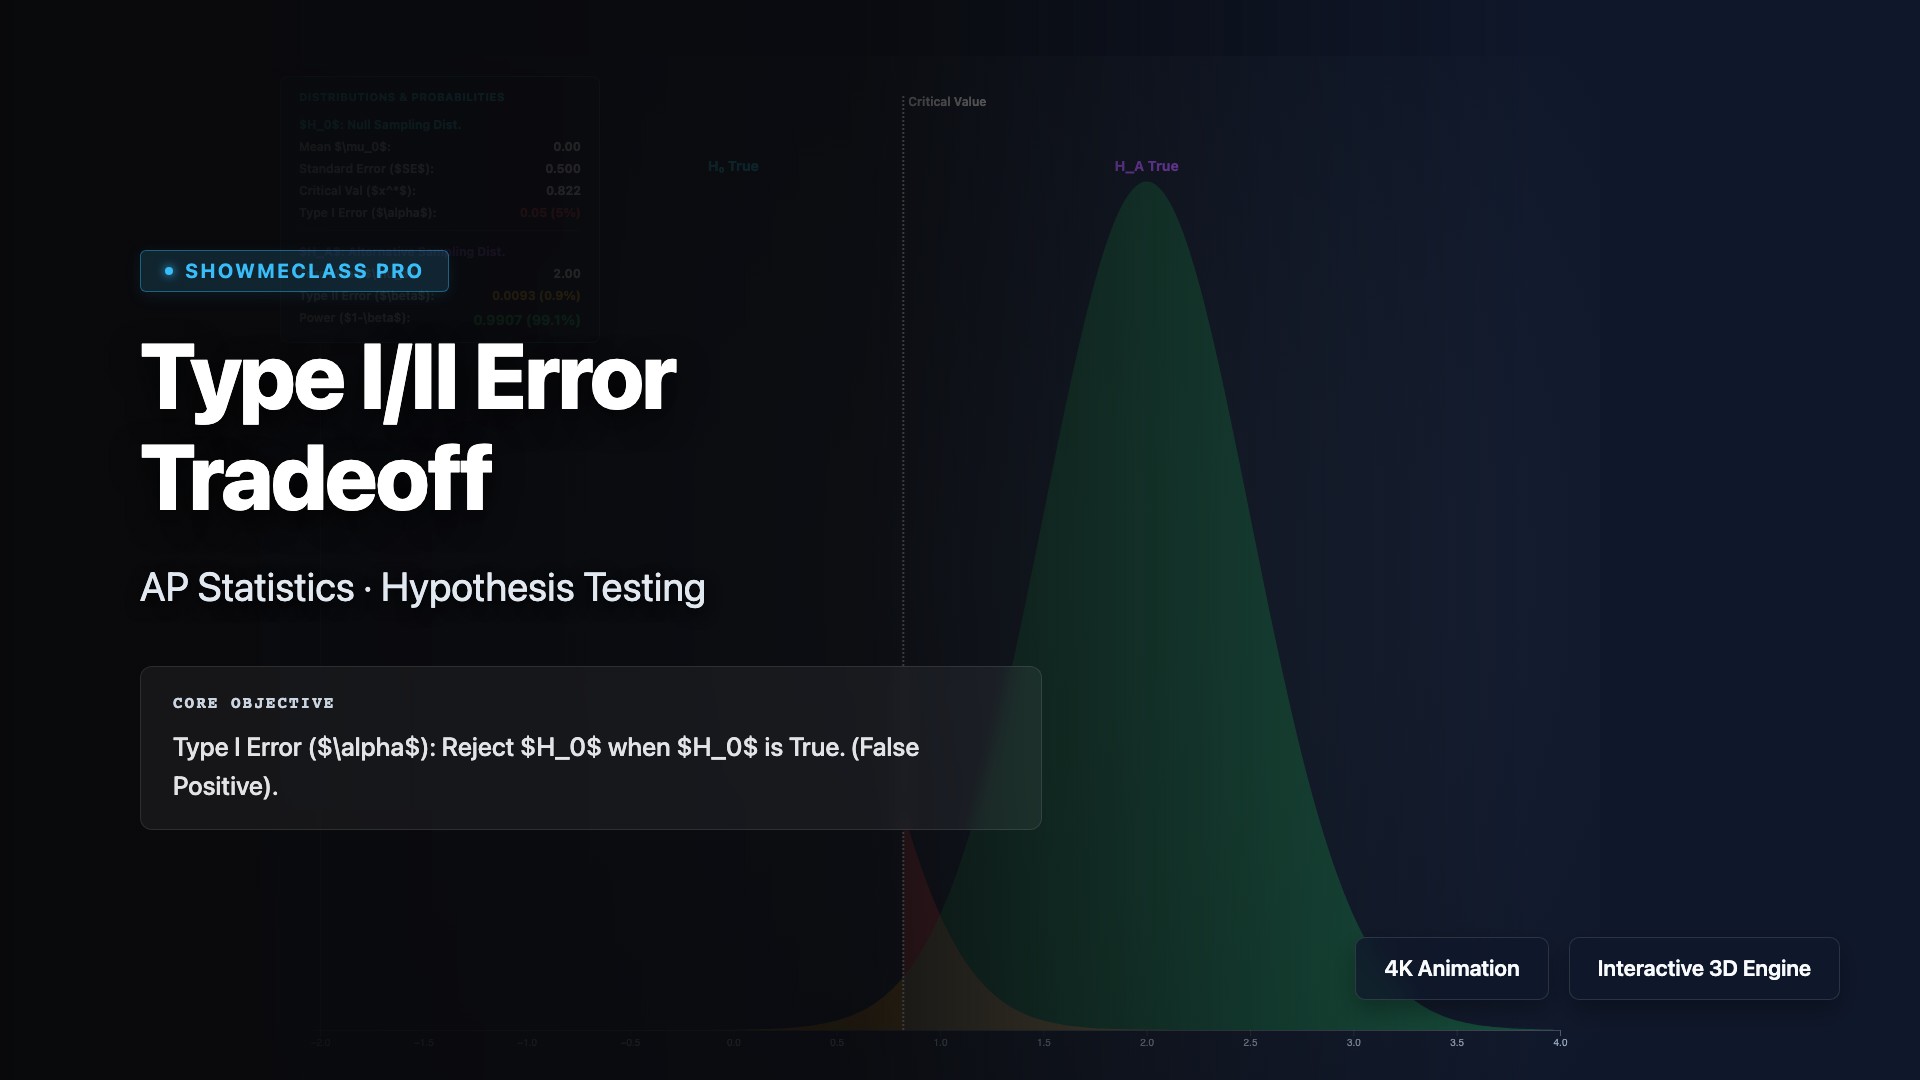
Type I/II Error & Statistical Power
Interactive hypothesis testing visualizer. Adjust Effect Size, Sample Size, and Alpha to instantly see the tradeoff balance between Type I Error, Type II Error, and Statistical Power.

Central Limit Theorem (Galton)
Drop dynamic particles through a physics-enabled Galton Board. Watch the Binomial Distribution organically construct and flawlessly approximate a continuous Normal Curve.
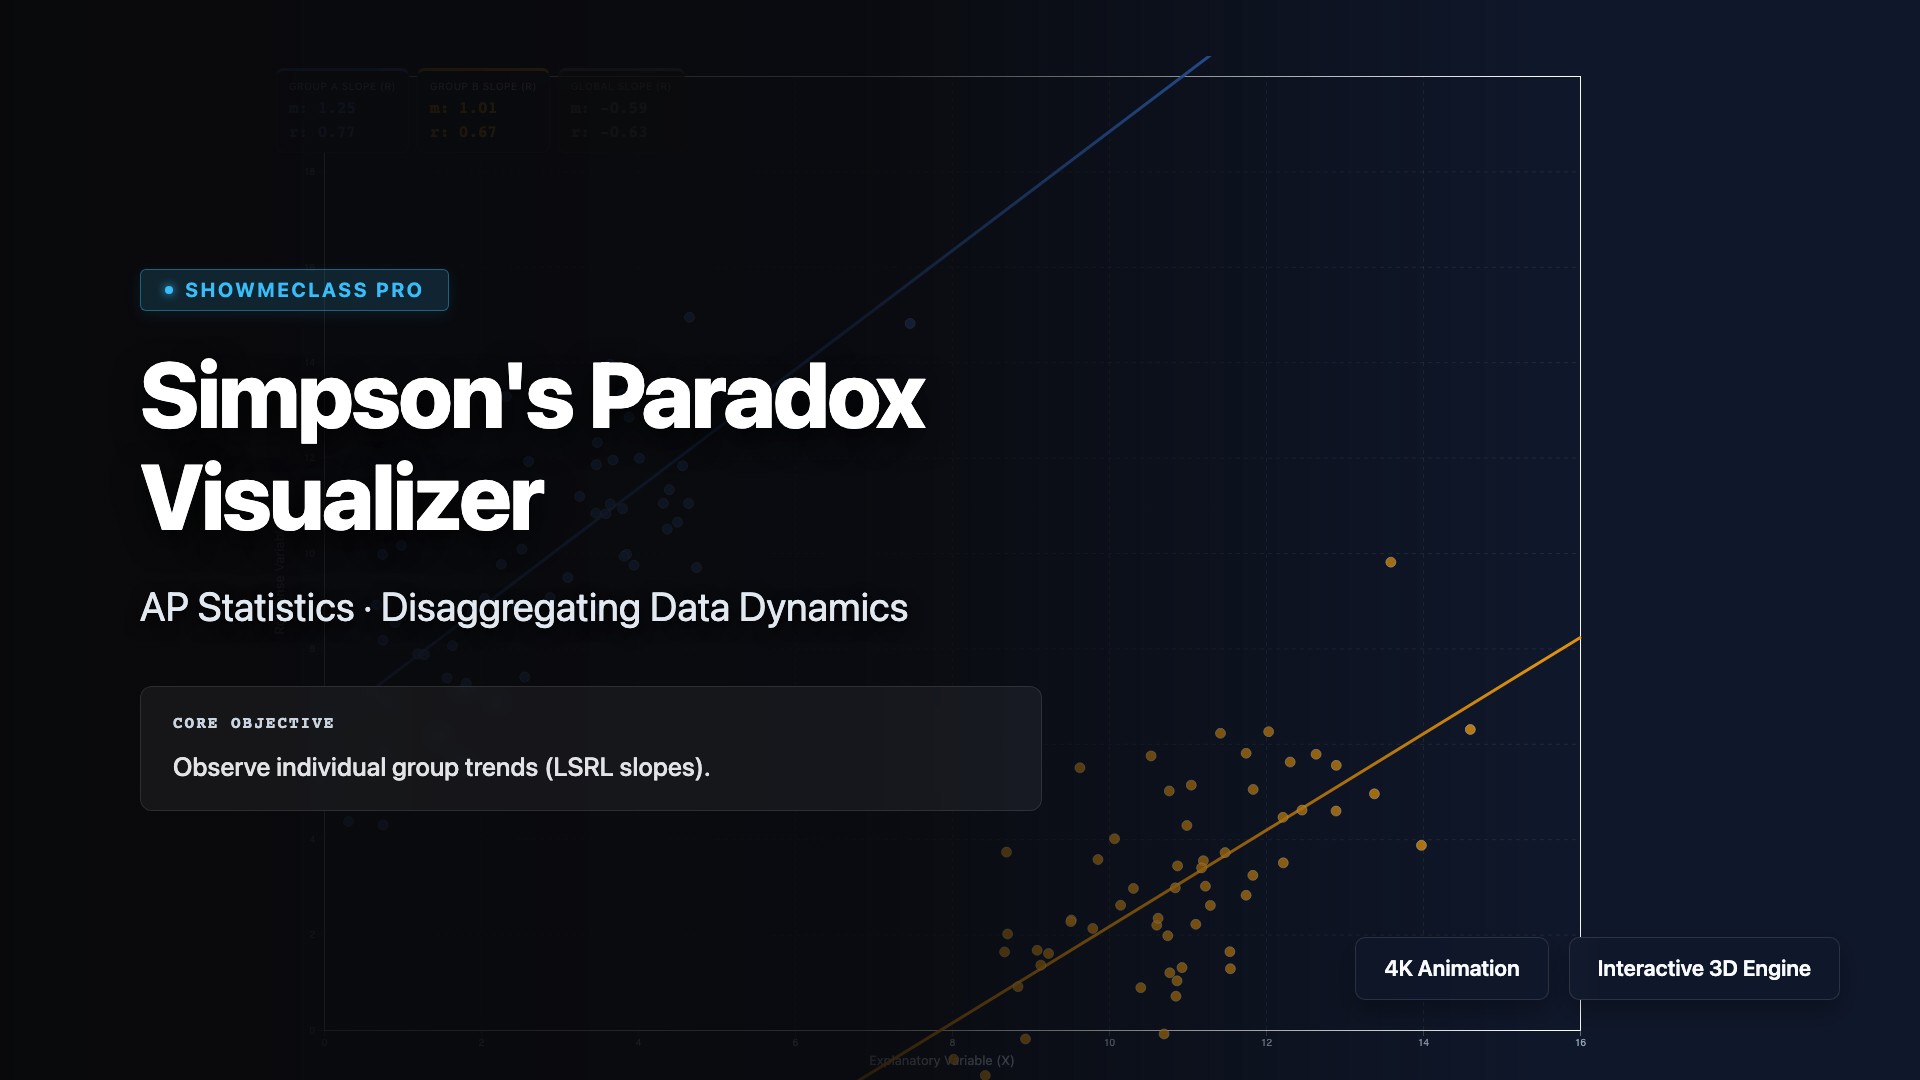
Simpson's Paradox Visualizer
Examine confounding variables dynamically. Toggle between global and clustered regression data to observe mathematical trends magically reverse polarity (Pearson r) when separated.
Simpson's Paradox Visualizer
Unlock one of statistics' most counter-intuitive phenomenons. Observe two completely separate datasets that both exhibit strong POSITIVE correlations. Merge them together and watch the global line of best fit instantly reverse into a NEGATIVE correlation.
Central Limit Theorem (Galton Board)
A dynamic 2D physics simulation of a Galton Board (Plinko). Drop hundreds of balls that make 50/50 left-right decisions, compounding entirely random events into a mathematically perfect Normal Distribution bell curve.
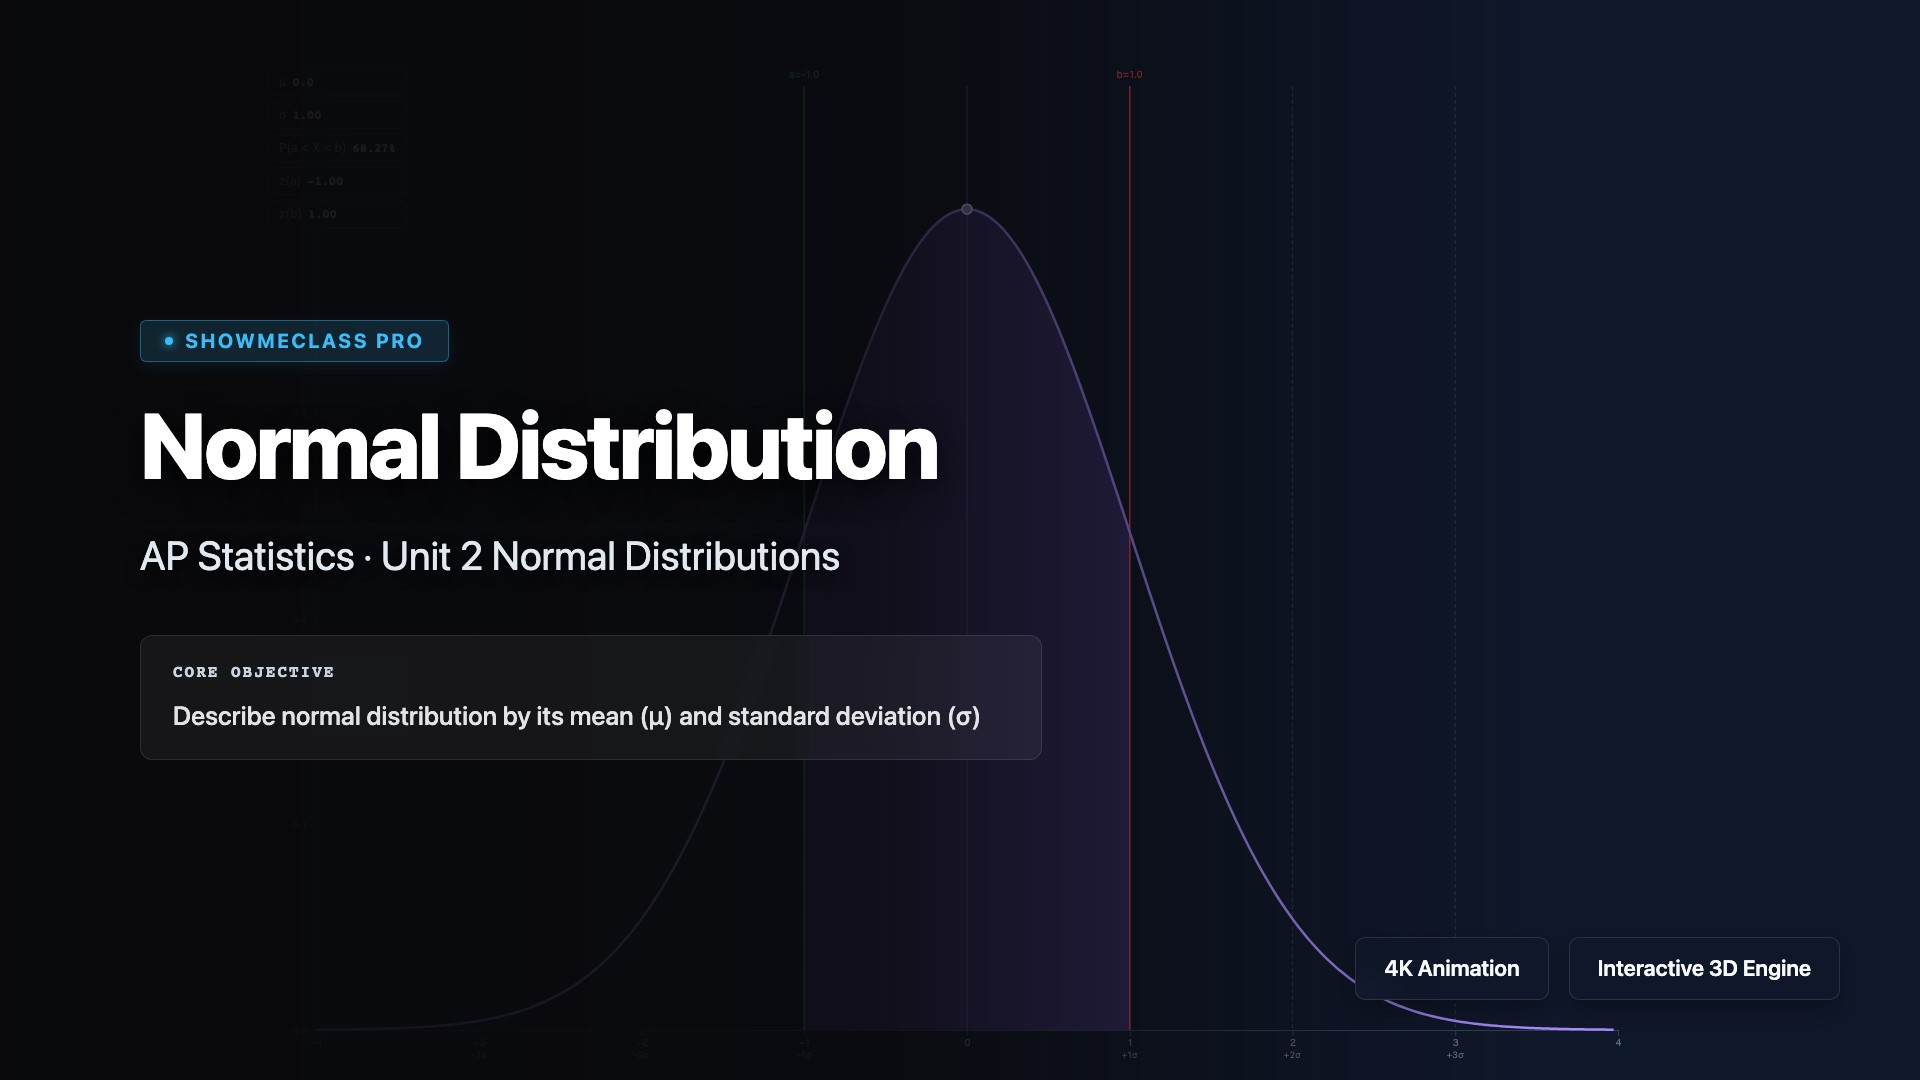
Normal Distribution Explorer
Adjust mean and standard deviation to see how the normal distribution bell curve shifts and stretches. Shade probability regions to compute areas under the curve and connect z-scores to percentiles.
Type I/II Error Tradeoff & Power
Visualize the fundamental tradeoff between alpha, beta, and statistical power in Hypothesis Testing. Interactive normal distribution sampling curves.
Chi-Square Goodness of Fit
Calculate and visualize deviations from expected categorical frequencies. Generates the exact right-skewed Chi-Square distribution and P-Value tail.
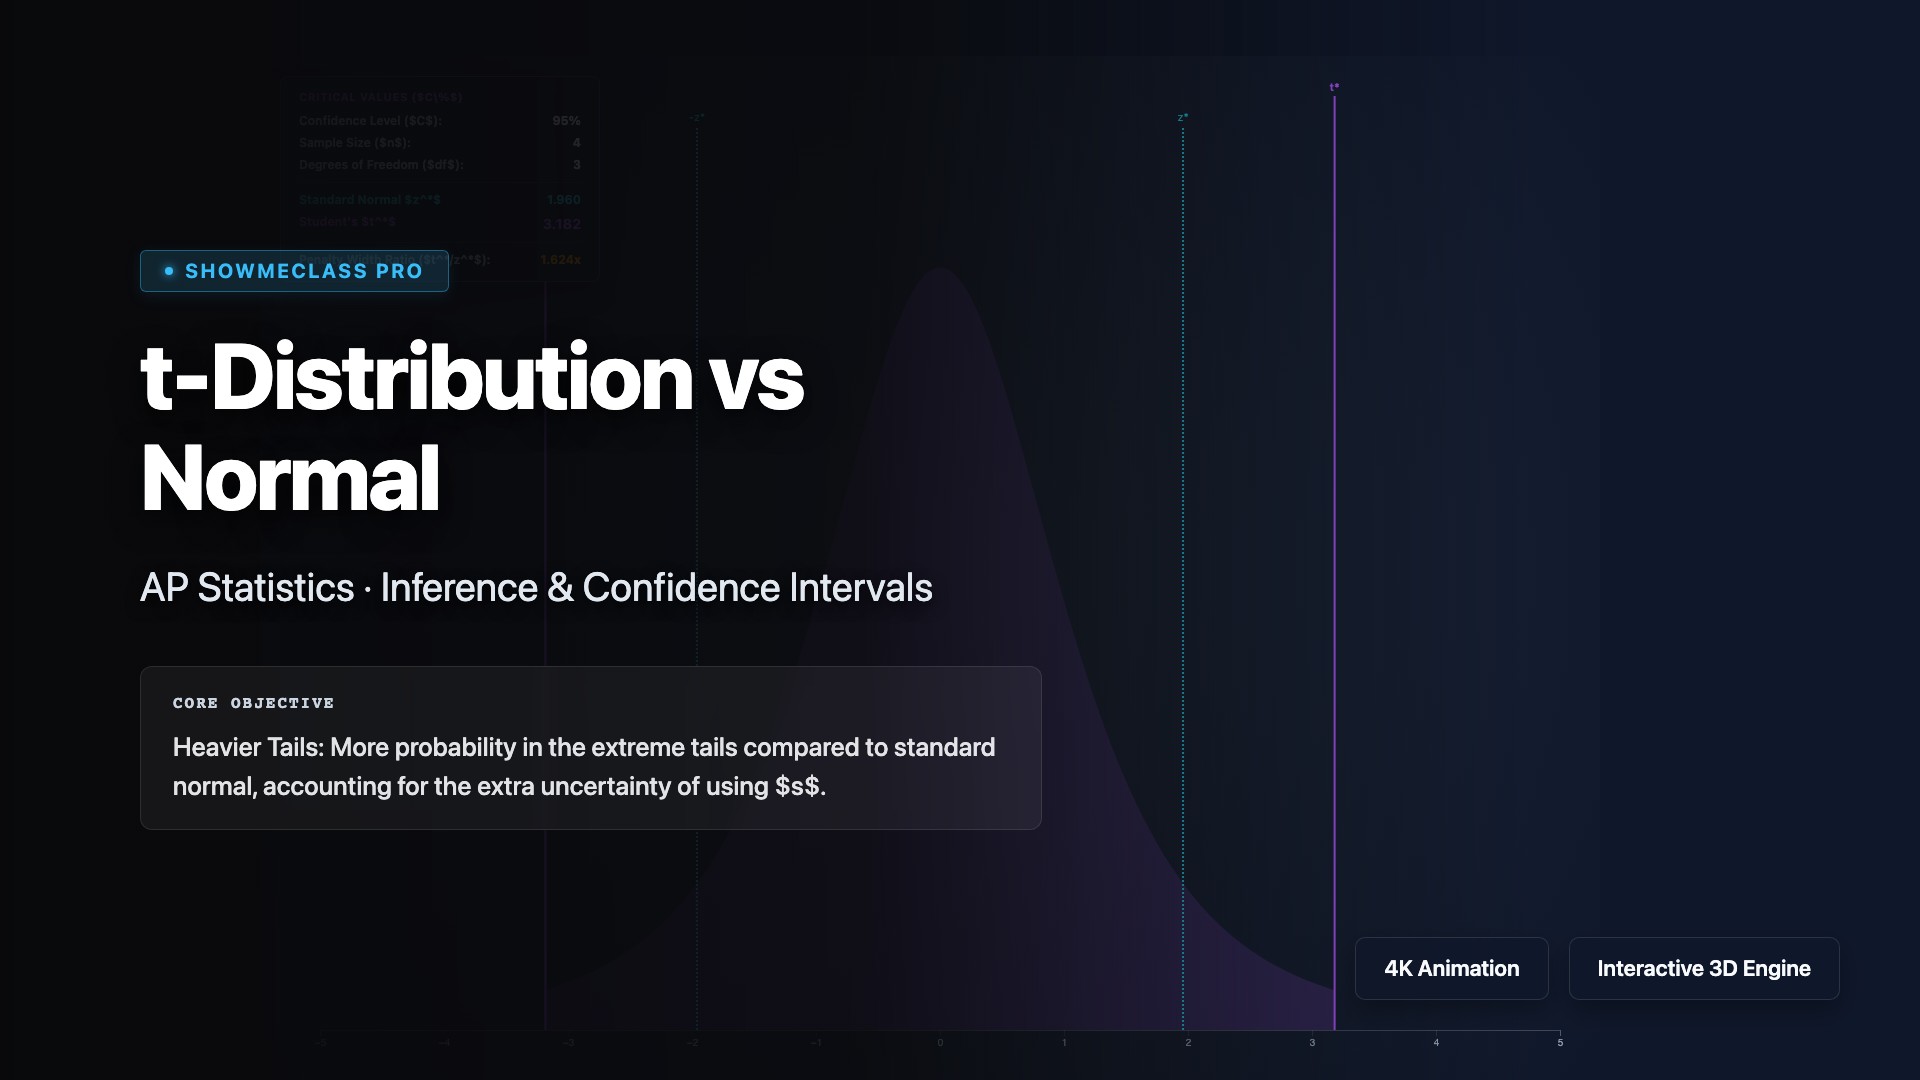
t-Distribution vs Normal
Examine the heavy-tailed Student's t-distribution. Increase degrees of freedom (df) to watch it perfectly converge into the standard normal z-distribution.
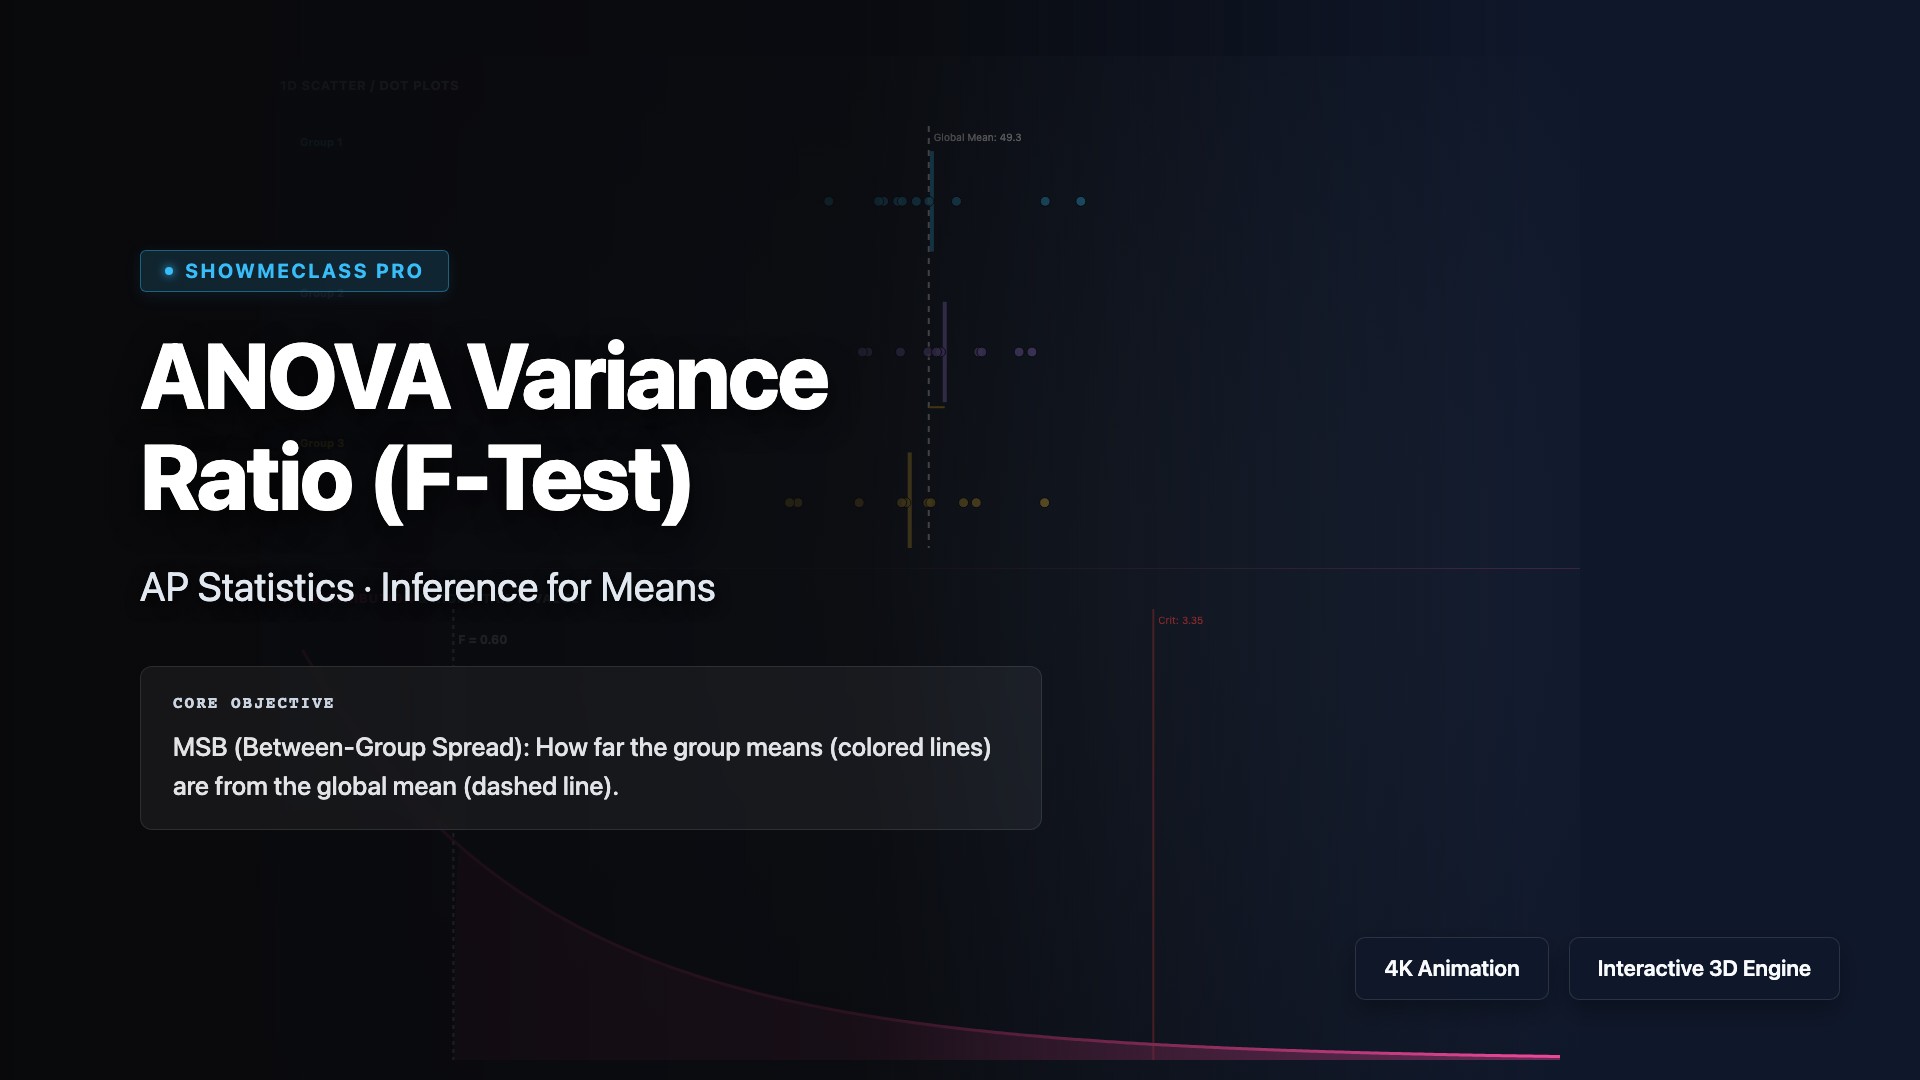
ANOVA Variance Ratio
Deconstruct Analysis of Variance geometrically. Shift group means (MSB) and internal scatter (MSW) to see the massive impact on the F-statistic and P-value.
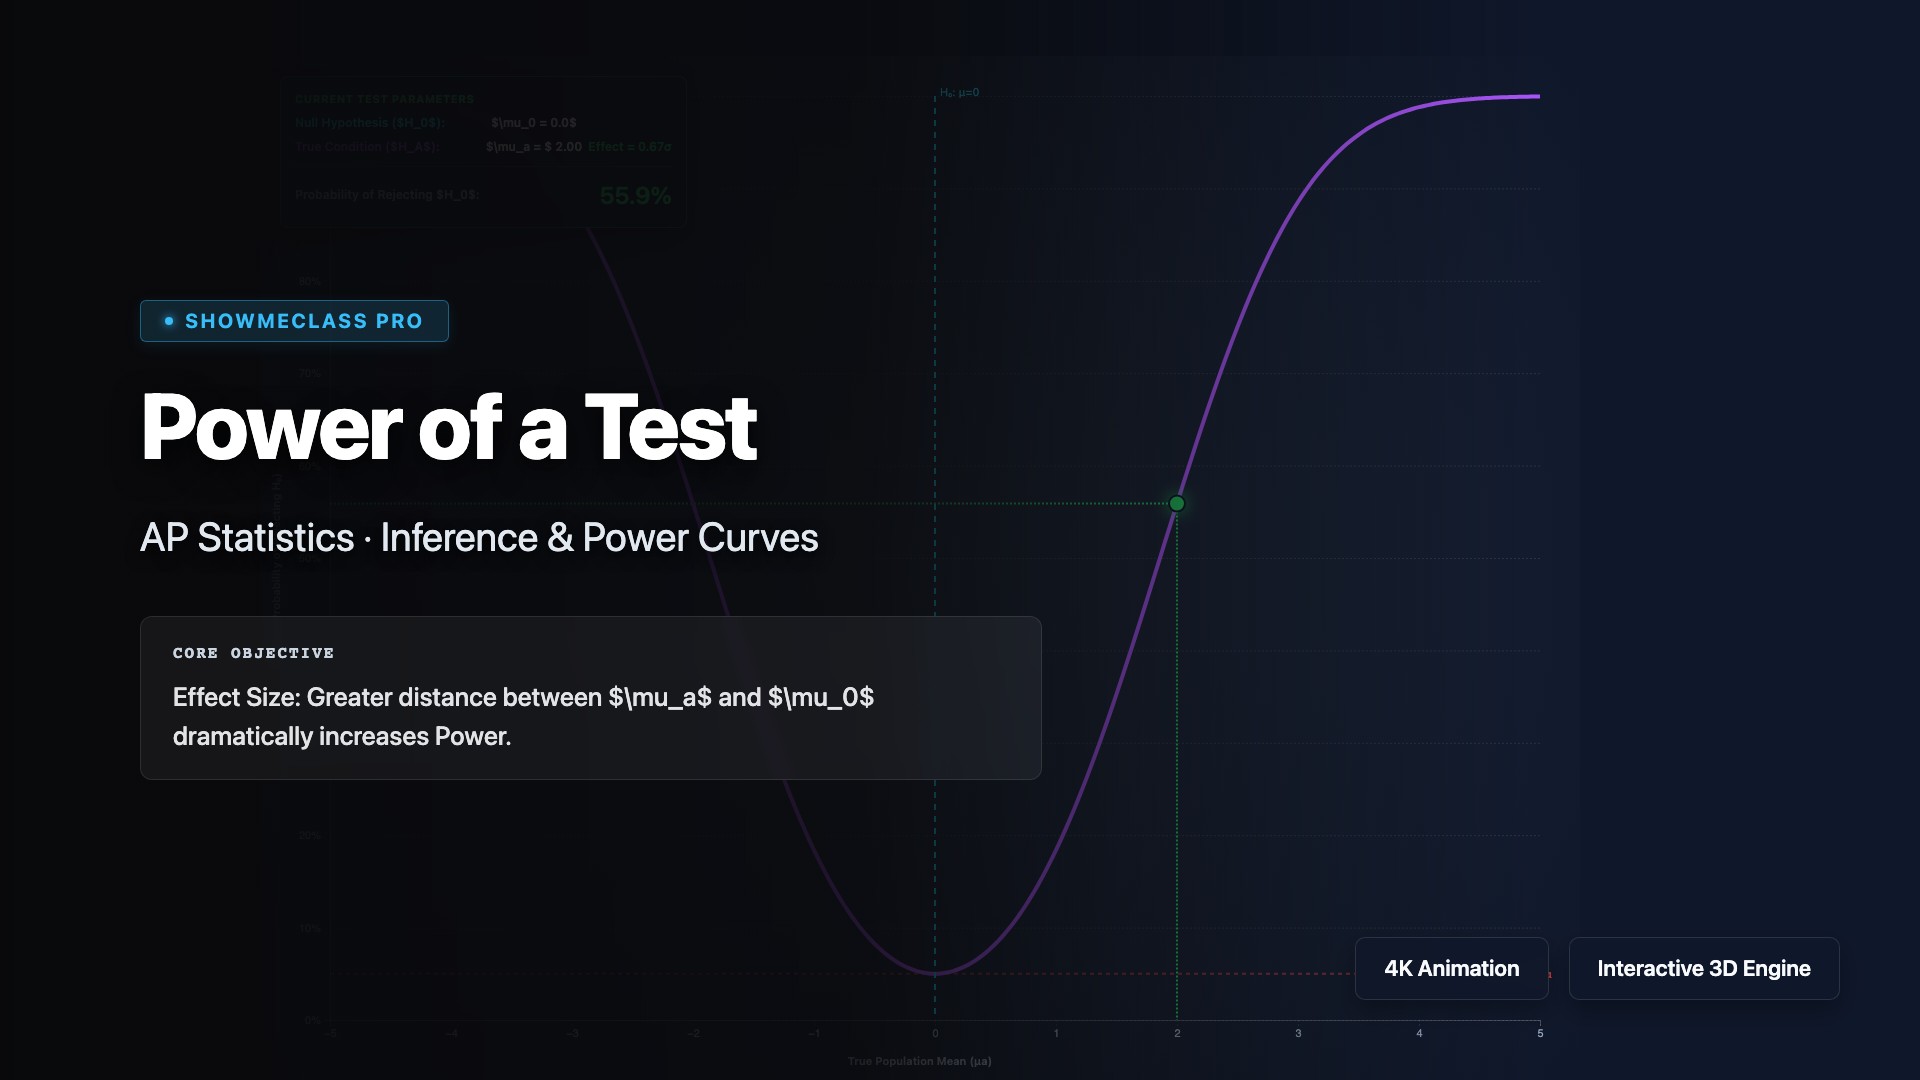
Power of a Test Curve
Visualize how Statistical Power responds dynamically to Effect Size (mu_a), Sample Size, and Alpha. Plot the complete functional power curve.