Showing 12 results
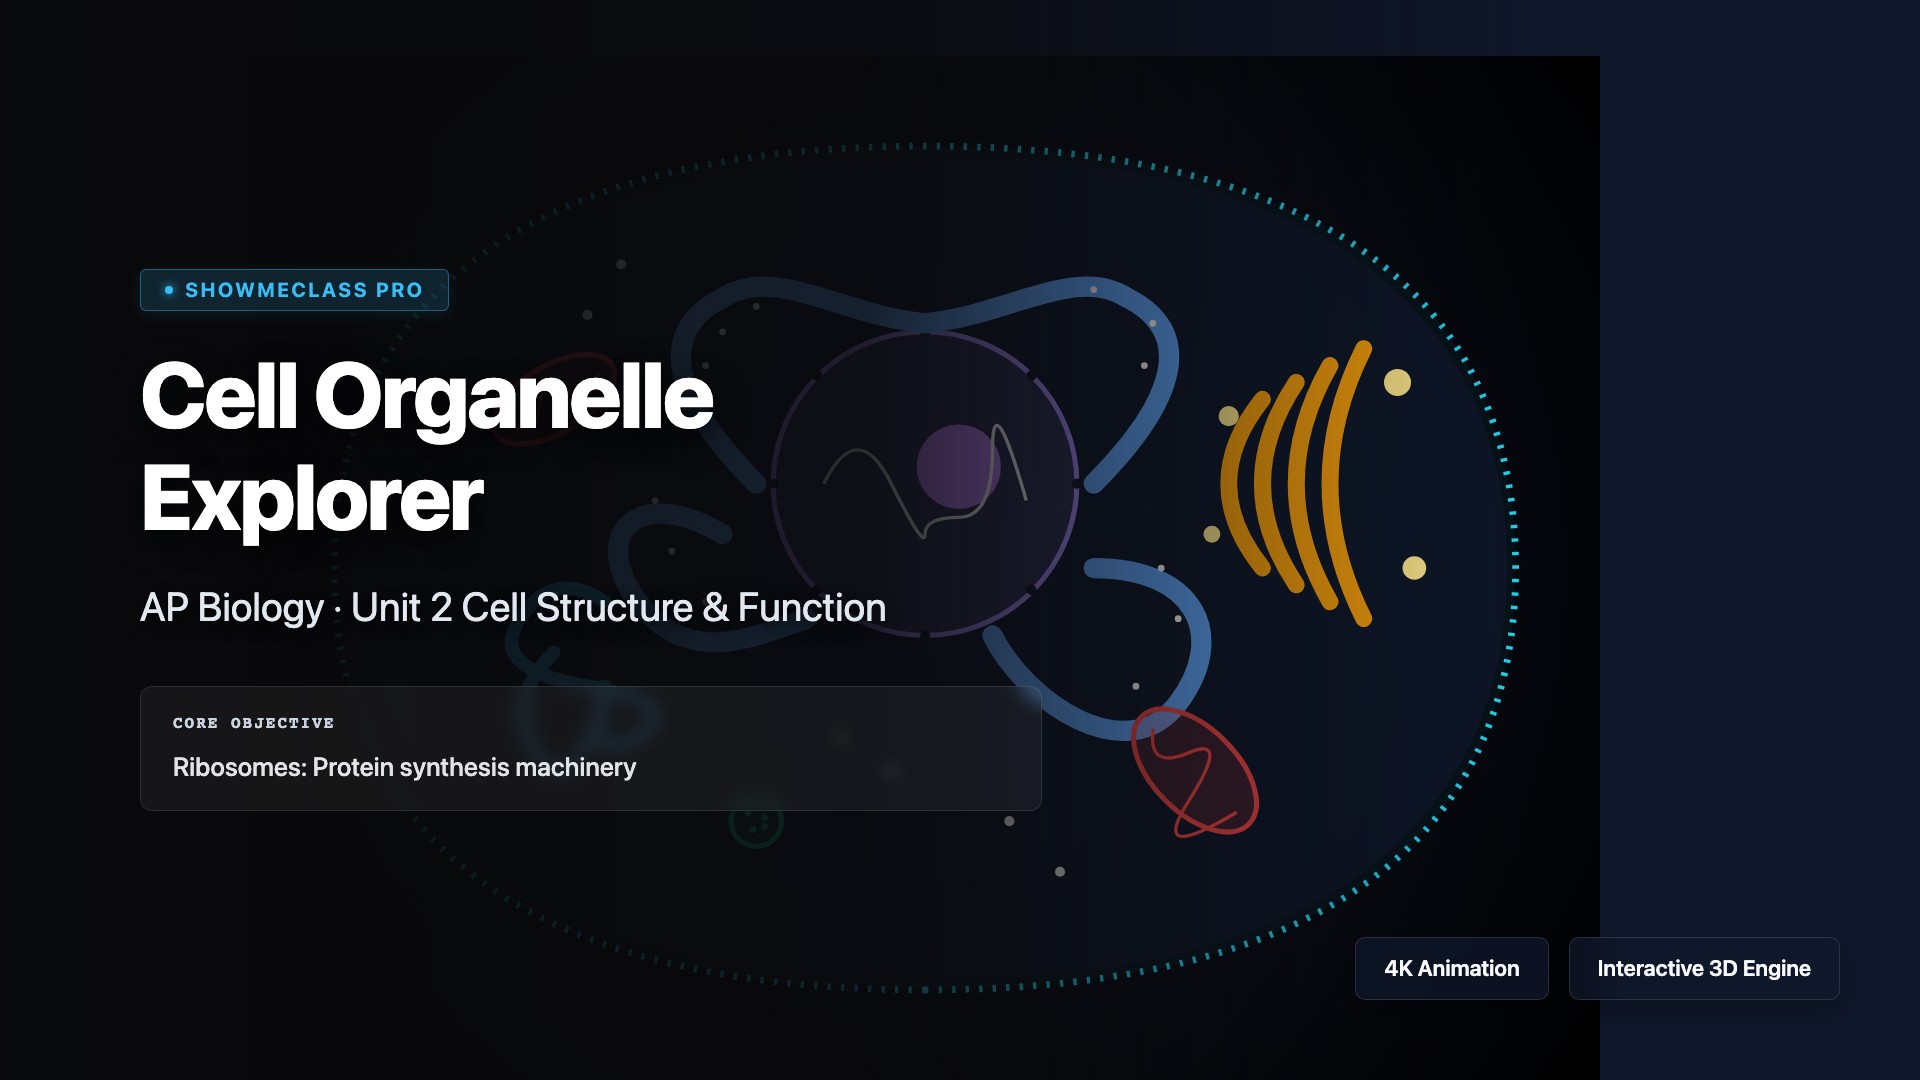
Cell Organelle Function Explorer
Explore an interactive diagram of a eukaryotic cell. Click on organelles like the Nucleus, Rough/Smooth ER, Golgi, and Mitochondria to view detailed functions.
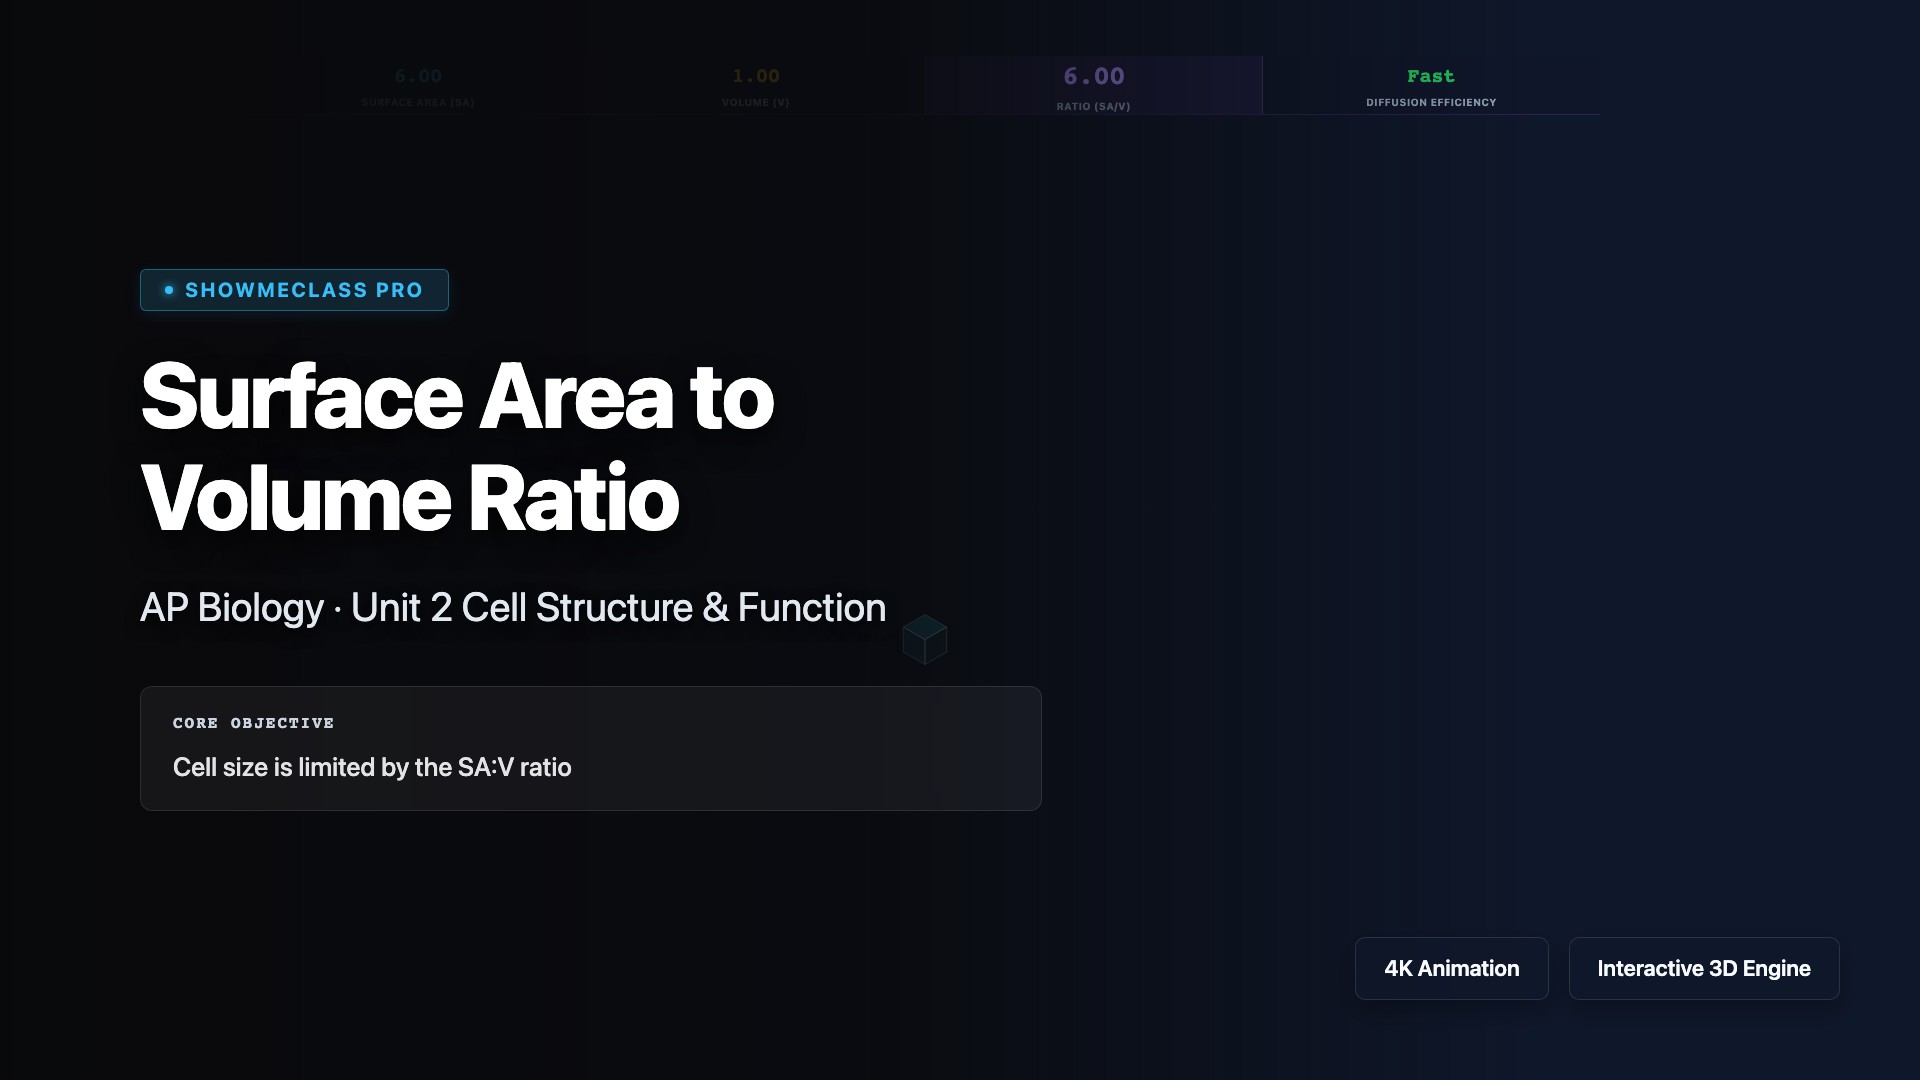
Surface Area to Volume Ratio Animator
Visualize how increasing cell size severely decreases the SA:V ratio, simulating diffusion waves to show why cells must remain small or develop folds.
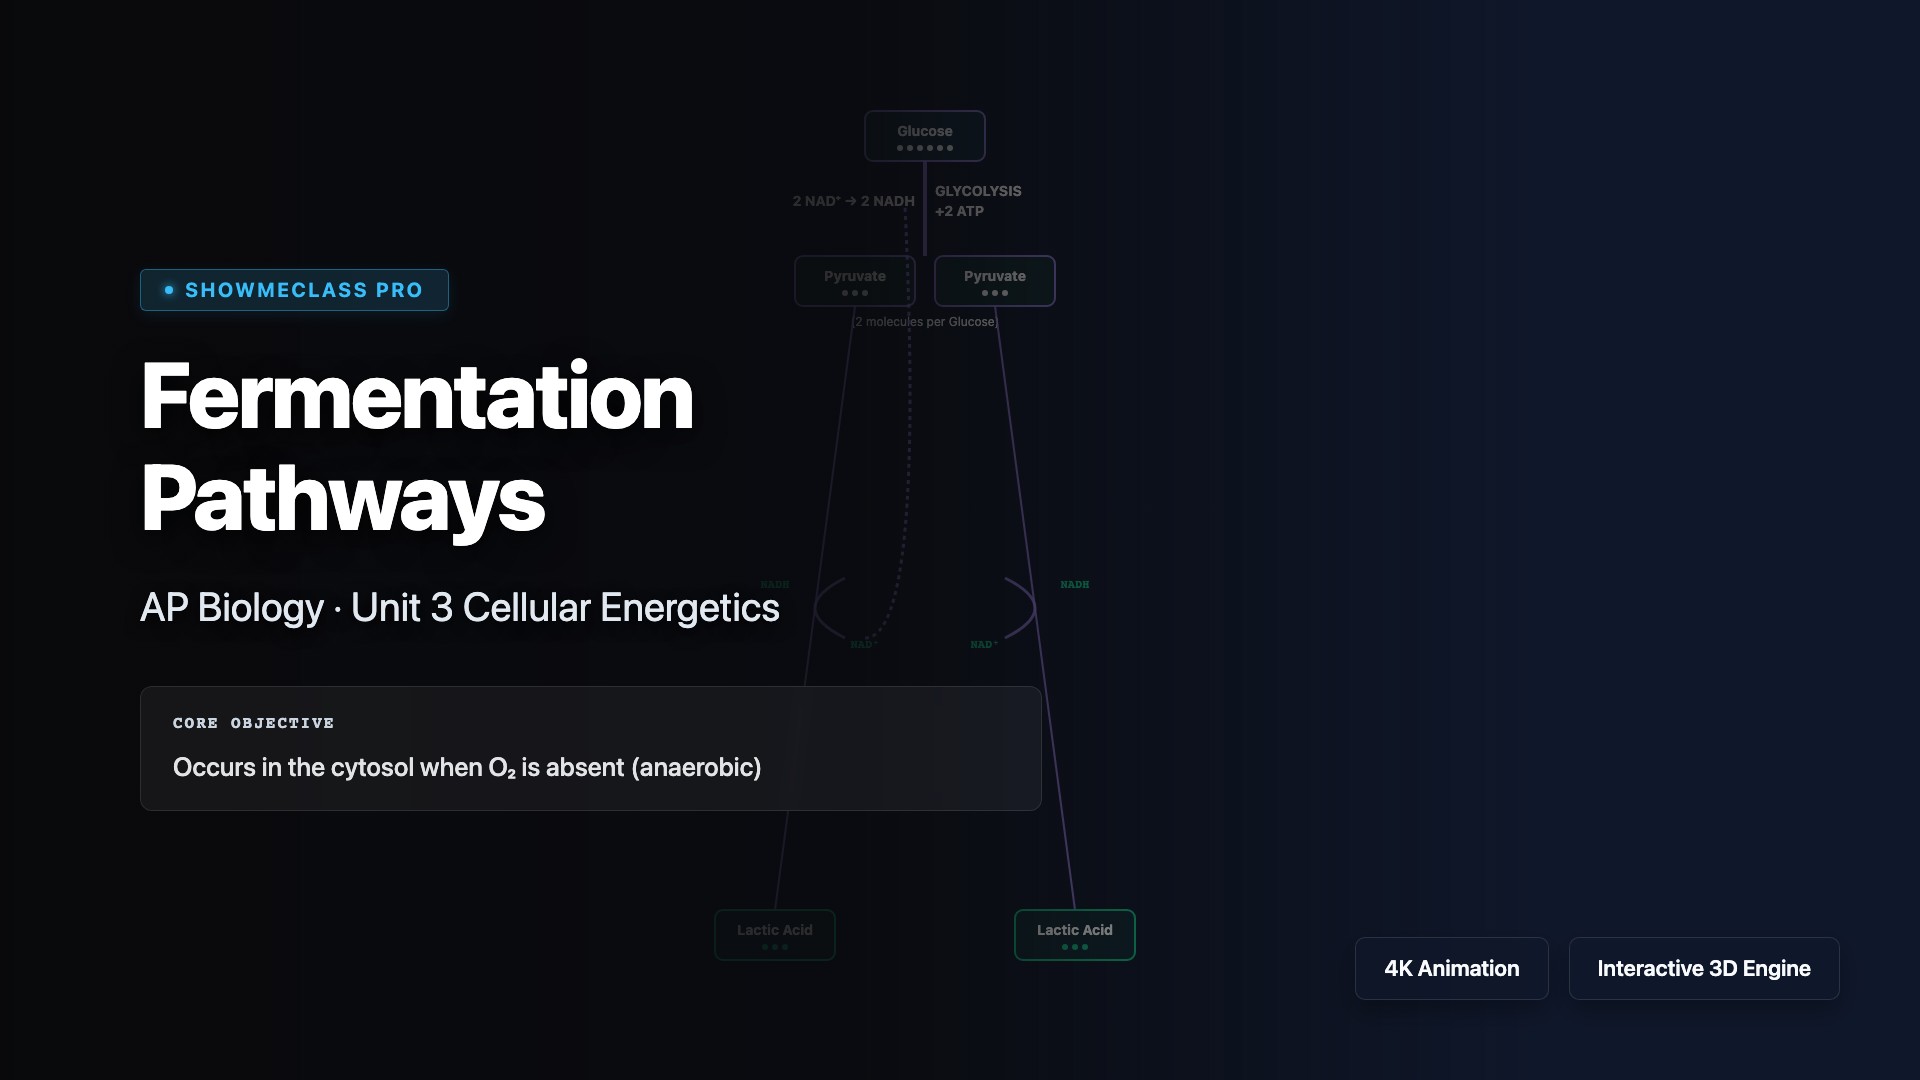
Fermentation Pathways Simulator
Compare anaerobic Lactic Acid Fermentation vs Alcoholic Fermentation to Aerobic Respiration, emphasizing the critical need to regenerate NAD⁺ for glycolysis.

Evidence for Evolution Comparator
Compare the 3 main pillars of evolutionary evidence: Stratigraphic Fossil Progression, Bone Mapping of Homologous Structures, and Cytochrome c Amino Acid divergence.
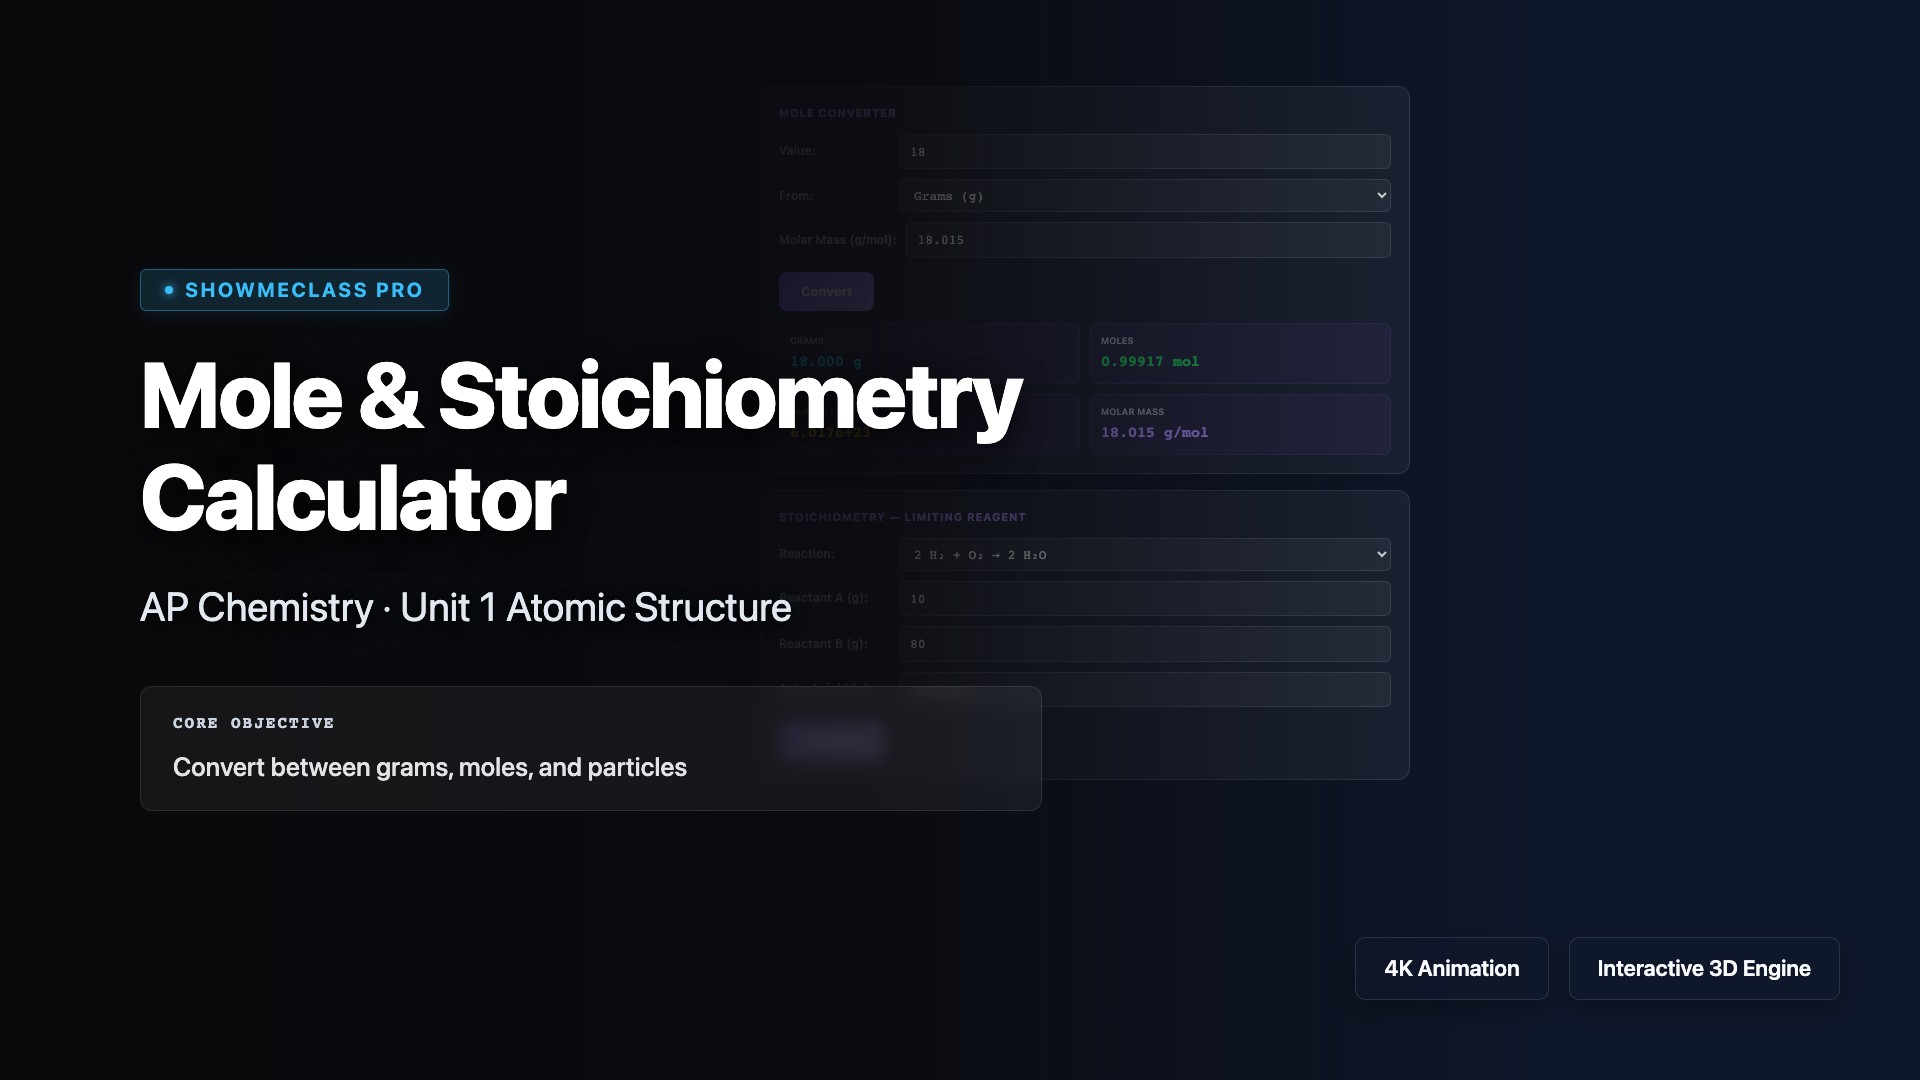
Mole Concept & Stoichiometry Calculator
Convert between grams, moles, and particles. Determine limiting/excess reagents with 4 preset reactions. Calculate theoretical yield and percent yield.

Isotope Notation & Average Atomic Mass
Explore isotope notation for 7 elements. See mass number, atomic number, proton/neutron counts, and calculate weighted average atomic mass from natural abundances.
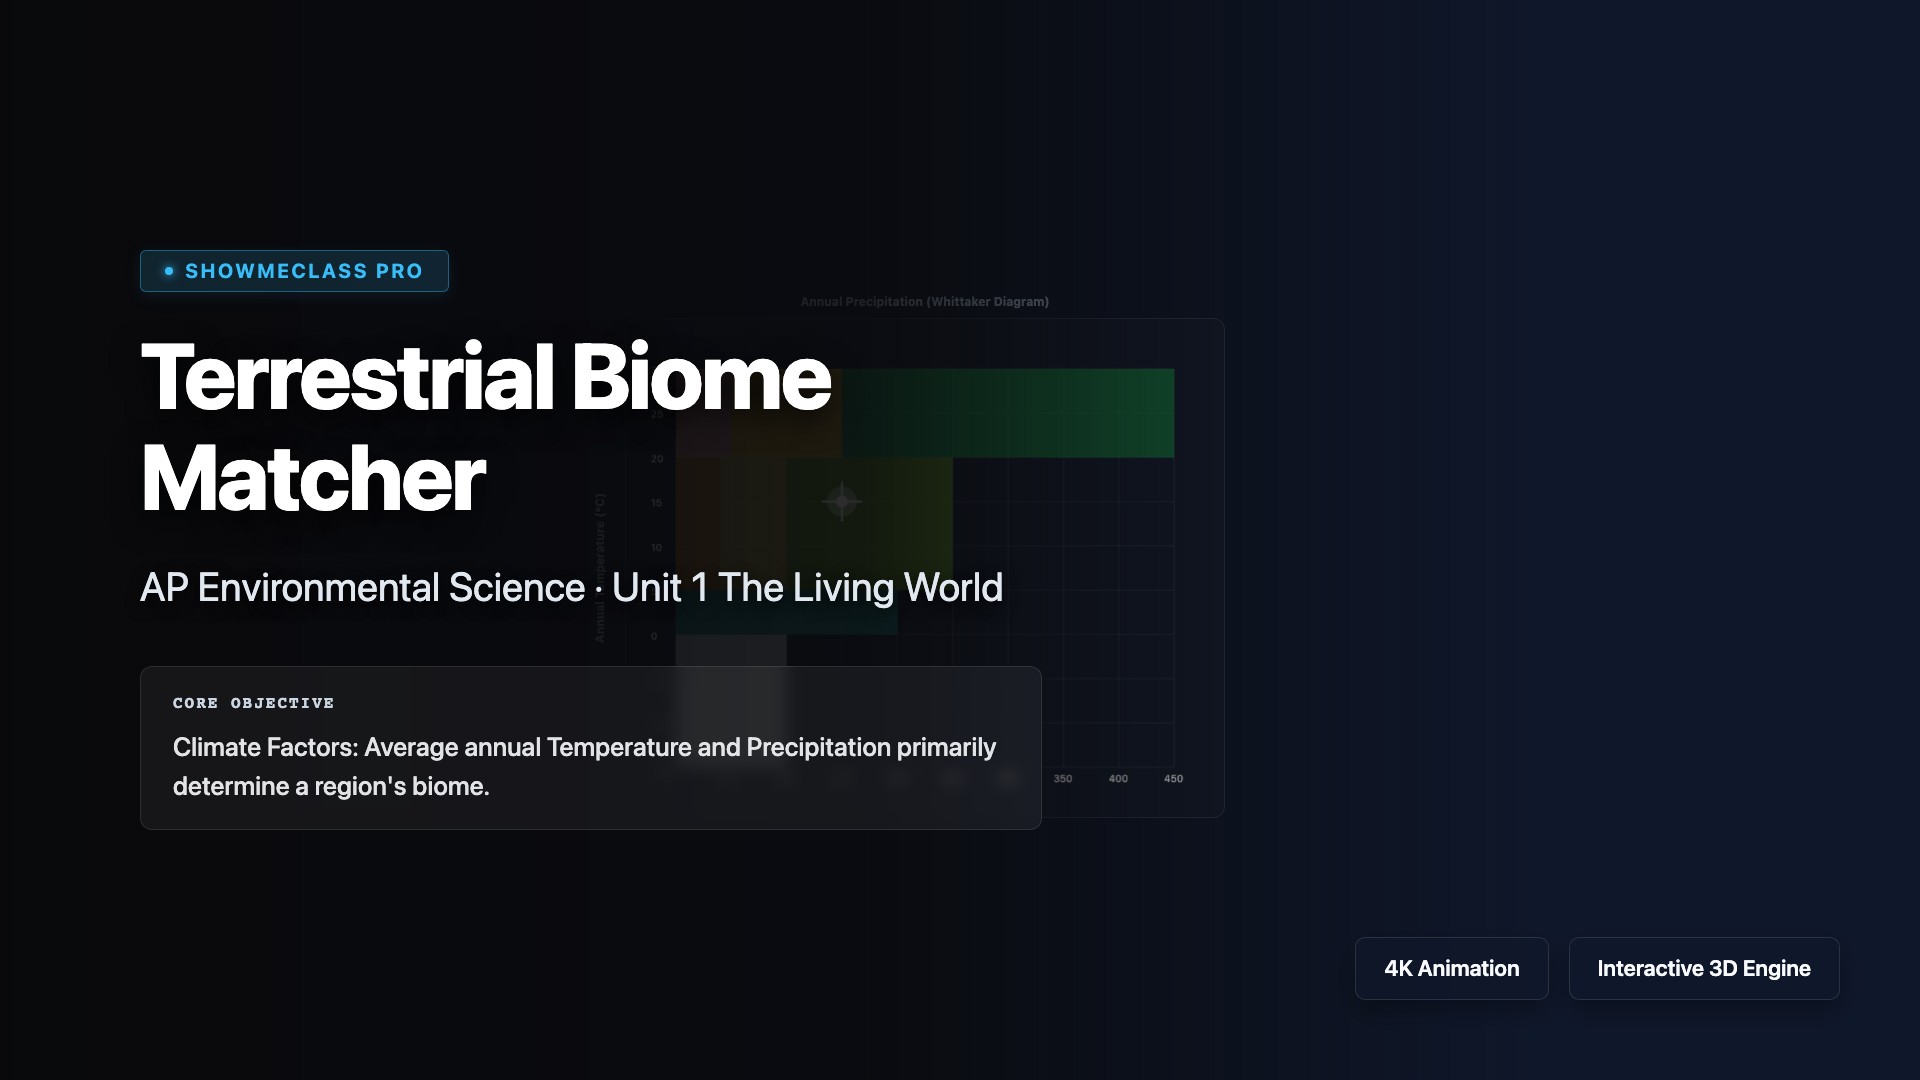
Terrestrial Biome Matcher
Interactive Whittaker Biome Plot mapping average annual temperature and precipitation to global terrestrial biomes, from Tundra to Tropical Rainforest.
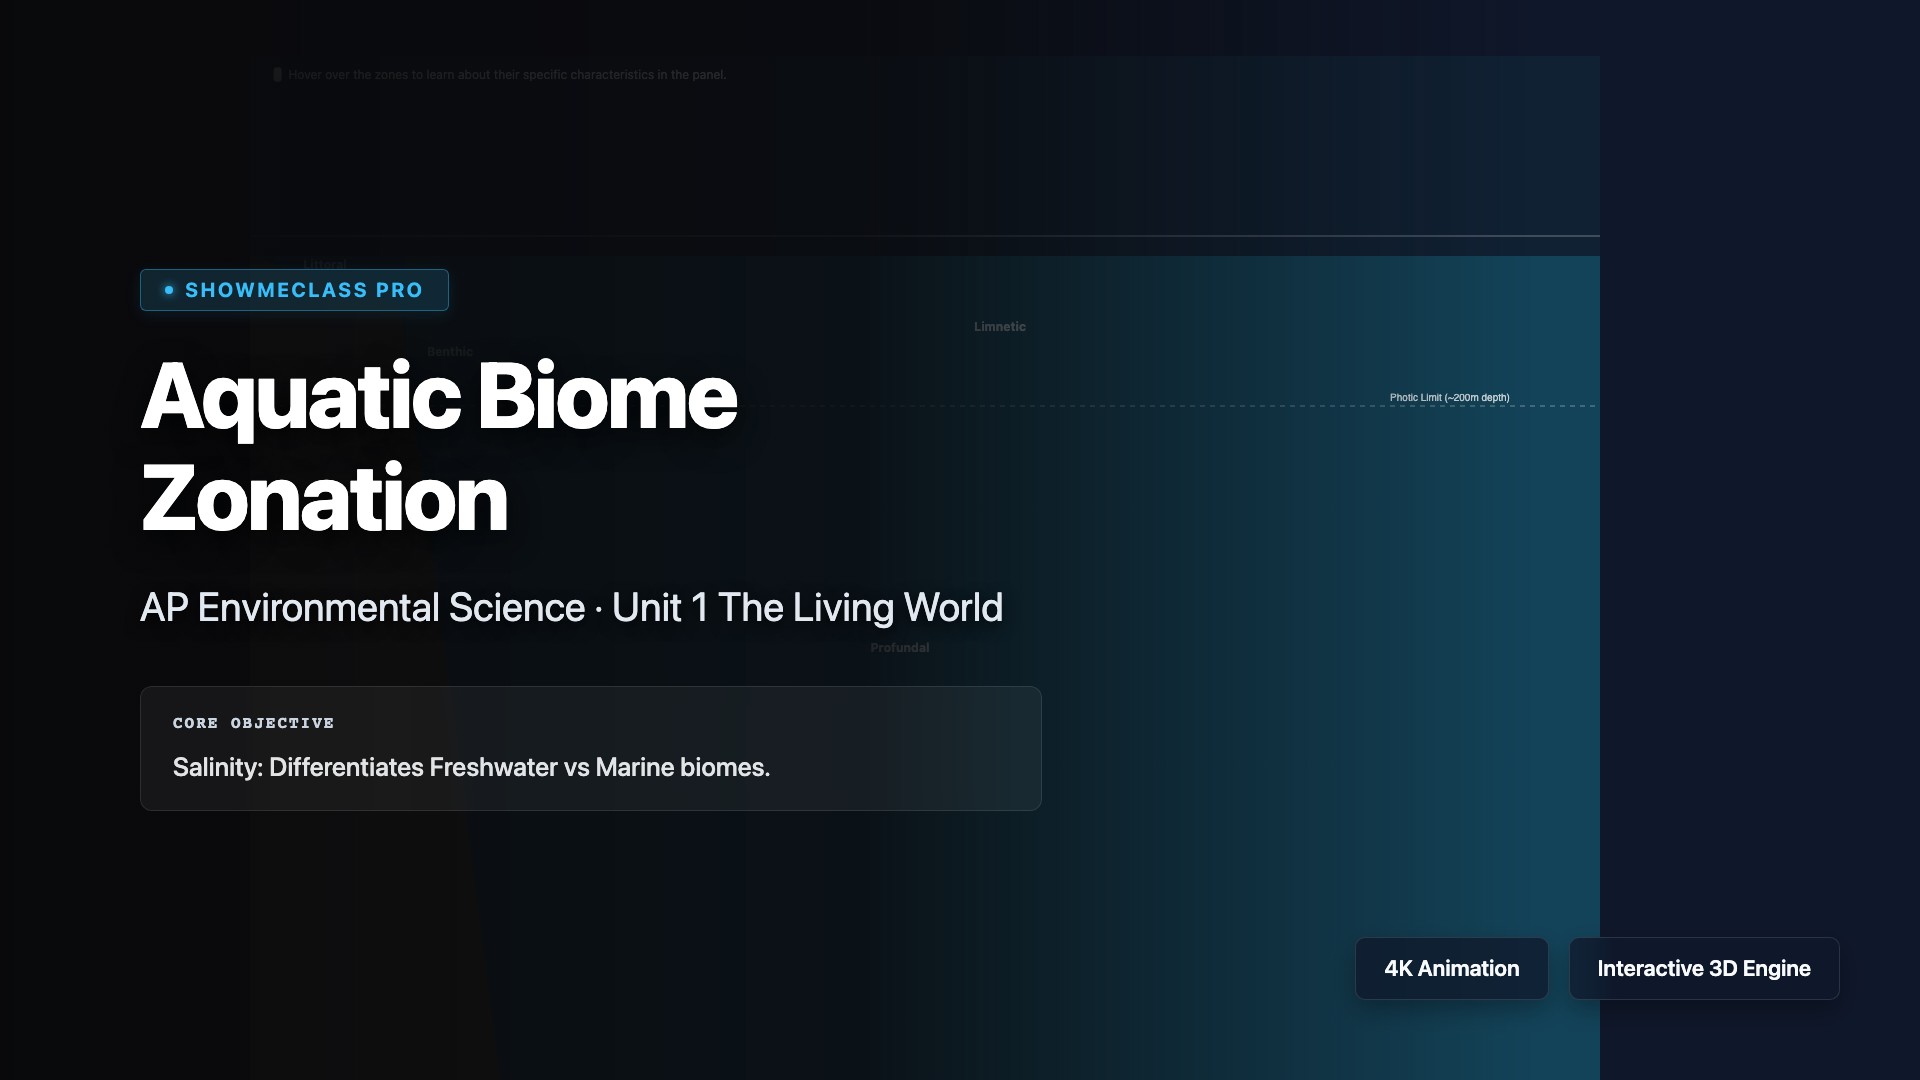
Aquatic Biome Zonation
Interactive diagram dividing Lakes and Oceans into standard ecological zones (Littoral, Limnetic, Benthic, Pelagic, Intertidal). Hover-based learning tool.
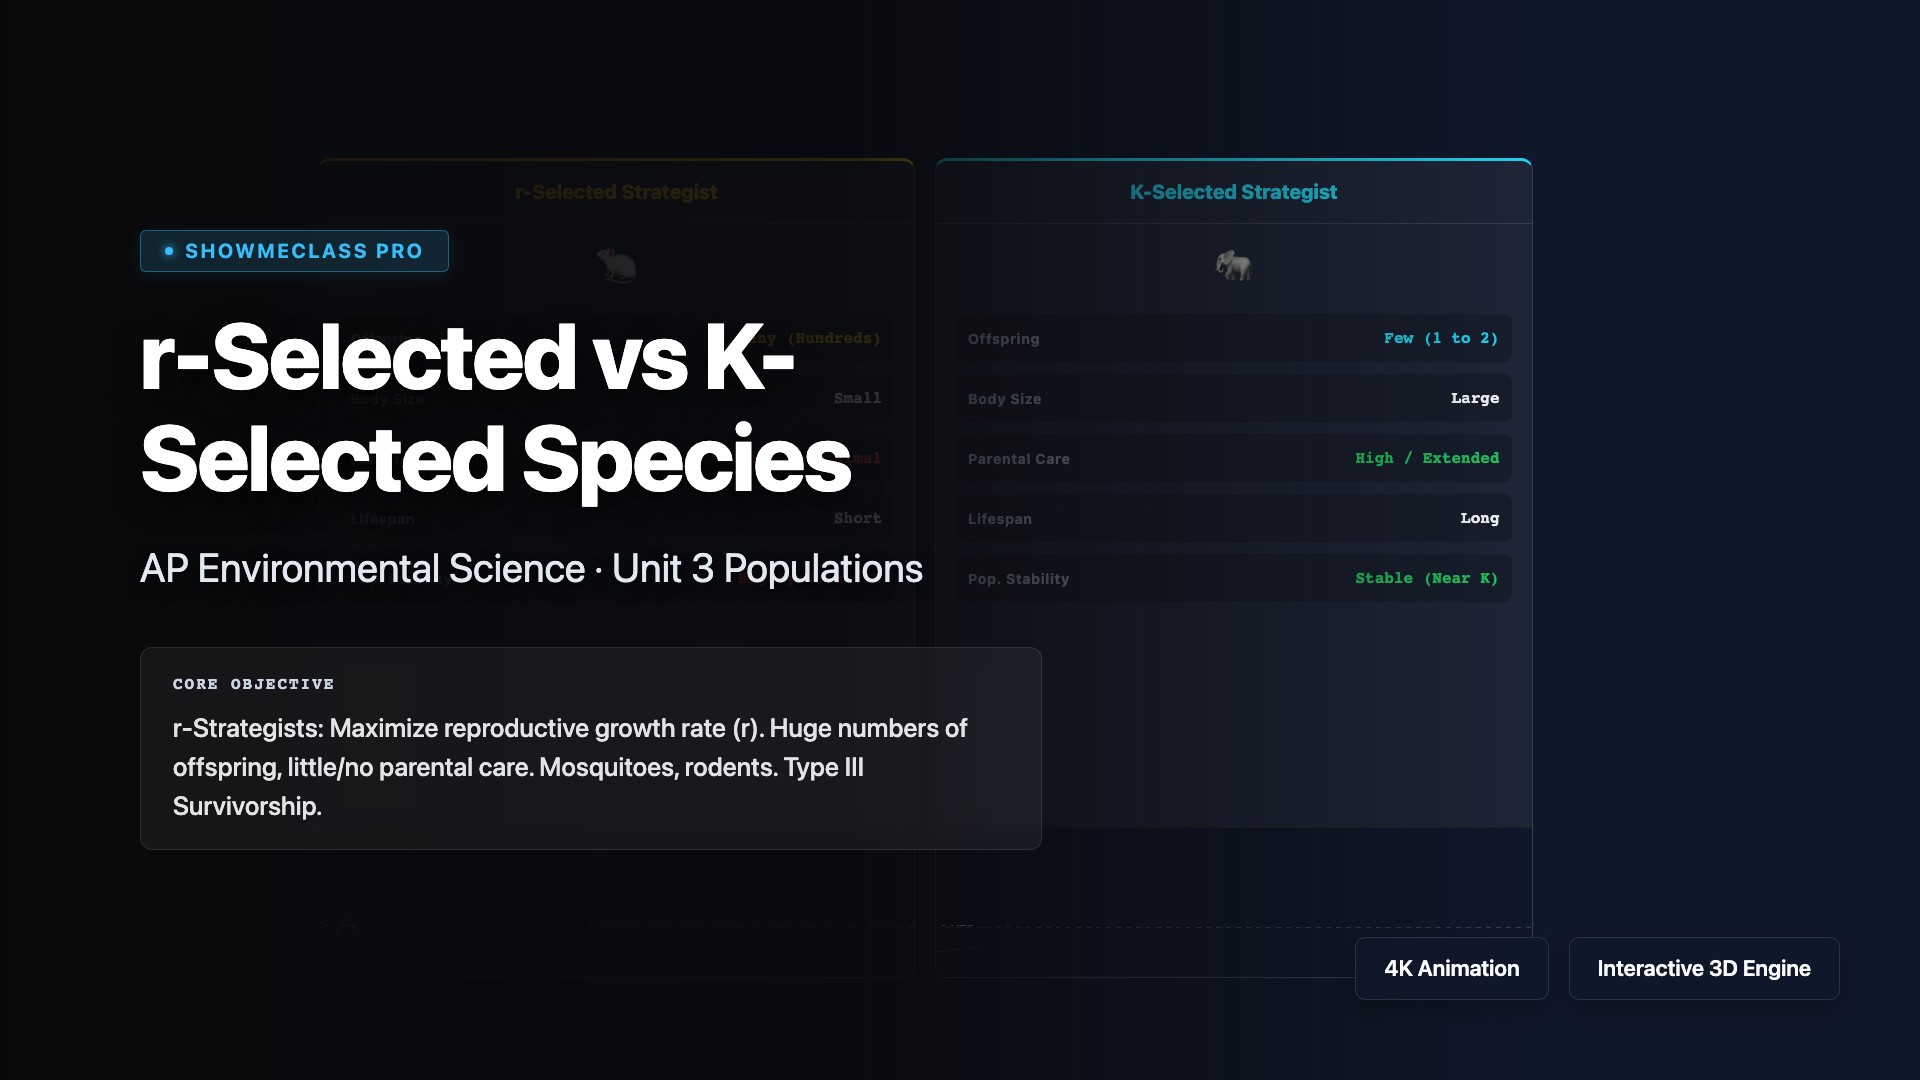
r/K Selection Dynamics
Comparison tool differentiating r-selected strategies (volatile booms, rapid reproductive rates) from K-selected strategies (stable carrying capacity, vulnerability to extinction).

Rock Cycle Explorer
The Rock Cycle (Igneous, Sedimentary, Metamorphic) simplified into an interactive, node-based dynamic loop governed by tectonic and surface processes.
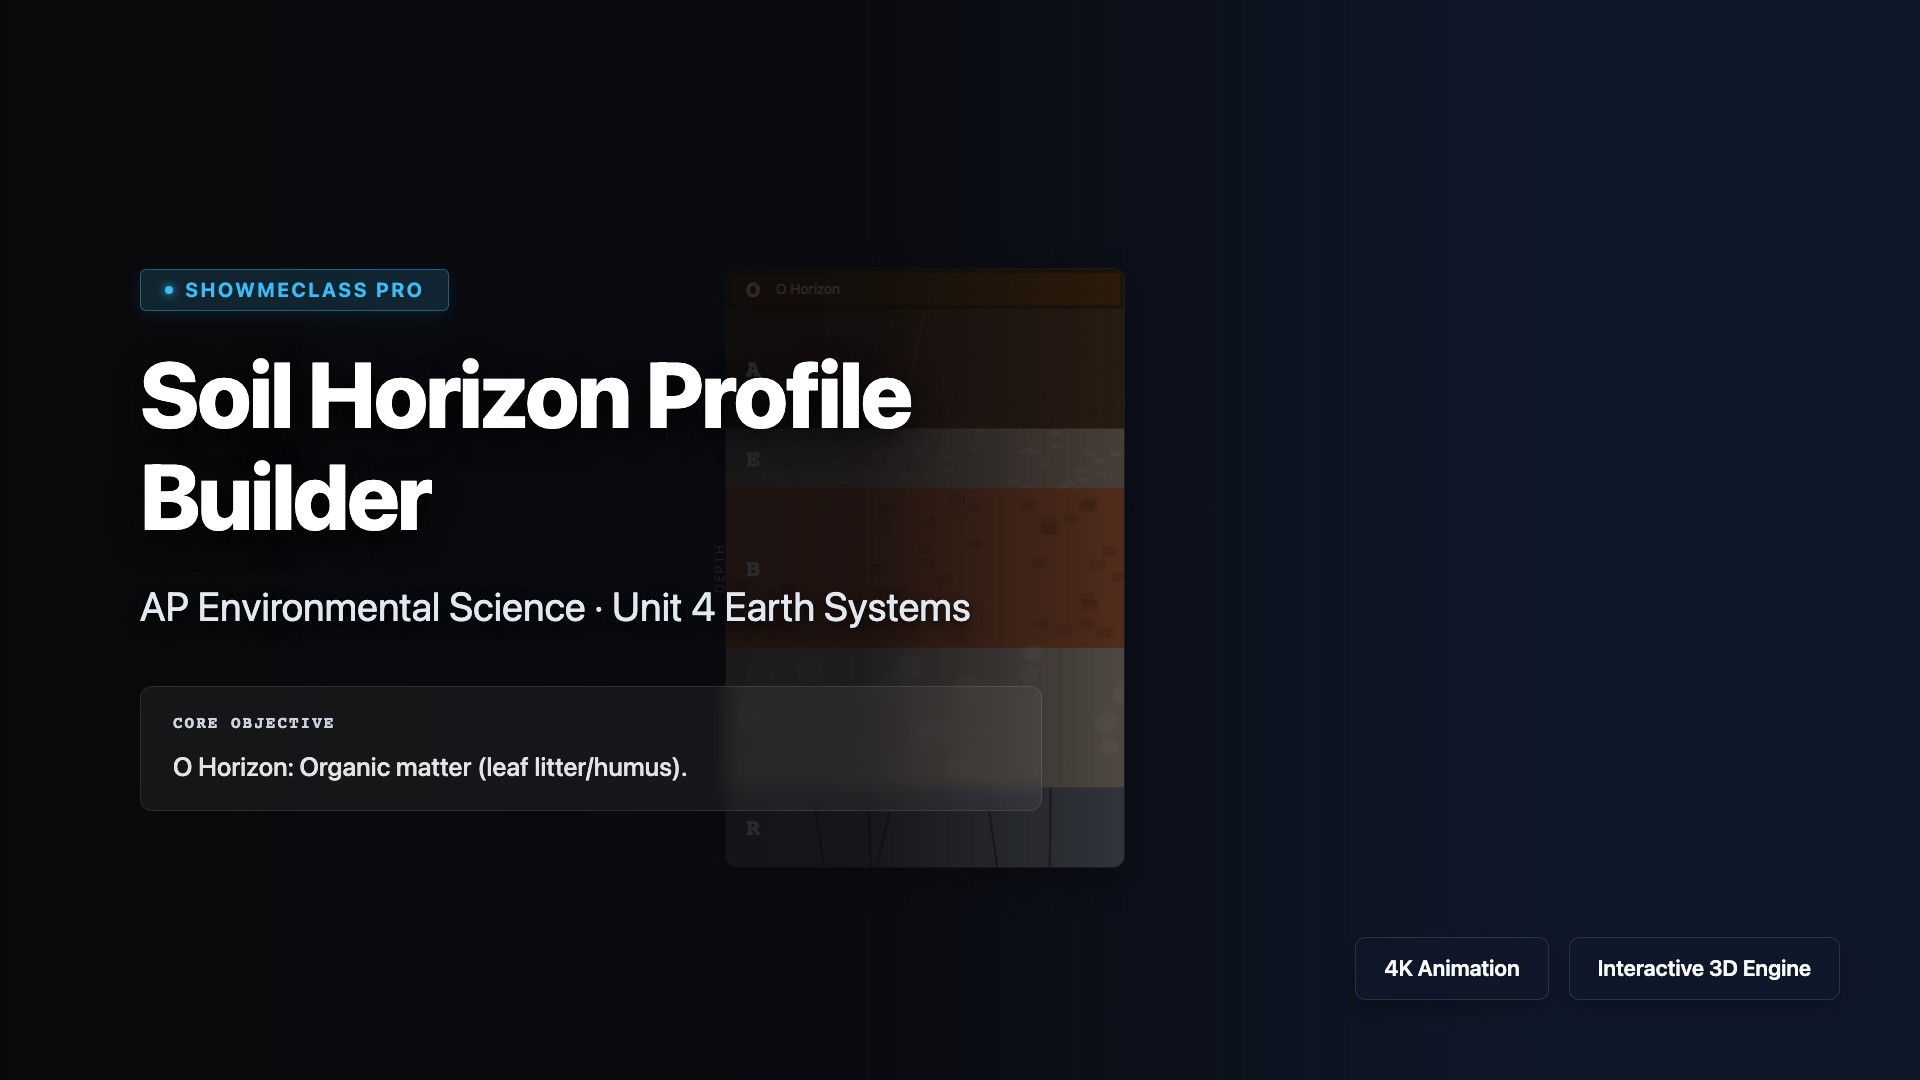
Soil Horizon Profile Builder
Visual builder examining the 6 distinct soil horizons (O, A, E, B, C, R) identifying organic aggregation, topsoil leaching, and bedrock breakdown.
Tragedy of the Commons
Economic game theory simulator demonstrating the Tragedy of the Commons via a multi-turn global fishery model against AI fleets.