Showing 12 results
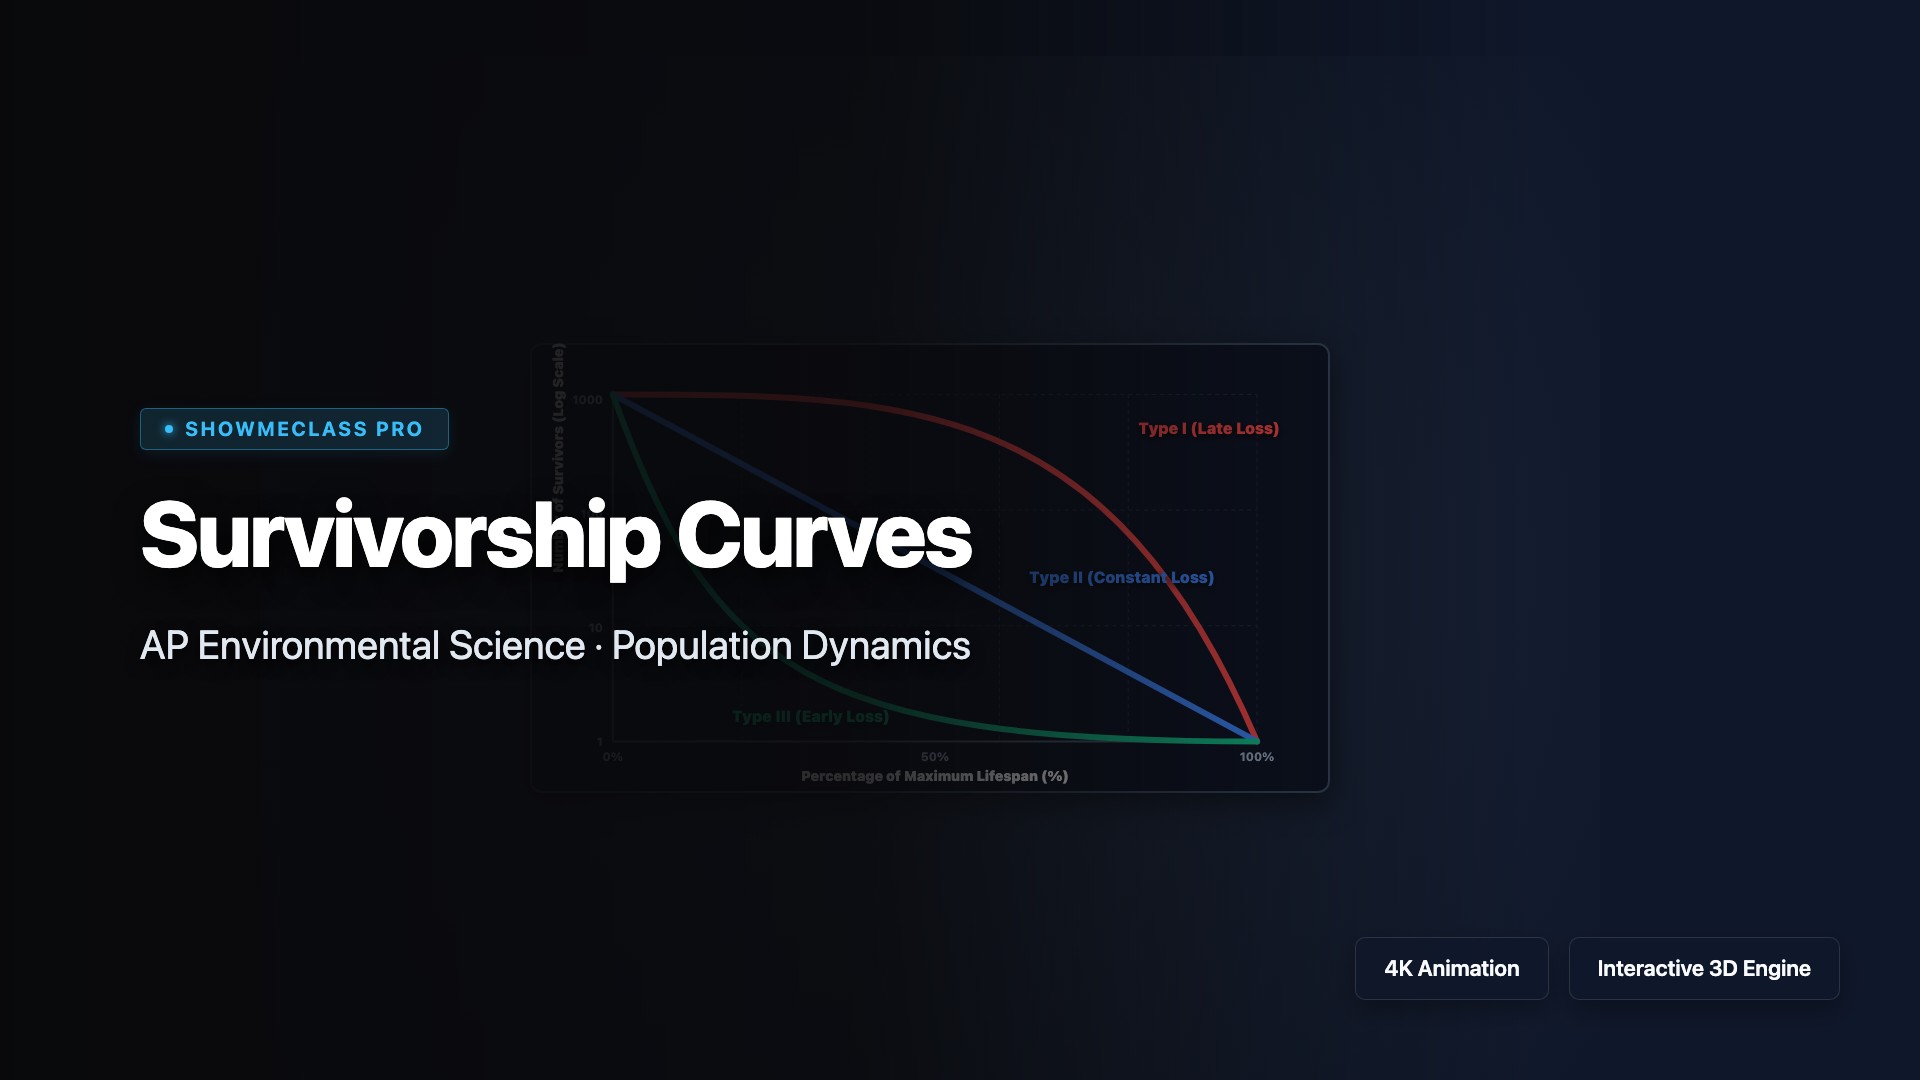
Survivorship Curves
Compare Type I, Type II, and Type III survivorship curves. Understand the distinction between K-selected and r-selected reproductive strategies across the animal kingdom.

LD50 Toxicity Curve
Analyze dose-response sigmoidal curves to determine the Lethal Dose 50% (LD50) of various chemical toxins. Understand acute toxicity and threshold levels.

Limits & Continuity Explorer
Interactive limit evaluation (left-hand, right-hand, absolute) and 3-step continuity logical check tool simulating removable, jump, infinite, and oscillating discontinuities.
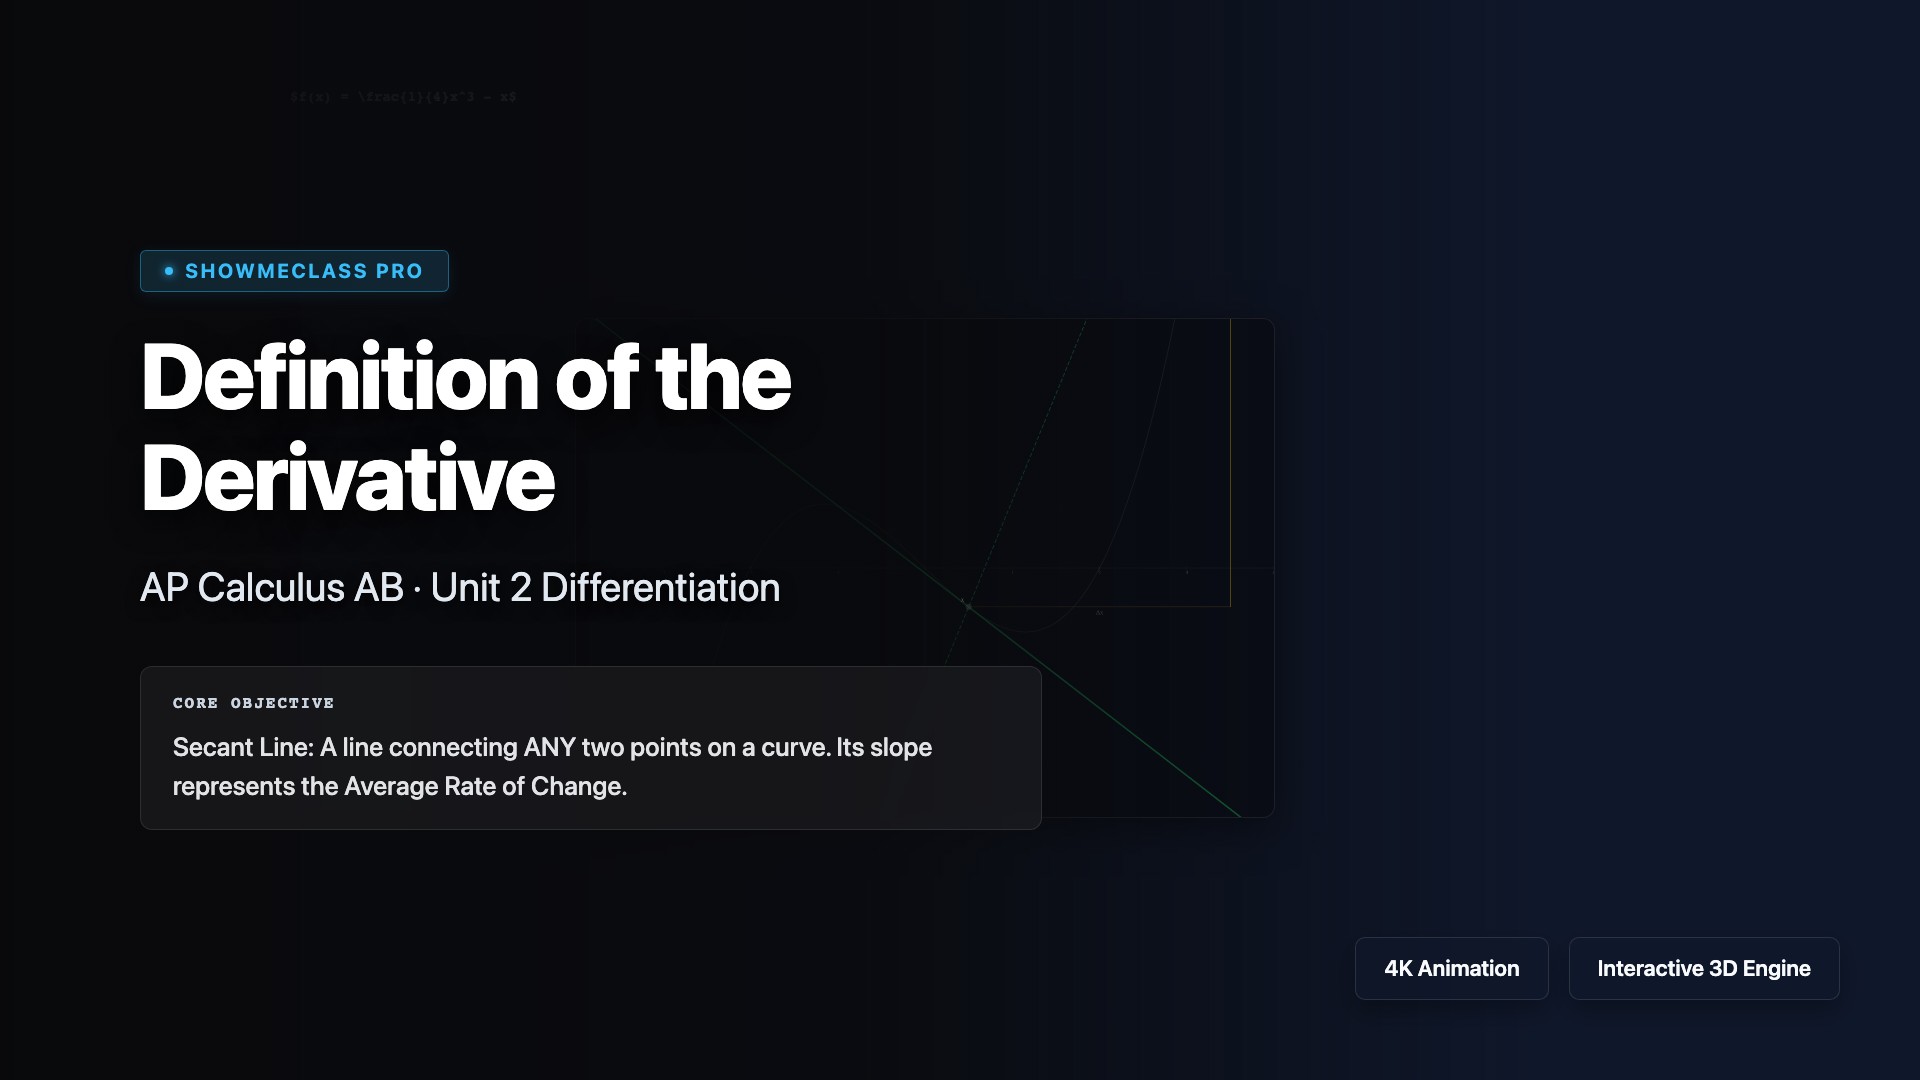
Definition of the Derivative
Interactive secant-to-tangent limit convergence visualizing the formal definition of the derivative with dynamic dx collapsing.

Riemann Sum Approx
Interactive summation explorer comparing Left, Right, Midpoint Riemann sums and Trapezoidal logic. N-slider rapidly expands bounding box series $\Sigma$ into exact integral space via $N \rightarrow \infty$, dynamically revealing errors algebraically and geometrically.
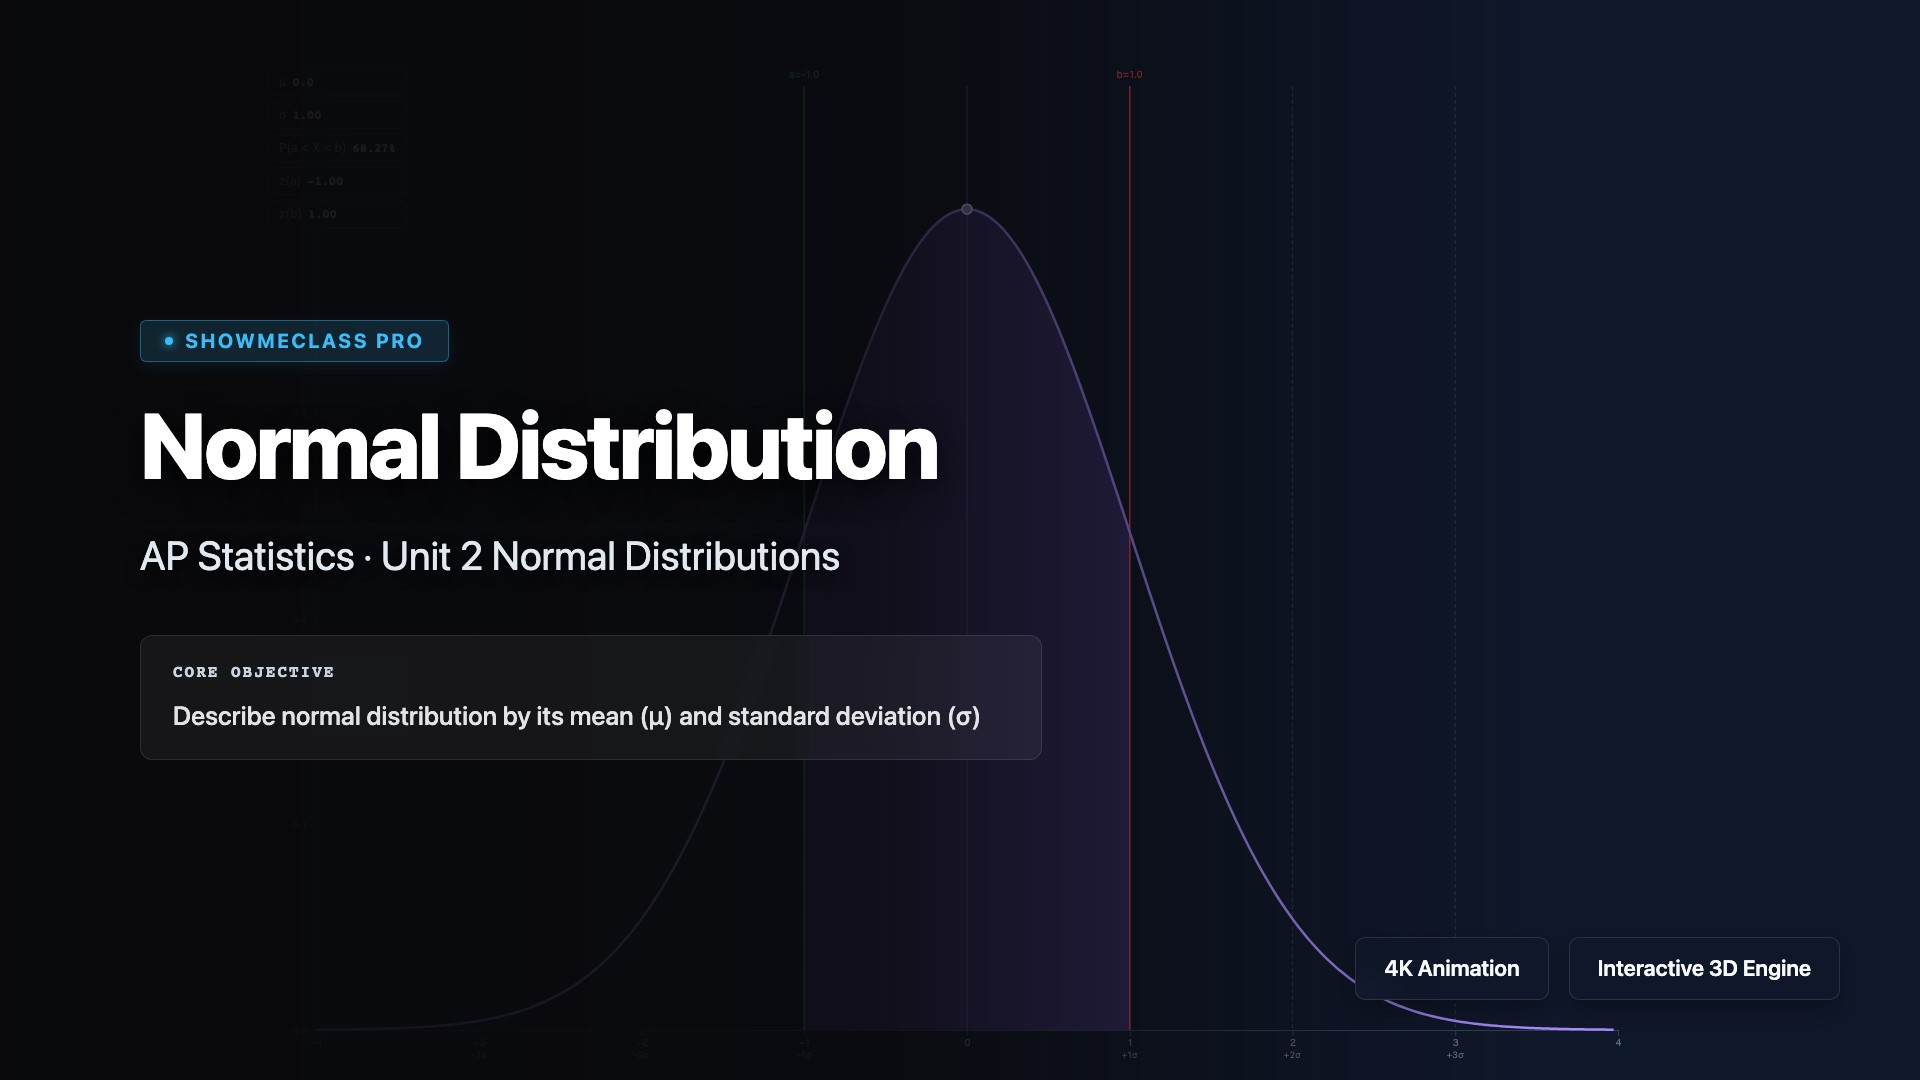
Normal Distribution Explorer
Interactive Gaussian curve generator manipulating $\mu$ and $\sigma$ instantly mapped against the 68-95-99.7 Empirical Rule. Highlights discrete $Z$-score thresholds tracking precision standard deviation geometry exactly.

Scatterplots & Correlation (r)
Interactive scatterplot geometry demonstrating Pearson's correlation coefficient mapping bounds ($|r| \to 1$). Employs bivariate normal Box-Muller transformations to visually generate dynamic density clouds calculating $R^2$ determination variances overlaid mathematically on LSRL projection planes natively.

RGB Color Mixer & Hex Converter
Interactive RGB color mixing with real-time decimal, hexadecimal, and 24-bit binary conversion. Demonstrates additive color model, 8-bit channel depth (256 levels per channel), and the 16.7M color gamut of modern displays.
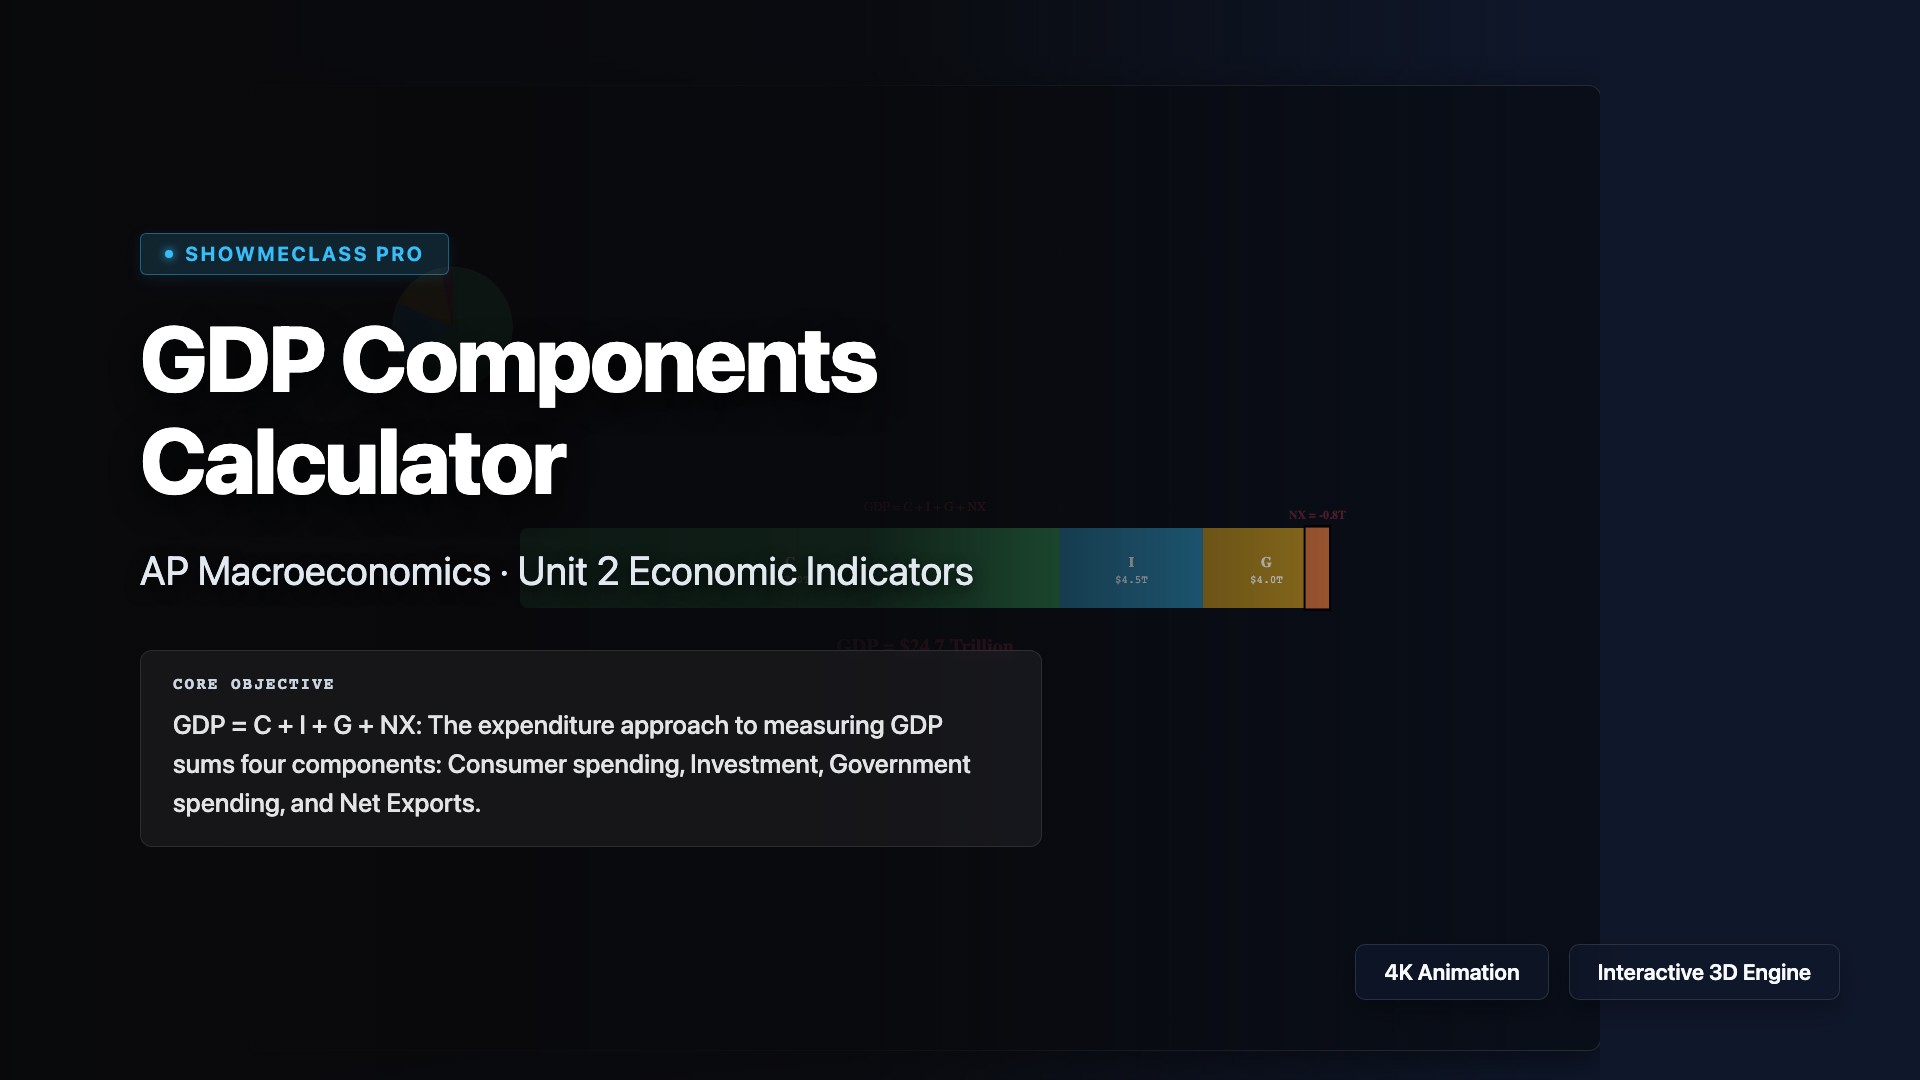
GDP Components Calculator (C+I+G+NX)
Interactive GDP expenditure approach calculator. Adjust Consumption, Investment, Government spending, and Net Exports with real-time stacked bar and pie chart visualization showing US-benchmarked component share percentages.

Unemployment Types & Natural Rate
Stacked bar and pie chart decomposition of 3 unemployment types (frictional, structural, cyclical). Adjustable components reveal Natural Rate of Unemployment (NRU = frictional + structural), GDP gap assessment, and economy status classification.

Erikson's Psychosocial Stages
Interactive 8-stage staircase visualization of Erikson's psychosocial development theory. Click each stage to explore the crisis pair, age range, virtue gained, and real-world implications from infancy through late adulthood.

Freud's Psychosexual Stages
Five-column visualization of Freud's psychosexual stages (Oral, Anal, Phallic, Latency, Genital) with erogenous zones, developmental focus areas, and fixation outcomes that shape adult personality traits.