Showing 12 results
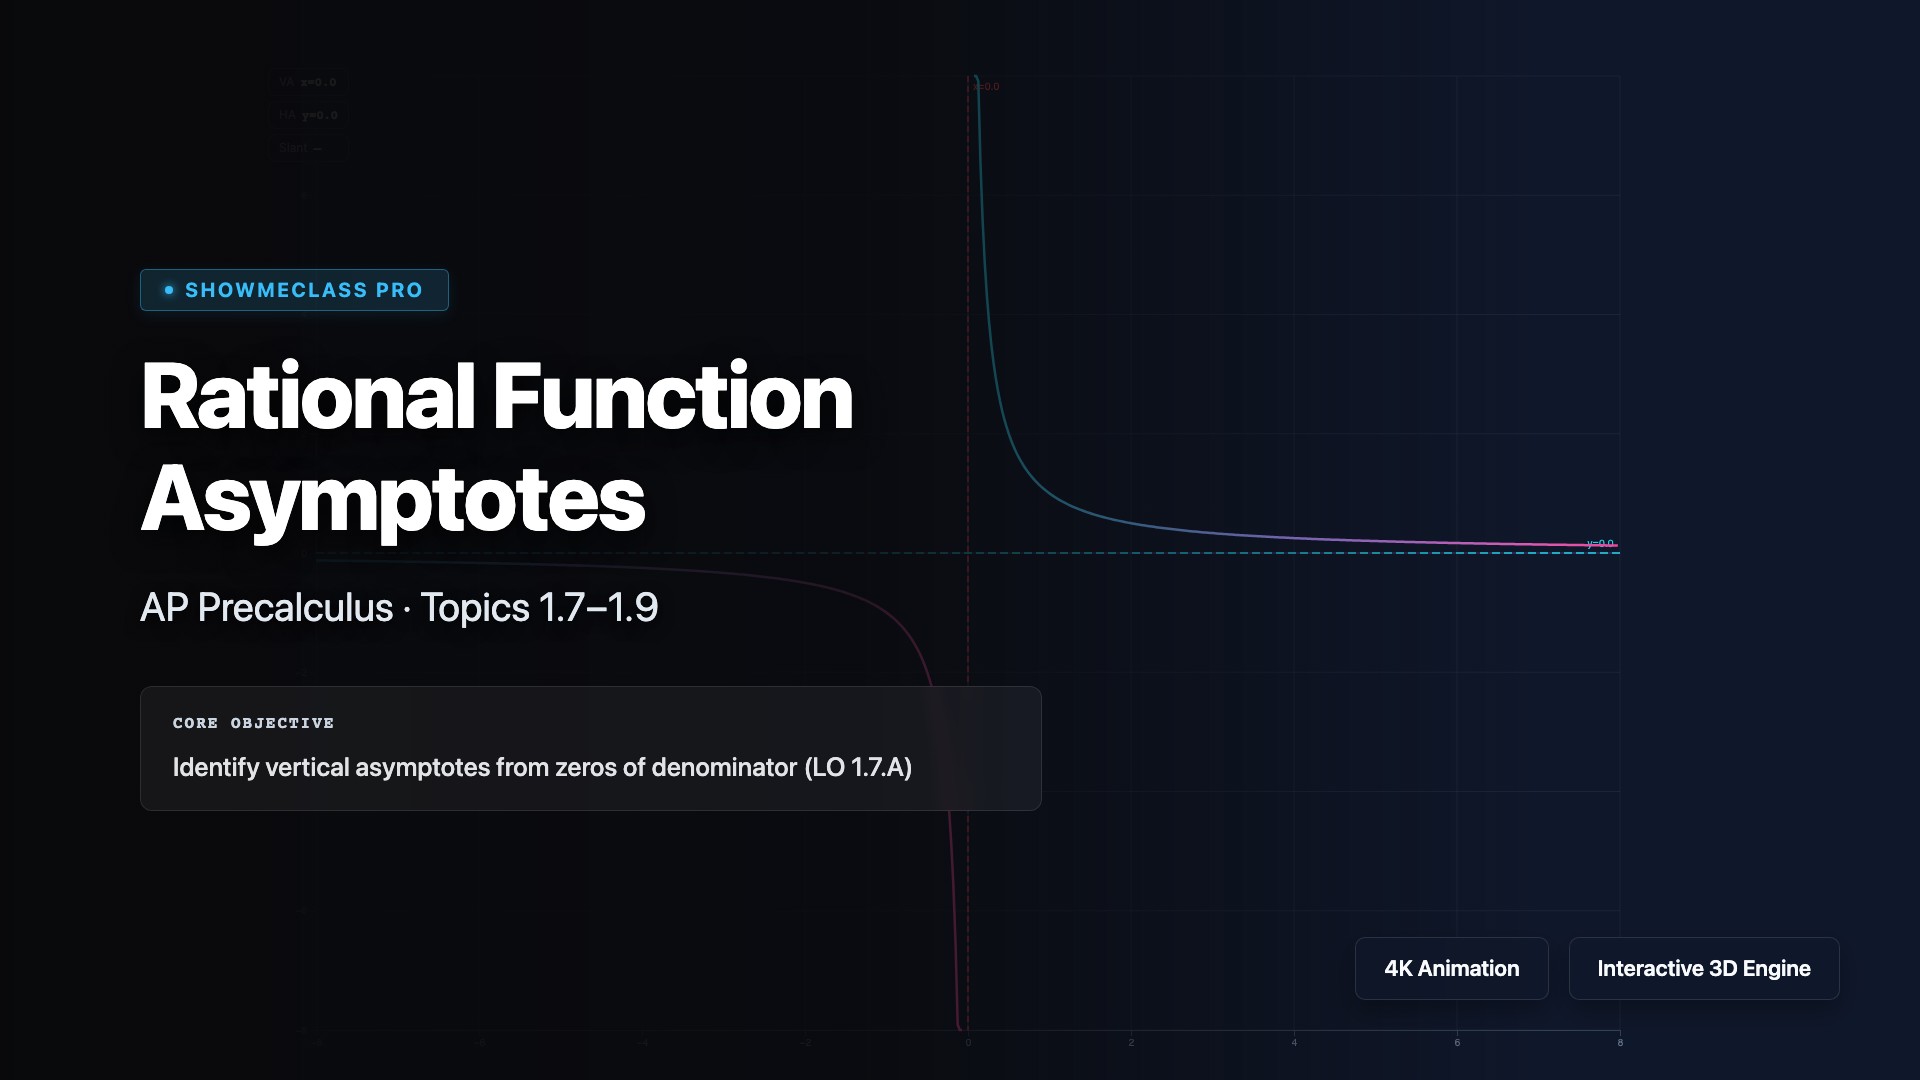
Rational Function Asymptotes
Explore vertical, horizontal, and slant asymptotes of rational functions. Switch between preset functions or enter custom numerator/denominator coefficients to see asymptote detection in real time.
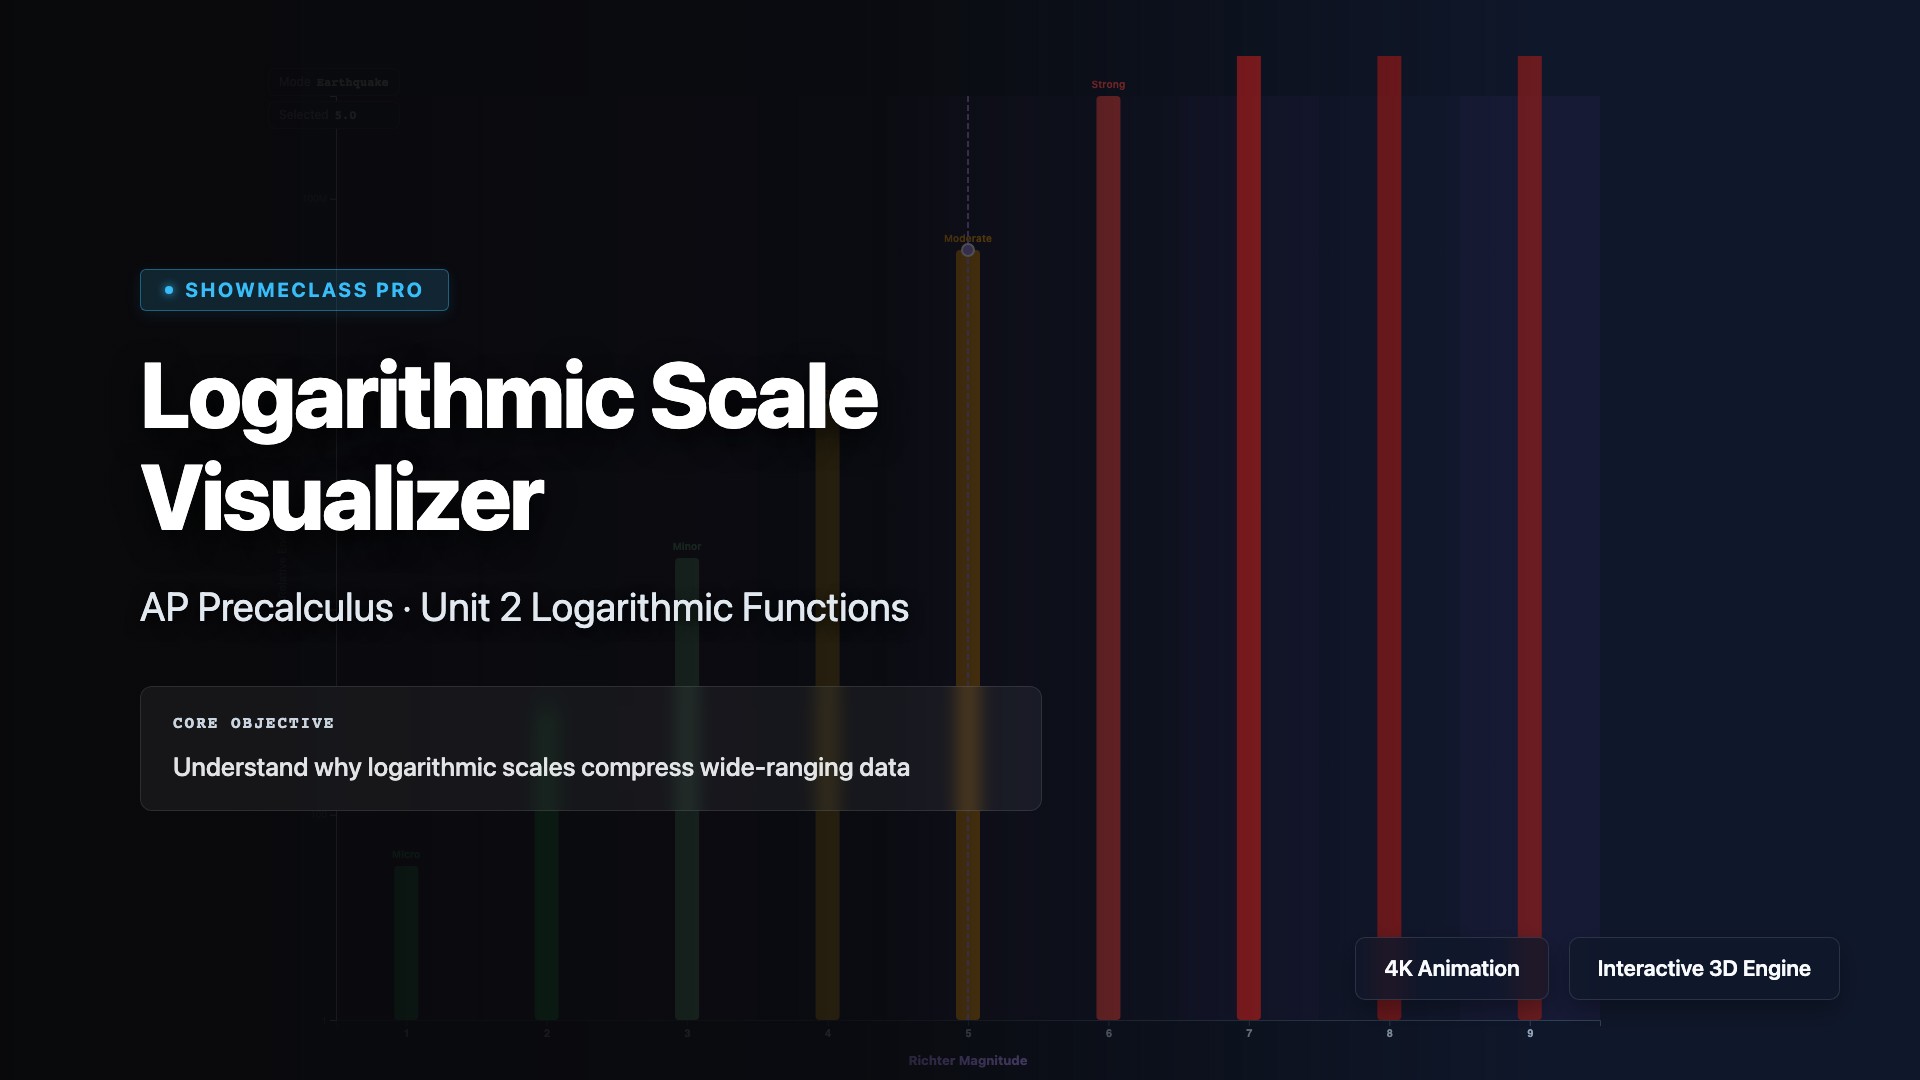
Logarithmic Scale Visualizer
Explore how logarithmic scales compress vast data ranges. Switch between Richter earthquake magnitude, decibel sound levels, and pH acidity scales to see real-world log₁₀ applications.
Trig Identities Verifier
Verify trigonometric identities graphically. Select from Pythagorean, double-angle, cofunction, and reciprocal identities to see LHS and RHS overlaid on the same graph with a difference curve.
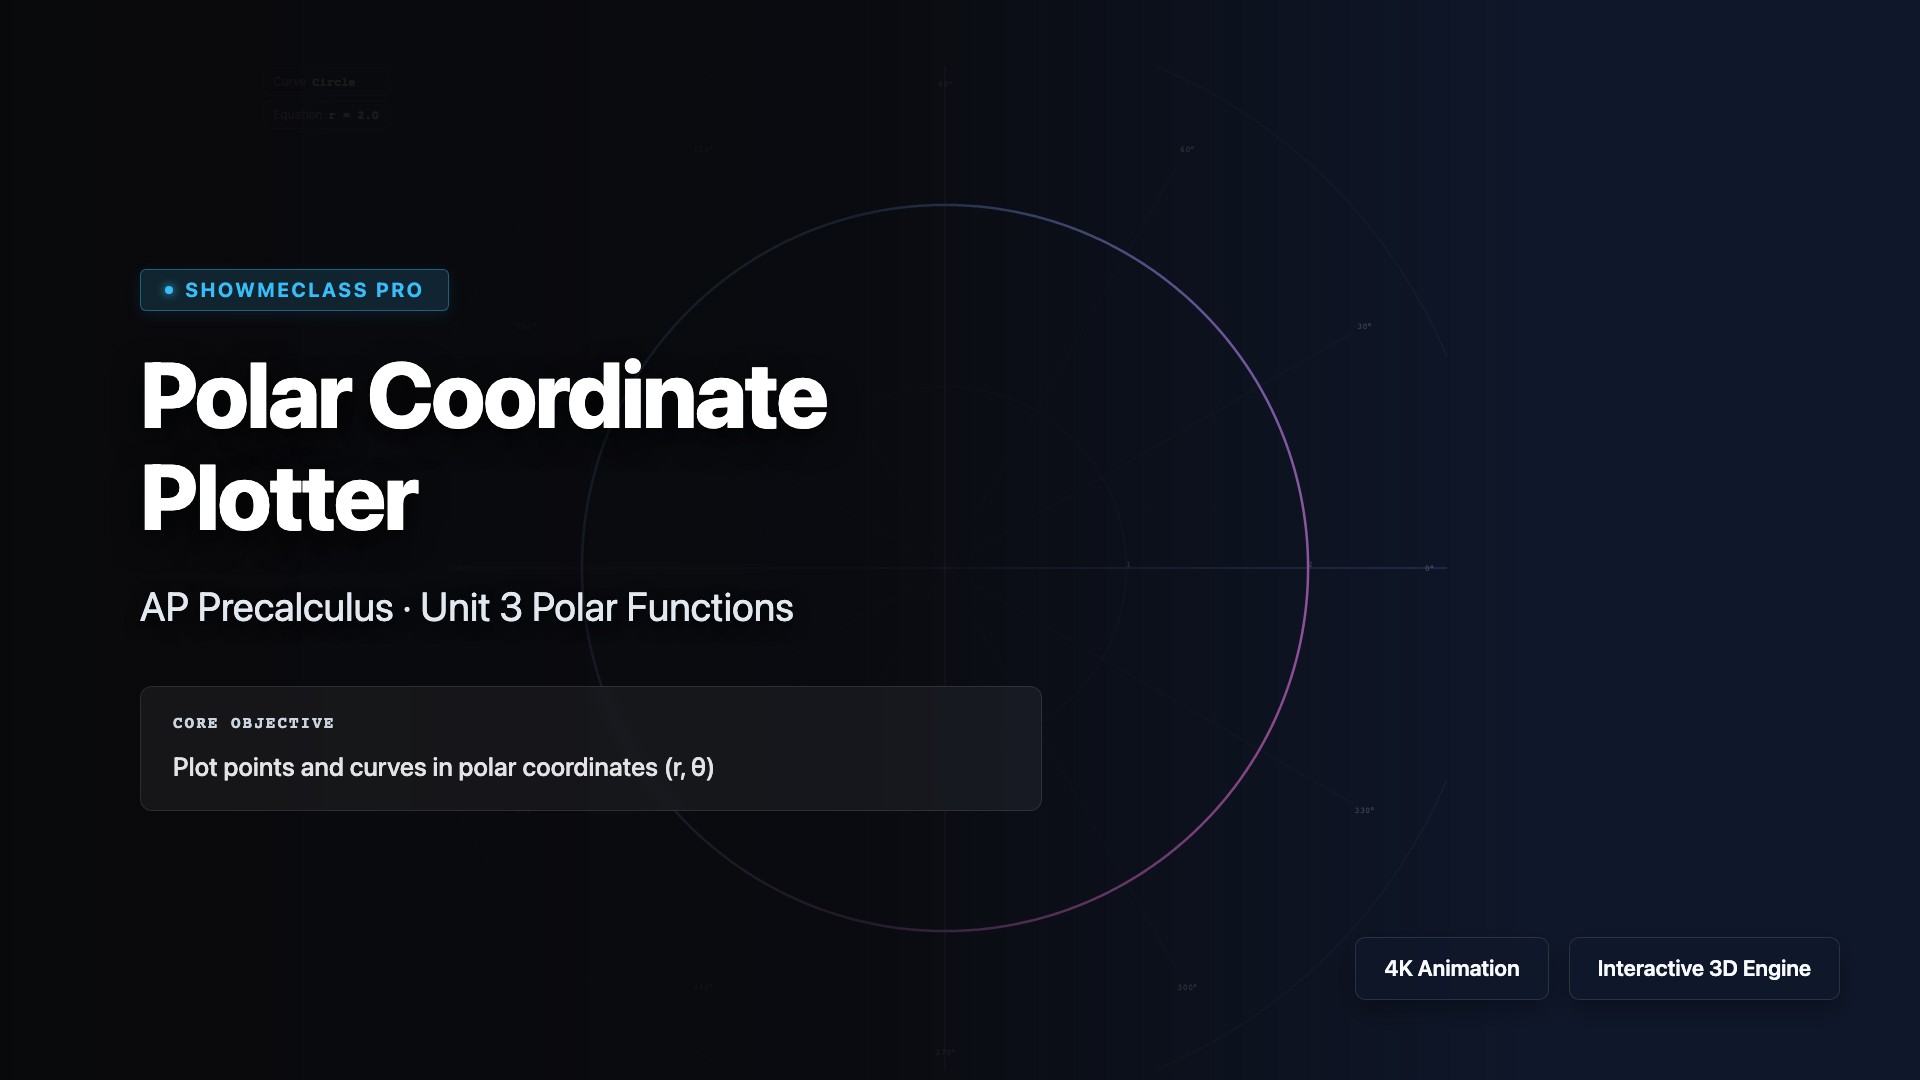
Polar Coordinate Plotter
Plot and explore polar curves interactively. Choose from circles, cardioids, rose curves, spirals, limaçons, lemniscates, and butterfly curves. Adjust parameters and watch animated tracing.
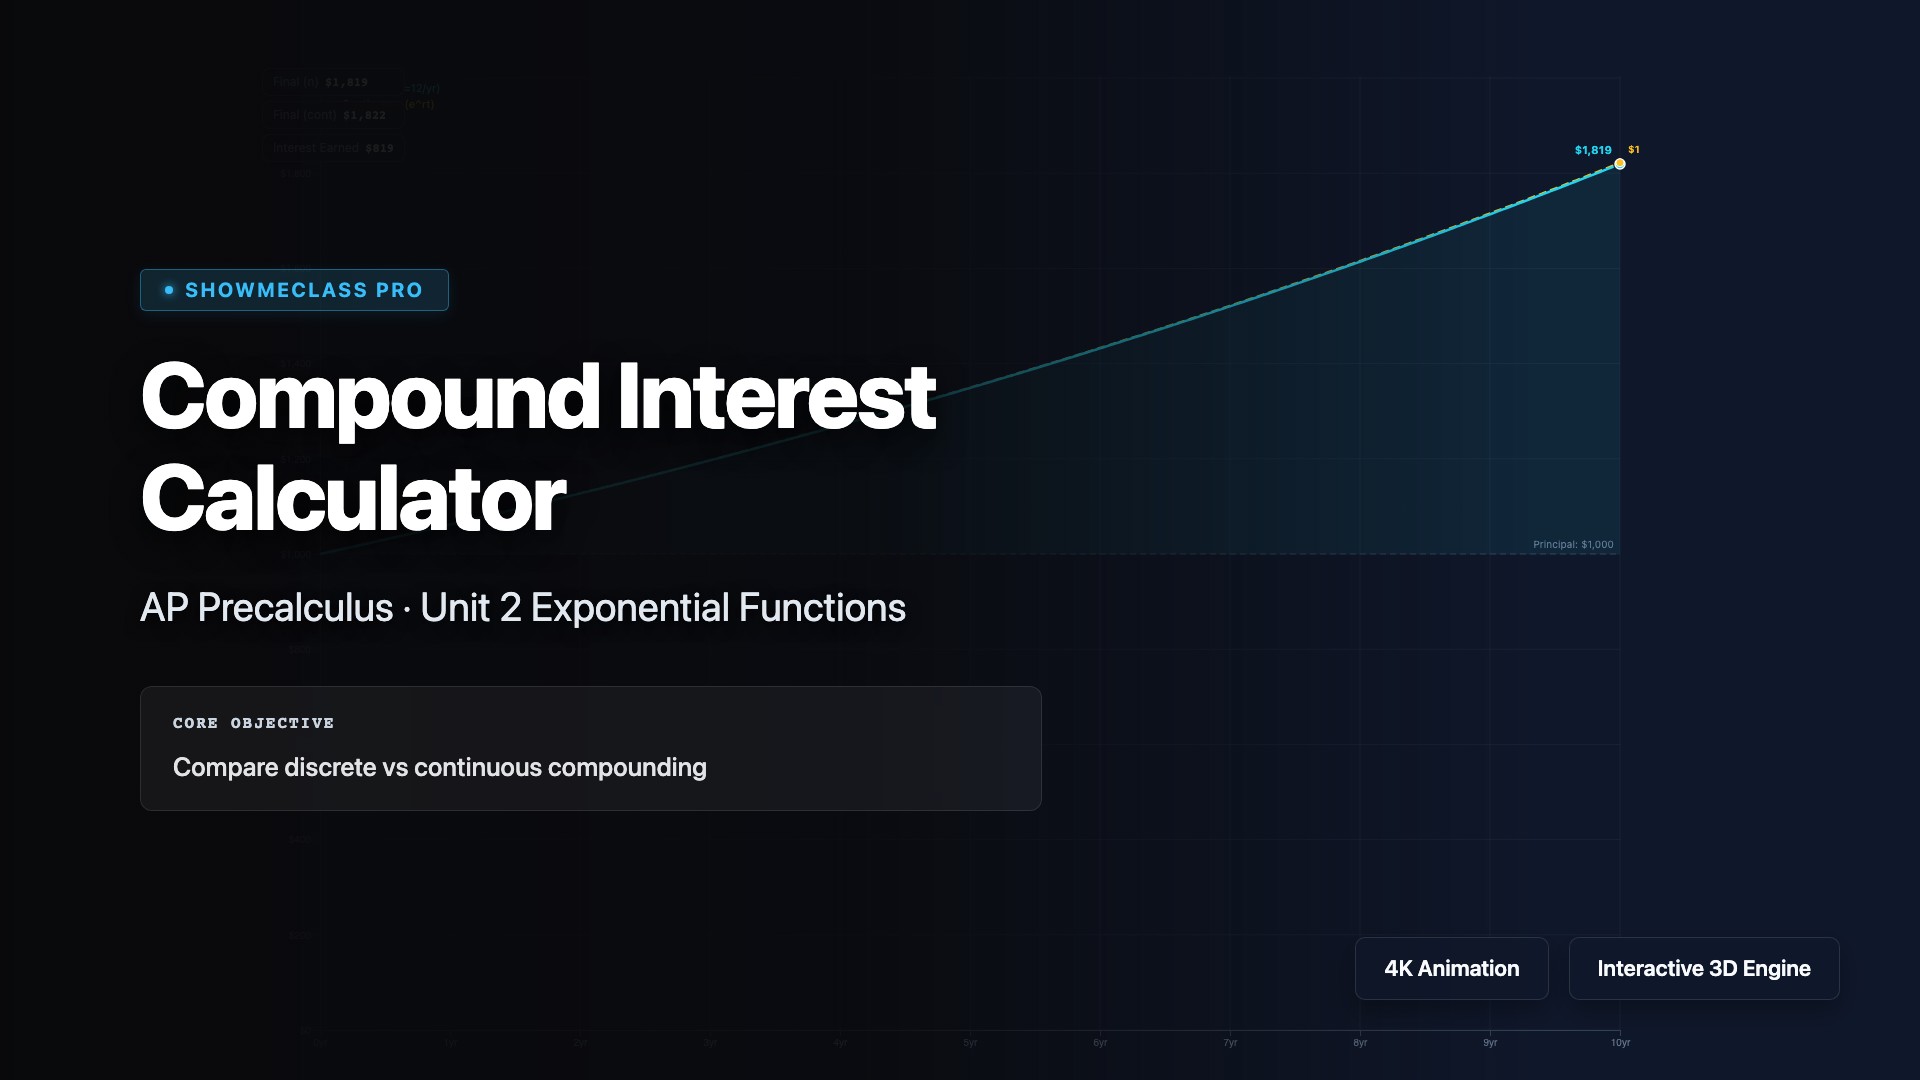
Compound Interest & Continuous Growth
Compare discrete and continuous compound interest. Adjust principal, rate, time, and compounding frequency to see how A = P(1+r/n)^(nt) approaches A = Pe^(rt). Includes the Rule of 72.
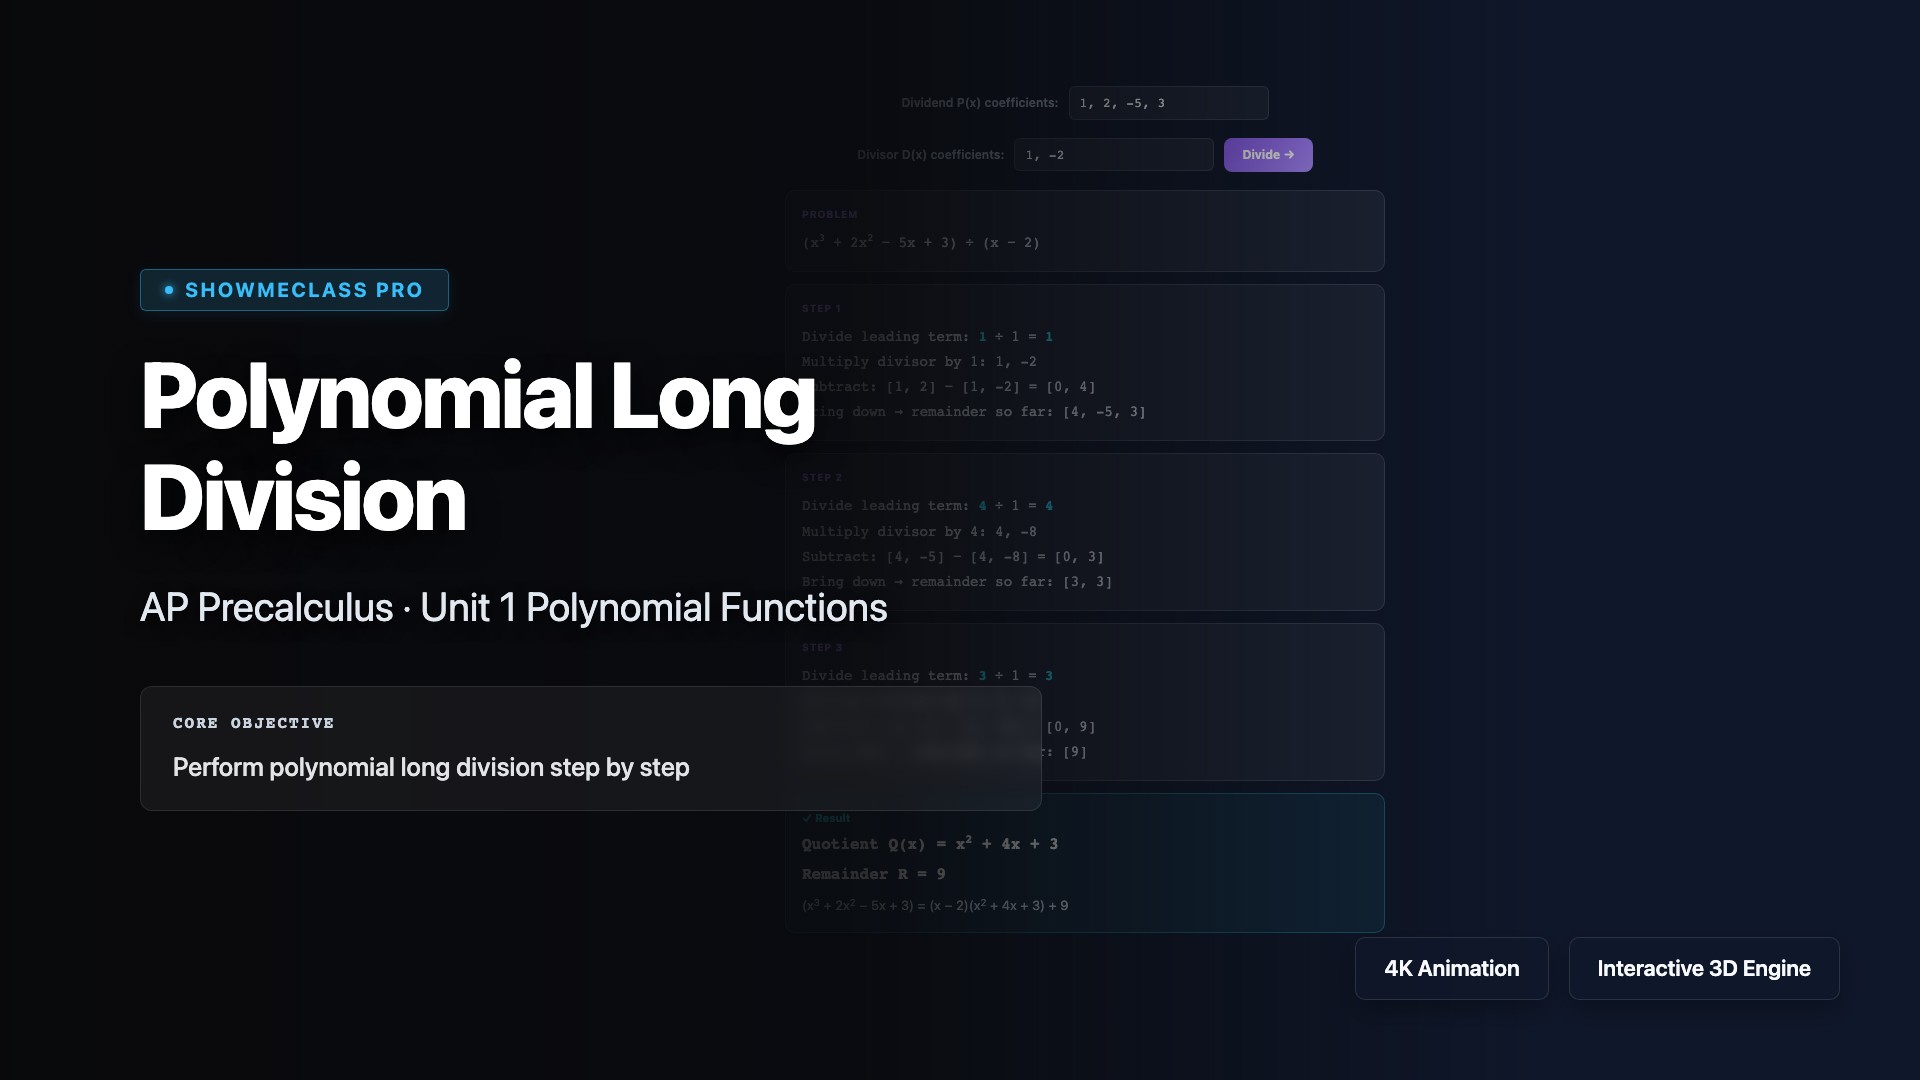
Polynomial Long Division & Remainder
Step-by-step polynomial long division solver. Enter dividend and divisor coefficients to see each division, multiplication, and subtraction step with quotient and remainder.
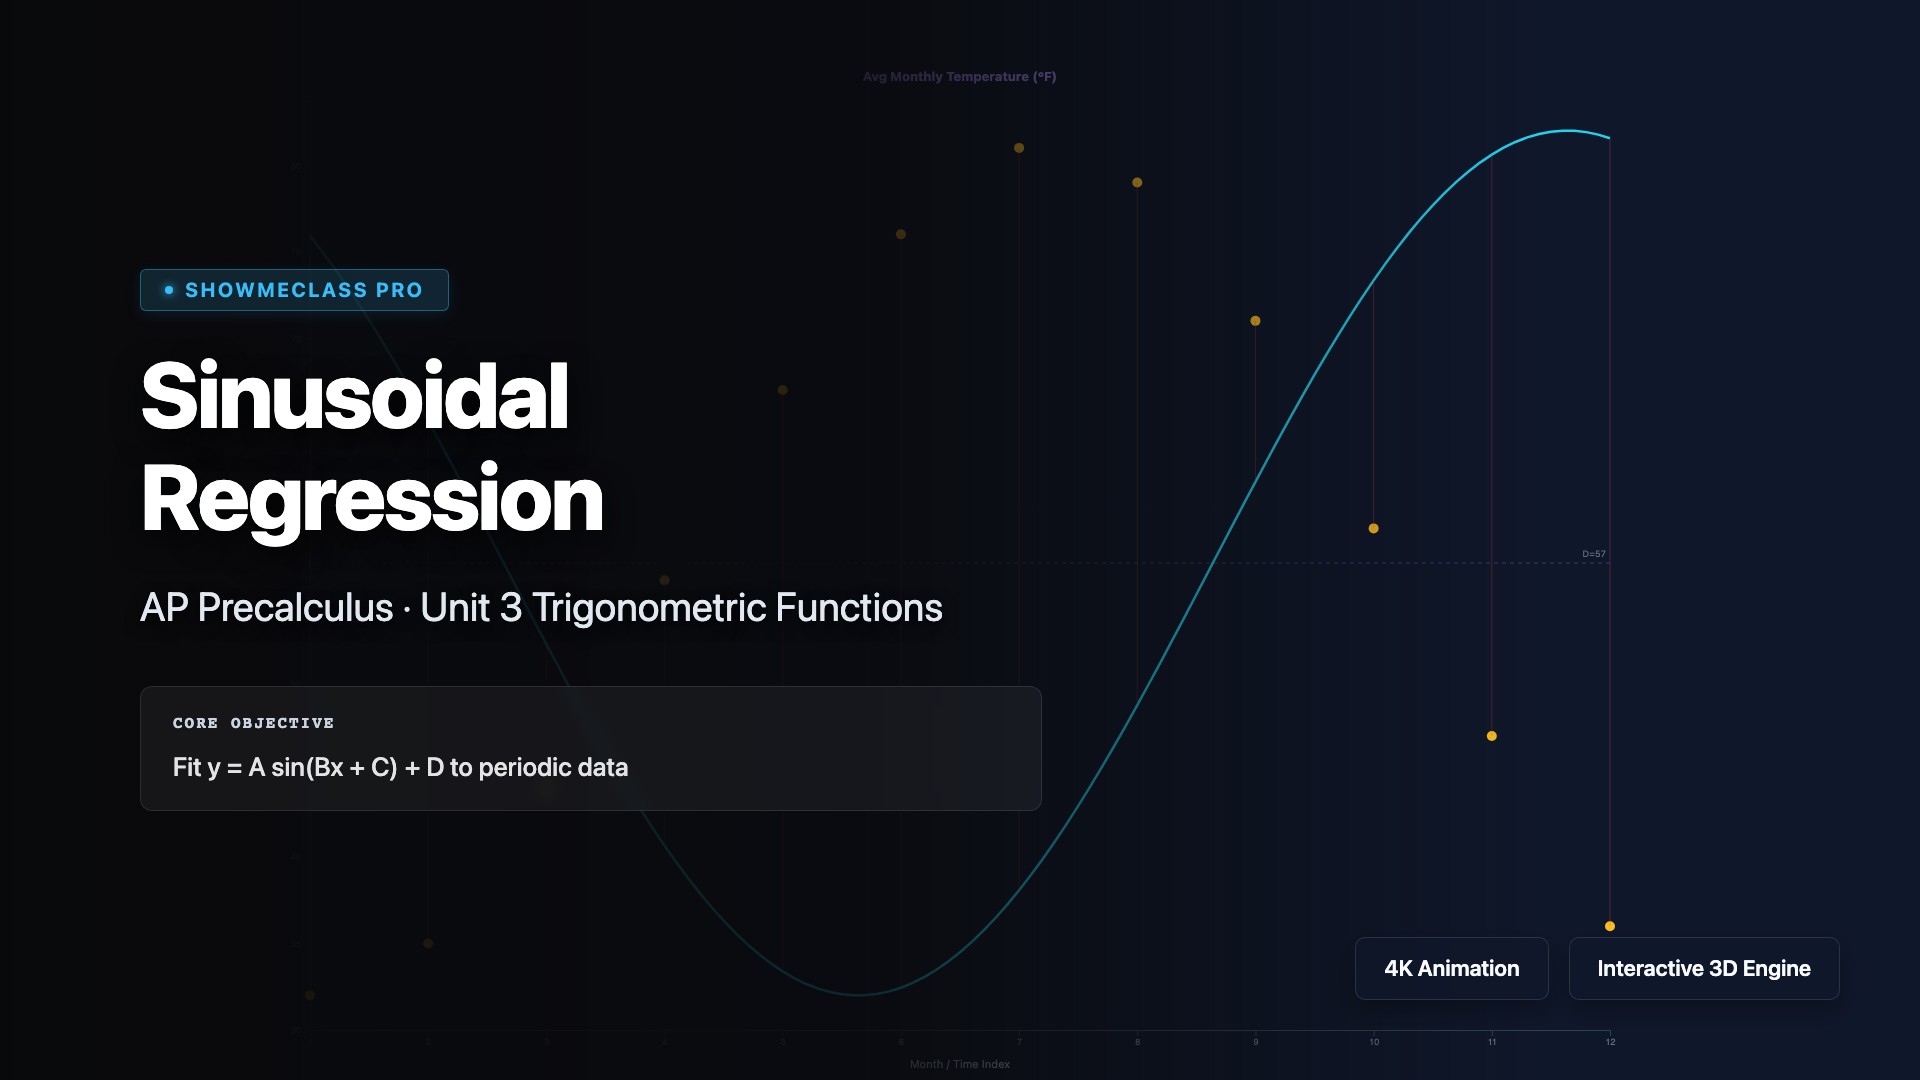
Sinusoidal Regression (Real Data)
Fit y = A sin(Bx + C) + D to periodic real-world data. Adjust amplitude, period, phase, and vertical shift with temperature, daylight, and tides presets.
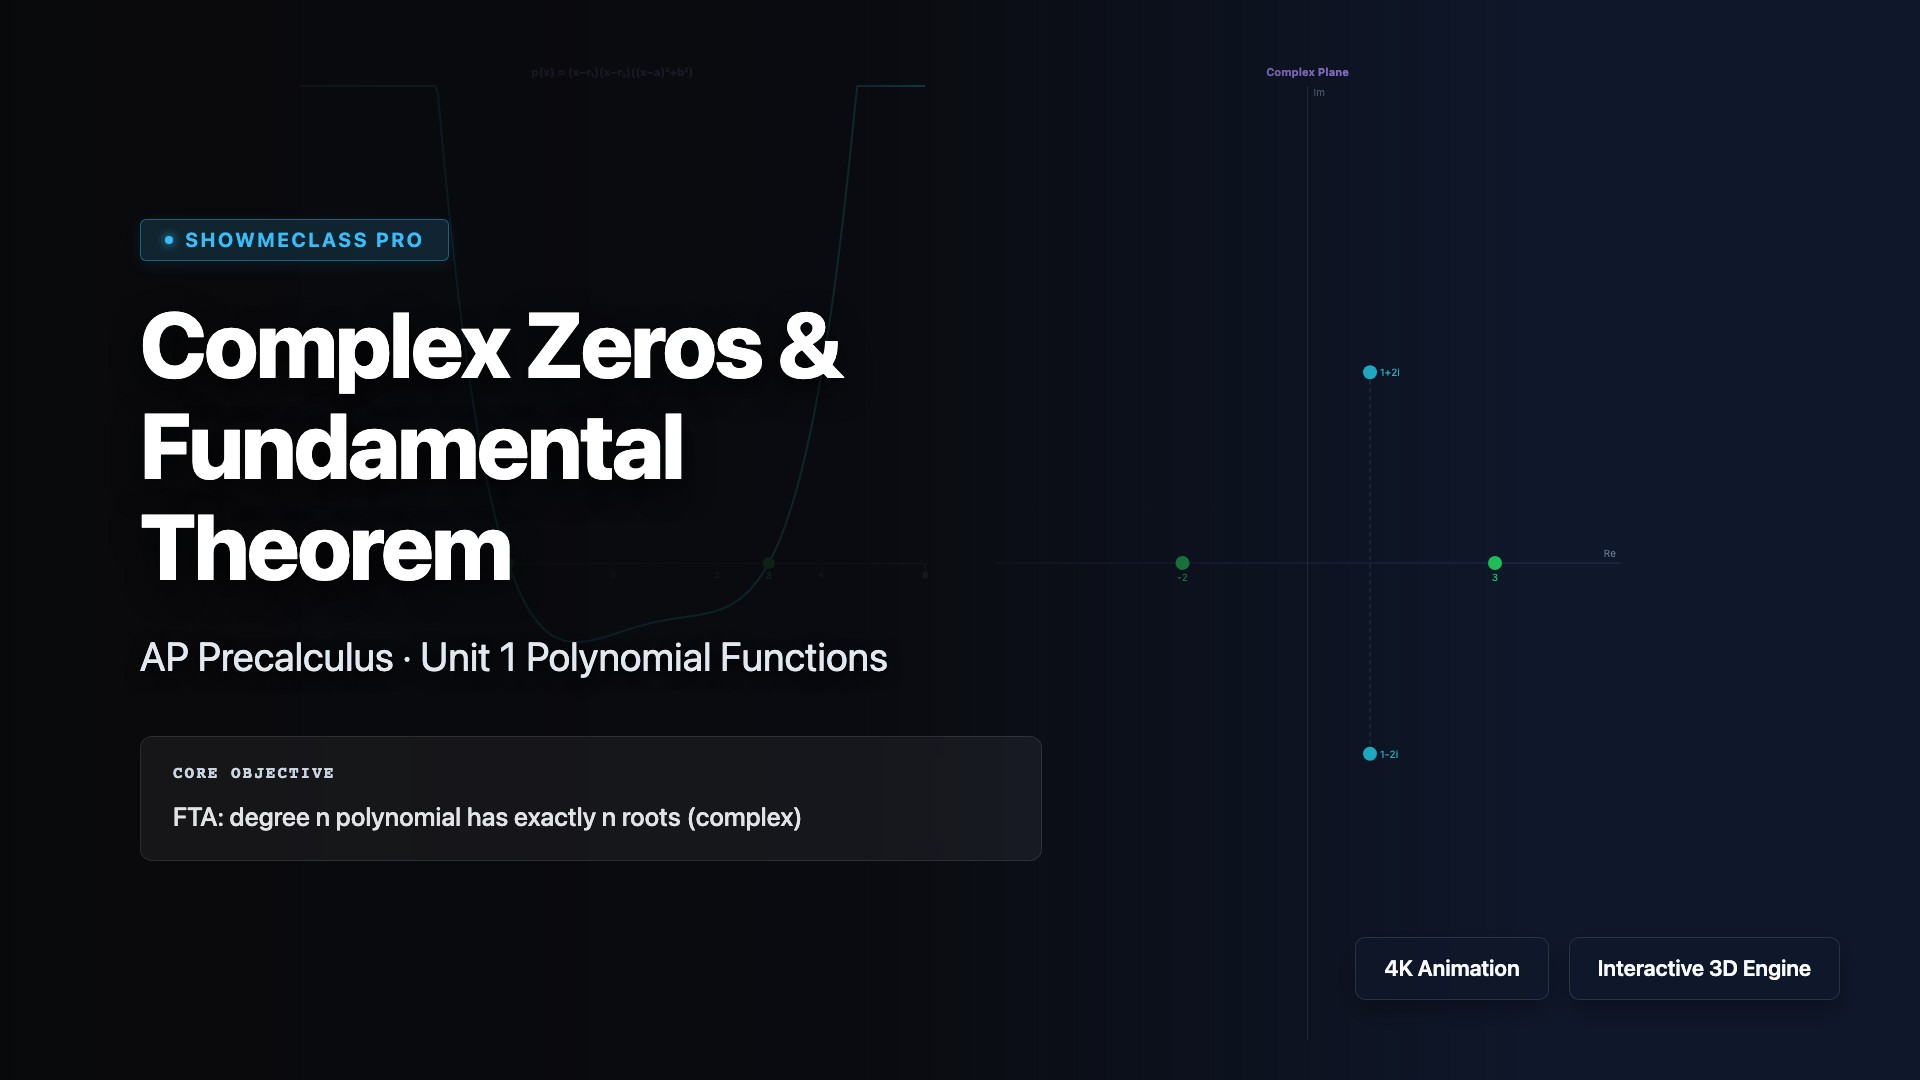
Complex Zeros & Fundamental Theorem
Visualize all roots of a degree-4 polynomial on both the real graph and complex plane. See conjugate pairs, adjust real and complex roots dynamically.
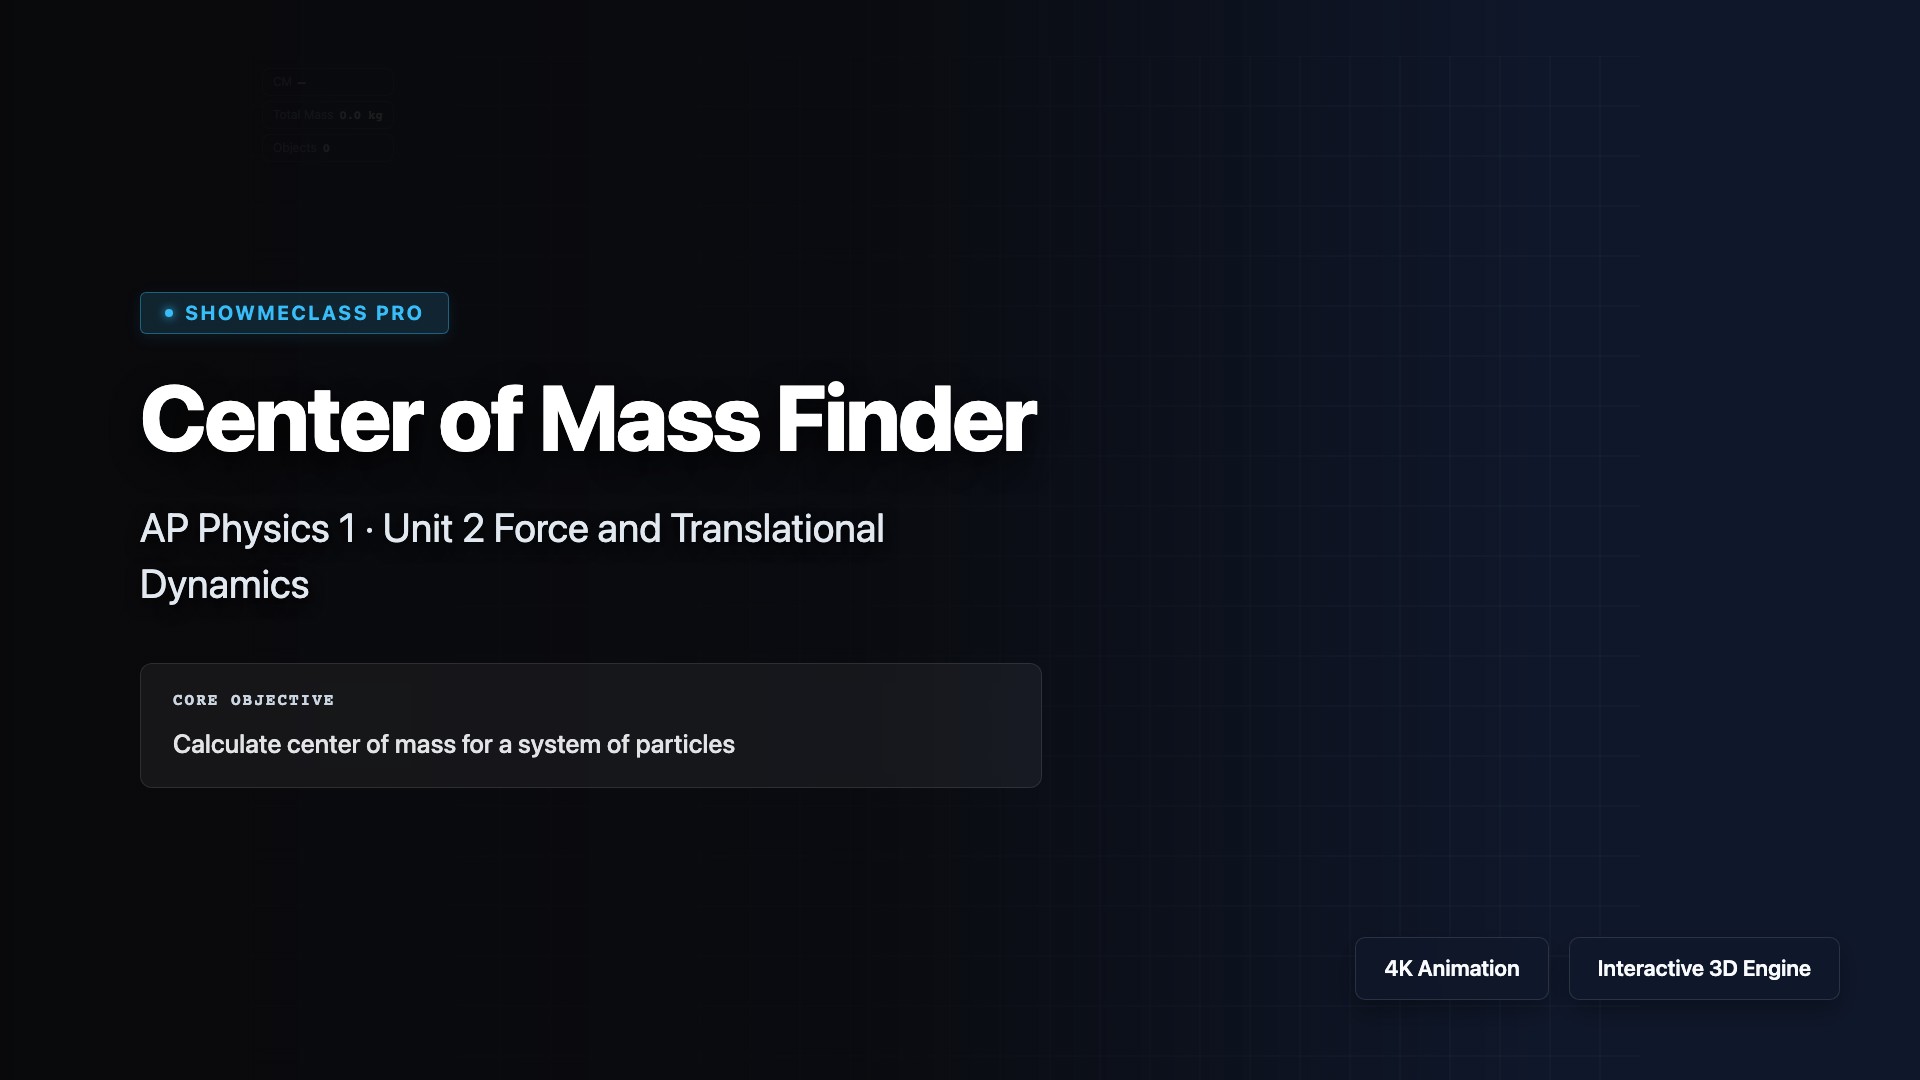
Center of Mass Finder
Place and drag masses on a 2D canvas to calculate the center of mass in real time. Visualize how mass distribution affects the balance point of a system of particles.

Momentum & Impulse Lab
Simulate elastic and perfectly inelastic collisions. Adjust masses and velocities to verify conservation of momentum and compare kinetic energy before and after impact.
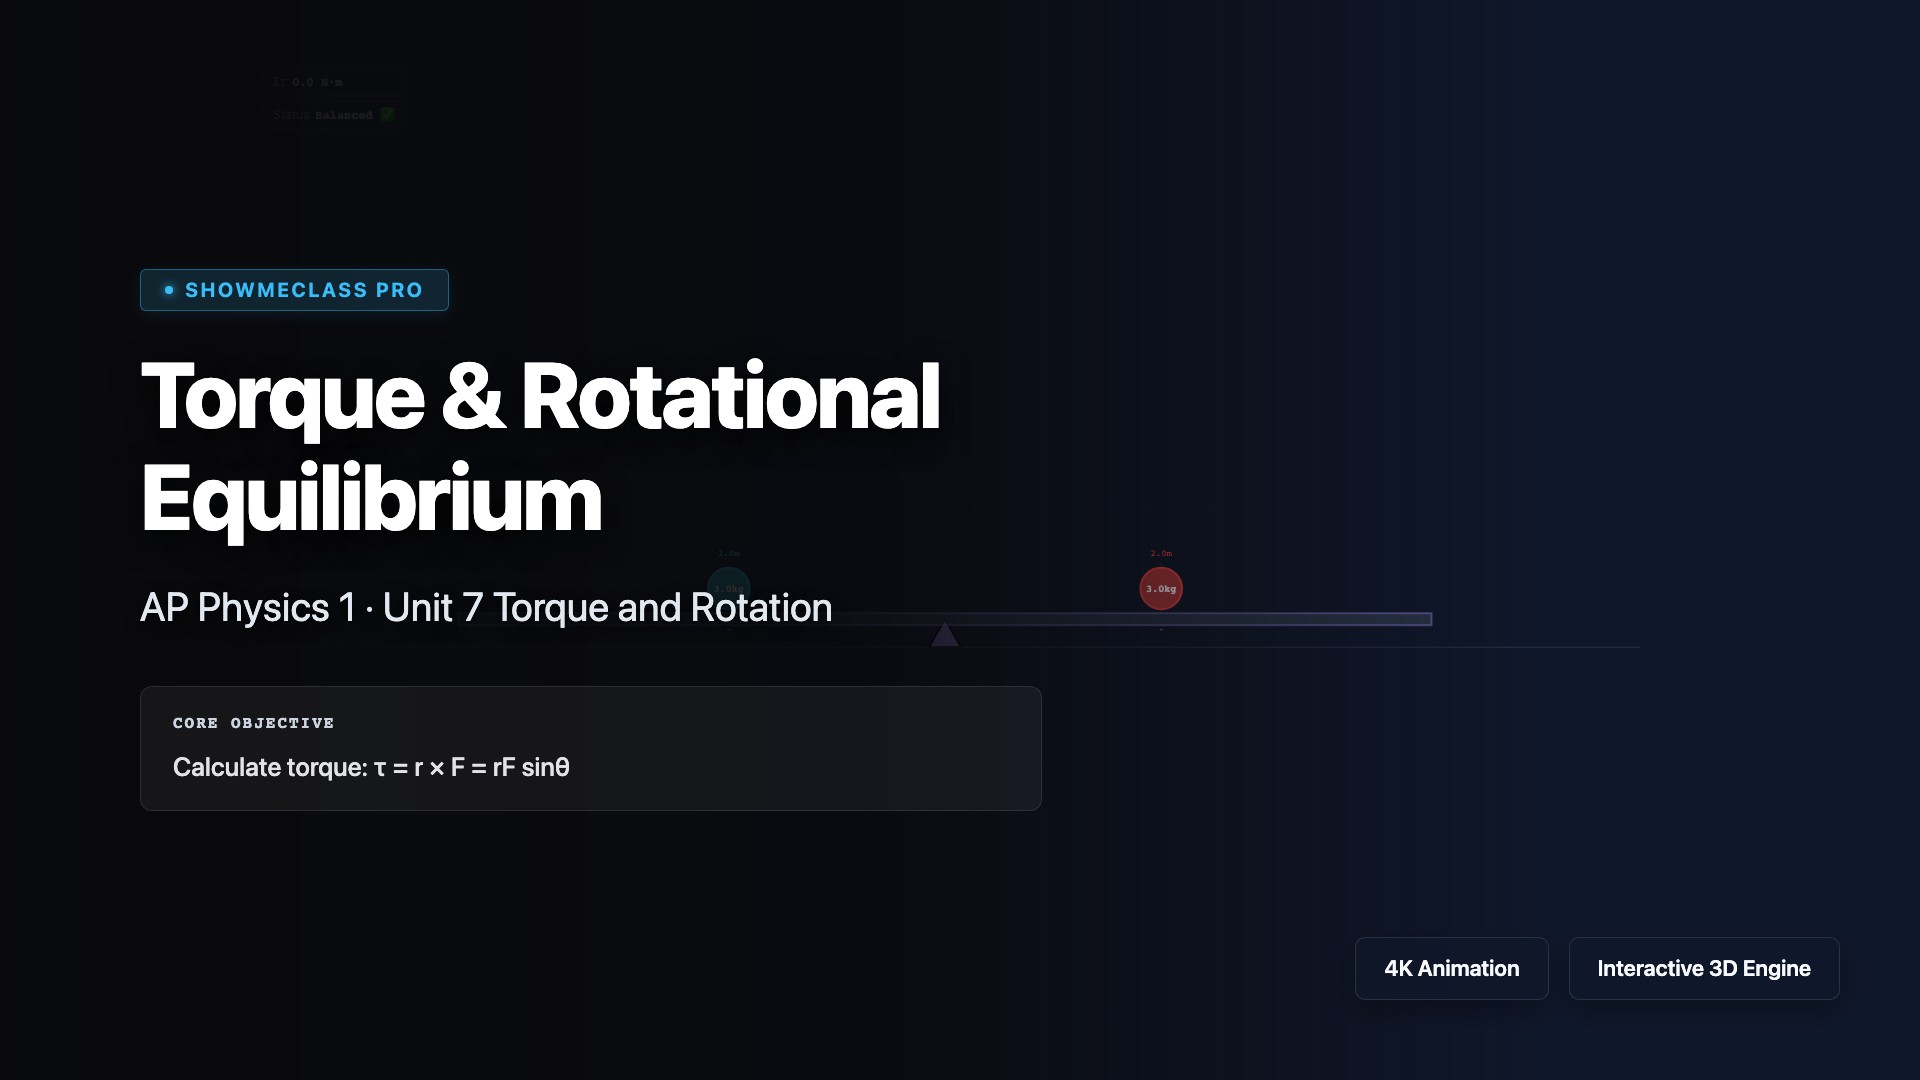
Torque & Rotational Equilibrium
Balance a beam by adjusting masses, distances, and pivot point. Visualize clockwise and counterclockwise torques and observe rotational equilibrium conditions in real time.
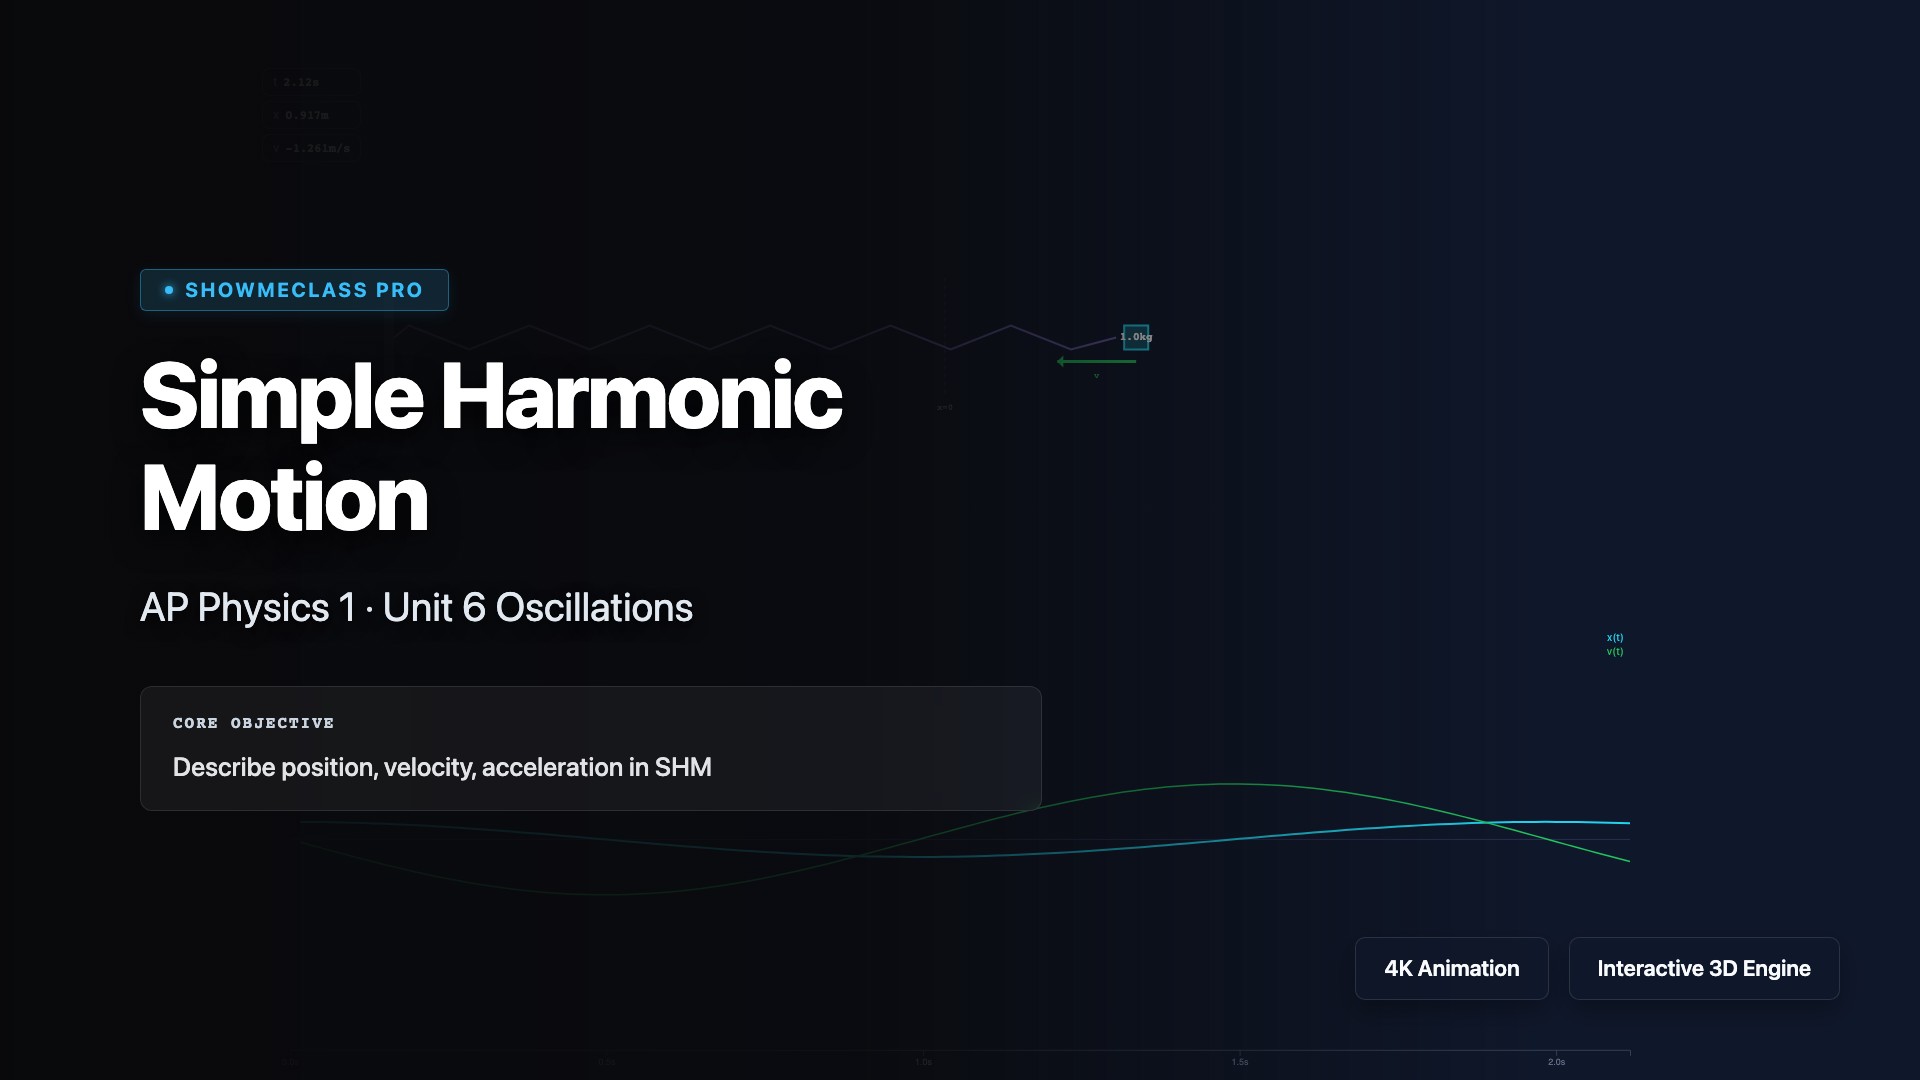
Simple Harmonic Motion Explorer
Animate a spring-mass system in SHM with real-time x(t), v(t), a(t) graphs. Adjust amplitude, mass, and spring constant to see how period, frequency, and energy change.