Showing 12 results
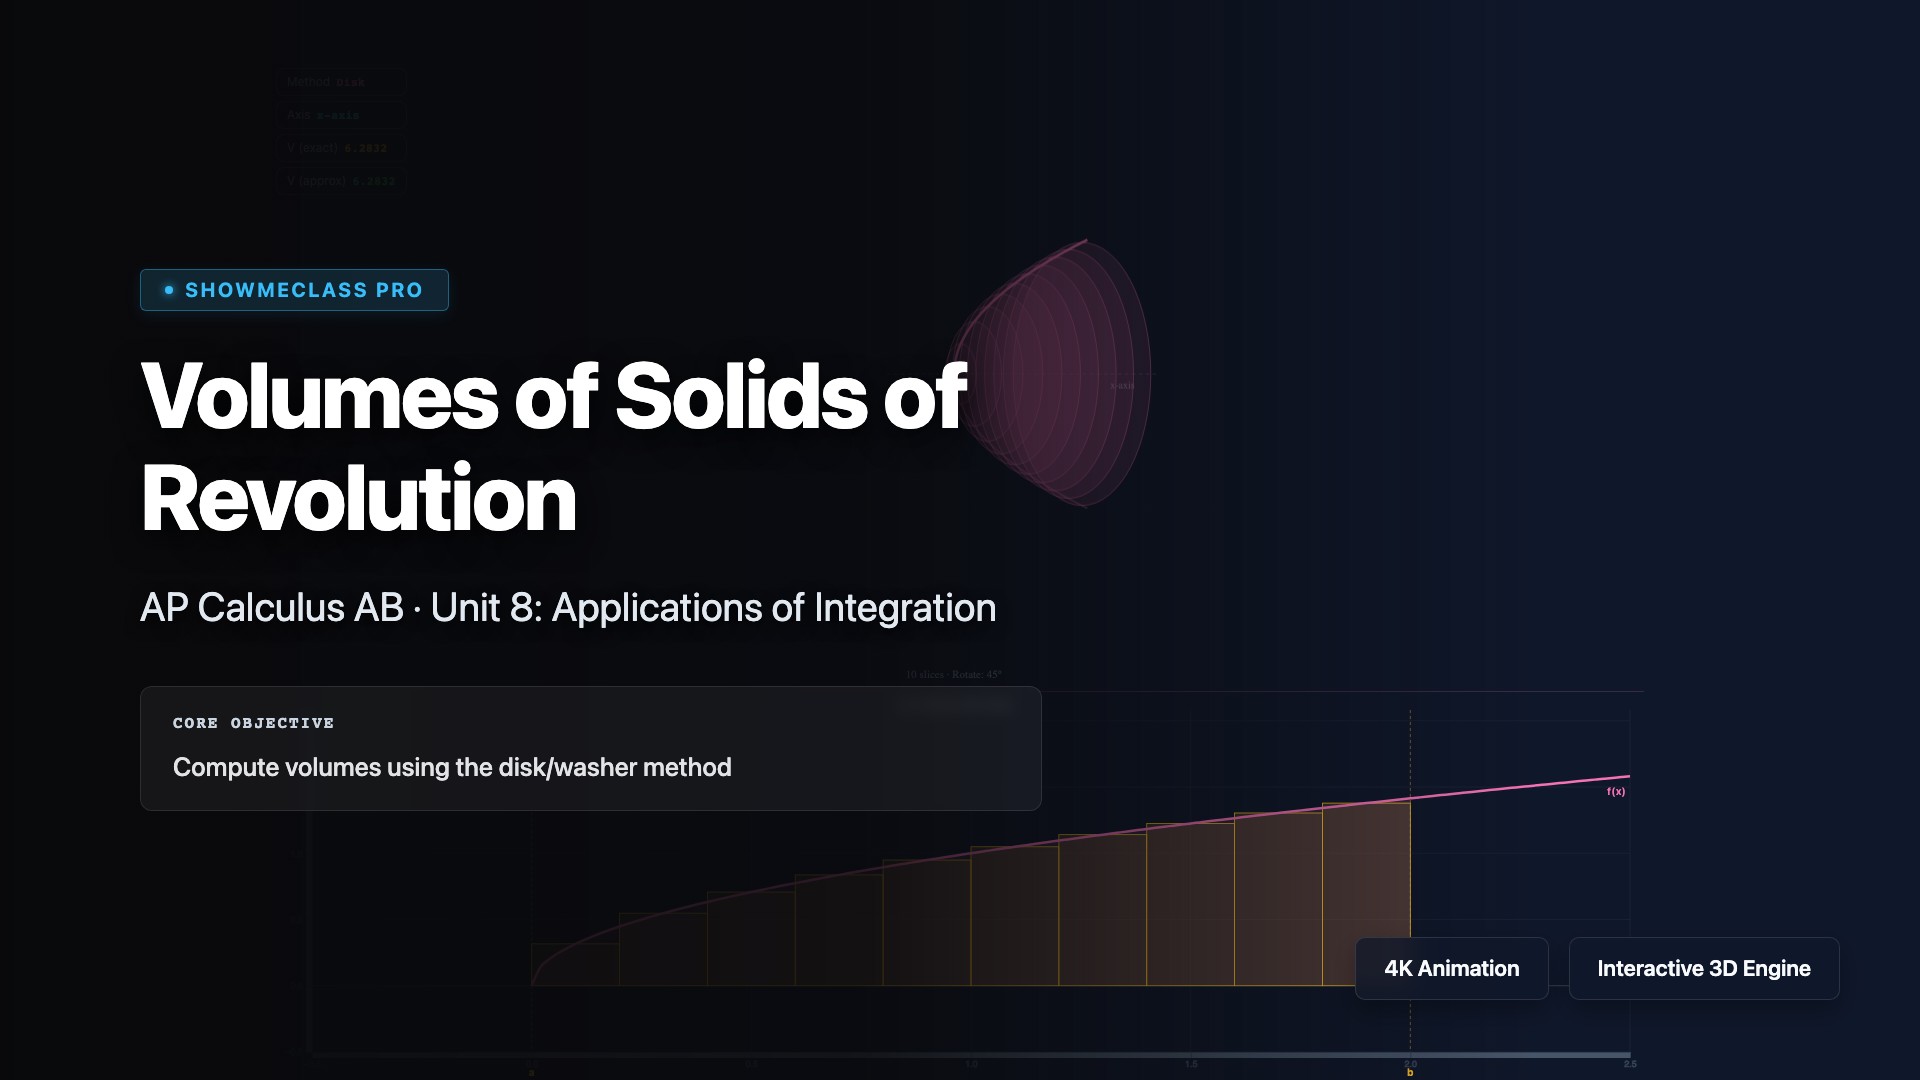
Volumes of Solids of Revolution
Calculate volumes of three-dimensional solids formed by rotating regions around axes using disk, washer, and shell methods. Visualize the disk method V = π∫[a to b] [R(x)]²dx for solids without holes, the washer method V = π∫[a to b] ([R(x)]² - [r(x)]²)dx for solids with holes, and the shell method V = 2π∫[a to b] x·h(x)dx for rotation around vertical axes. Master choosing the most efficient method for each problem.
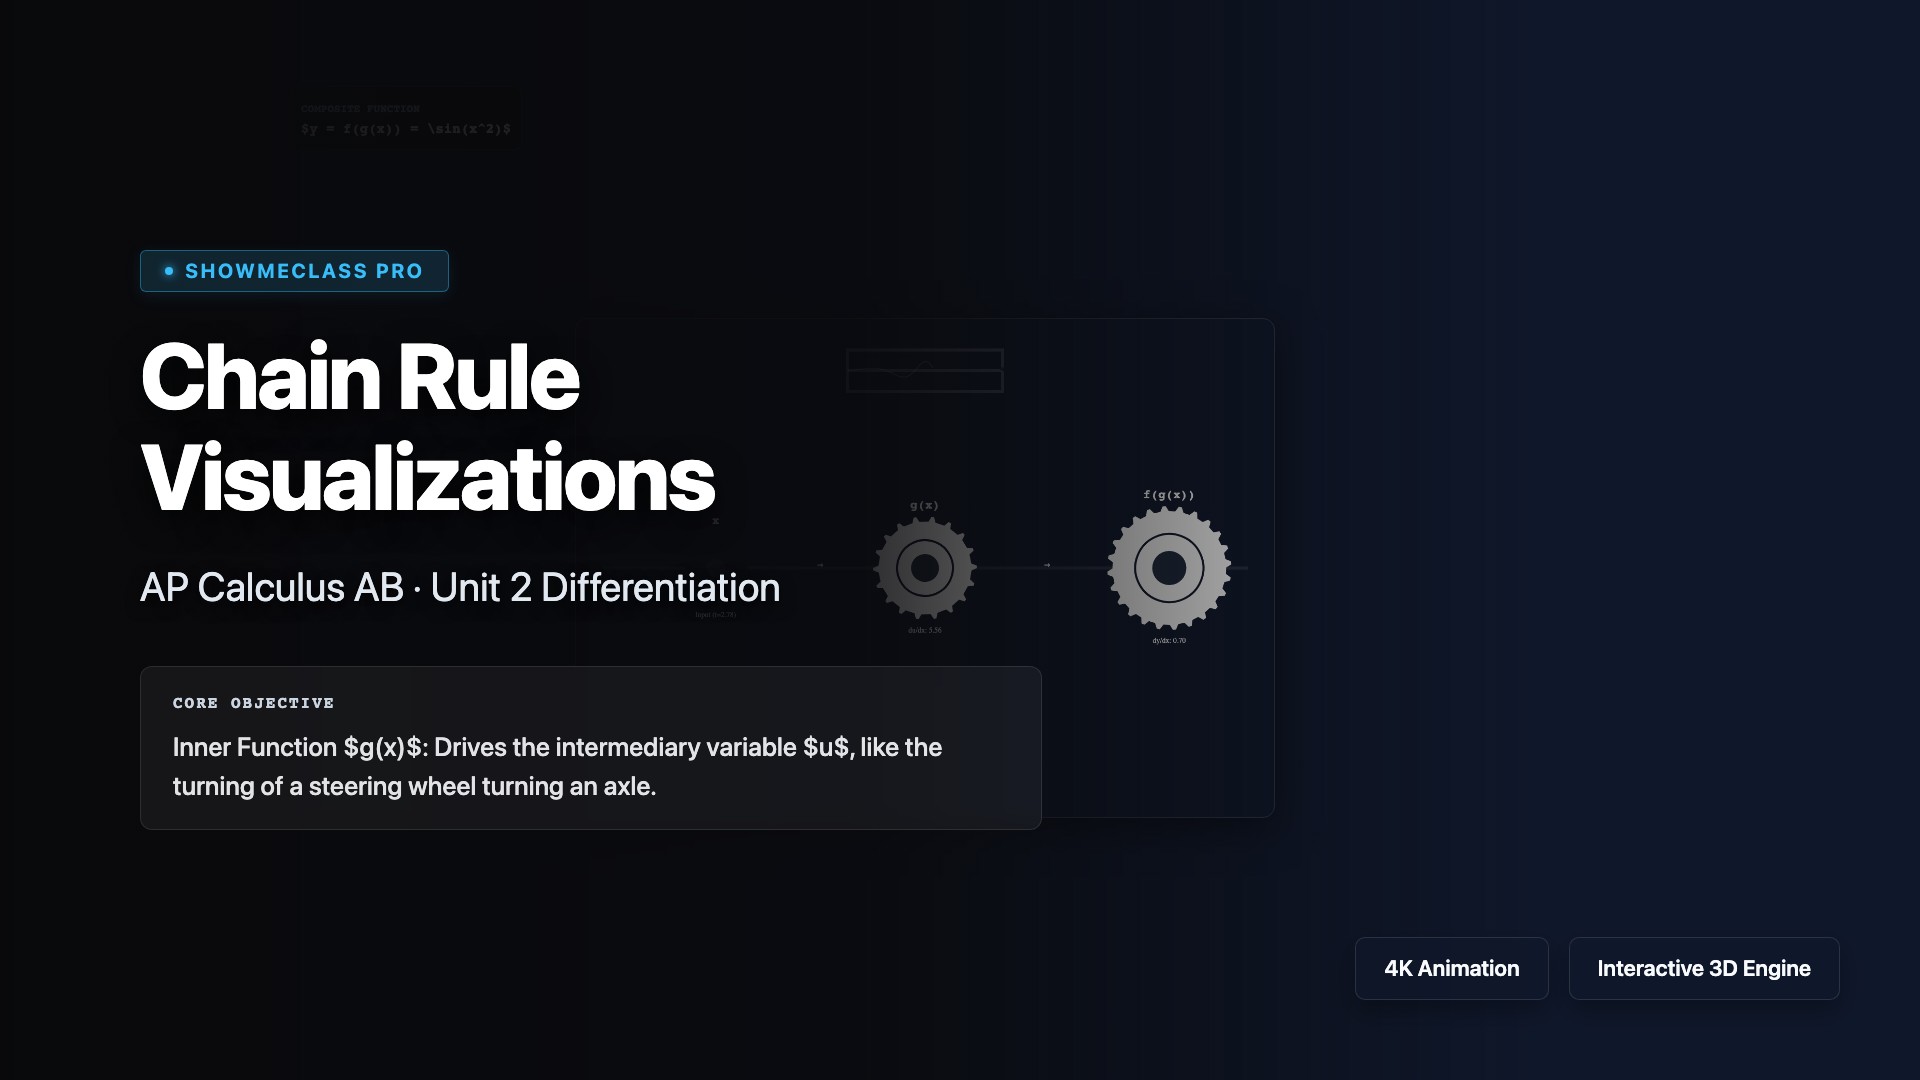
Chain Rule Visualizations
Mechanical gear visualization translating the abstract composite derivative multiplication f'(g(x)) * g'(x) into physical rotational interlocking.
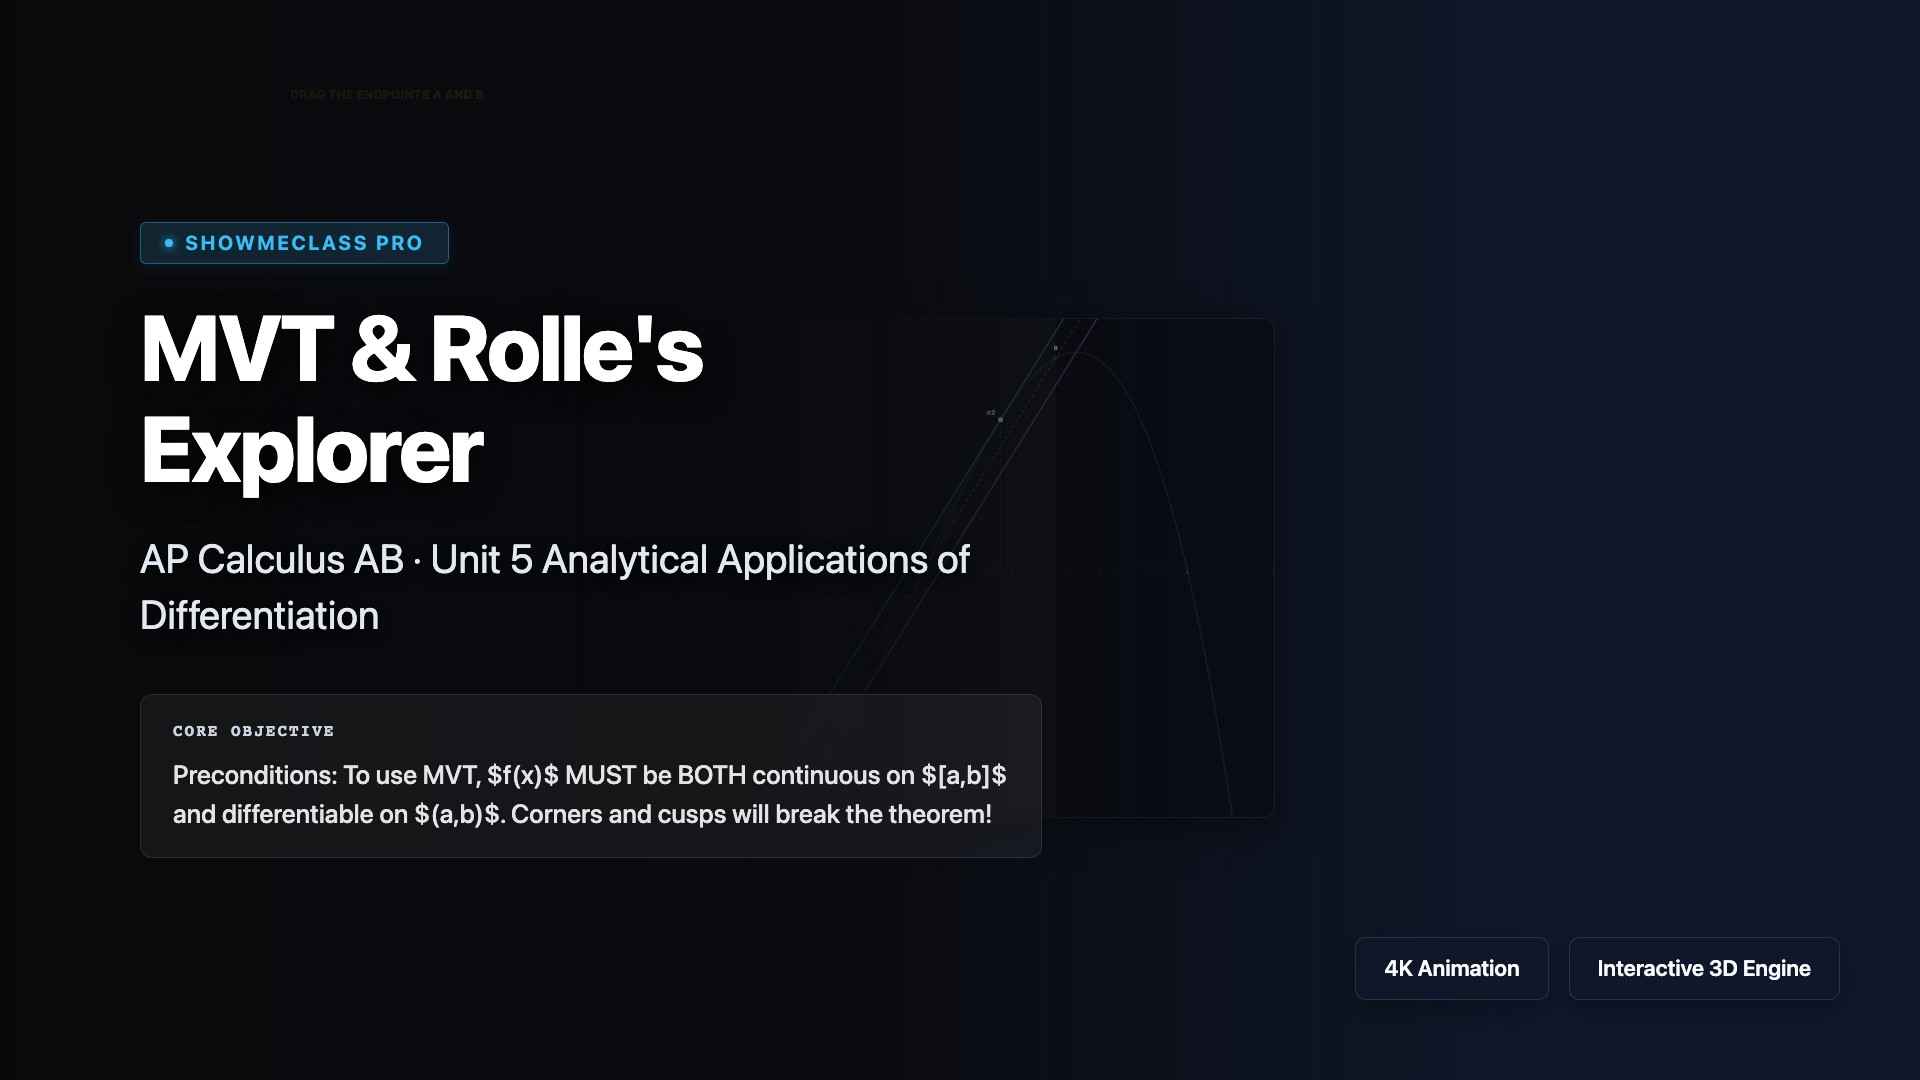
MVT & Rolle's Explorer
MVT interactive module letting users sweep endpoints to compute the secant, subsequently automatically identifying all internal $c$ points where tangent perfectly parallels secant. Built with Rolle's edge case and cusp logic breakers.
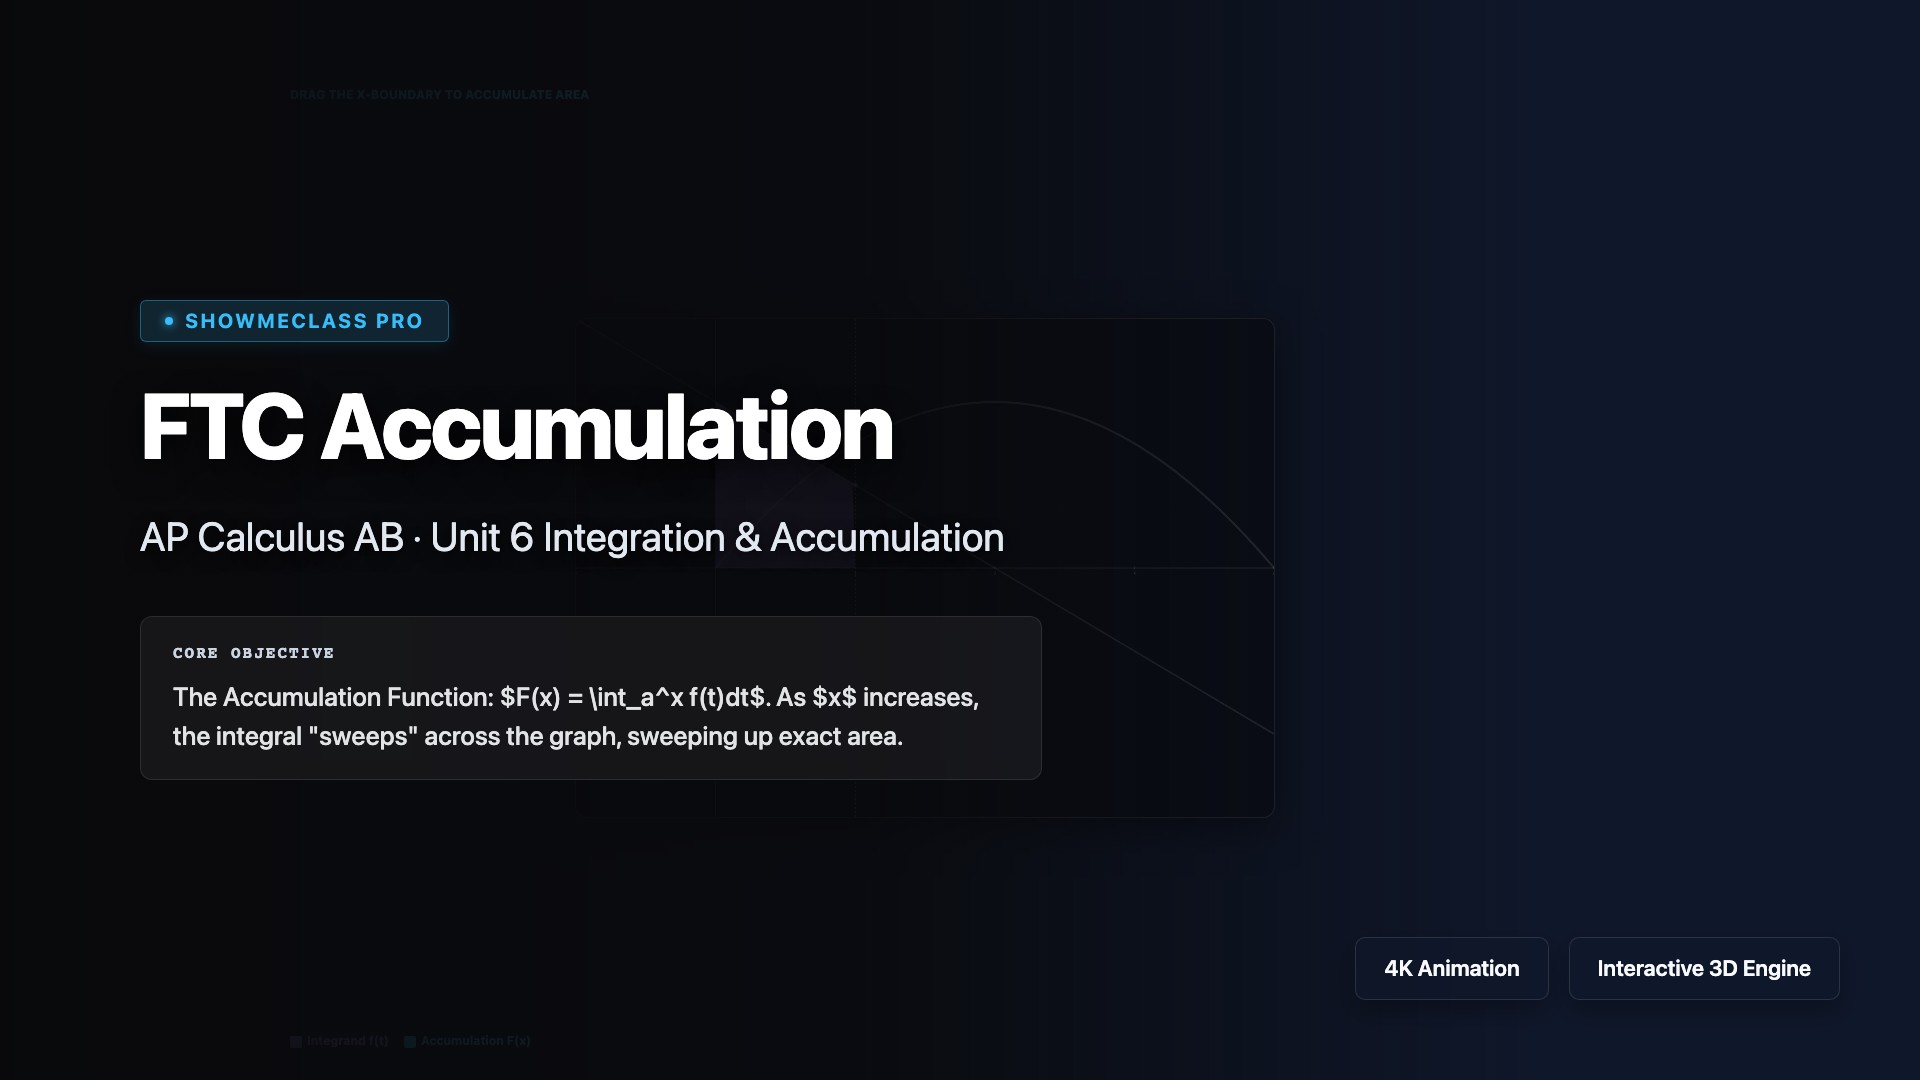
FTC Accumulation
Fundamental Theorem of Calculus visually represented. Sweeps across $f(t)$ bounds bridging dynamic differential area accumulation natively into the $F(x)$ graphing engine.
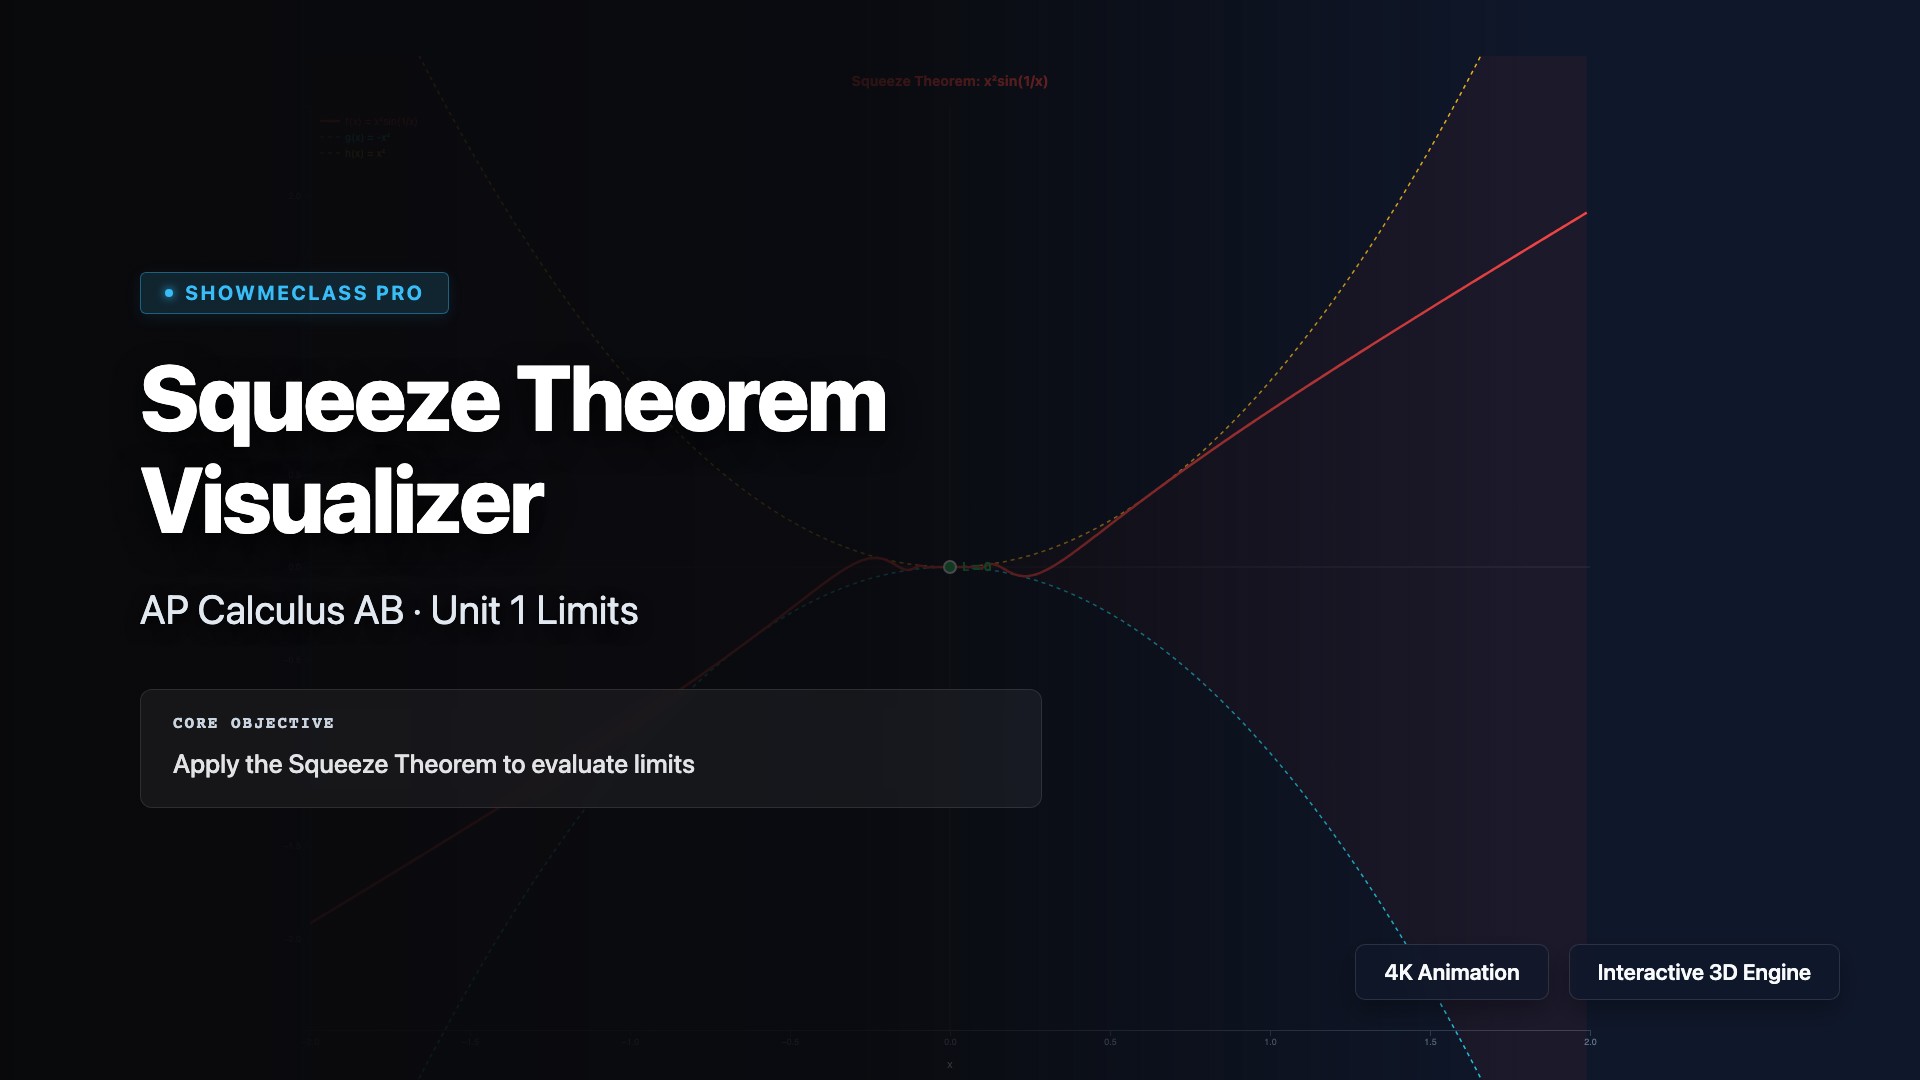
Squeeze Theorem Visualizer
Interactive visualization of the Squeeze Theorem with 4 classic examples (x²sin(1/x), sin(x)/x, x·cos(1/x), (1−cos x)/x²). Shows bounding functions g(x) ≤ f(x) ≤ h(x) with shaded squeeze region. Adjustable zoom and convergence to limit point.

Concavity & Inflection Points
Interactive concavity analysis showing f(x), f′(x), and f″(x) simultaneously for 4 functions. Concavity shading (green=up, red=down), inflection point markers, and movable cursor with real-time derivative values and concavity classification.
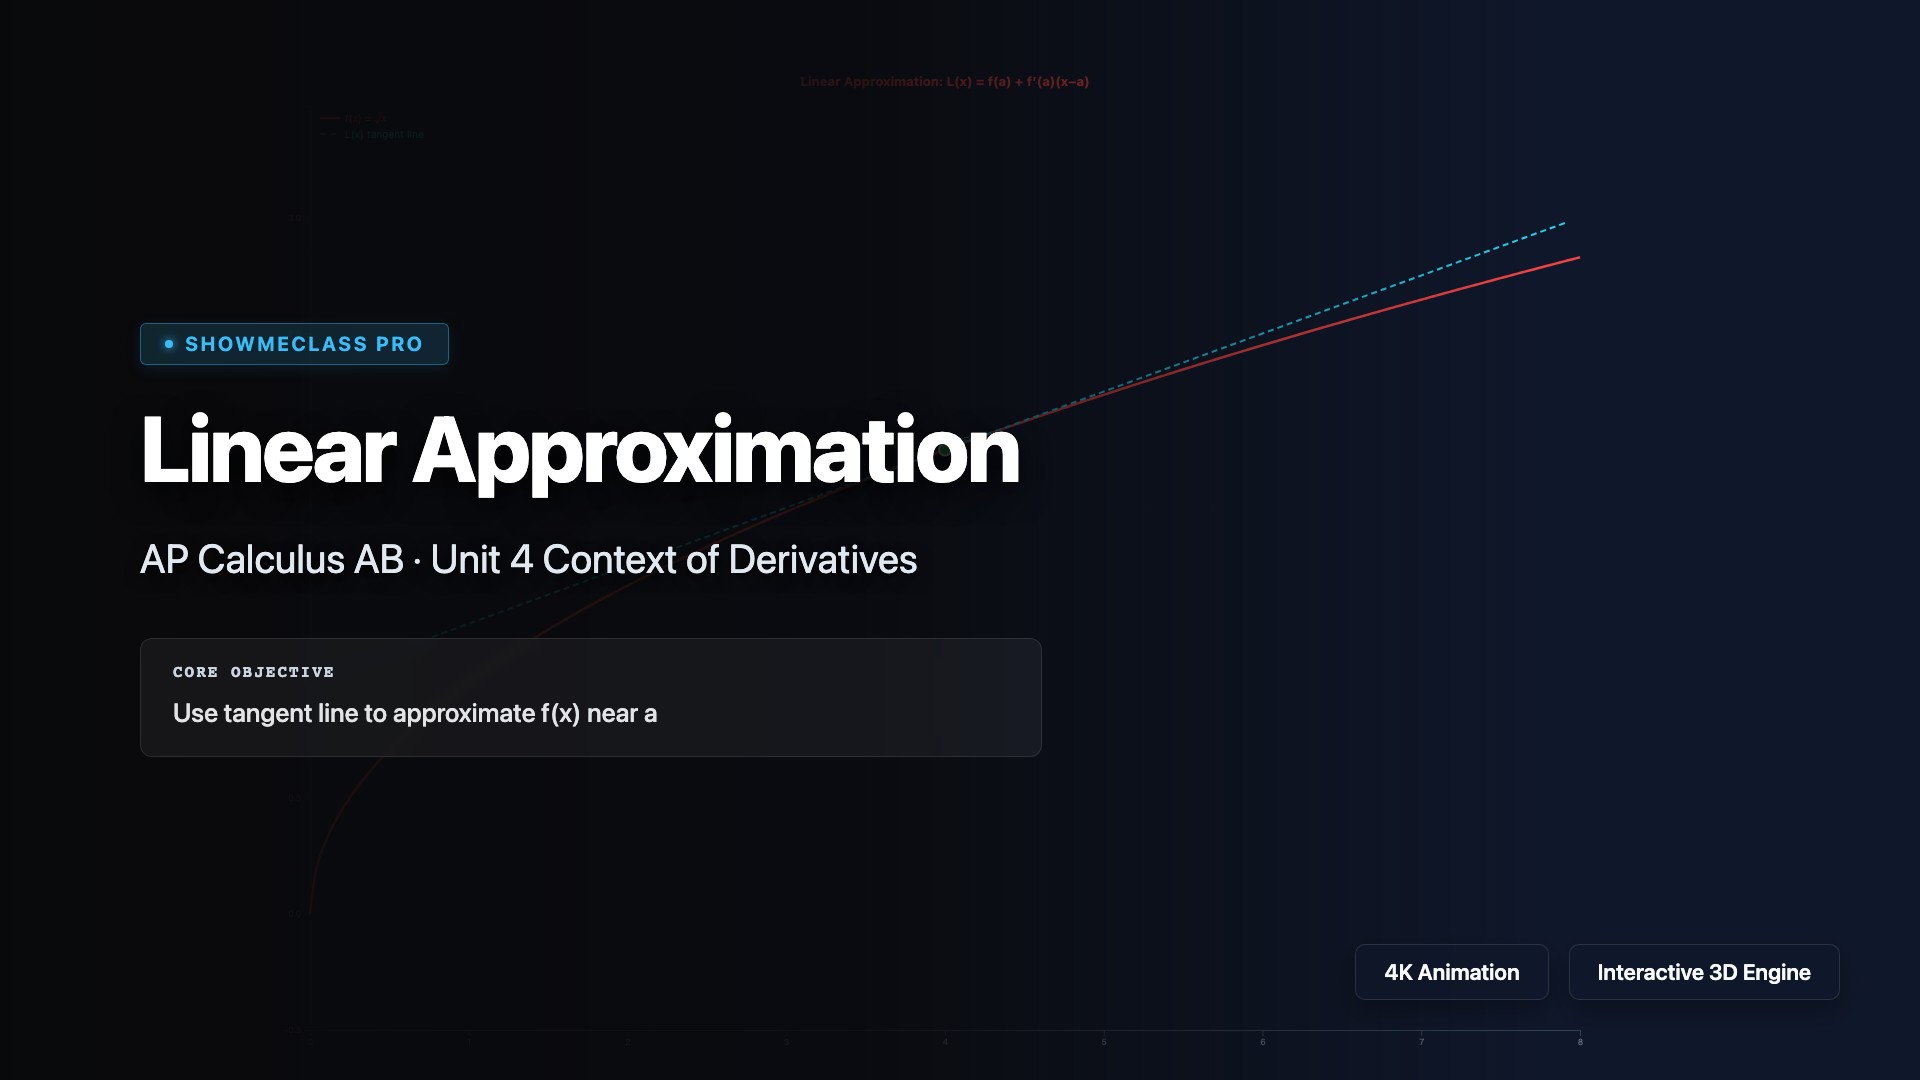
Linear Approximation & Differentials
Interactive linearization visualizer for 5 functions (√x, sin(x), eˣ, ln(x), 1/(1+x)). Shows tangent line L(x) = f(a) + f′(a)(x−a) overlaid on actual curve. Movable x-cursor with real-time exact vs approximate values, absolute and percentage error calculation.

u-Substitution Step-by-Step
Step-by-step walkthrough of u-substitution for 6 integral examples. Color-coded steps: identify u, find du, match dx, substitute, integrate, back-substitute. Covers standard patterns including definite integrals with bound conversion.
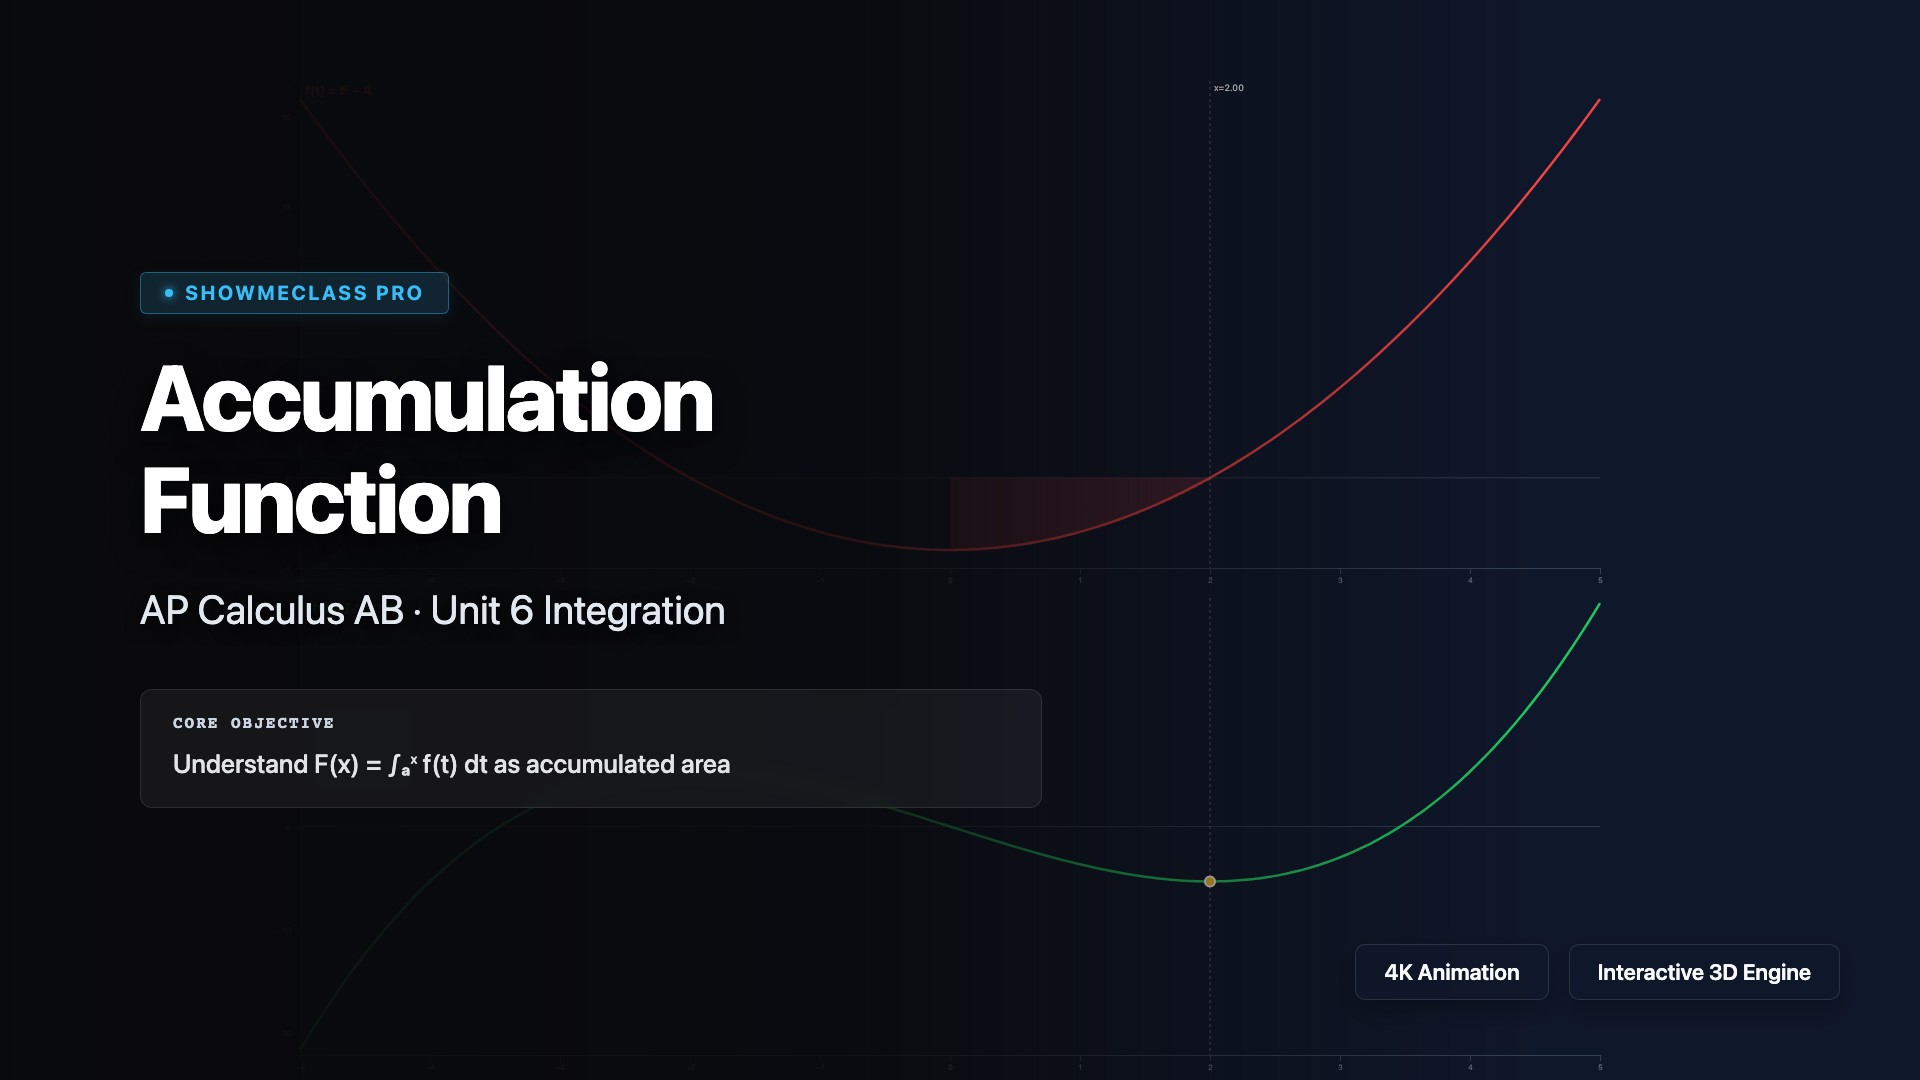
Accumulation Function Visualizer
Dual-panel visualization of f(t) and F(x) = ∫ₐˣ f(t) dt. Shows signed area shading (green positive, red negative) on the integrand graph alongside the accumulation function. Demonstrates FTC Part 1: F′(x) = f(x). Adjustable upper limit x with 4 function examples.
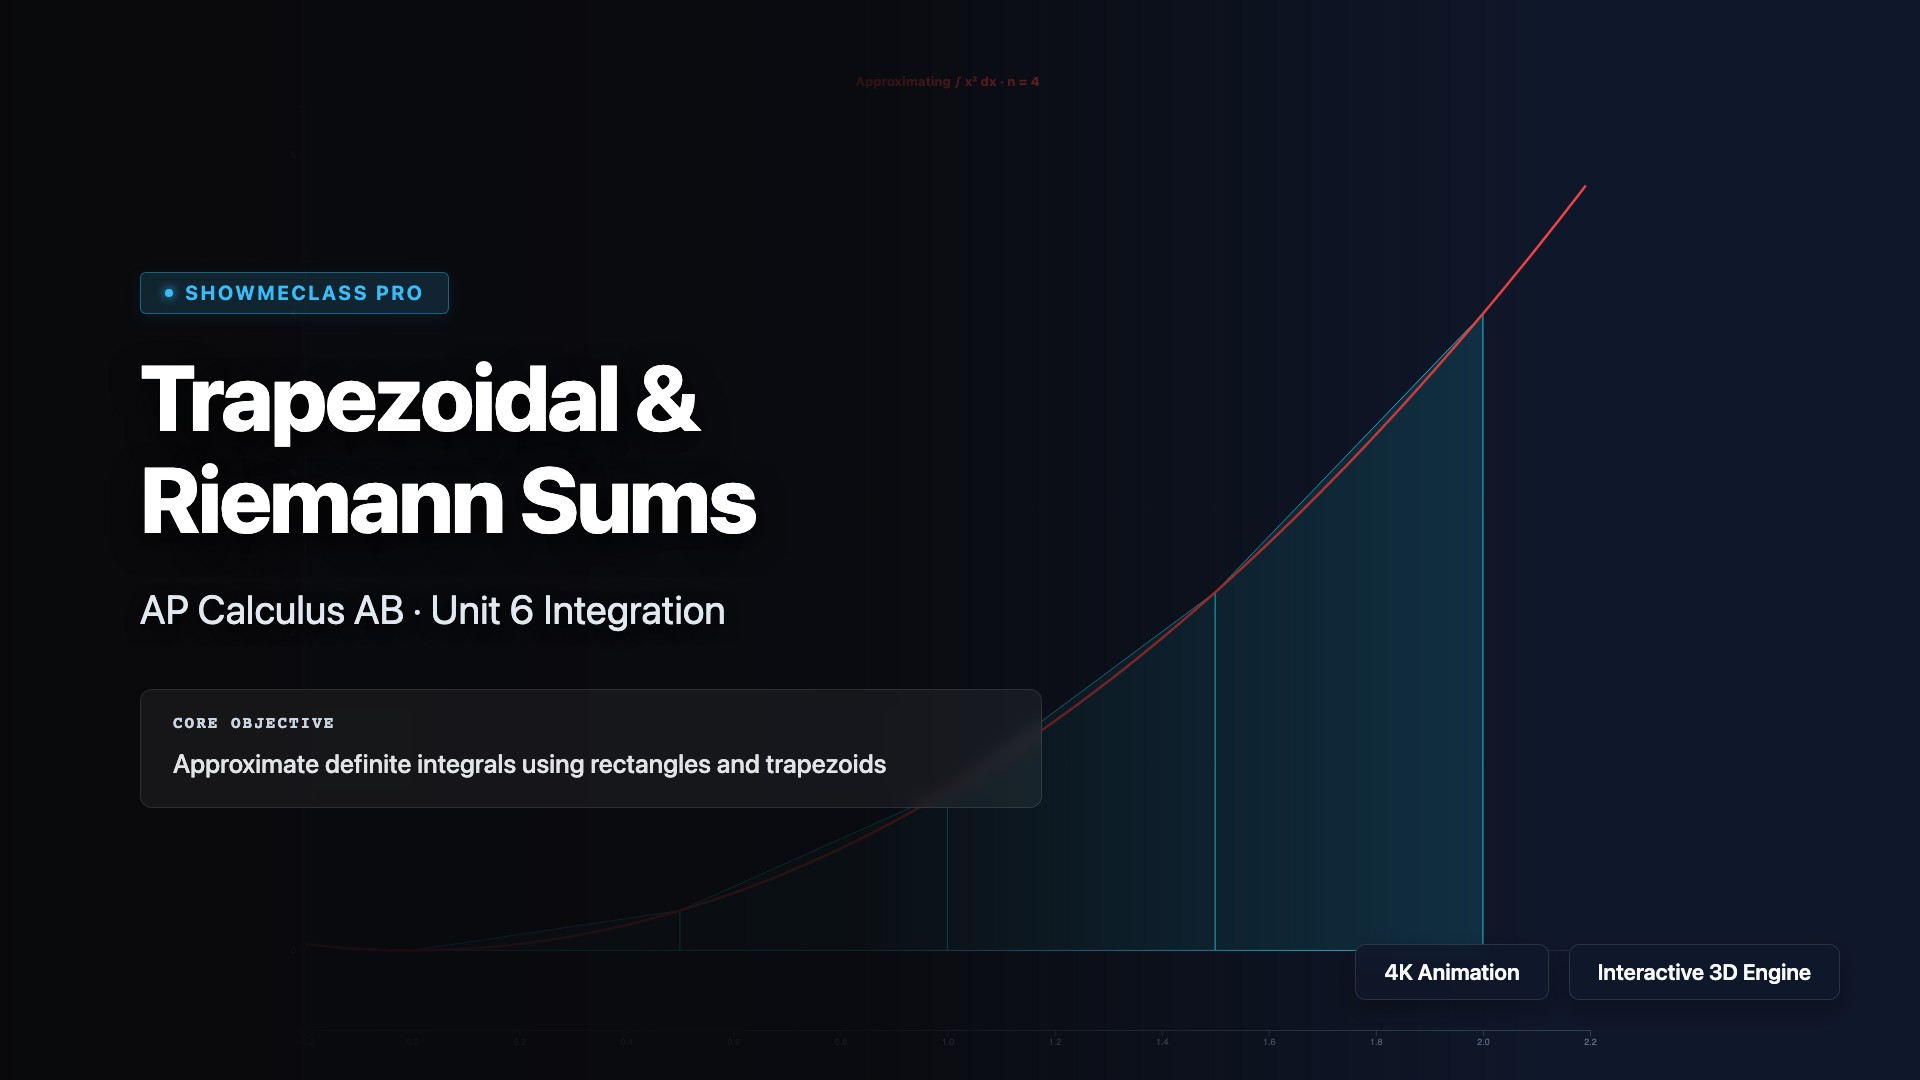
Trapezoidal & Riemann Sum Approximation
Interactive numerical integration comparing Left, Right, Midpoint, and Trapezoidal rules. 4 functions with adjustable number of subintervals (n=1 to 50). Shows exact value, approximation, absolute and percentage error. Visualizes rectangles/trapezoids overlaid on curve.
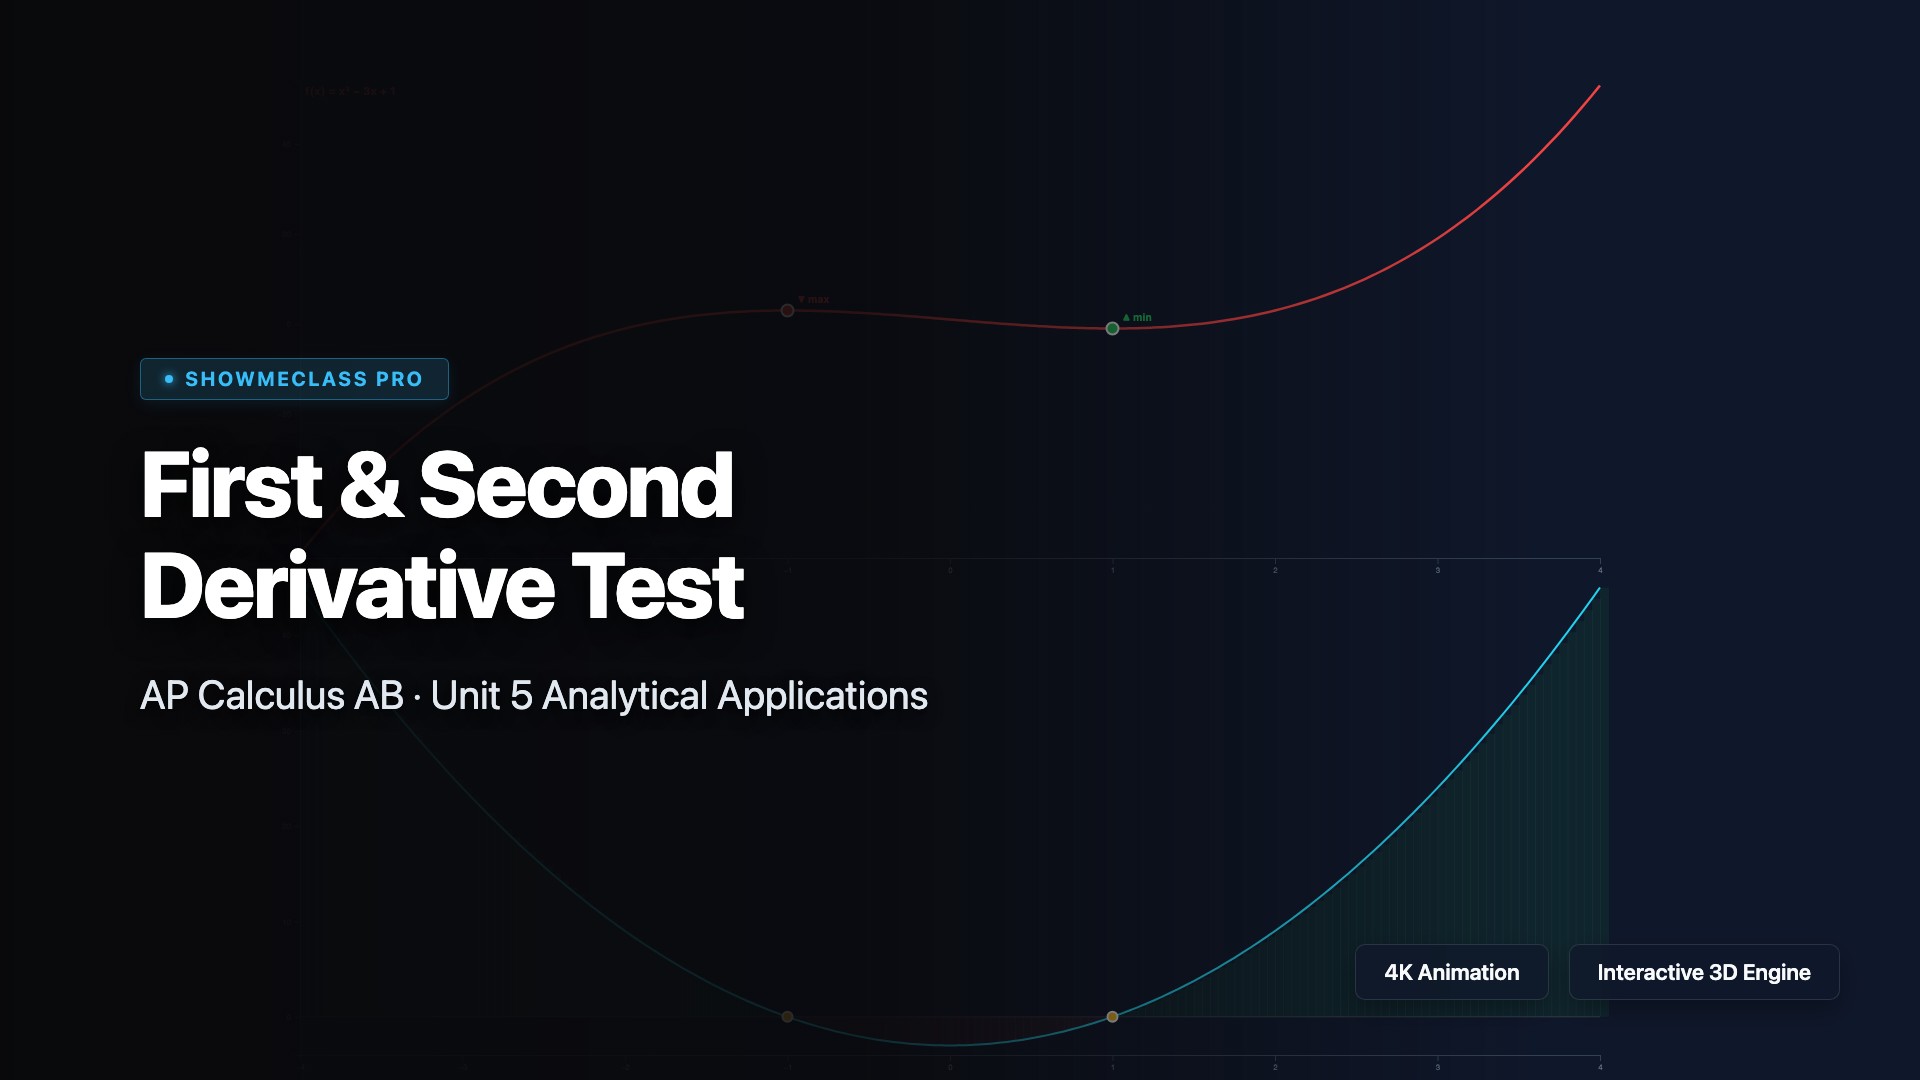
First & Second Derivative Test
Dual-panel display of f(x) and f′(x) for 4 polynomial/exponential functions. Critical points marked with max/min labels, f′ sign shading (green=increasing, red=decreasing). Second derivative test verification at each critical point. Interactive function selection.
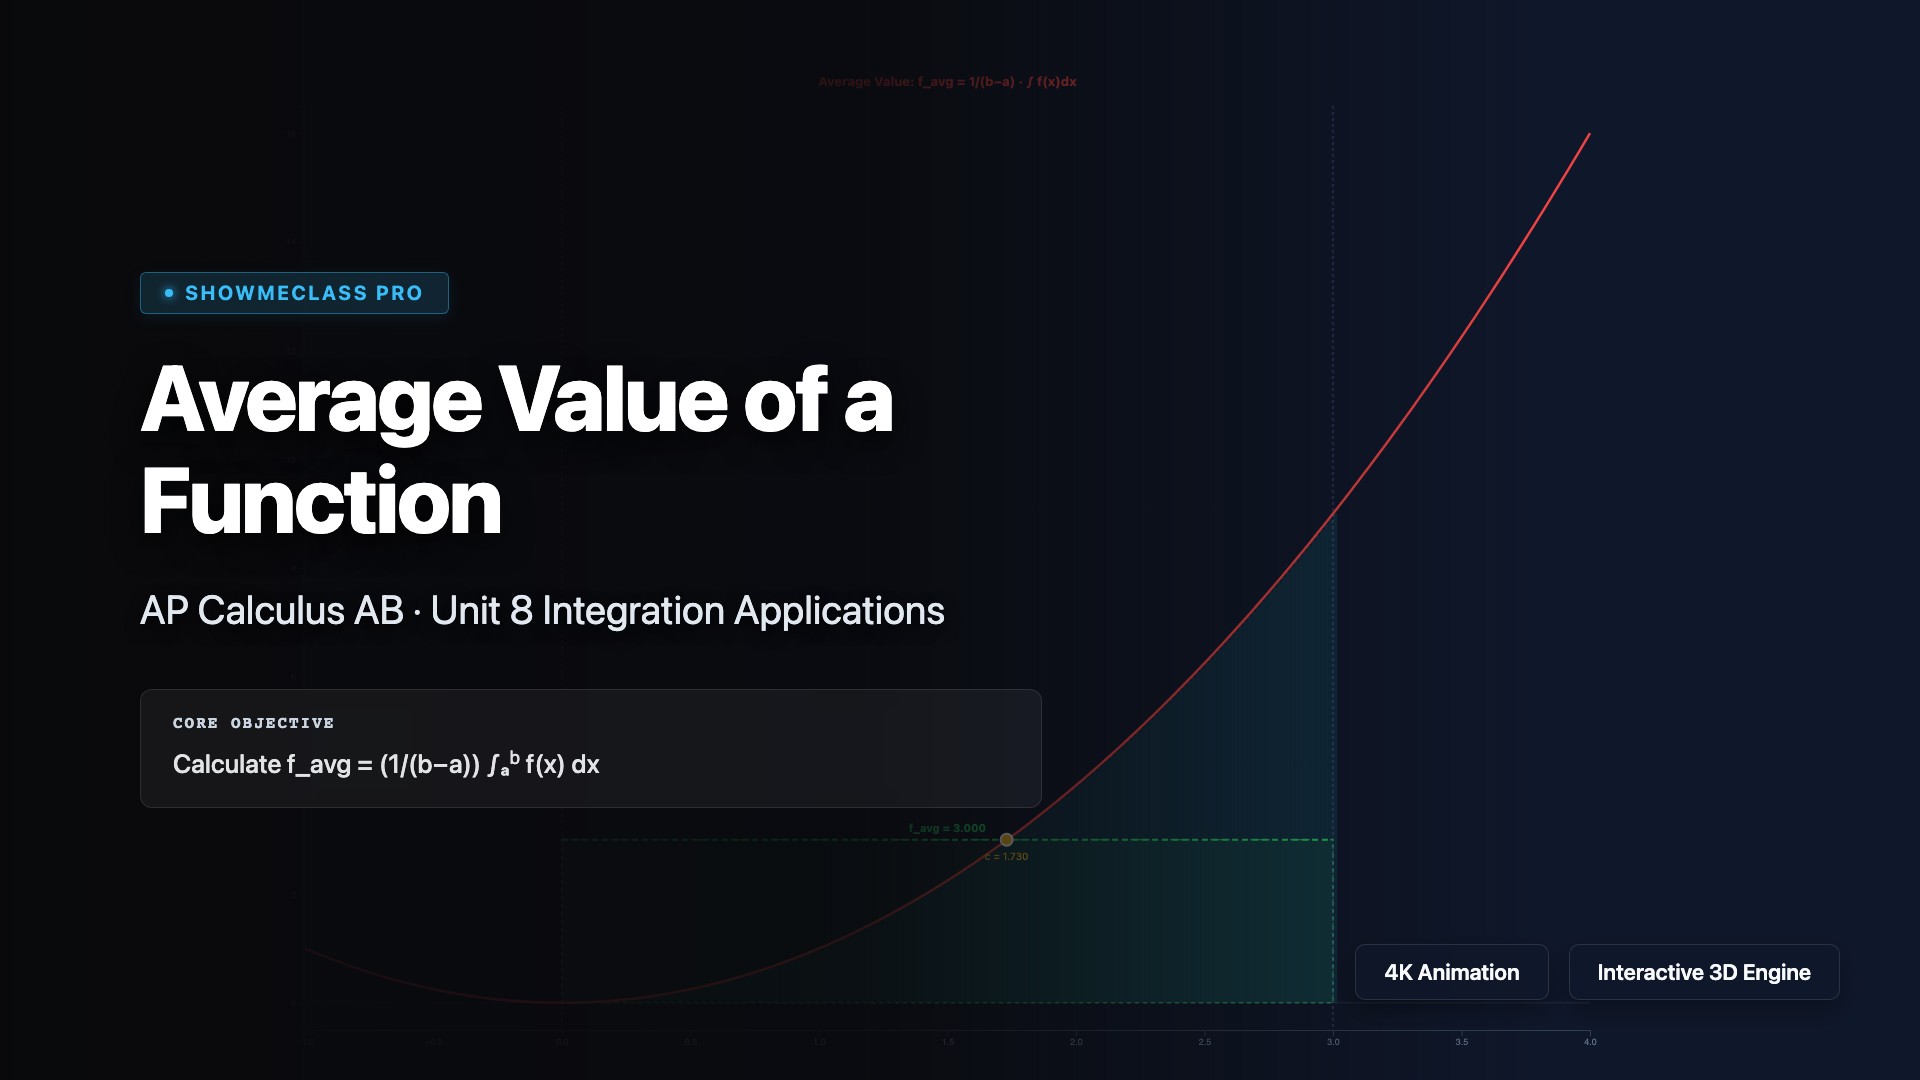
Average Value of a Function
Interactive average value calculator showing f_avg = 1/(b−a)·∫f(x)dx with equal-area rectangle visualization. Green dashed line at f_avg height creates a rectangle with the same area as the integral. Finds MVT for Integrals c-value. Adjustable bounds a and b.