Showing 12 results
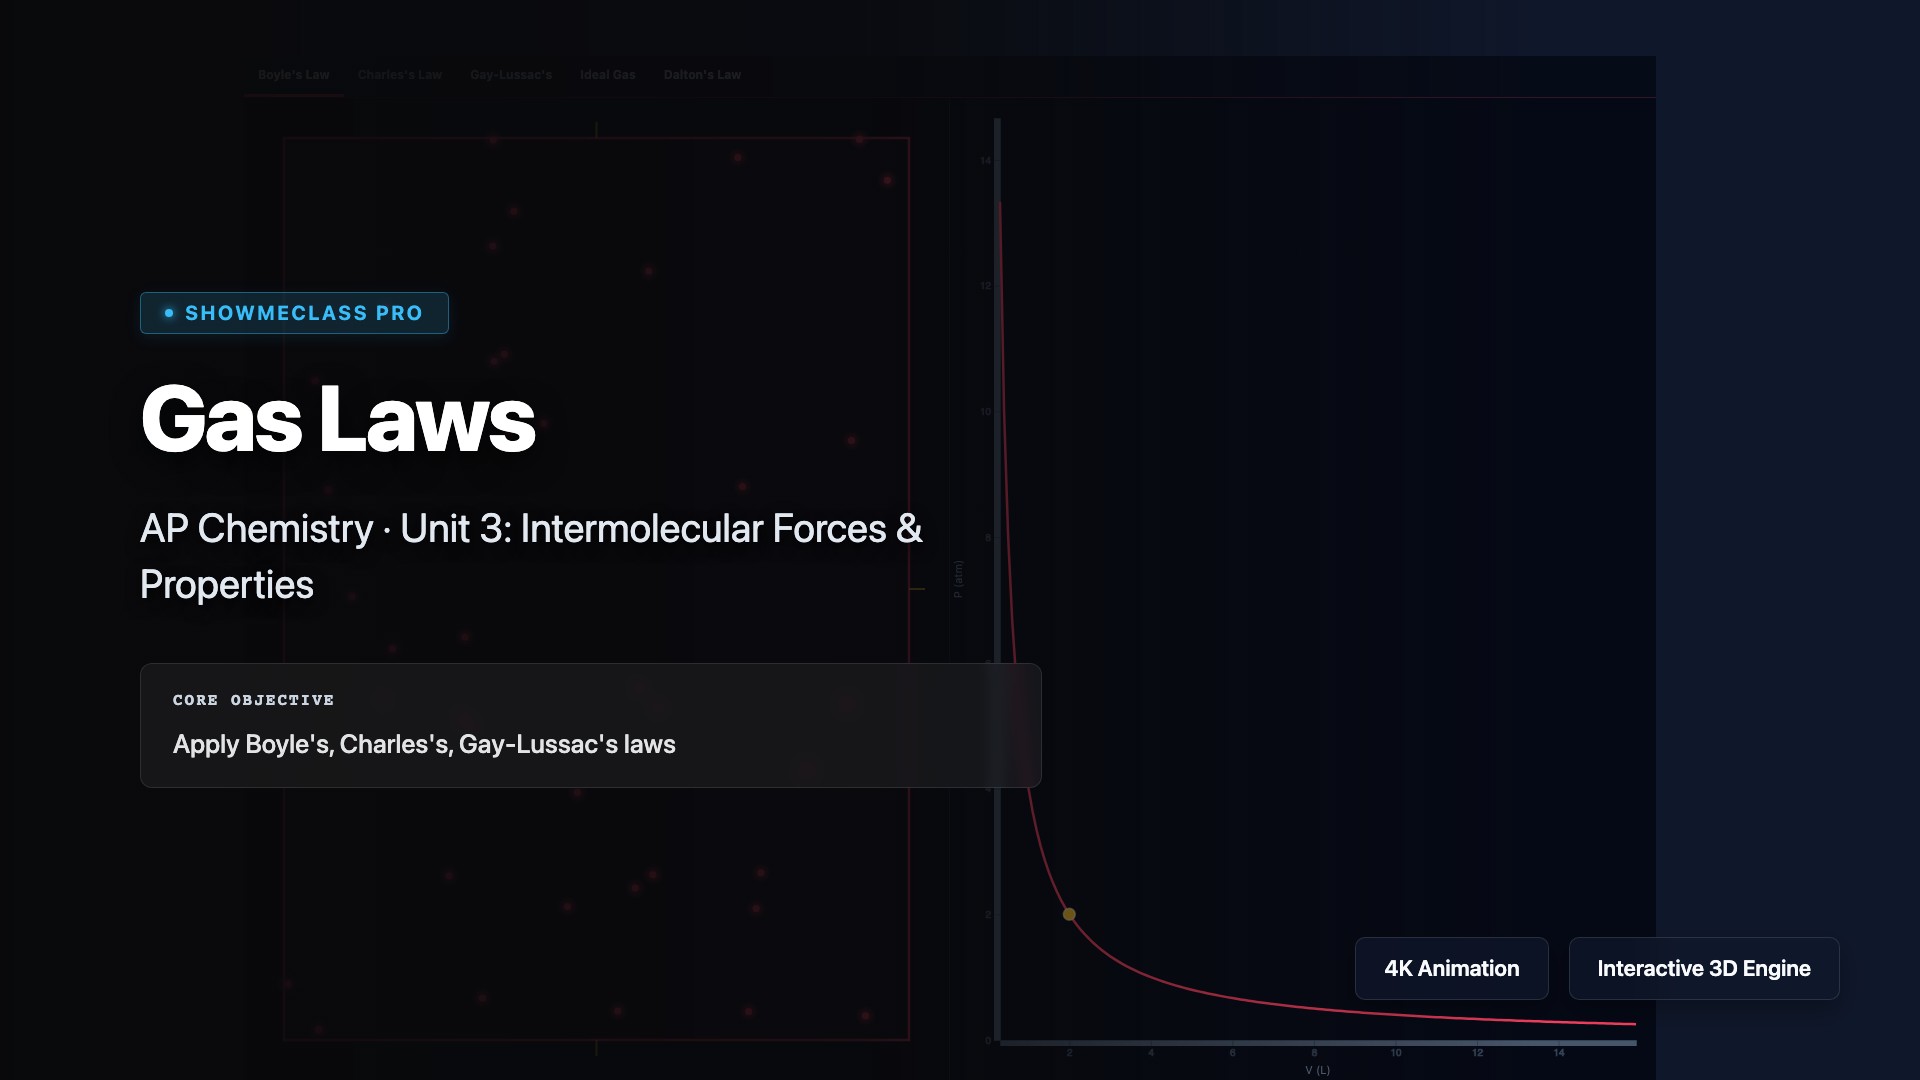
Gas Laws
Explore the fundamental gas laws that describe relationships between pressure, volume, temperature, and amount of gas. Visualize Boyle's Law (P₁V₁ = P₂V₂), Charles's Law (V₁/T₁ = V₂/T₂), Gay-Lussac's Law (P₁/T₁ = P₂/T₂), Avogadro's Law (V₁/n₁ = V₂/n₂), and the Combined Gas Law. Understand how these individual laws combine to form the Ideal Gas Law PV = nRT.
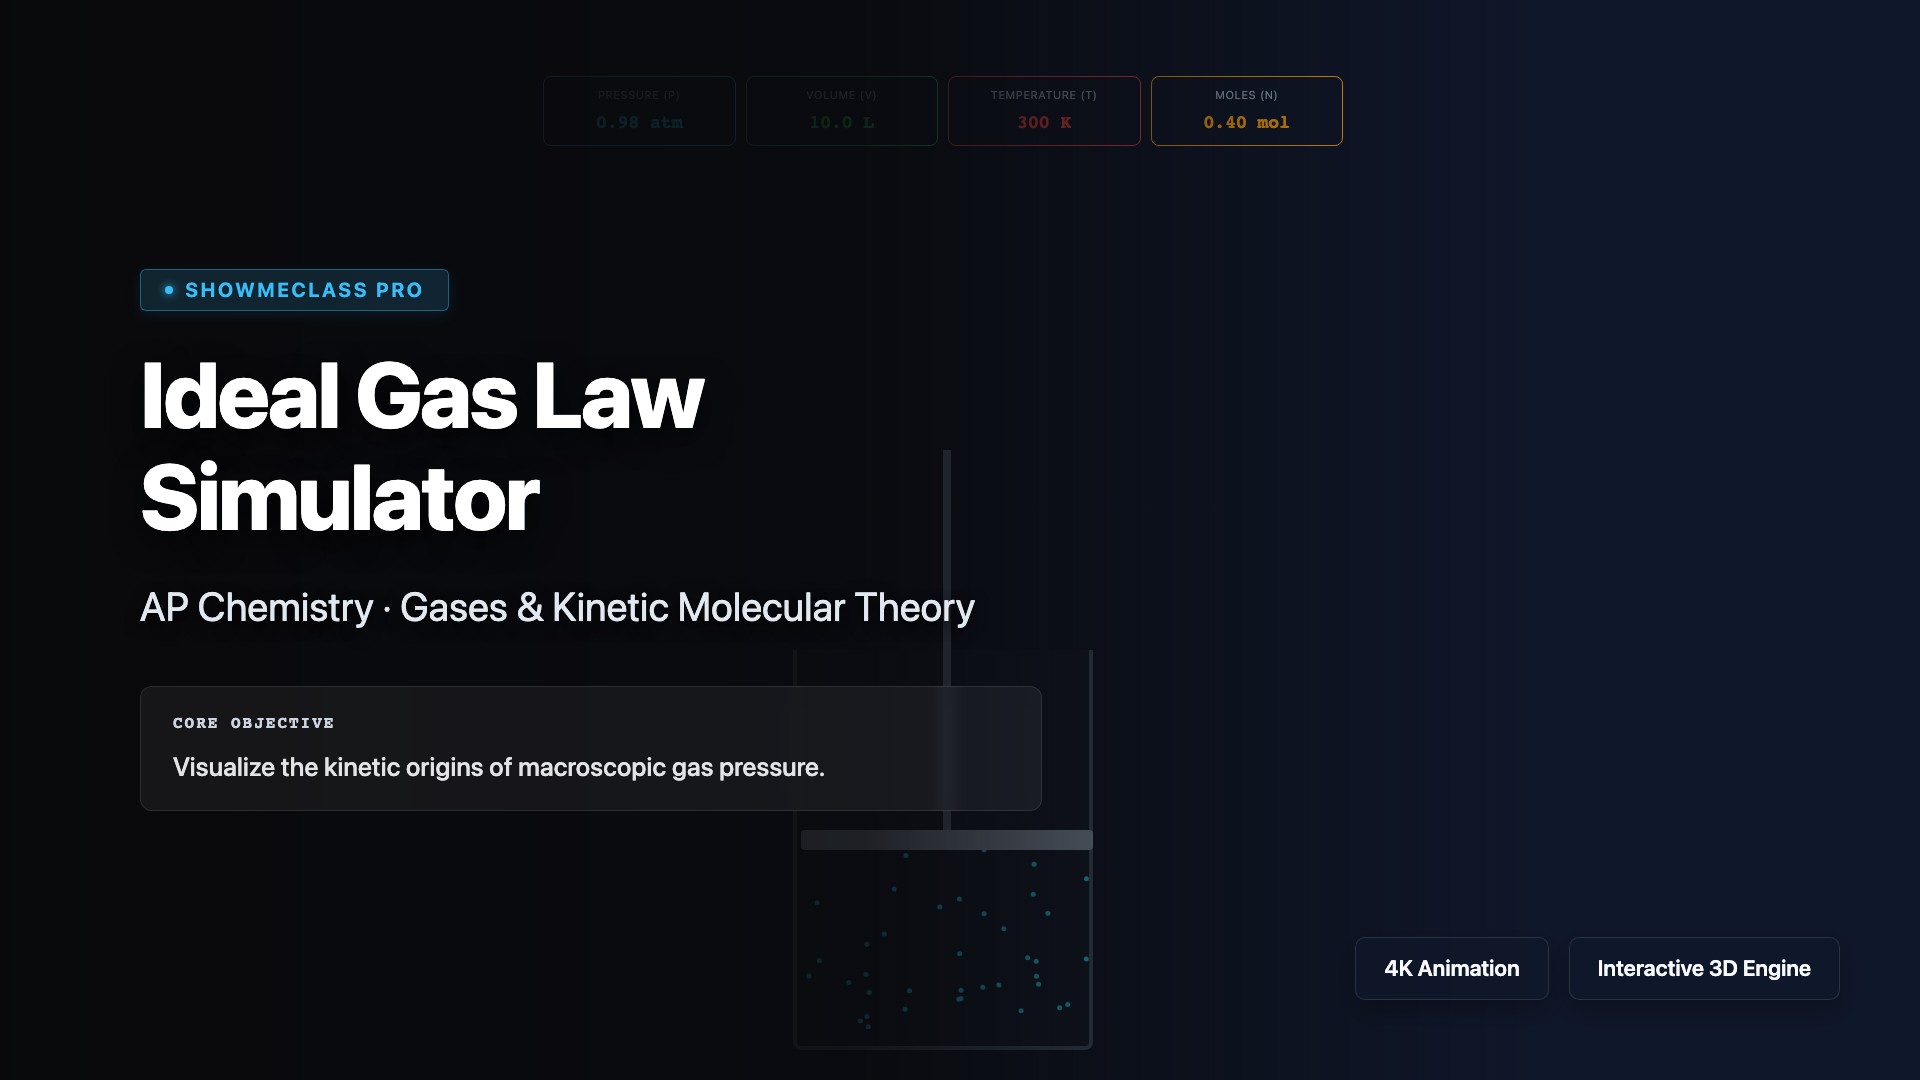
Ideal Gas Law Simulator
Simulate the Ideal Gas Law PV = nRT to explore how pressure, volume, temperature, and moles of gas are related. Manipulate variables to see real-time effects on gas behavior, calculate unknown quantities using R = 0.0821 L·atm/(mol·K), and understand the assumptions of ideal gas behavior. Explore deviations from ideality at high pressure and low temperature where real gases exhibit intermolecular forces and molecular volume.
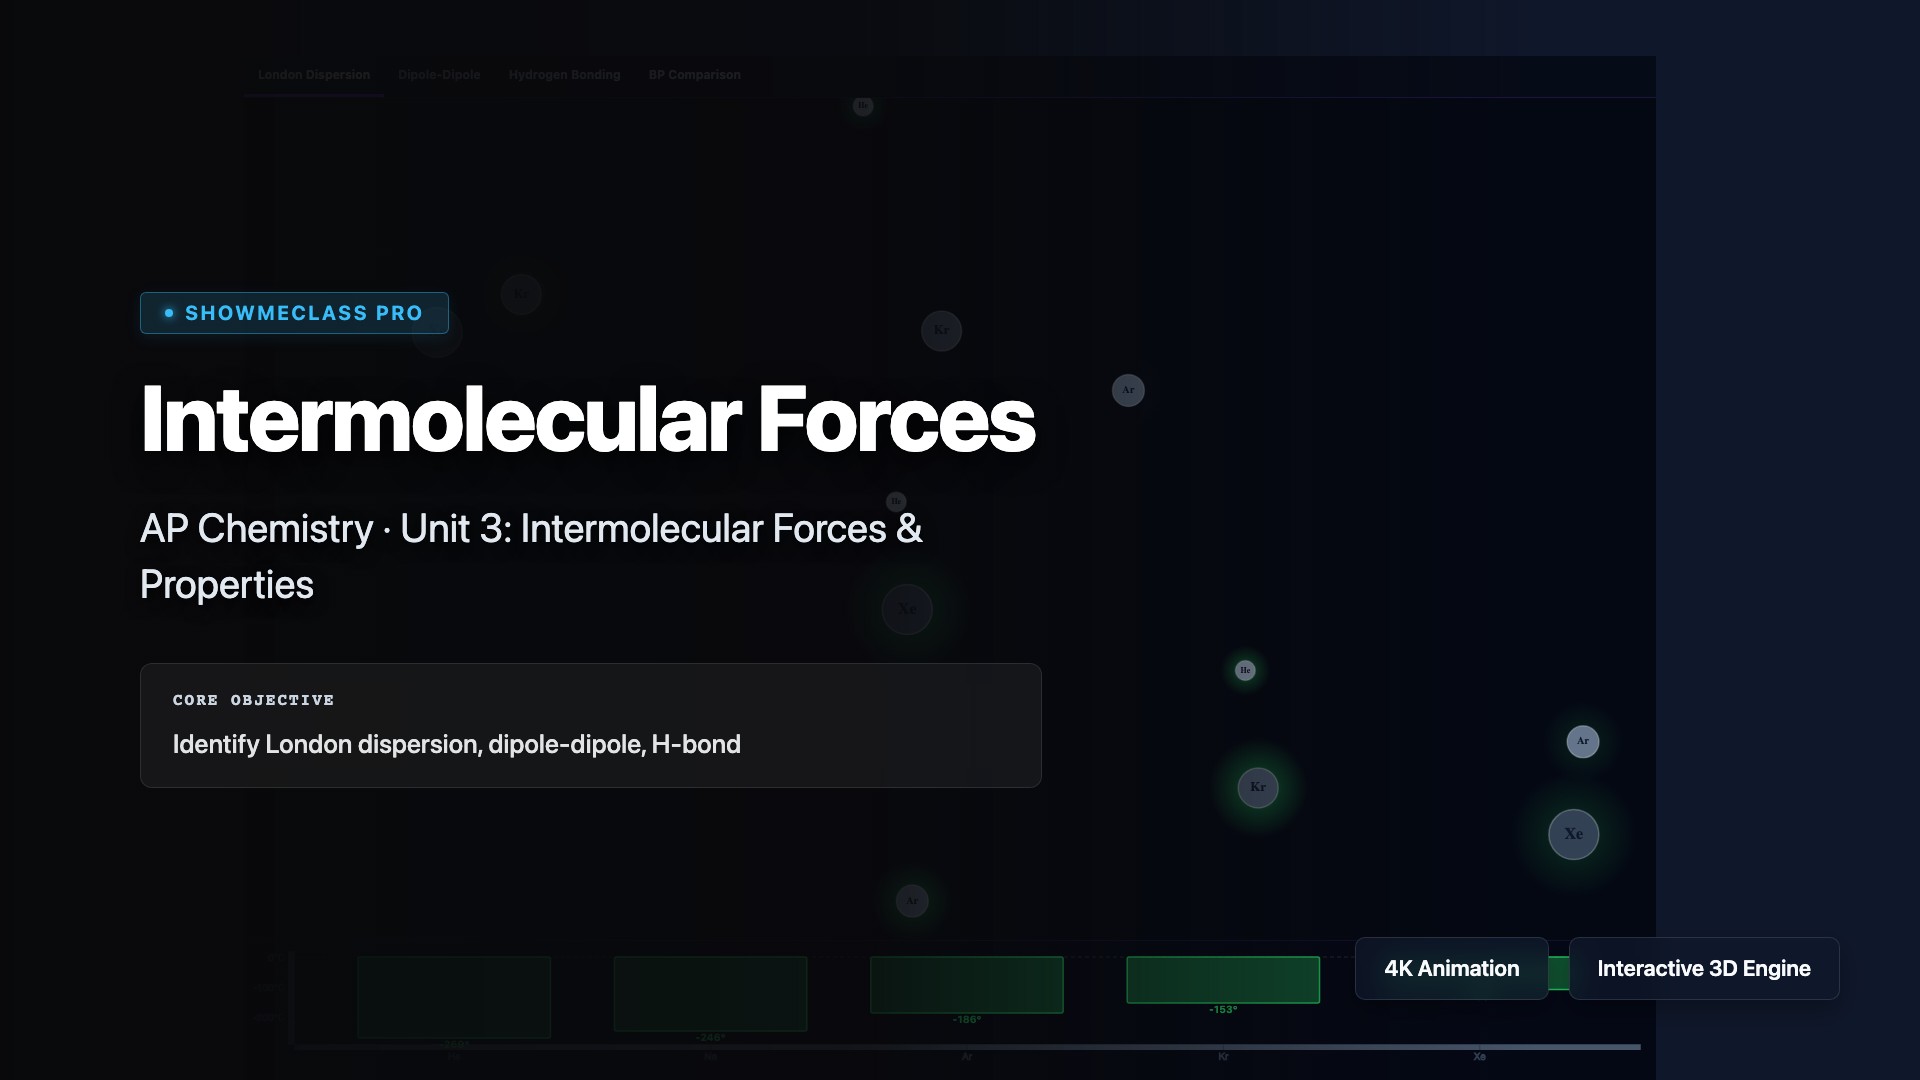
Intermolecular Forces
Explore the attractive forces between molecules that determine physical properties like boiling point, melting point, and solubility. Compare London dispersion forces (weakest, present in all molecules), dipole-dipole interactions (polar molecules), and hydrogen bonding (strongest IMF, requires H bonded to N, O, or F). Understand how molecular structure, polarity, and molecular weight affect IMF strength and predict relative boiling points.
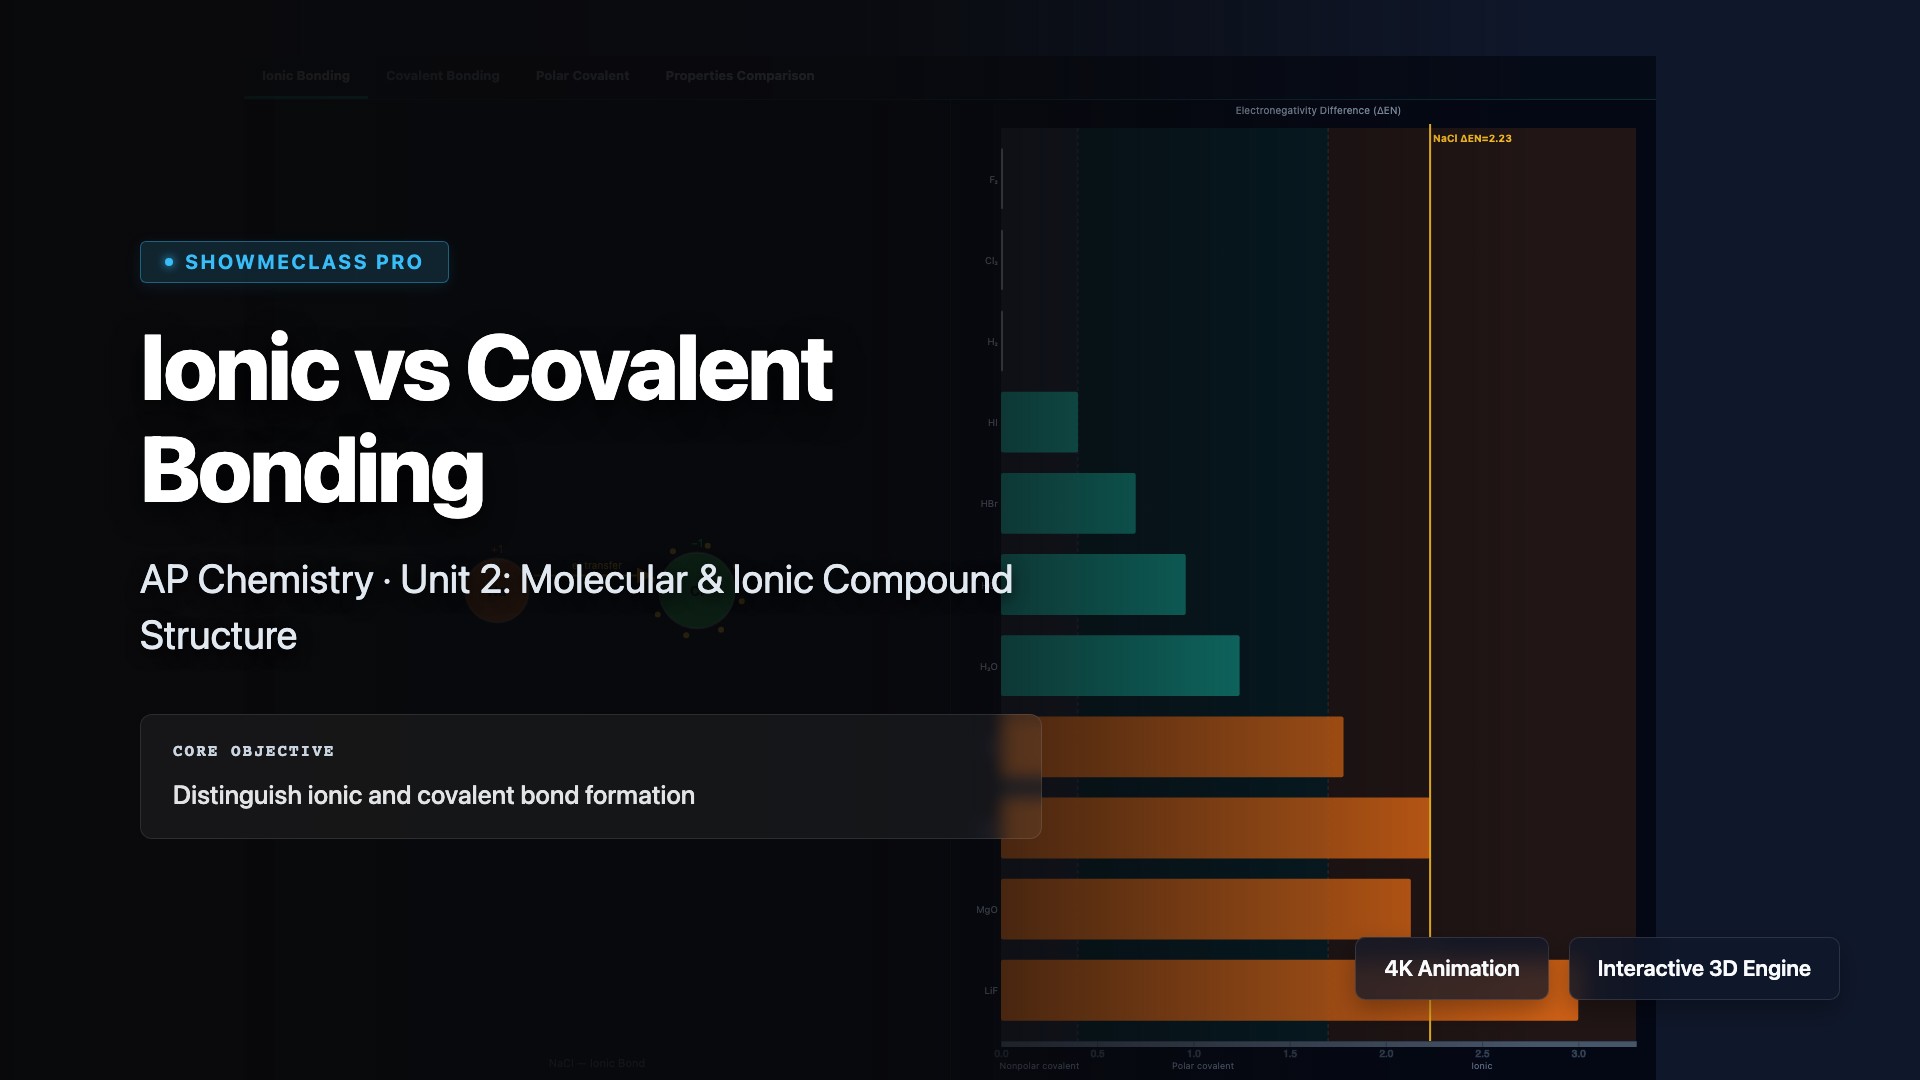
Ionic vs Covalent Bonding
Compare ionic bonding (electron transfer between metals and nonmetals forming electrostatic attractions) with covalent bonding (electron sharing between nonmetals). Visualize how electronegativity differences determine bond type: ΔEN > 1.7 indicates ionic, ΔEN < 0.4 indicates nonpolar covalent, and intermediate values indicate polar covalent bonds. Understand how bond type affects properties like melting point, electrical conductivity, and solubility.
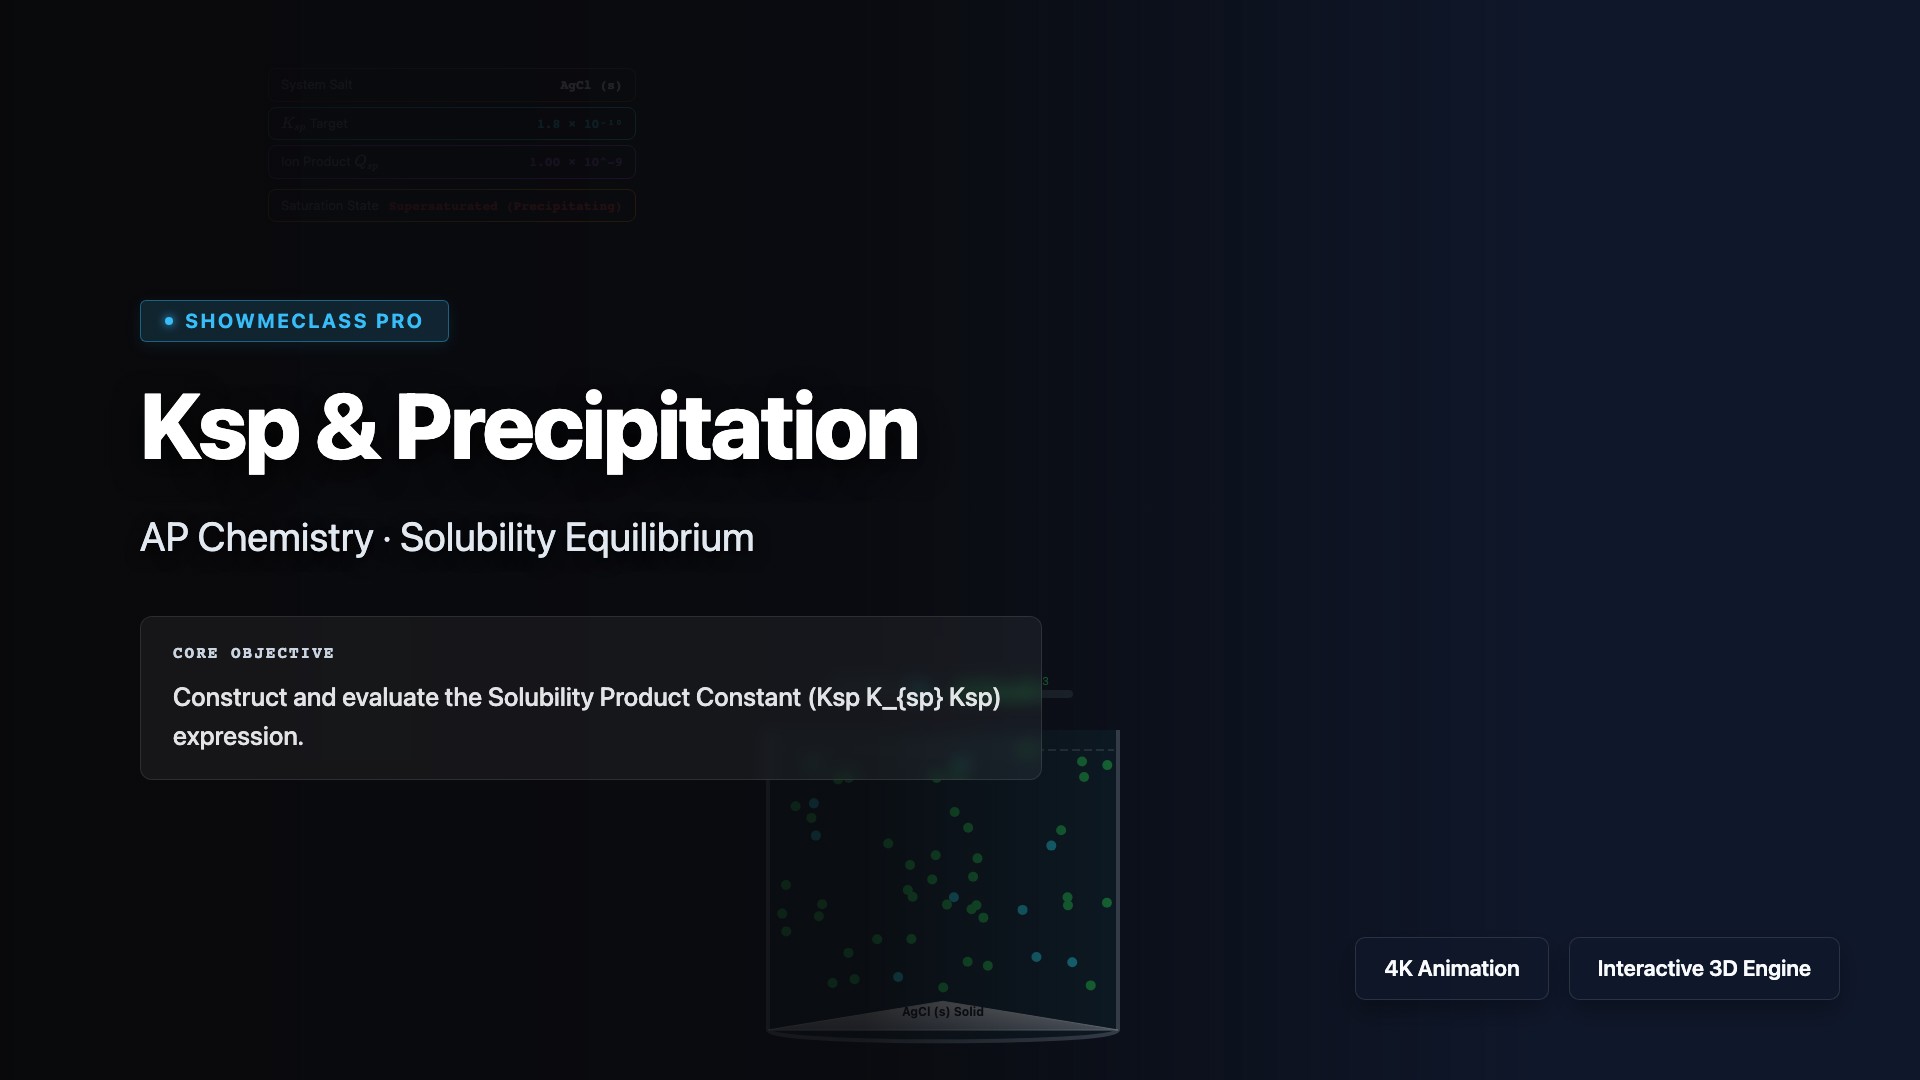
Ksp & Precipitation
Explore the solubility product constant (Ksp) that describes the equilibrium between a solid ionic compound and its dissolved ions. Calculate ion concentrations, predict precipitation using the reaction quotient Q (if Q > Ksp, precipitation occurs), and understand the common ion effect that decreases solubility. Practice solving Ksp problems for various stoichiometries and applying Le Chatelier's principle to solubility equilibria.
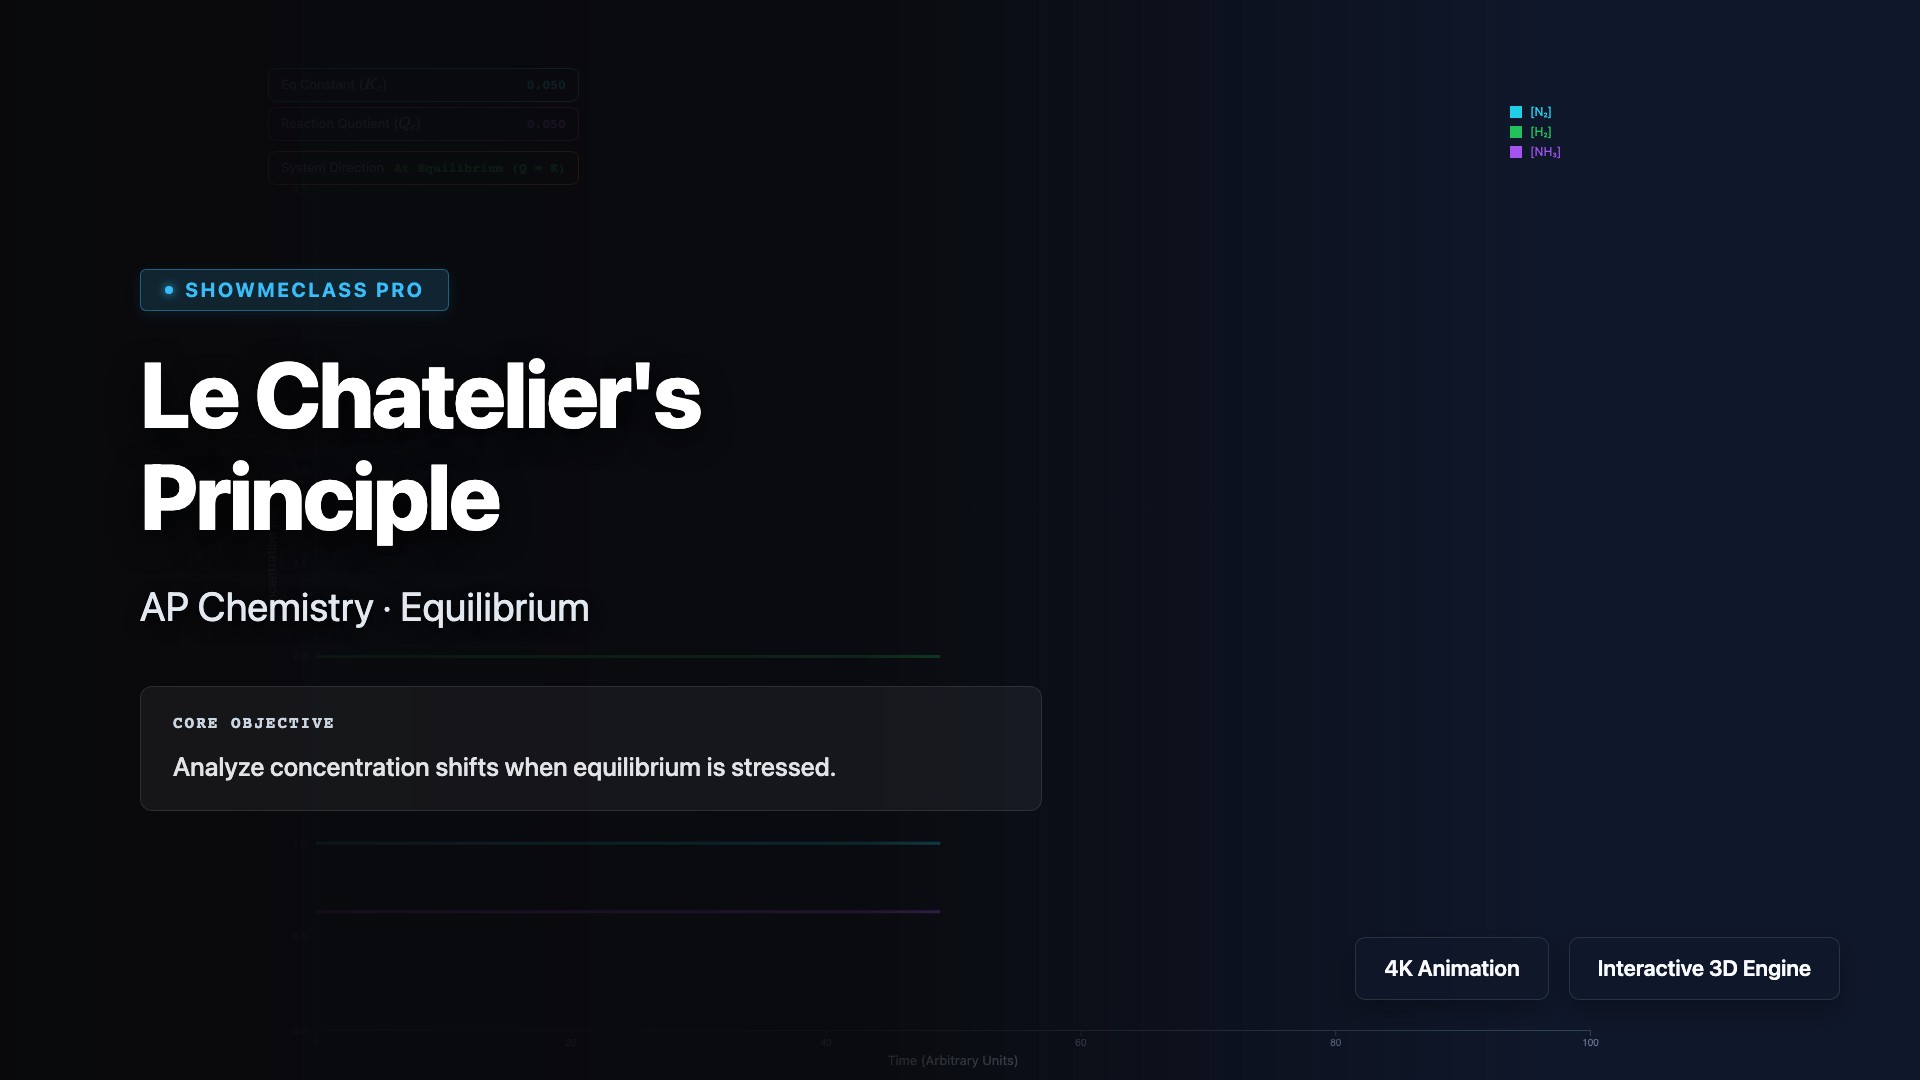
Le Chatelier's Principle
Apply Le Chatelier's Principle to predict how chemical equilibria shift in response to stress. Visualize how changes in concentration, pressure, volume, or temperature cause the system to counteract the disturbance and establish a new equilibrium. Explore the Haber Process for ammonia synthesis, understand why increasing pressure favors fewer moles of gas, and learn how catalysts speed up equilibrium attainment without shifting position.
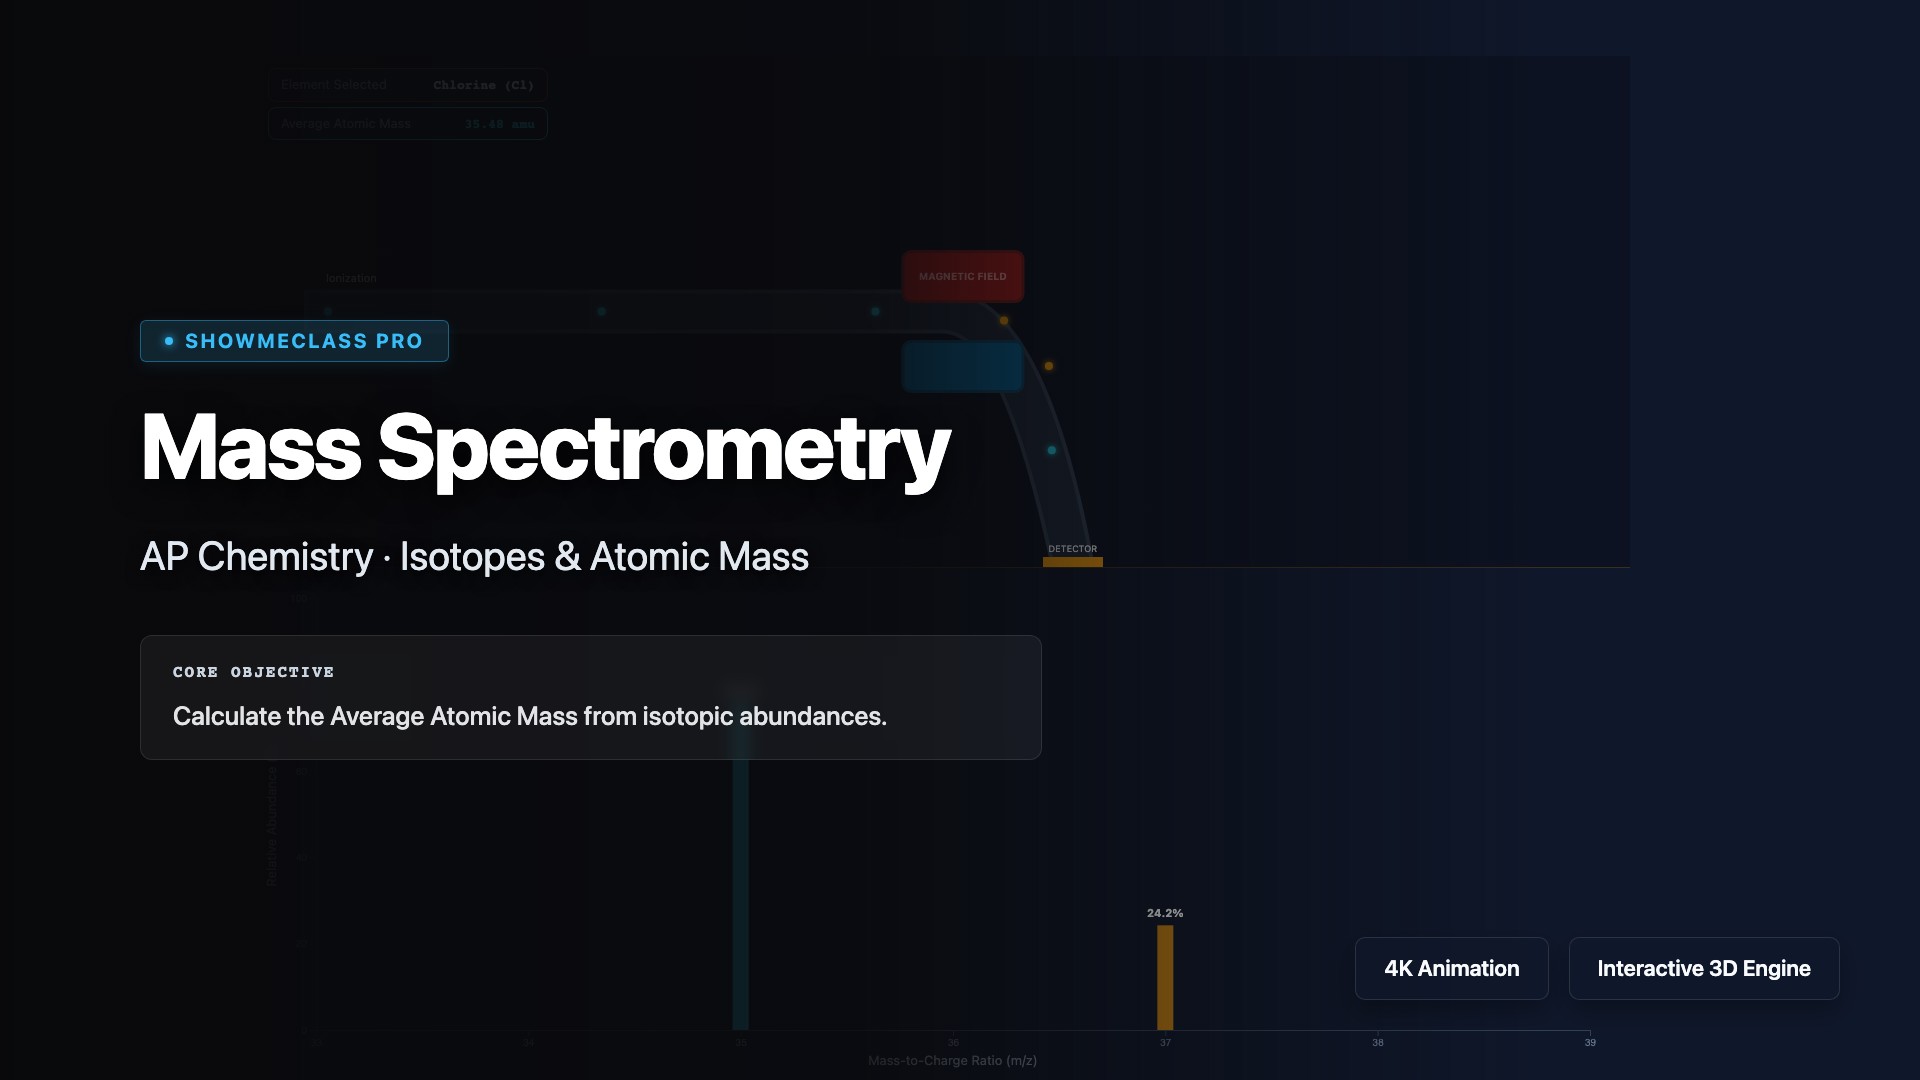
Mass Spectrometry
Analyze mass spectra to determine isotopic composition and calculate average atomic mass. Visualize how mass spectrometry ionizes atoms, separates ions by mass-to-charge ratio (m/z), and detects relative abundances. Practice interpreting mass spectrum peaks to identify isotopes, calculate weighted average atomic mass using (mass × abundance) for each isotope, and understand applications in identifying unknown compounds and determining molecular formulas.
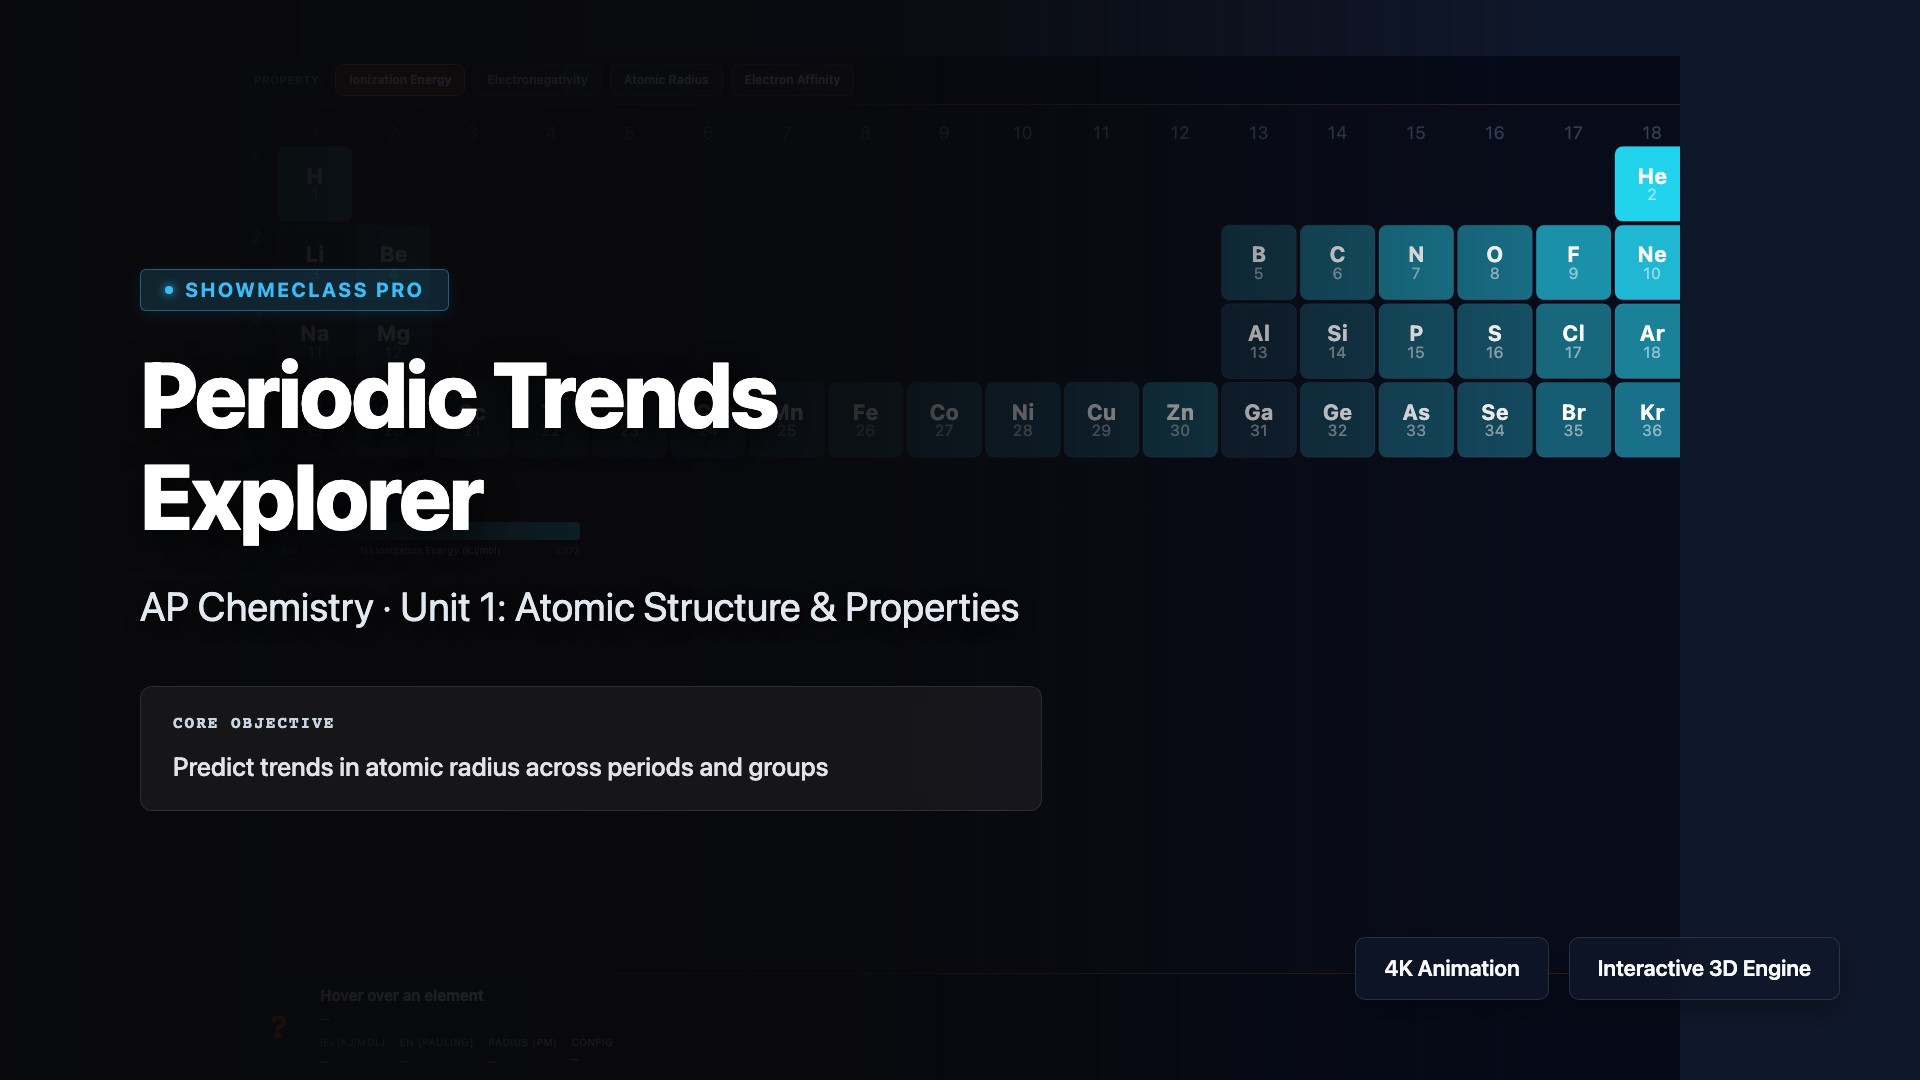
Periodic Trends Explorer
Explore periodic trends including atomic radius, ionic radius, ionization energy, electron affinity, and electronegativity across periods and down groups. Understand how effective nuclear charge (Zeff) and shielding explain why atomic radius decreases across a period but increases down a group, why ionization energy increases across a period, and how these trends predict chemical reactivity and bonding behavior.
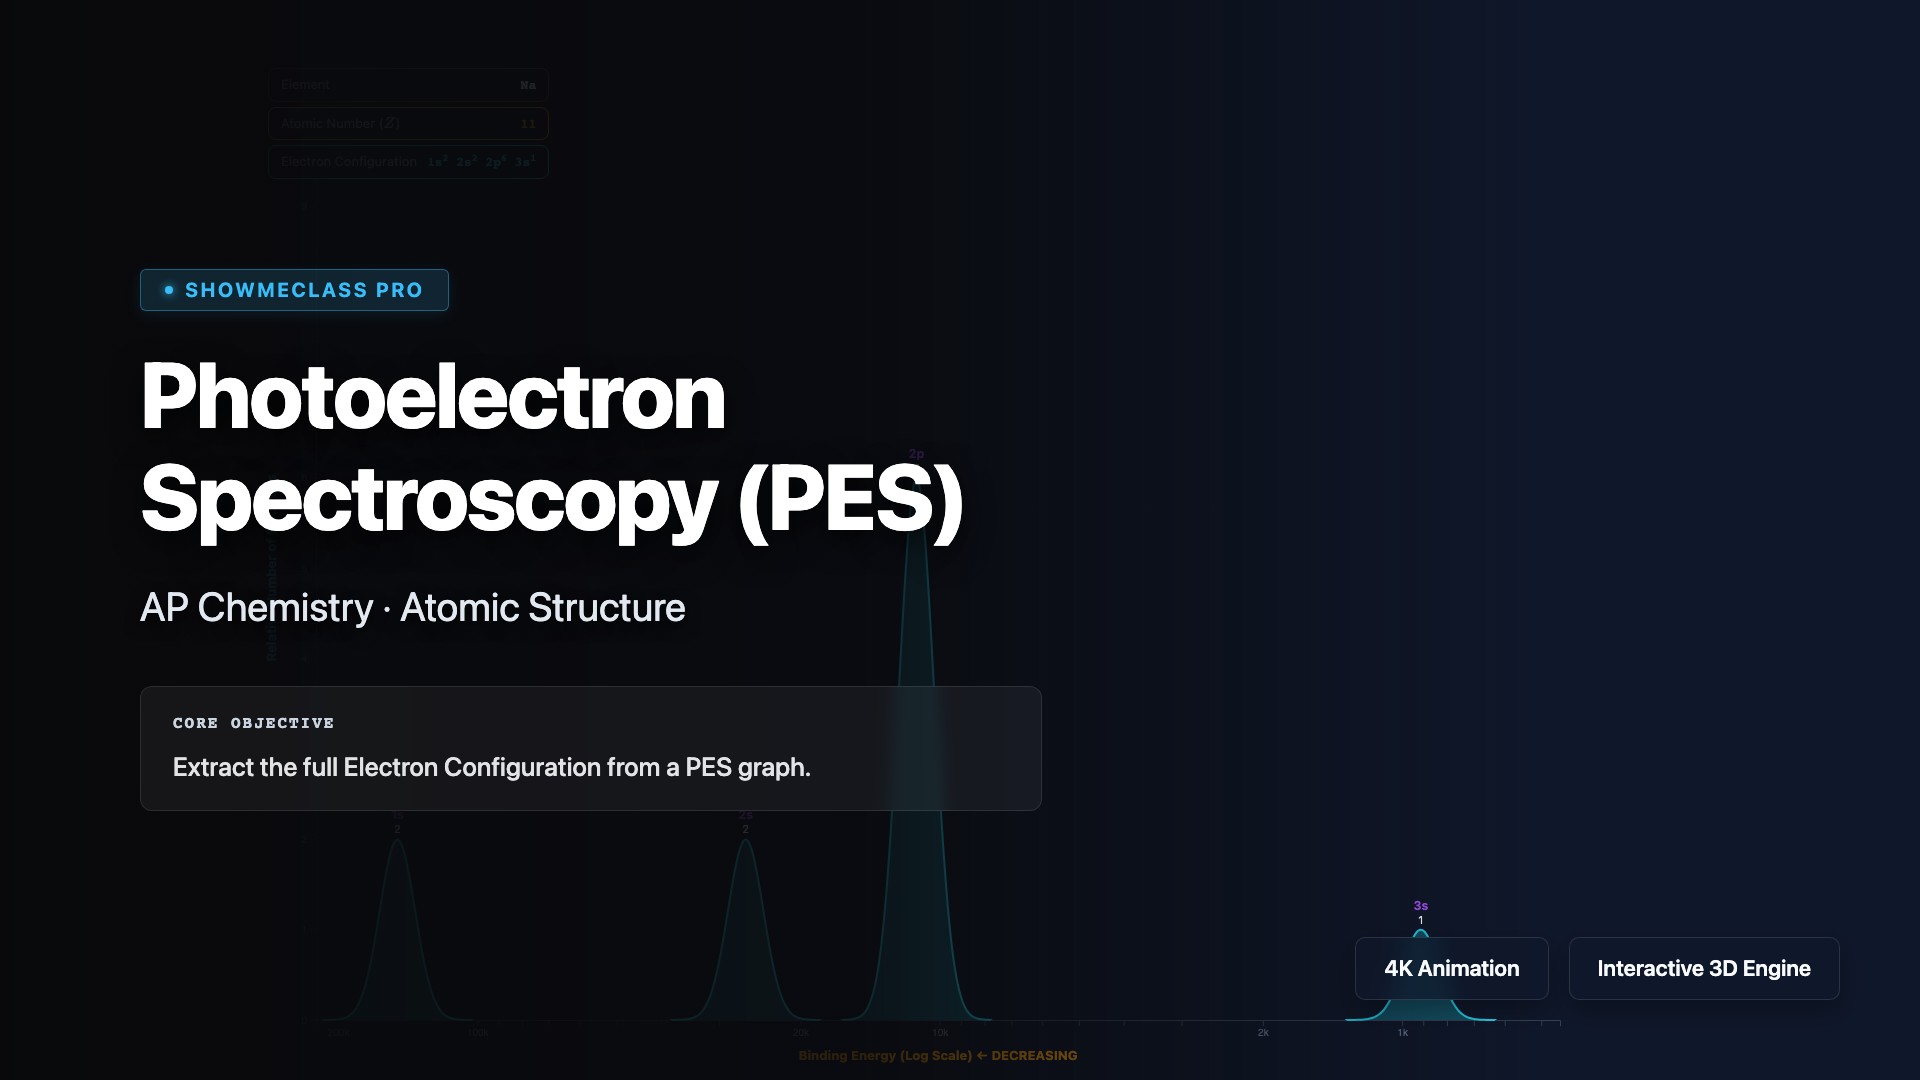
Photoelectron Spectroscopy (PES)
Interpret photoelectron spectroscopy (PES) data to determine electron configuration and relative energies of electrons in different orbitals. Analyze PES spectra where peak position indicates binding energy (related to Coulomb's law and effective nuclear charge) and peak height represents the number of electrons. Practice identifying elements from their PES spectra and understanding how core versus valence electrons produce distinct peaks.
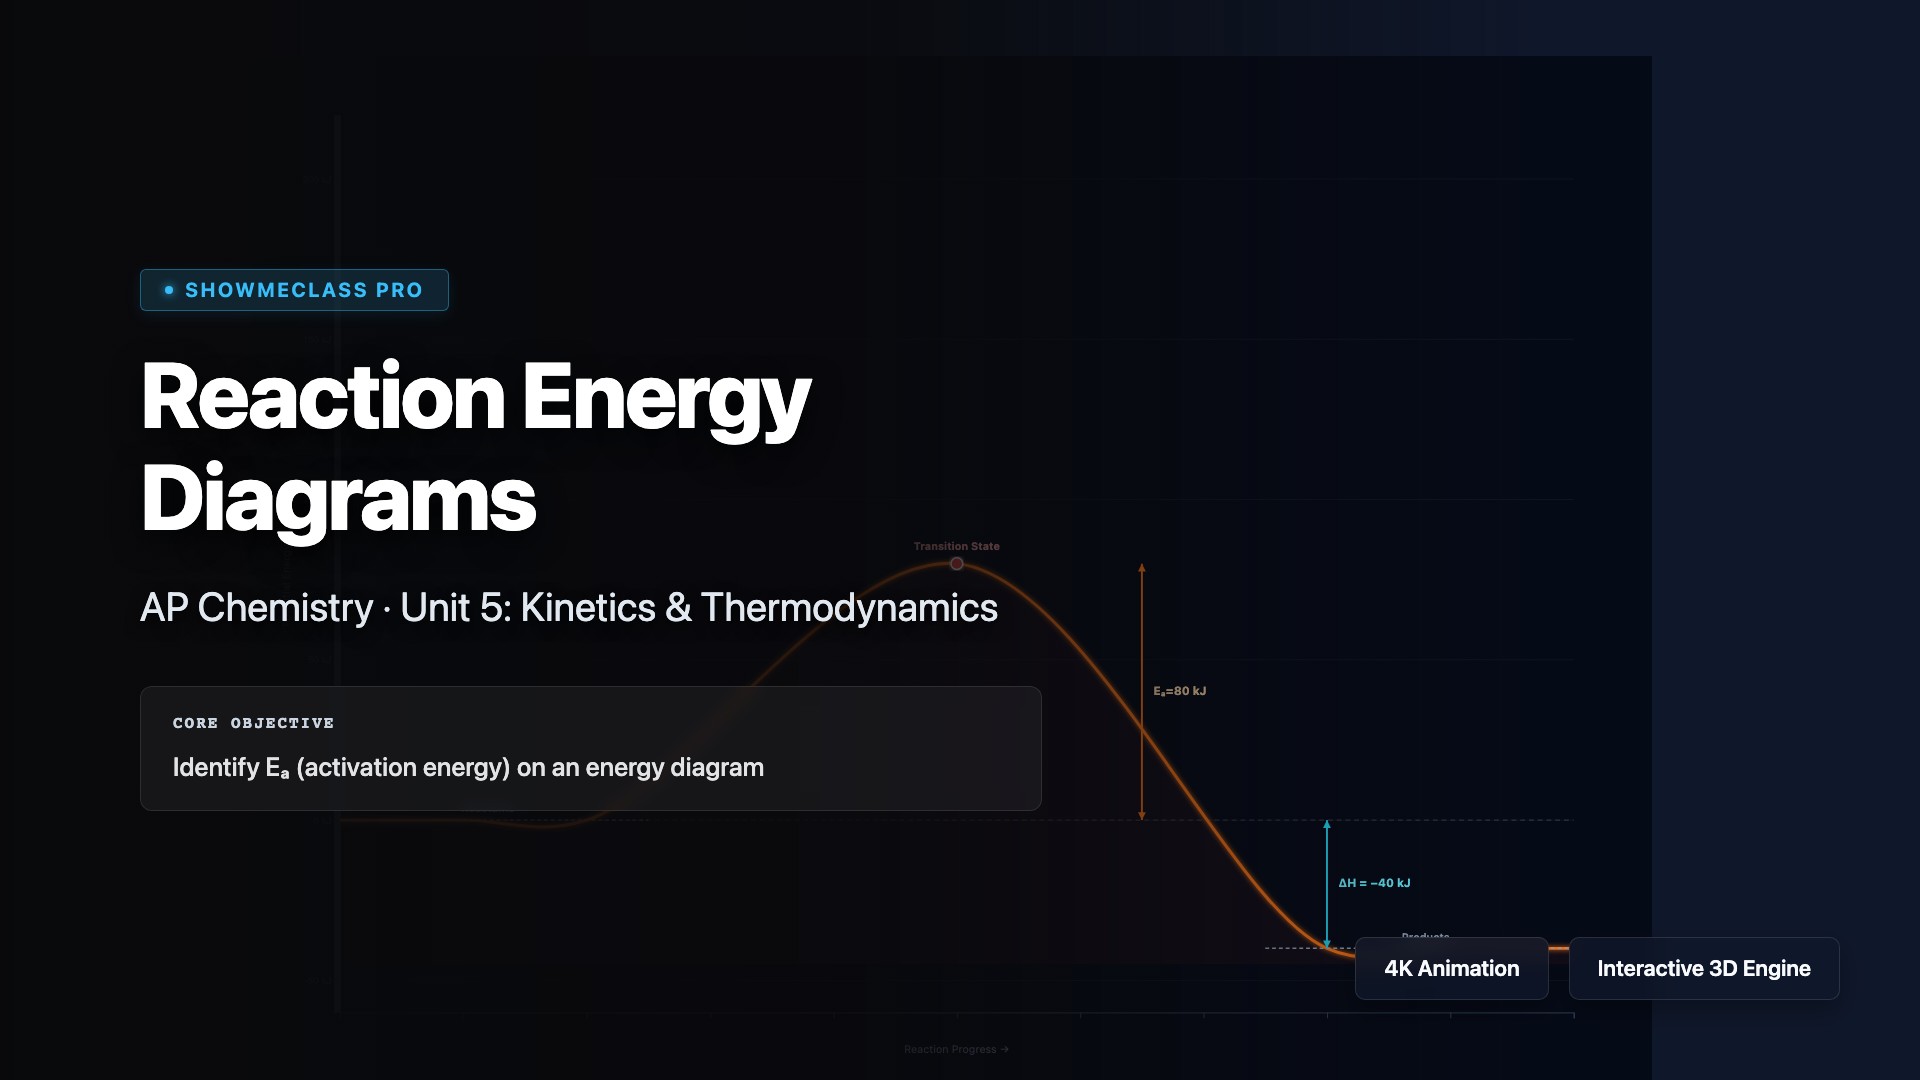
Reaction Energy Diagrams
Visualize reaction energy diagrams that plot potential energy versus reaction progress. Identify reactants, products, transition states, activation energy (Ea), and enthalpy change (ΔH). Understand how exothermic reactions release energy (ΔH < 0) while endothermic reactions absorb energy (ΔH > 0), and how catalysts lower activation energy without changing ΔH, thereby increasing reaction rate.
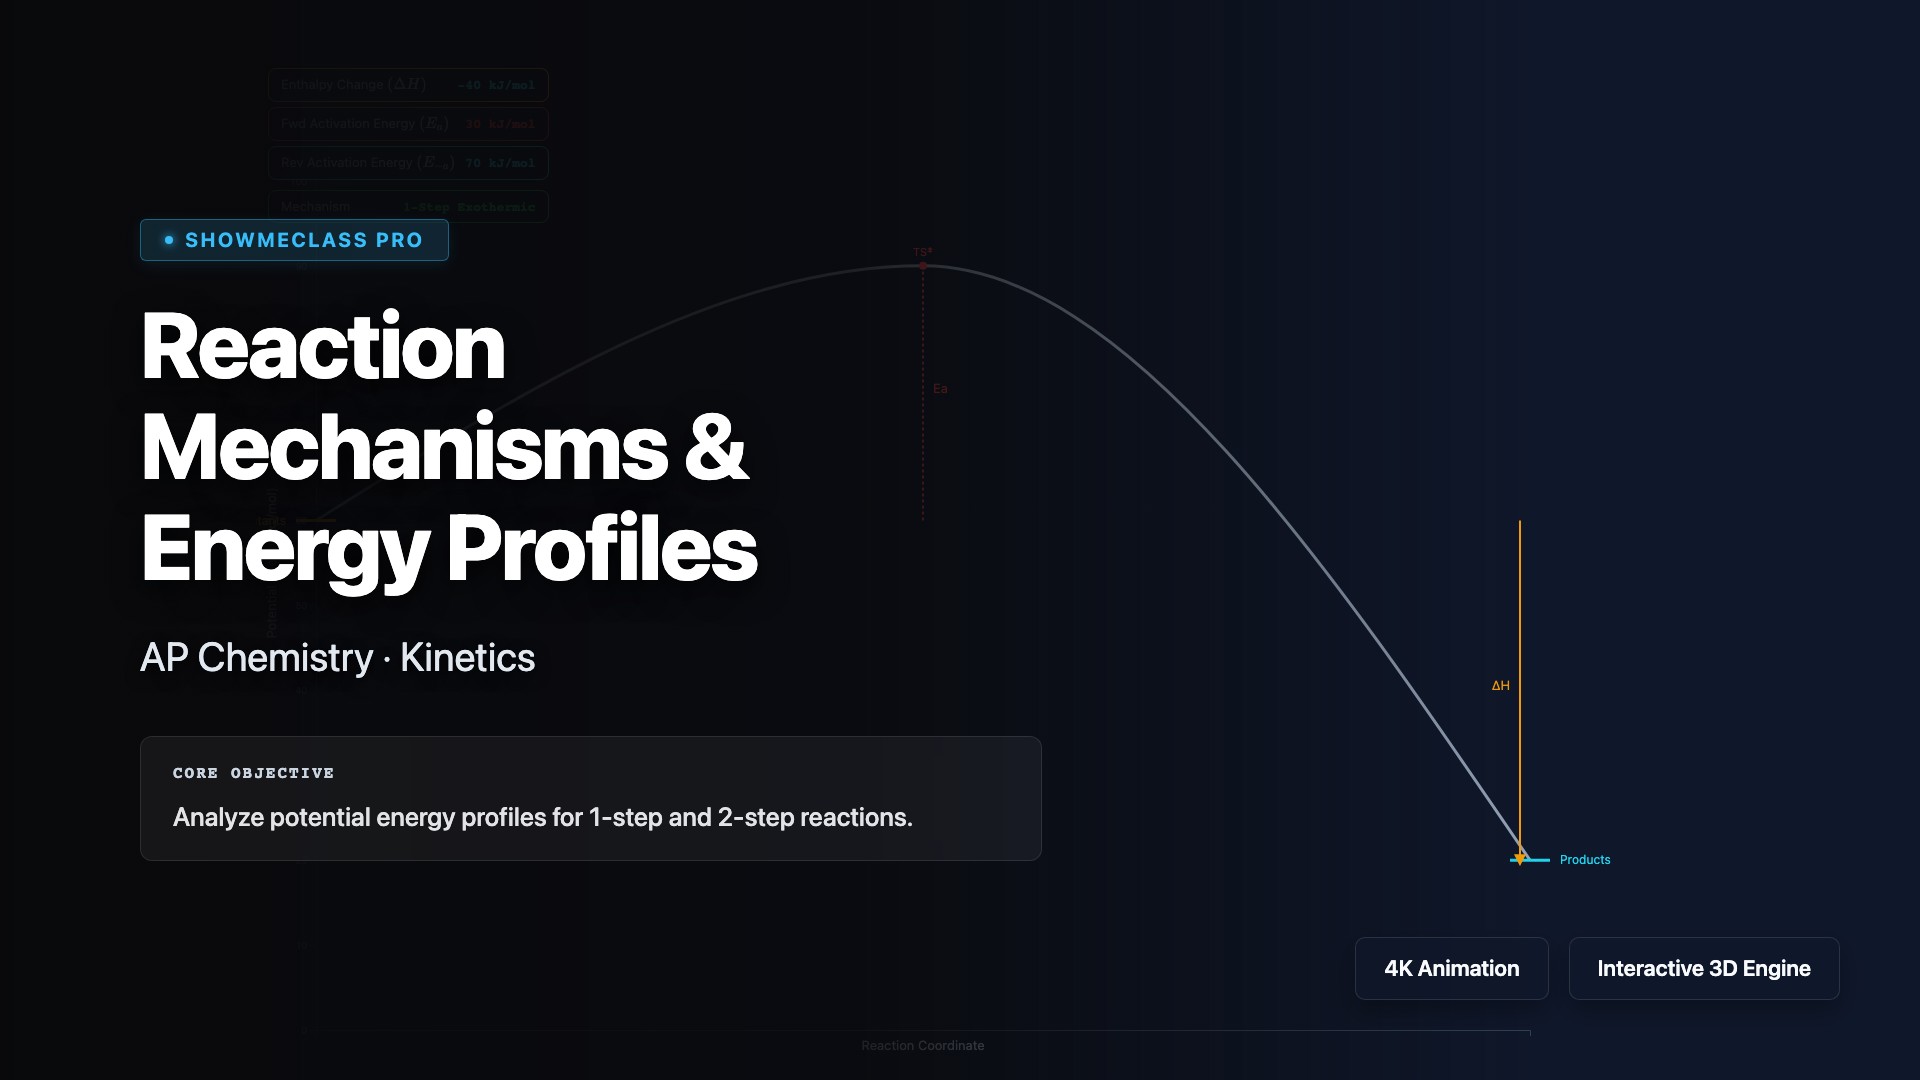
Reaction Mechanisms & Energy Profiles
Explore multi-step reaction mechanisms where elementary steps combine to give the overall reaction. Identify intermediates (produced then consumed), catalysts (consumed then regenerated), and the rate-determining step (slowest step with highest activation energy). Visualize energy profiles showing multiple transition states and understand how the mechanism must match the experimentally determined rate law.
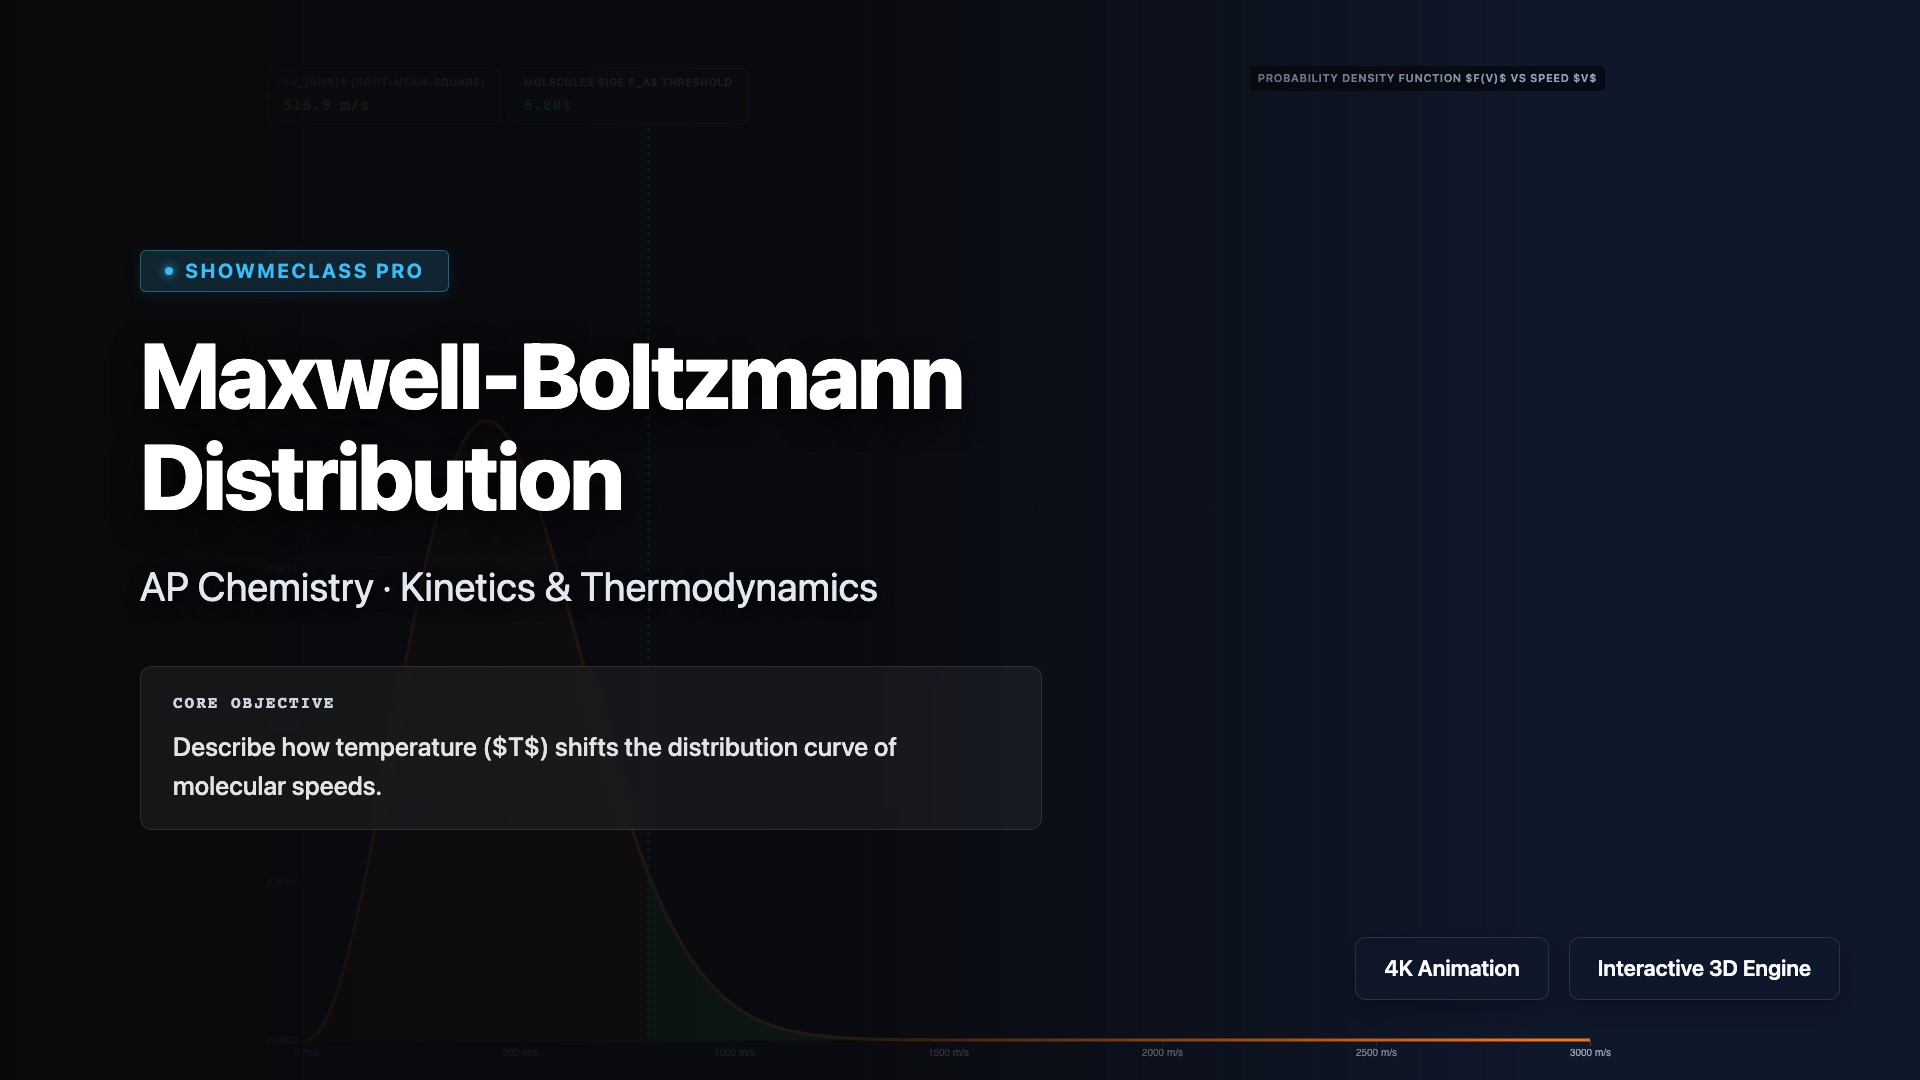
Maxwell-Boltzmann Distribution
Visualize how temperature and molar mass shift the kinetic energy distribution of particles, affecting the proportion that overcome the Activation Energy.