Showing 12 results

Reaction Quotient (Q vs K) Simulator
Determine the direction of equilibrium shifts using Le Chatelier's Principle. Visualize the theoretical NO2/N2O4 system and click to solve for roots to snap directly into theoretical dynamic equilibrium.
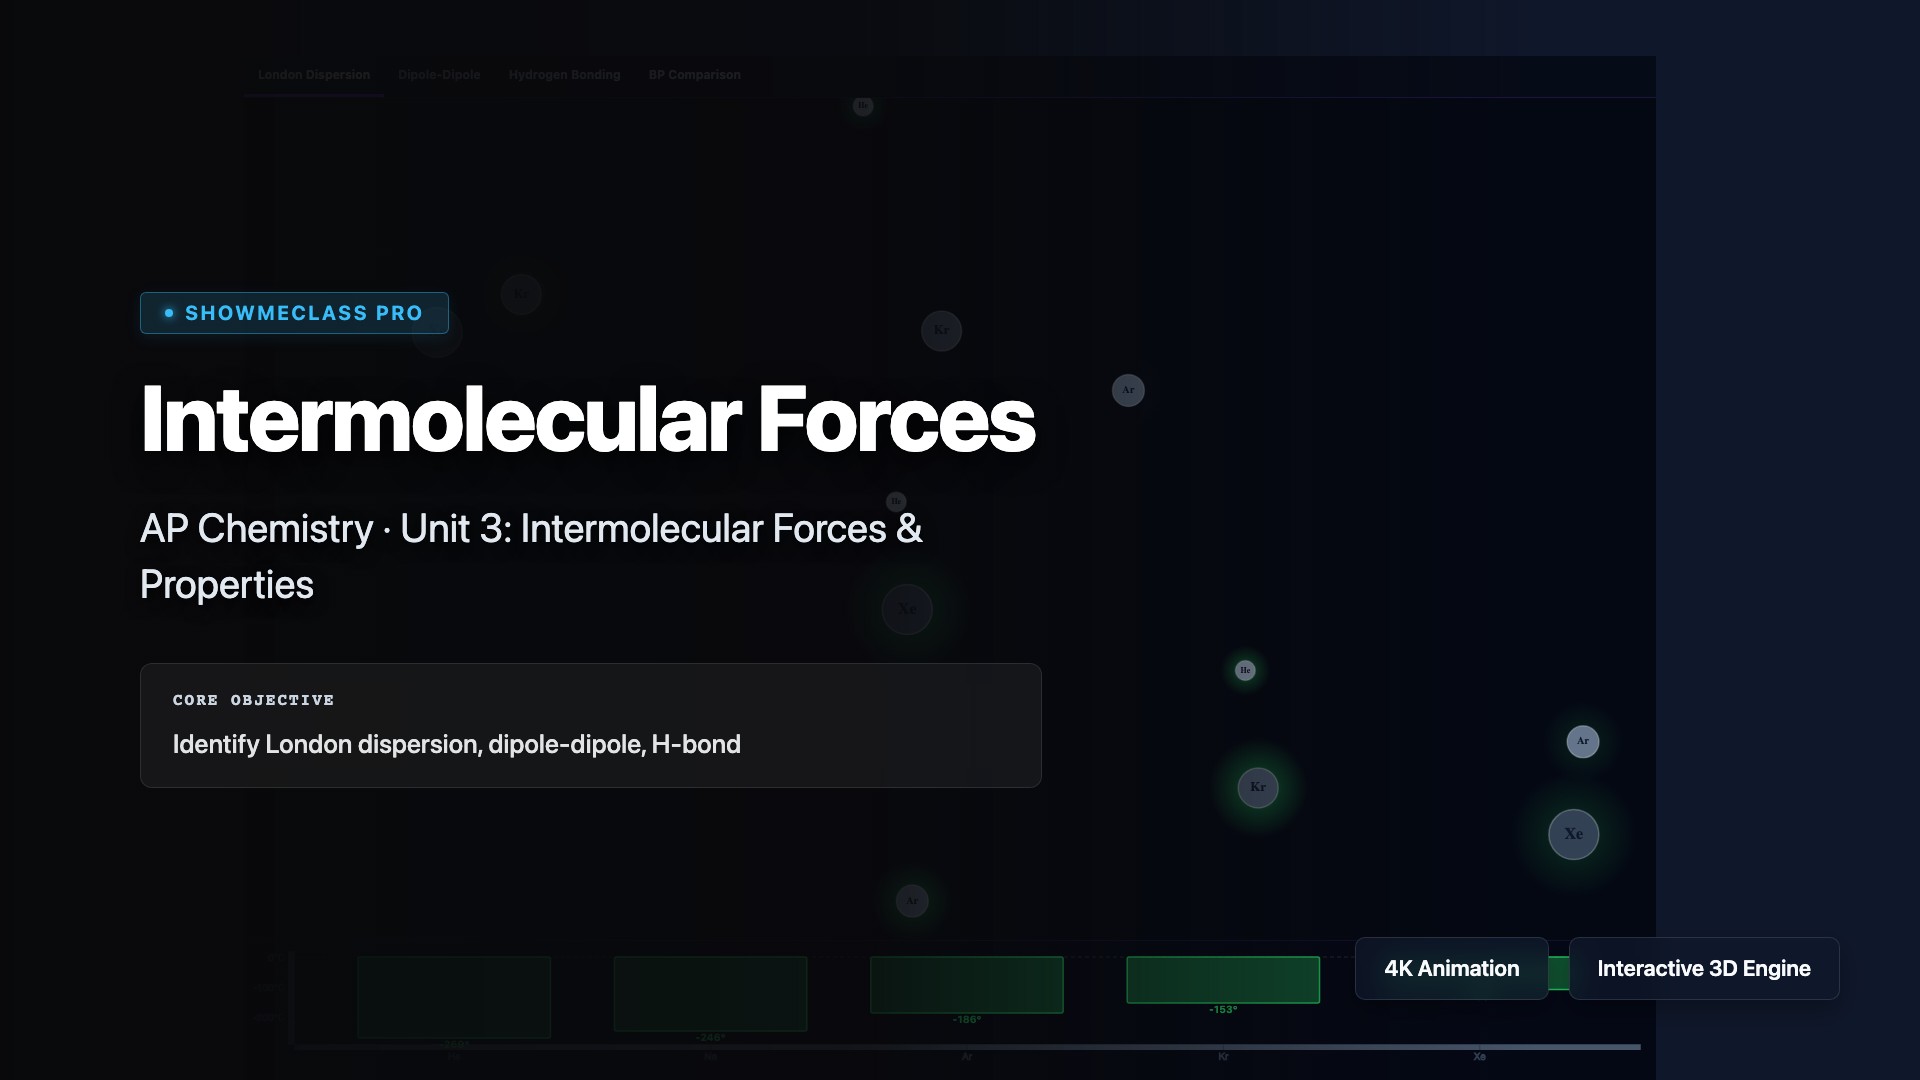
Intermolecular Forces & Phase Changes
Visually compare London Dispersion, Dipole-Dipole, and Hydrogen Bonding. Manipulate kinetic thermal energy to watch how differences in IMF strength determine exact melting and boiling point thresholds.
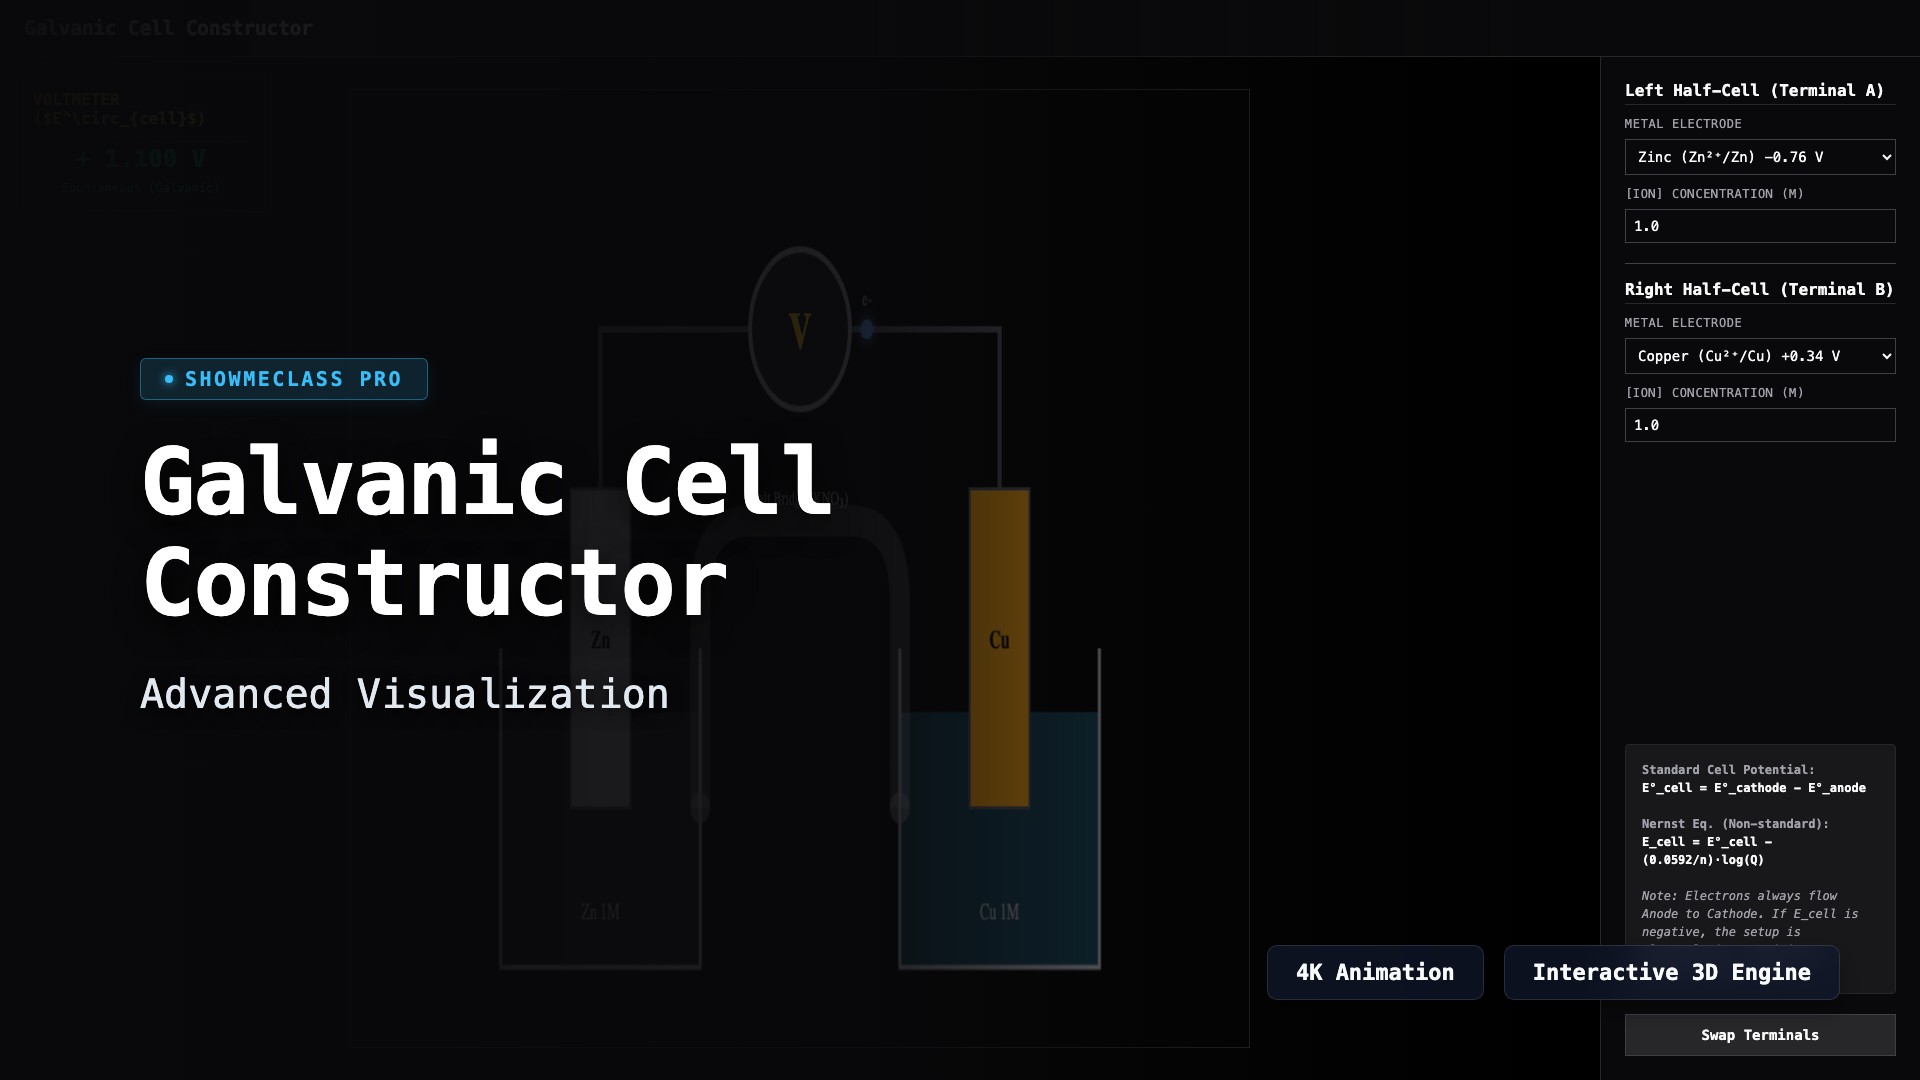
Galvanic Cell Constructor
Construct custom voltaic circuits using Zn, Cu, and Ag half-cells. The simulator utilizes real Standard Reduction Potentials and applies the Nernst Equation to calculate cell potential dynamically across varying molarities.

Half-Life & Radioactive Decay
Visualize stochastic exponential decay mapped against N(t) mathematical algorithms. Track Parent and Daughter isotope accumulation across customized half-lives in a real-time flashing particle engine.

Buffer System Dynamics
Visualize a macroscopic particle-level buffer system reacting to the influx of strong acids (H⁺) or strong bases (OH⁻). Observe Henderson-Hasselbalch equations dynamically adapt as the buffer capacity successfully resists dramatic pH changes.
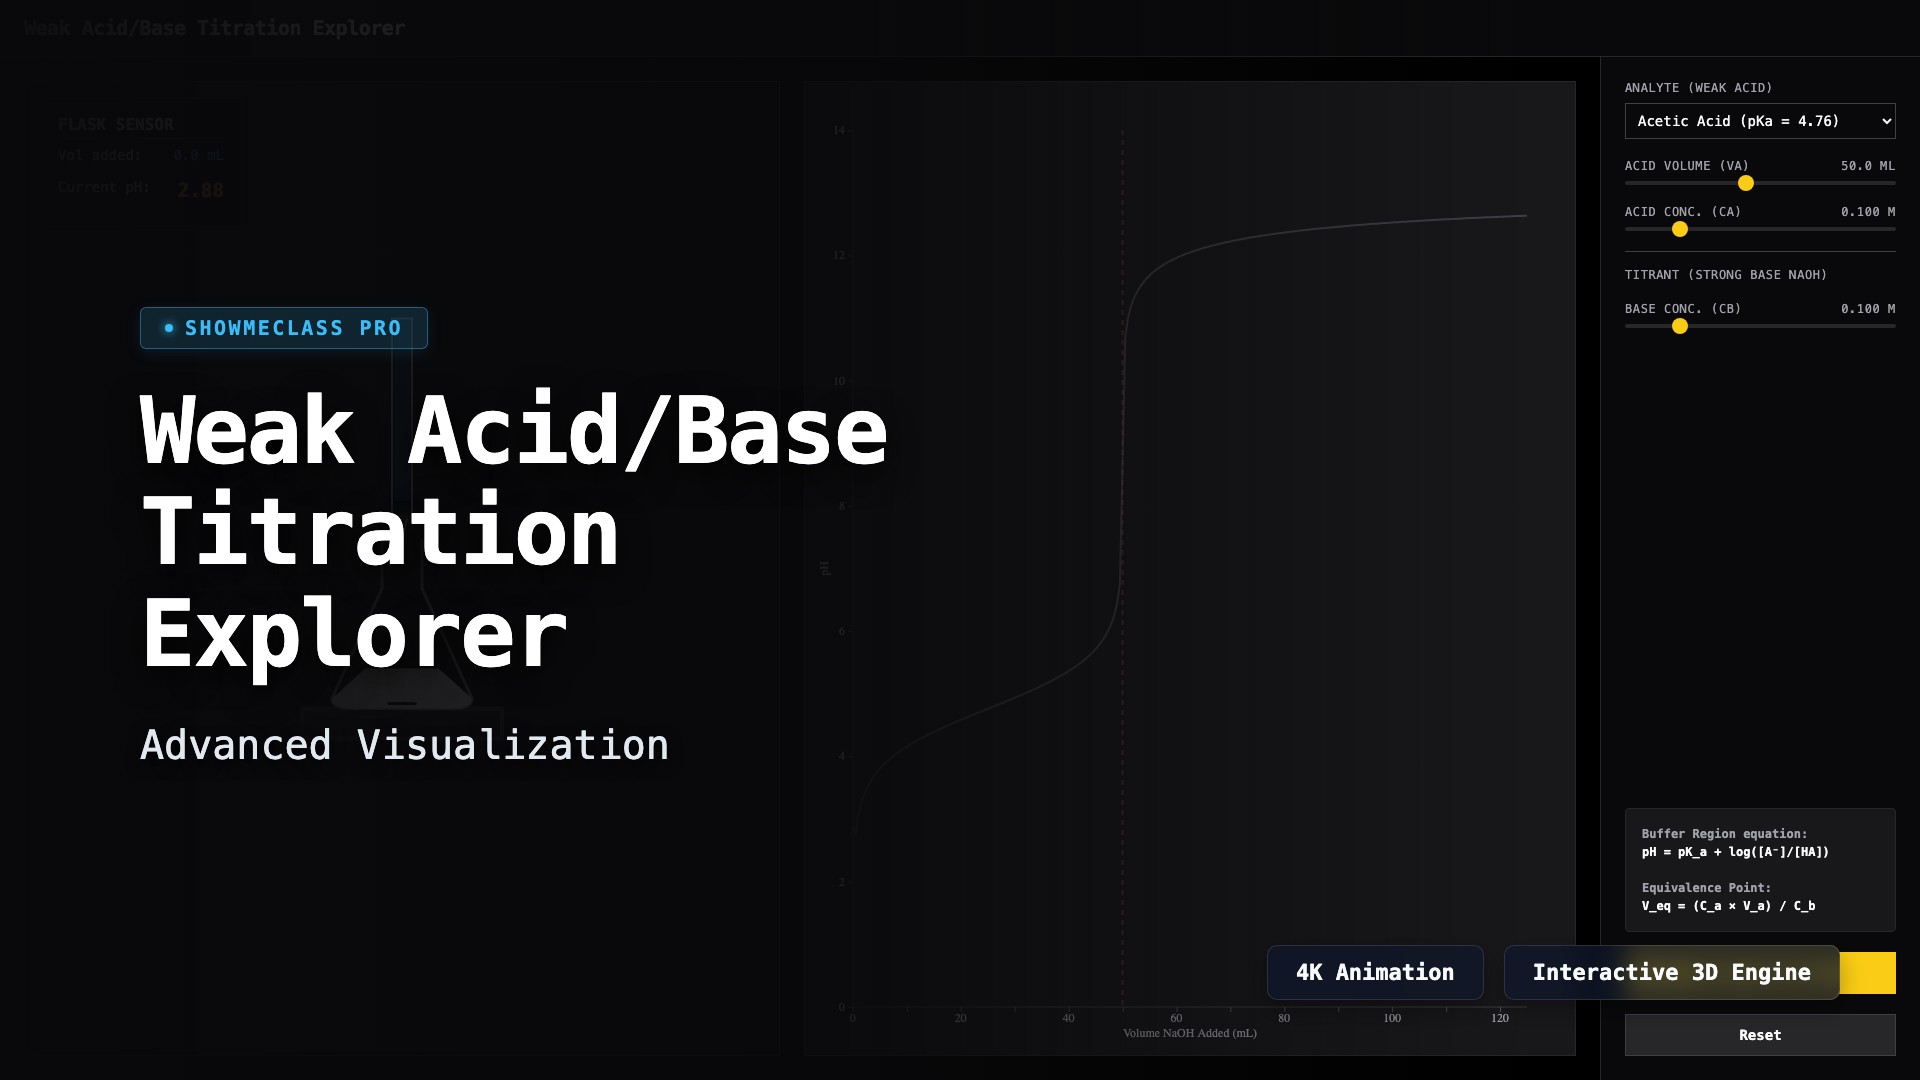
Weak Acid/Base Titration Explorer
Perform a simulated titration dropping strong base into a weak acid. The simulator mathematically calculates real-time buffer regions, half-equivalence points, and post-equivalence spikes dynamically, plotting the exact sigmoidal pH titration curve.
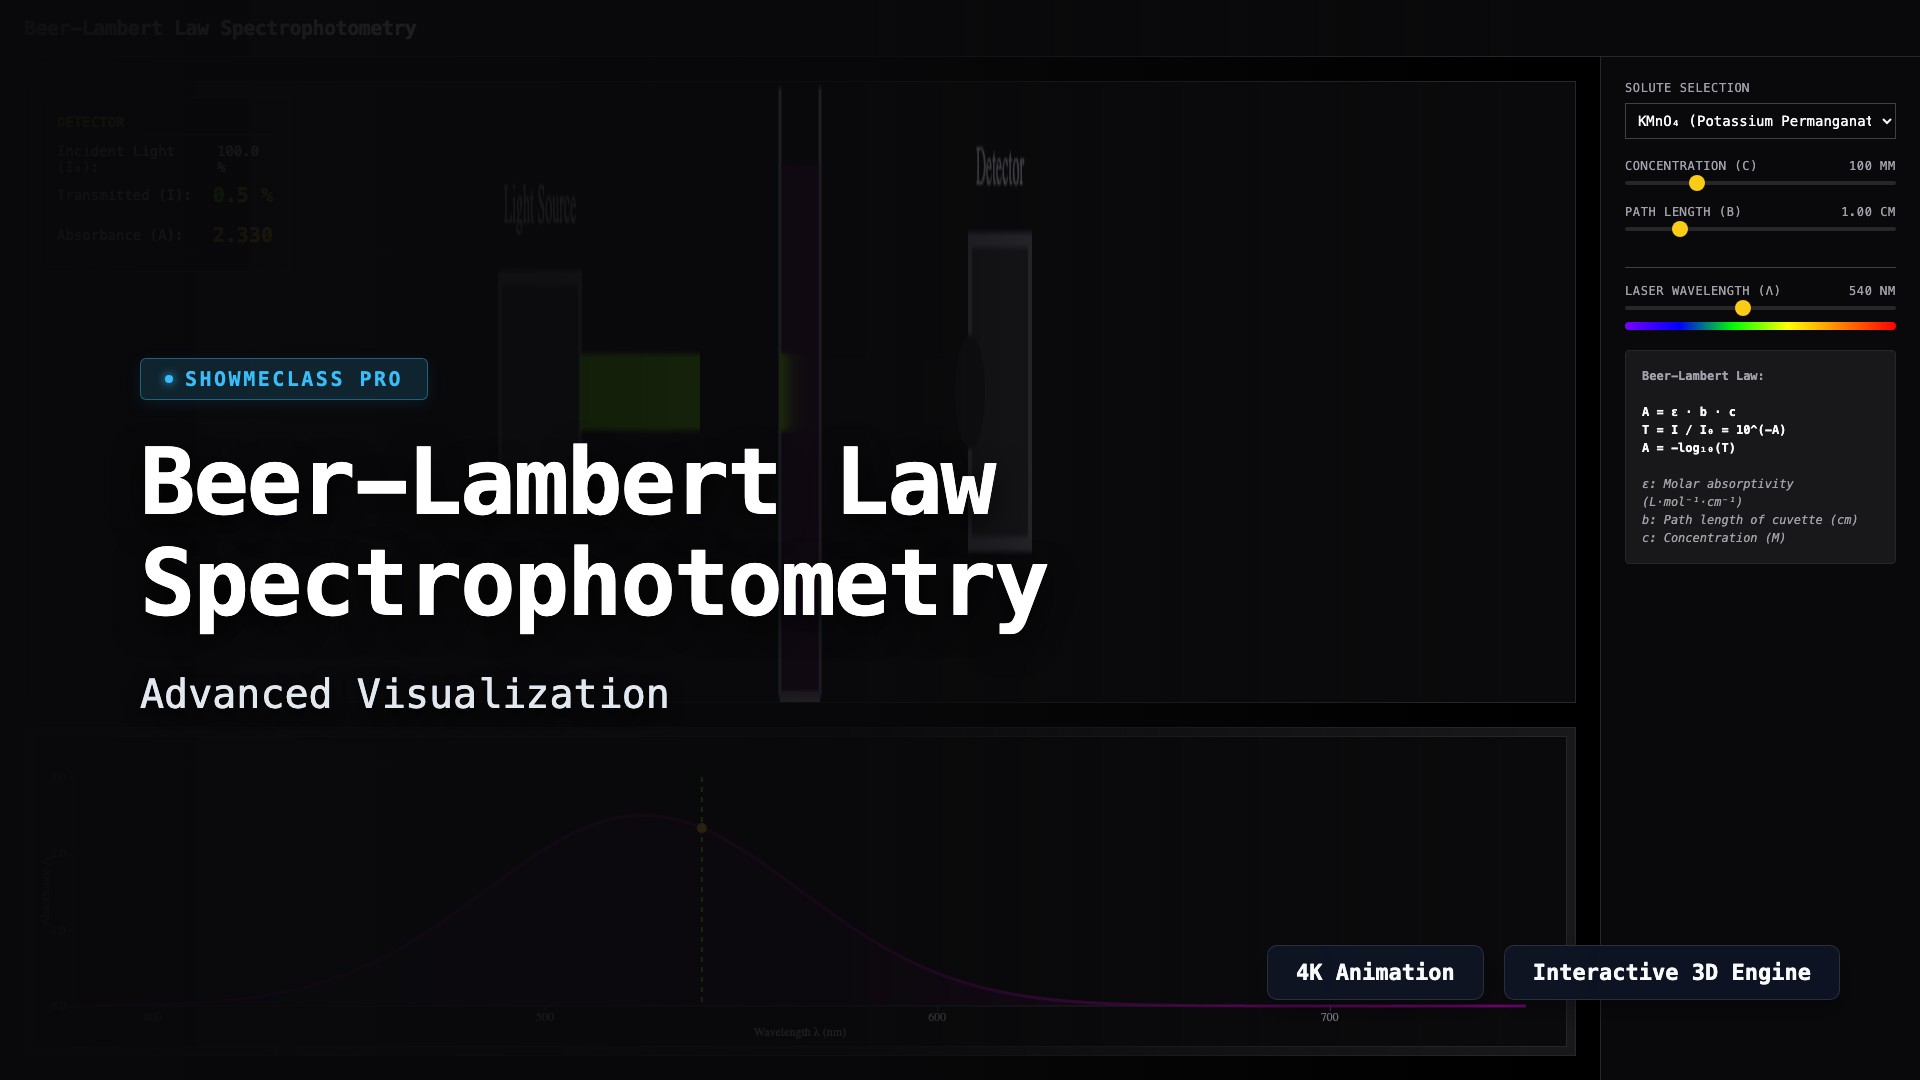
Beer-Lambert Law Spectrophotometry
Visualize the principles of spectrophotometry. Adjust wavelength, concentration, and cuvette path length to observe how light absorption changes dynamically according to the Beer-Lambert Law.
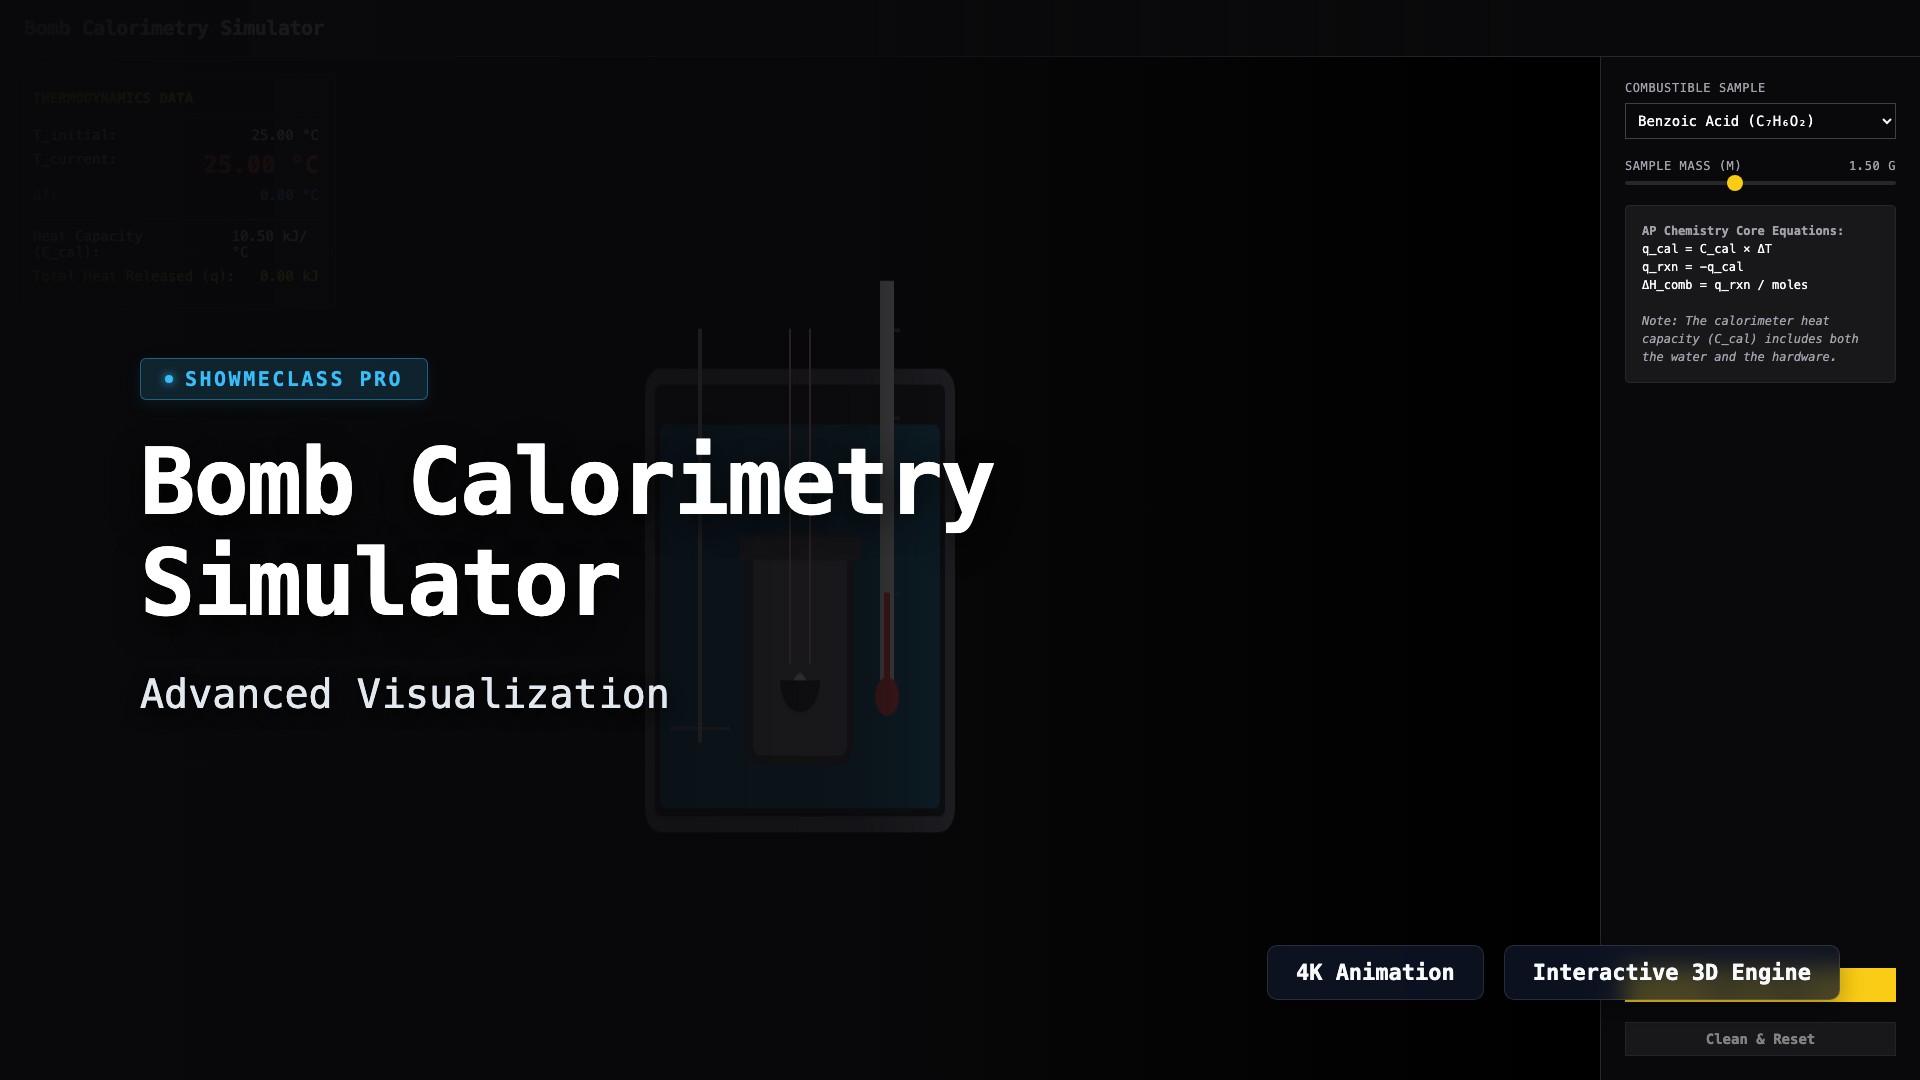
Bomb Calorimetry Simulator
Simulate a constant-volume bomb calorimeter to compute the molar heat of combustion (ΔH_comb). Ignite different organic samples and dynamically measure the highly precise temperature rise to calculate the heat absorbed by the system.
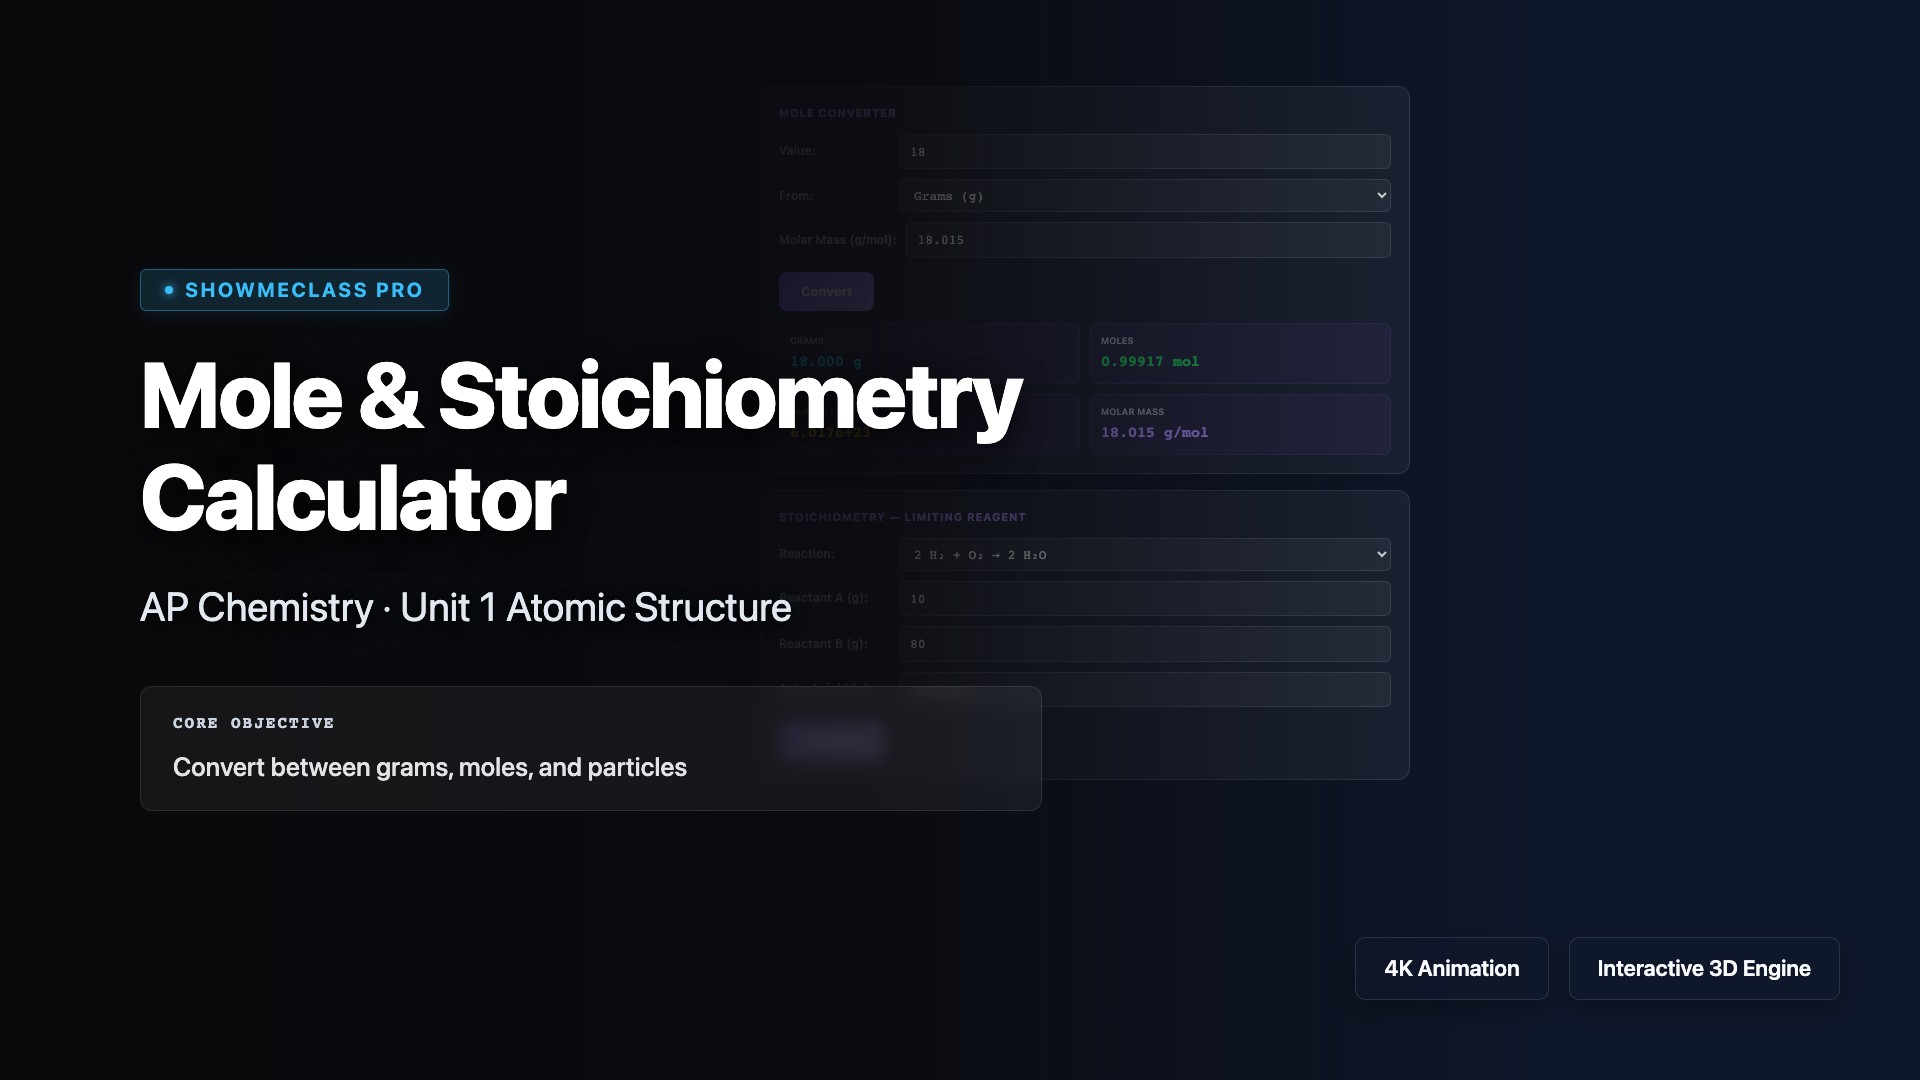
Mole Concept & Stoichiometry Calculator
Convert between grams, moles, and particles. Determine limiting/excess reagents with 4 preset reactions. Calculate theoretical yield and percent yield.

Isotope Notation & Average Atomic Mass
Explore isotope notation for 7 elements. See mass number, atomic number, proton/neutron counts, and calculate weighted average atomic mass from natural abundances.

Phase Diagram Explorer
Interactive phase diagrams for H₂O and CO₂. Explore triple points, critical points, and supercritical fluid regions. Identify the phase at any T,P coordinate.
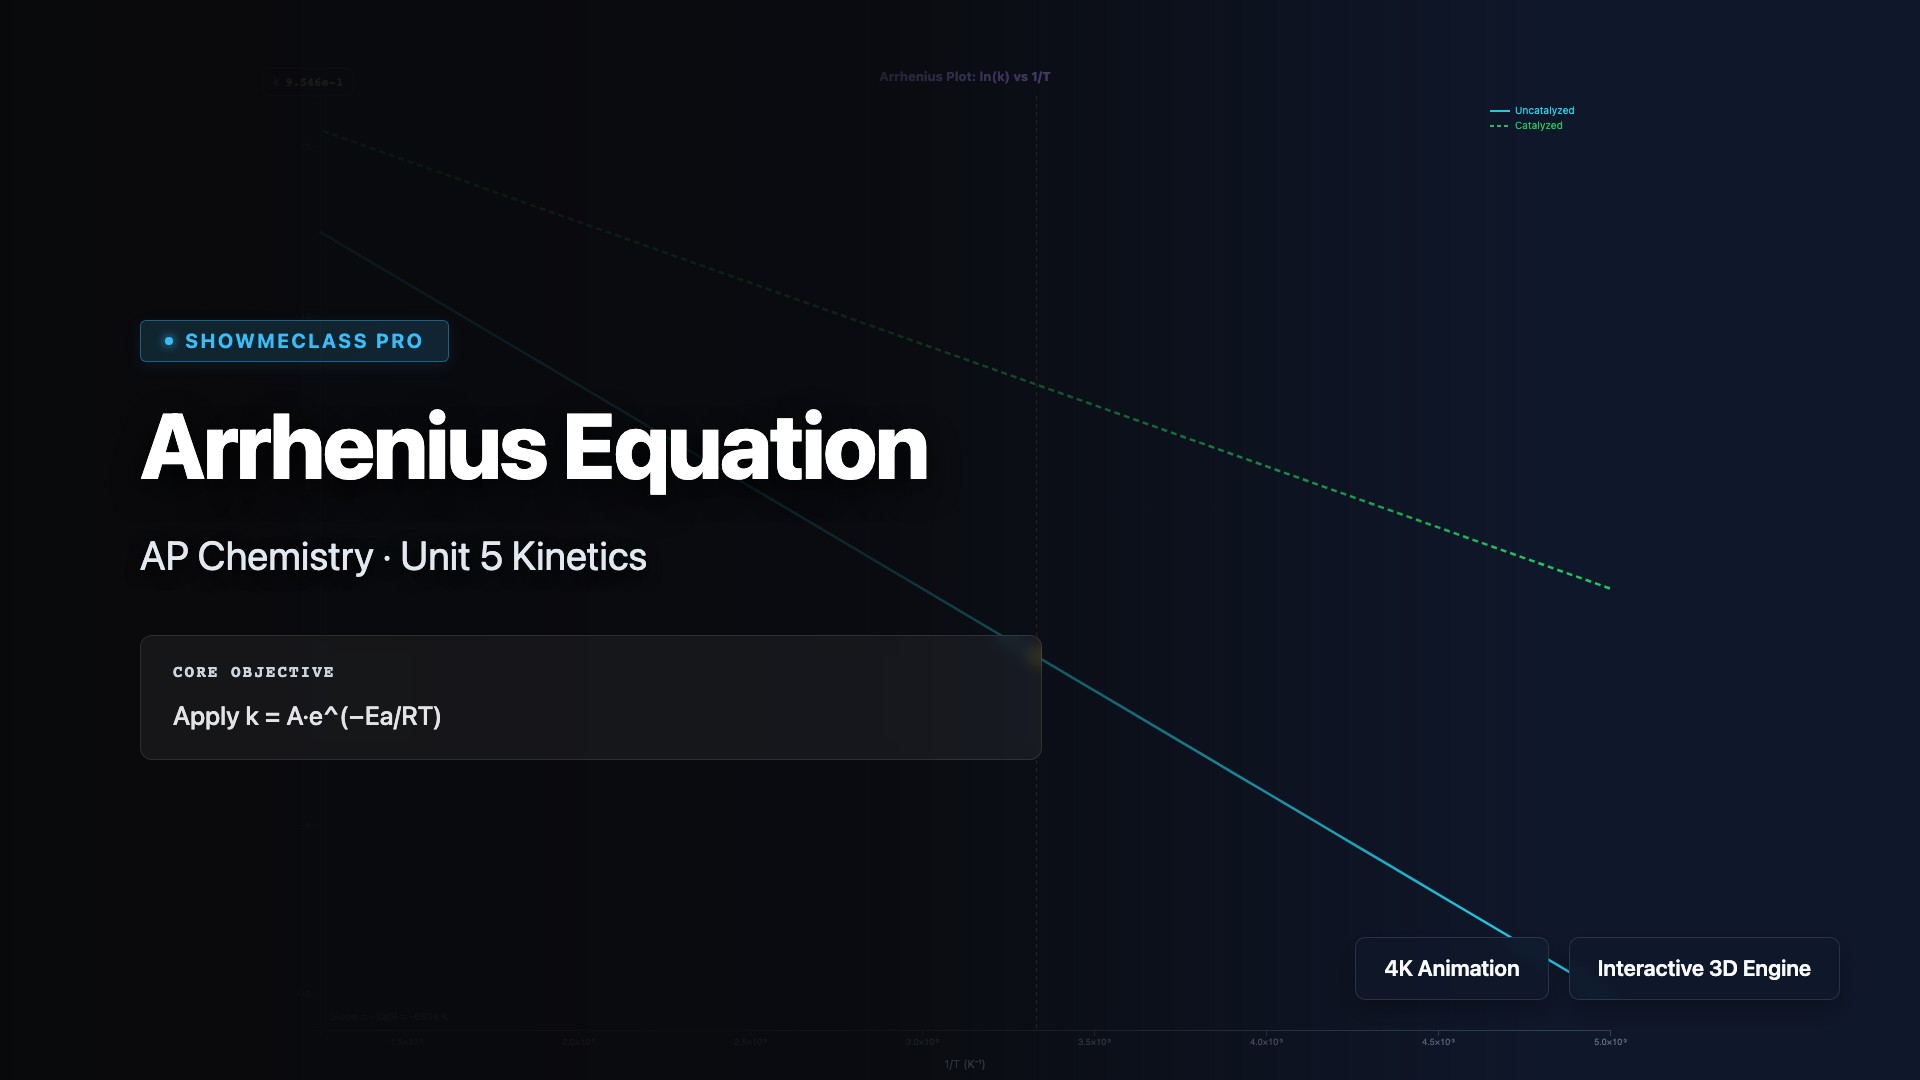
Arrhenius Equation (Rate vs Temperature)
Visualize the Arrhenius equation k = Ae^(−Ea/RT) with adjustable Ea and temperature. Compare catalyzed vs uncatalyzed reactions on a ln(k) vs 1/T plot.