
Showing 12 results
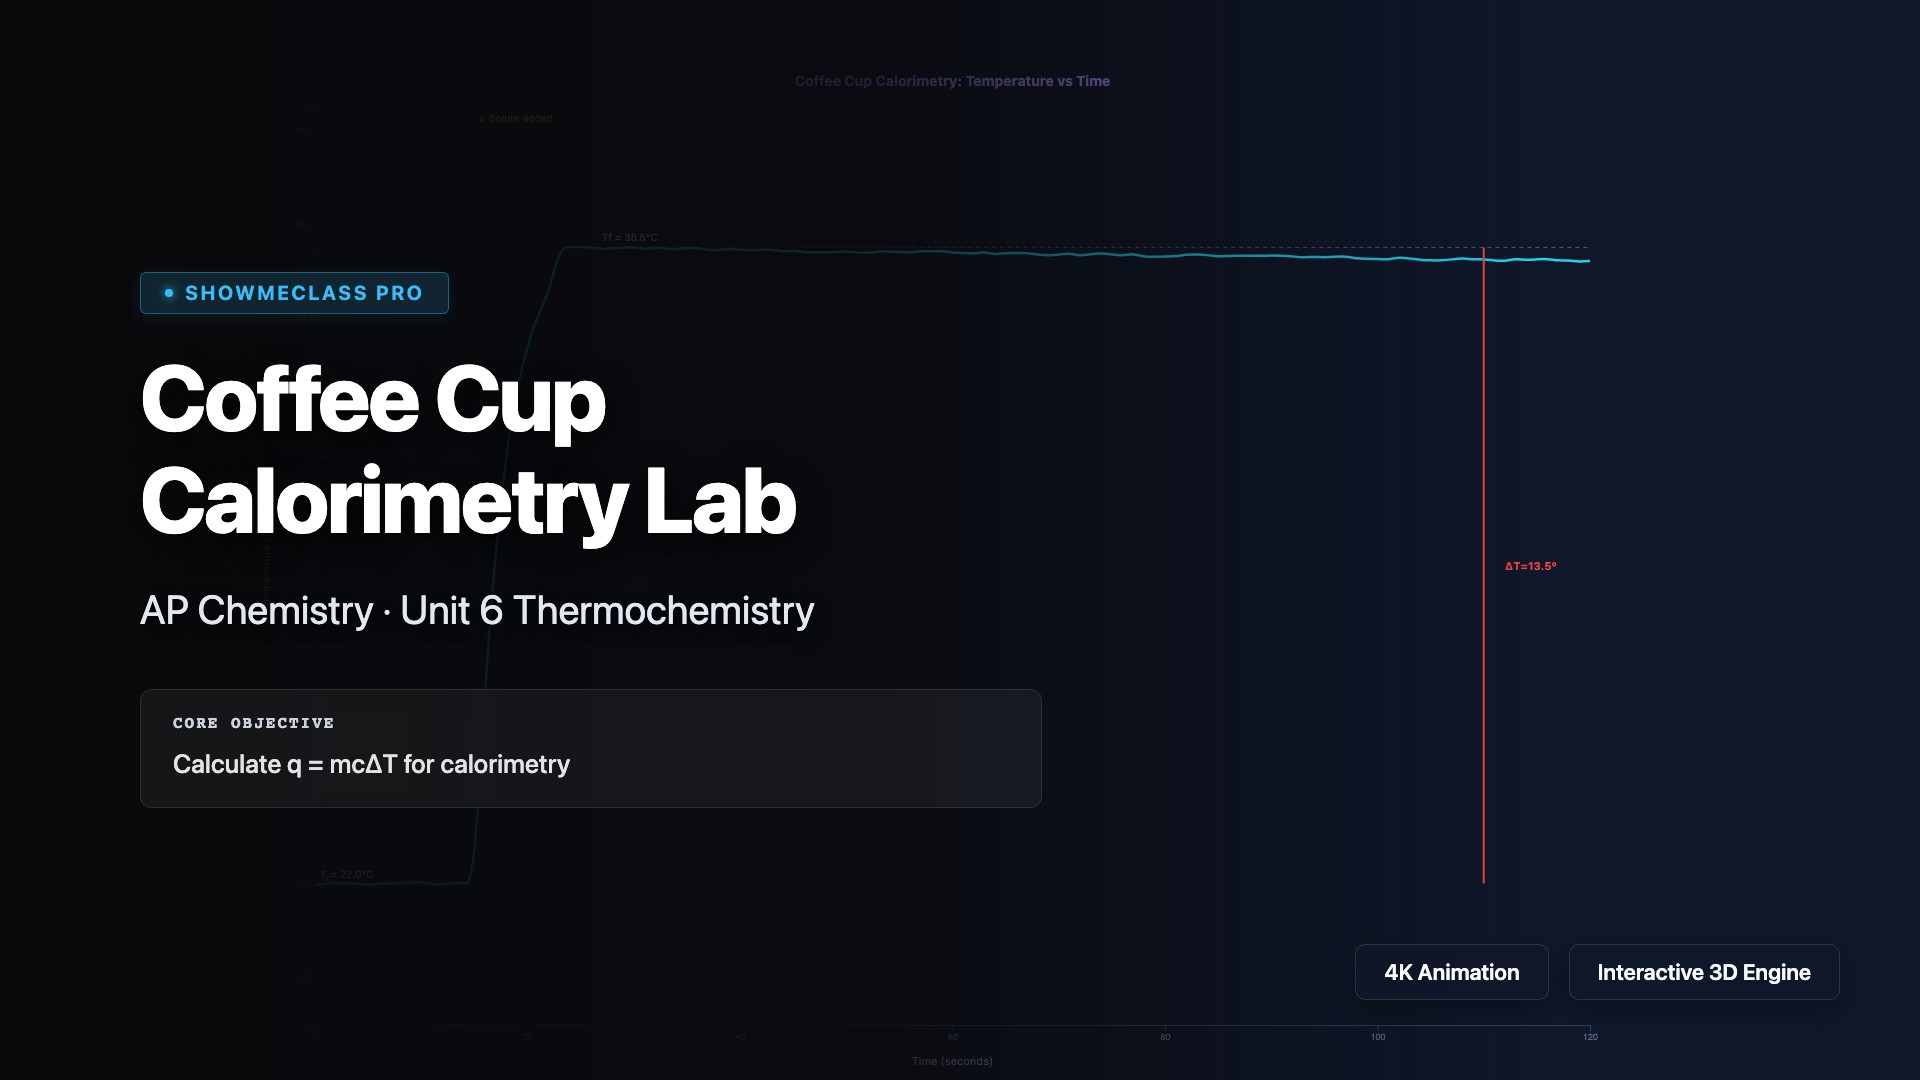
Coffee Cup Calorimetry Lab
Virtual coffee cup calorimetry lab with interactive temperature vs time graph. Calculate q=mcΔT, determine qrxn and ΔH from experimental data. Adjustable mass, initial/final temperature, and moles of solute. Automatically classifies reactions as exothermic or endothermic with step-by-step calculation display.
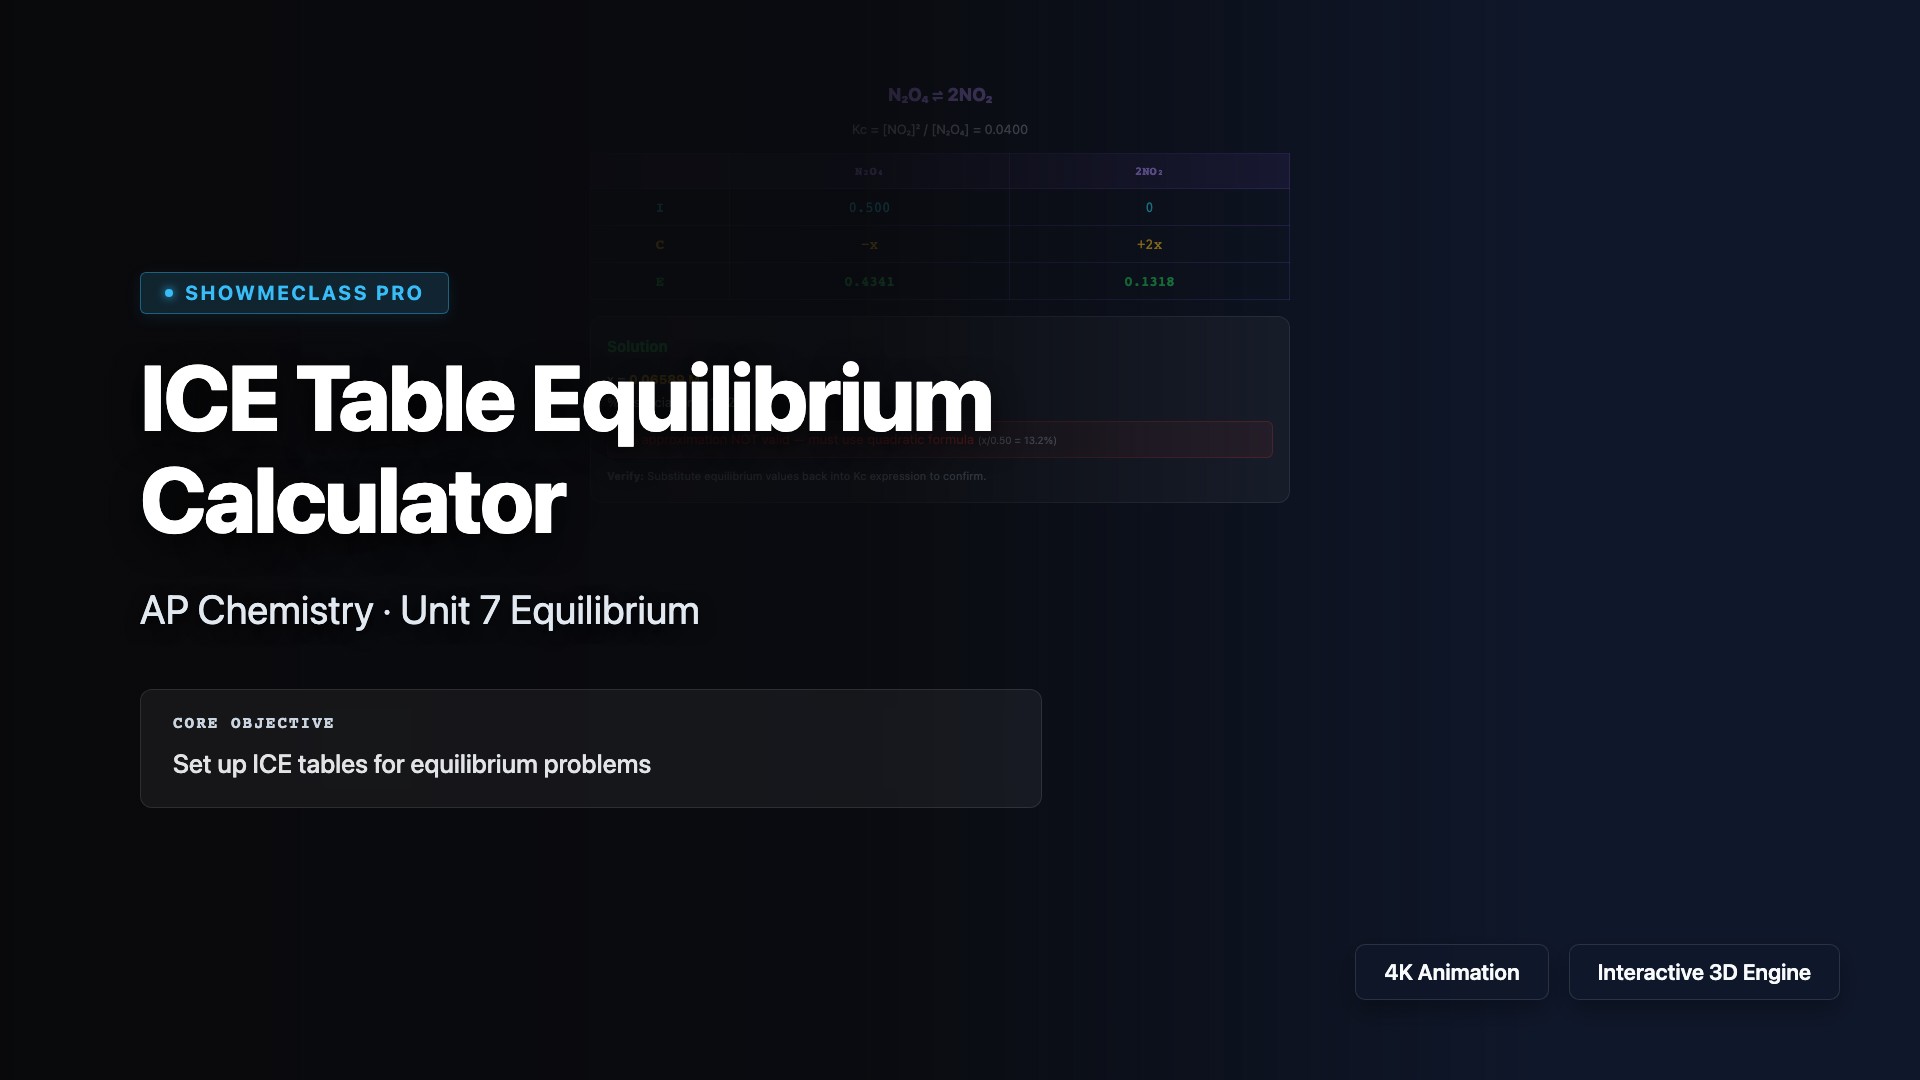
ICE Table Equilibrium Calculator
Step-by-step ICE table solver for 4 equilibrium reaction types (N₂O₄⇌2NO₂, H₂+I₂⇌2HI, PCl₅⇌PCl₃+Cl₂, CO+H₂O⇌CO₂+H₂). Adjustable Kc and initial concentration with automatic solving. Includes 5% approximation validity check and verification reminder.
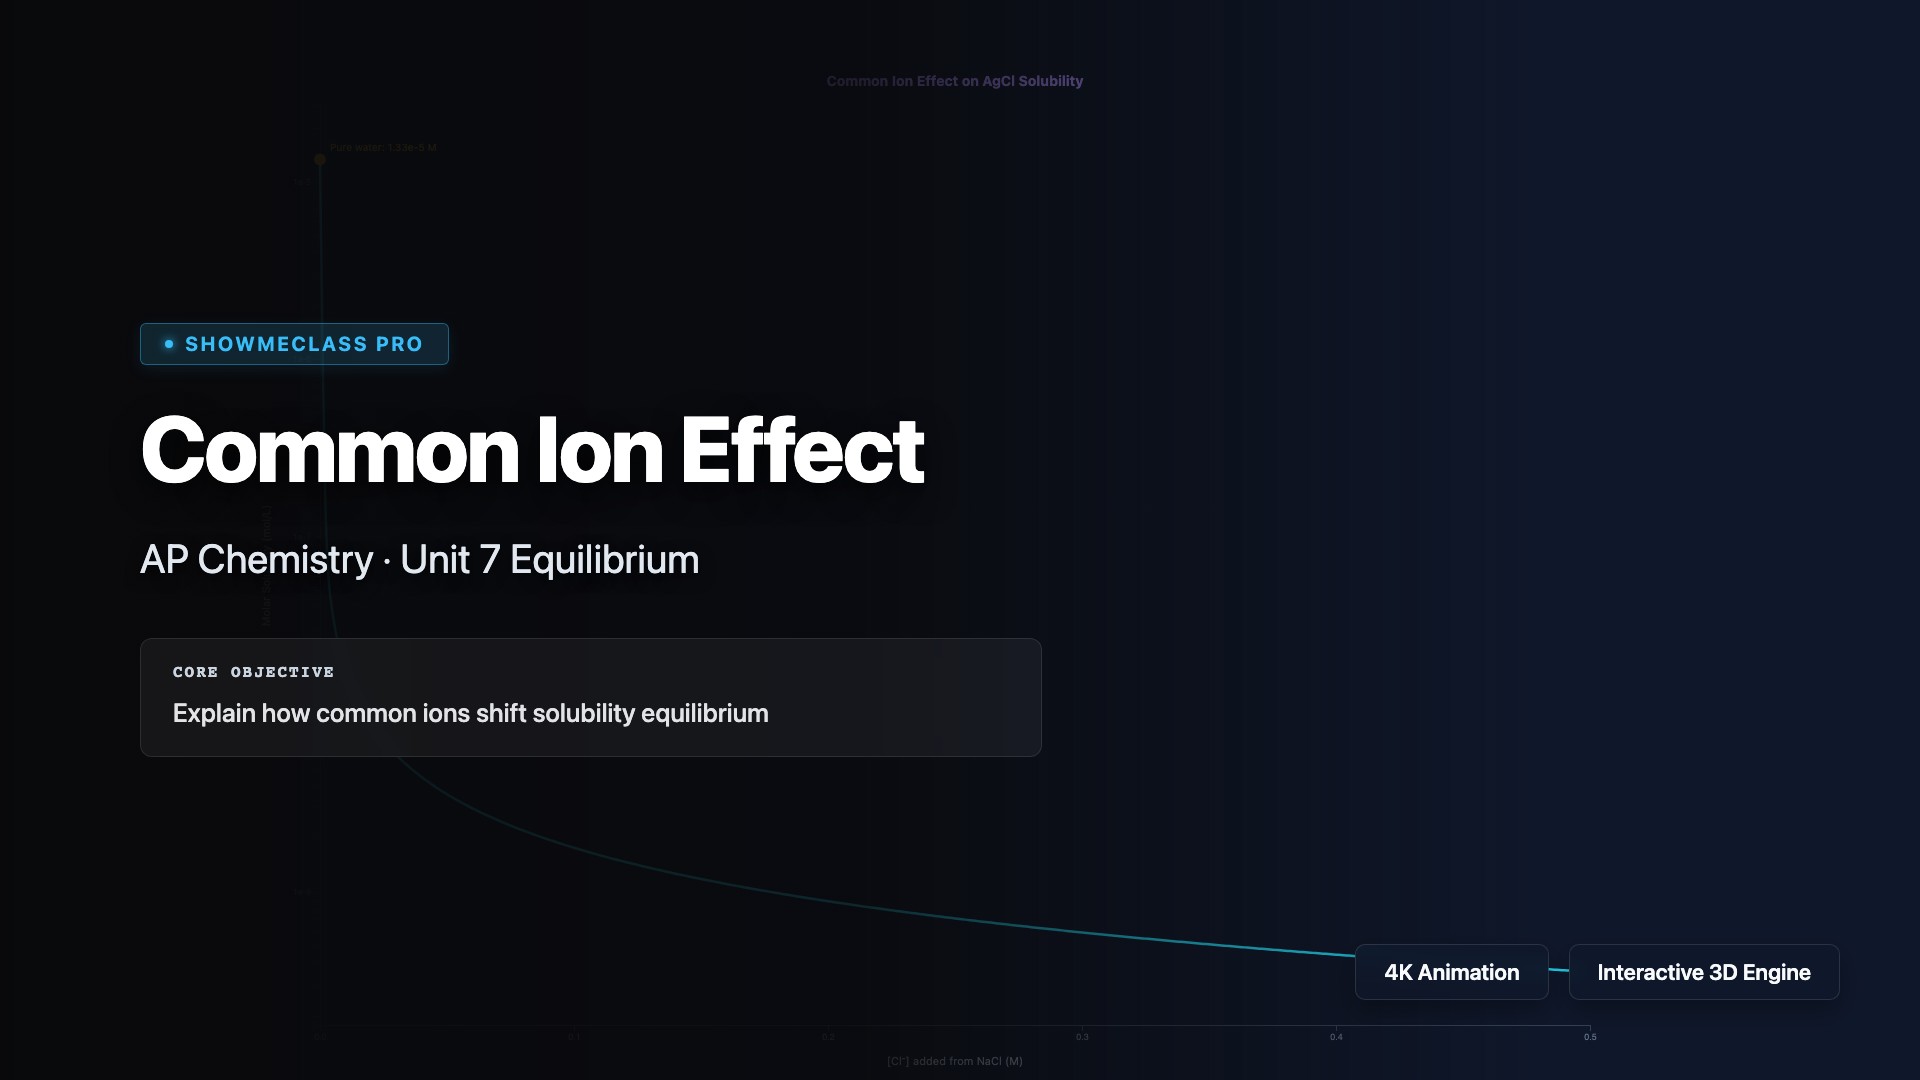
Common Ion Effect on Solubility
Interactive visualization of common ion effect on solubility for 4 salts (AgCl, PbCl₂, BaSO₄, CaF₂). Log-scale solubility vs common ion concentration graph with Le Chatelier's principle explanation. Shows dramatic solubility decrease with added common ion and percentage reduction calculation.
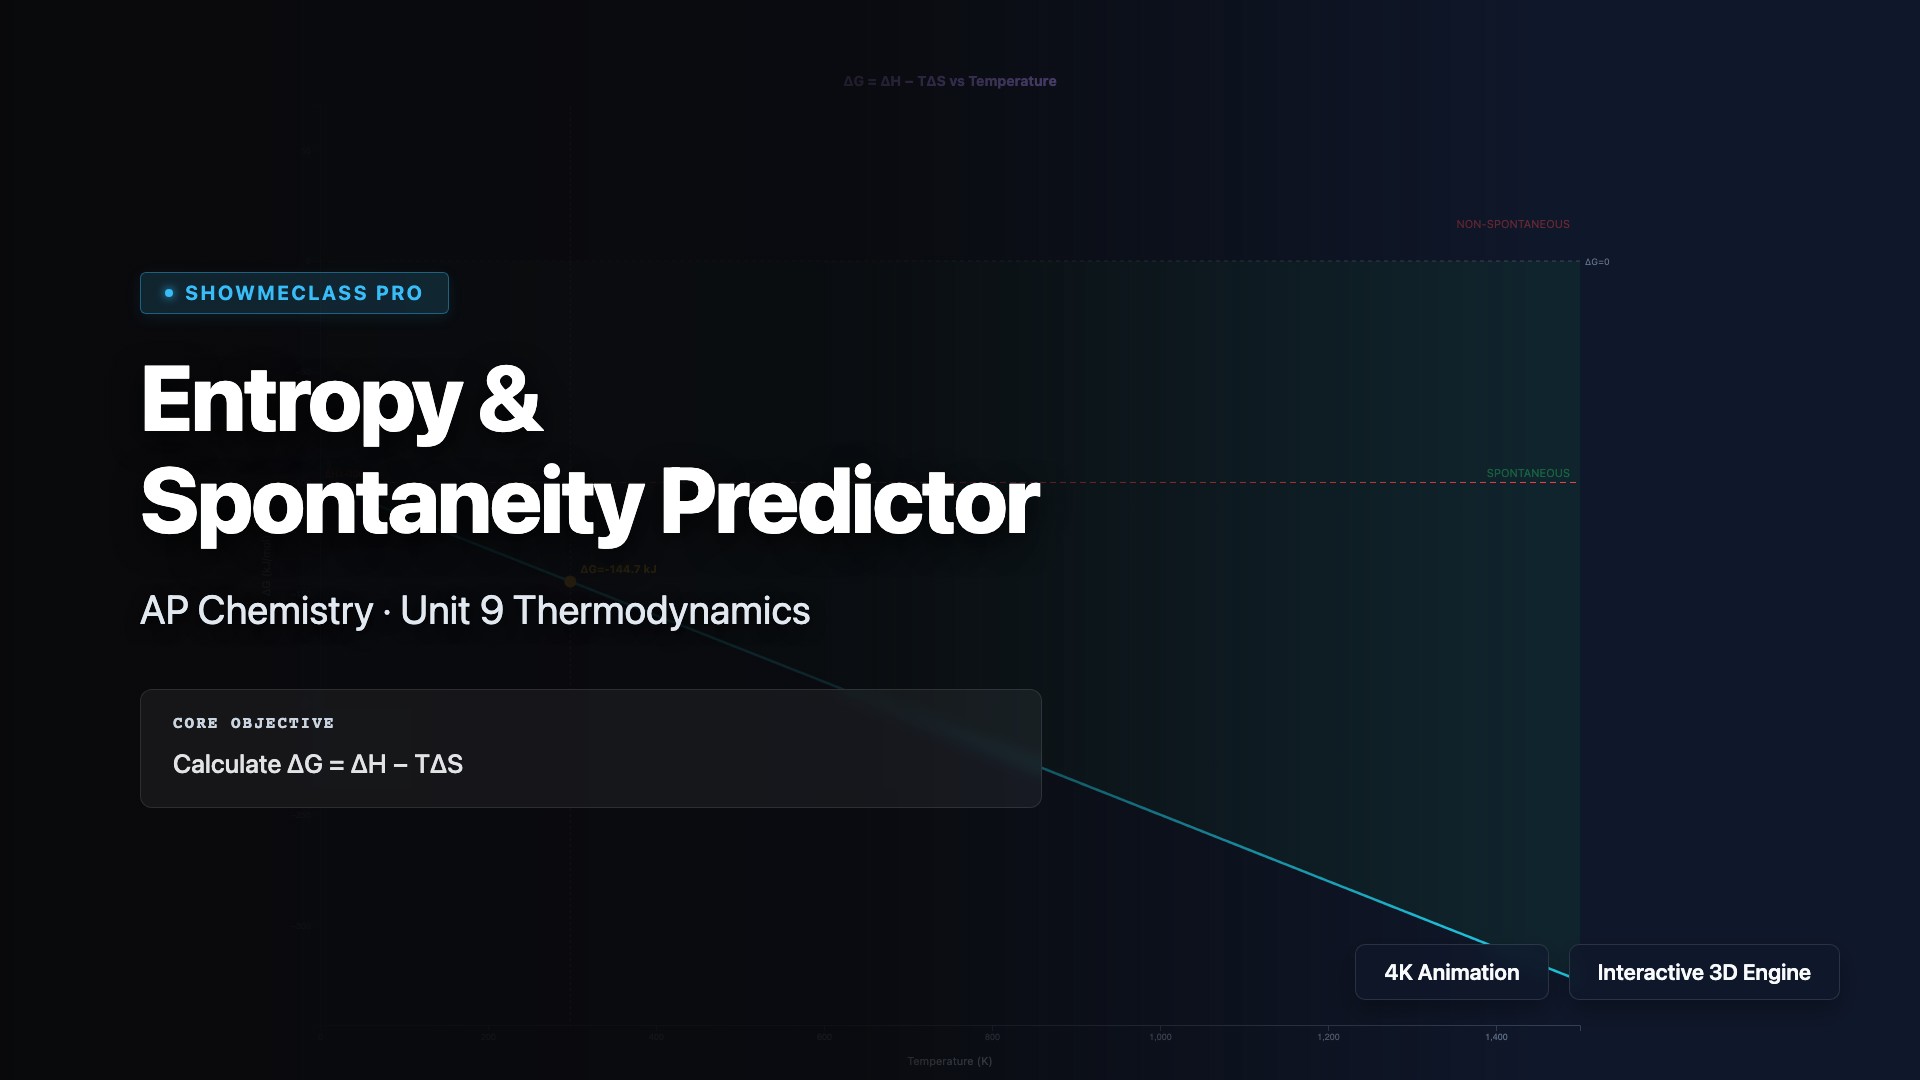
Entropy & Spontaneity Predictor
Interactive ΔG = ΔH − TΔS graph with adjustable enthalpy, entropy, and temperature. Visualizes Gibbs free energy vs temperature with spontaneous/non-spontaneous shading. Automatically determines crossover temperature and classifies into 4 ΔH/ΔS sign combinations with detailed explanations.
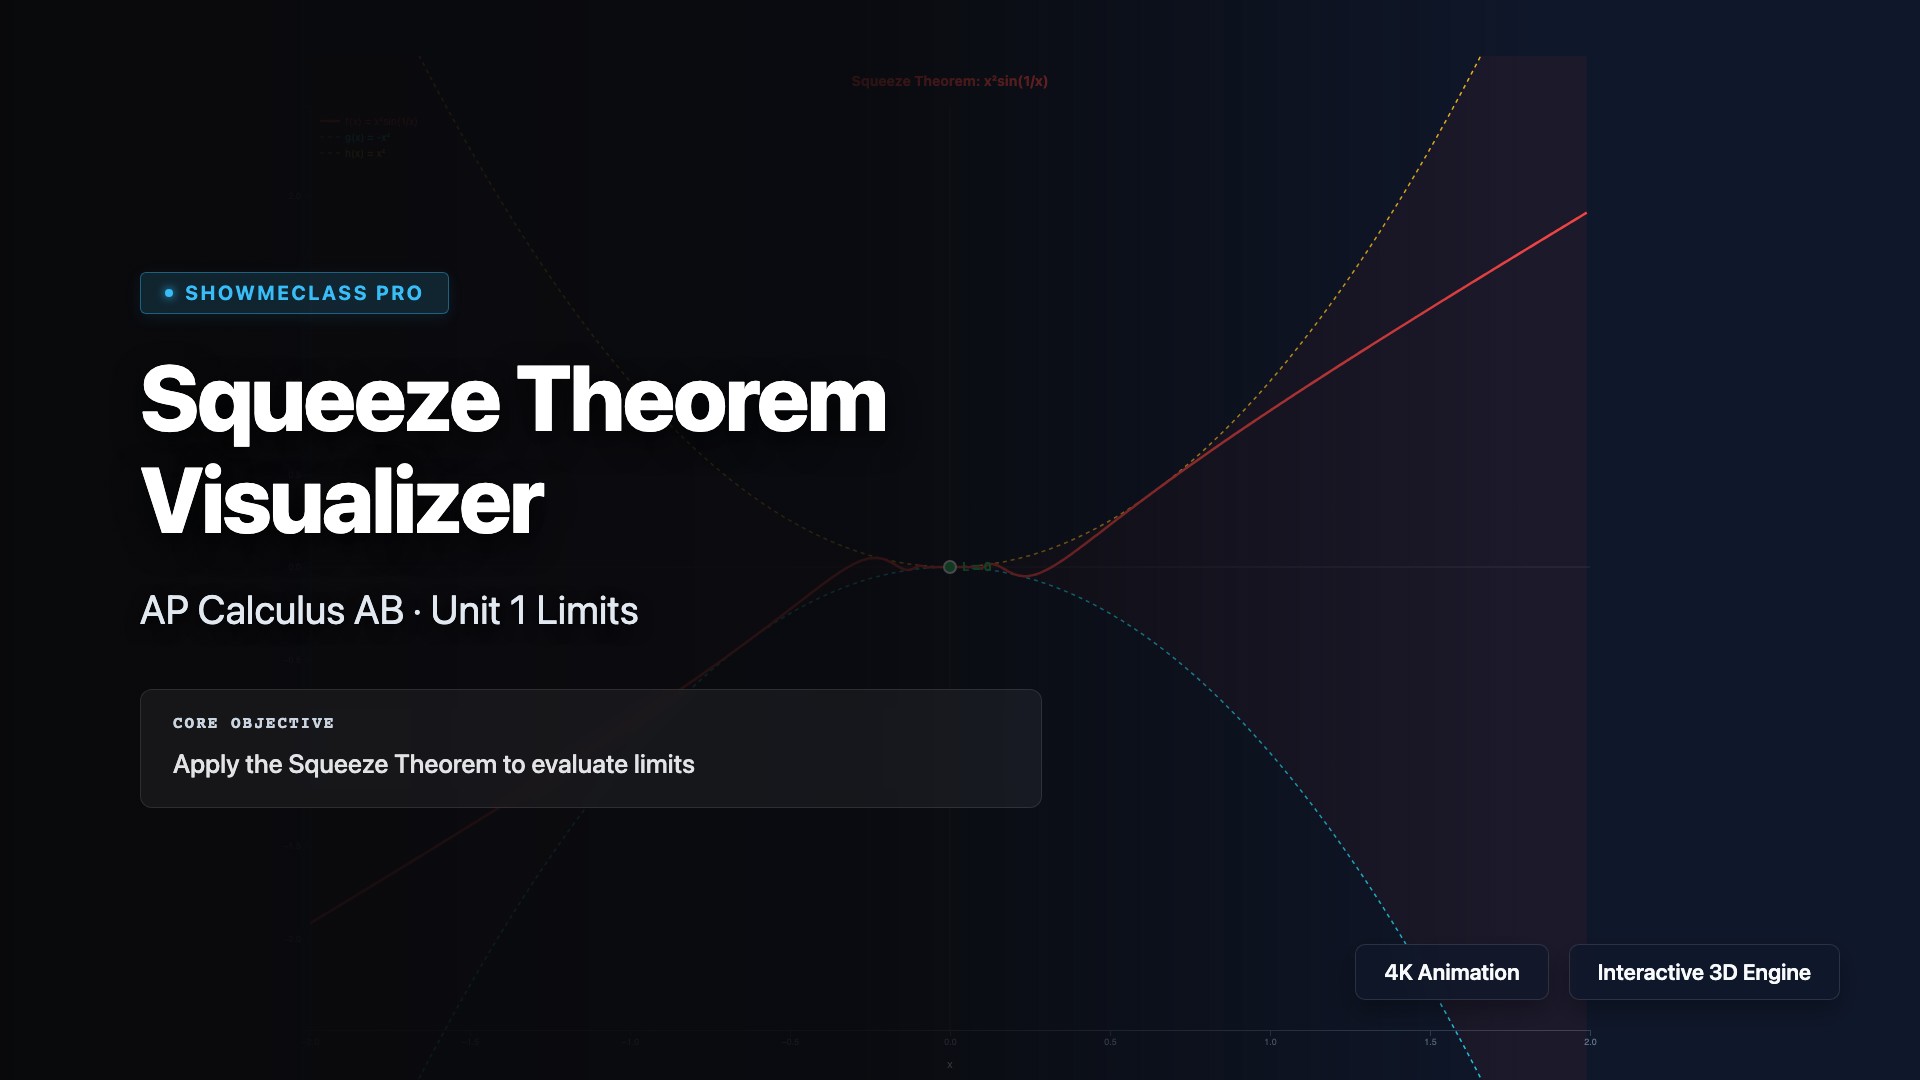
Squeeze Theorem Visualizer
Interactive visualization of the Squeeze Theorem with 4 classic examples (x²sin(1/x), sin(x)/x, x·cos(1/x), (1−cos x)/x²). Shows bounding functions g(x) ≤ f(x) ≤ h(x) with shaded squeeze region. Adjustable zoom and convergence to limit point.
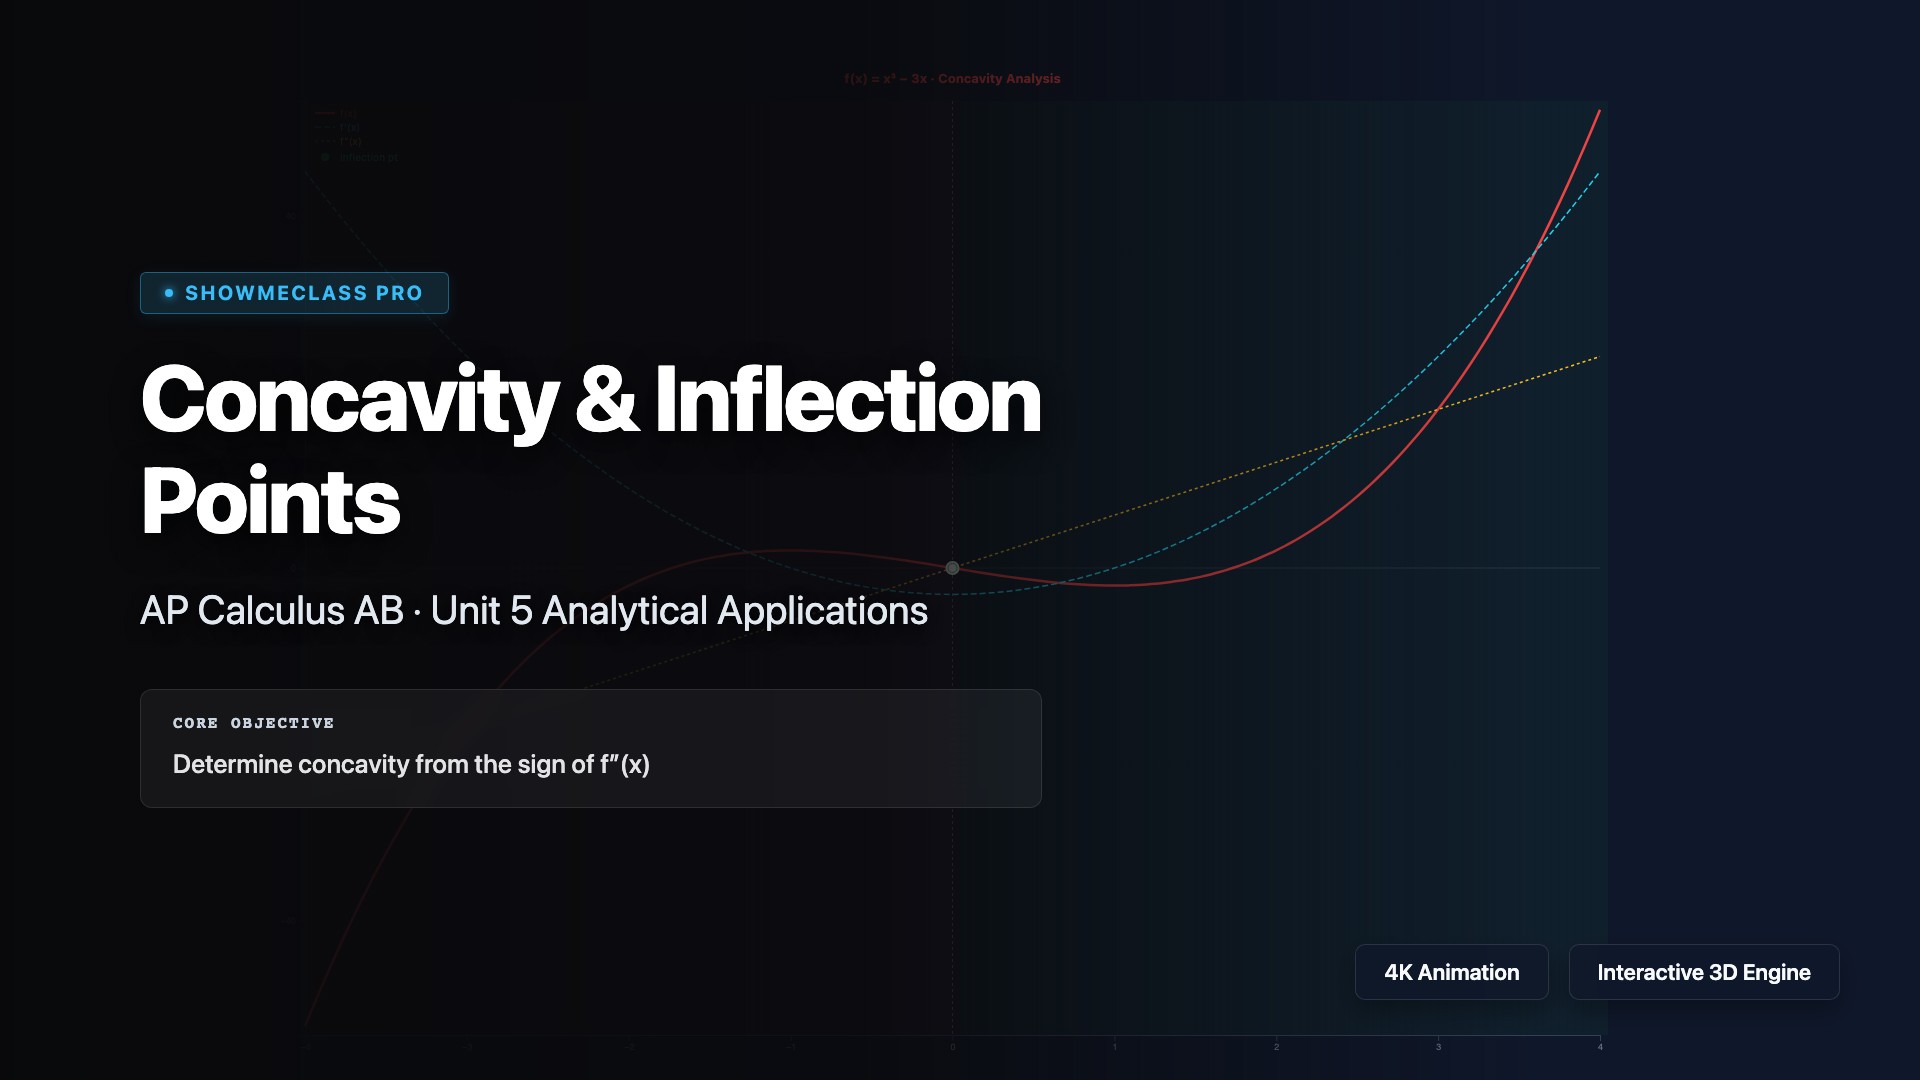
Concavity & Inflection Points
Interactive concavity analysis showing f(x), f′(x), and f″(x) simultaneously for 4 functions. Concavity shading (green=up, red=down), inflection point markers, and movable cursor with real-time derivative values and concavity classification.
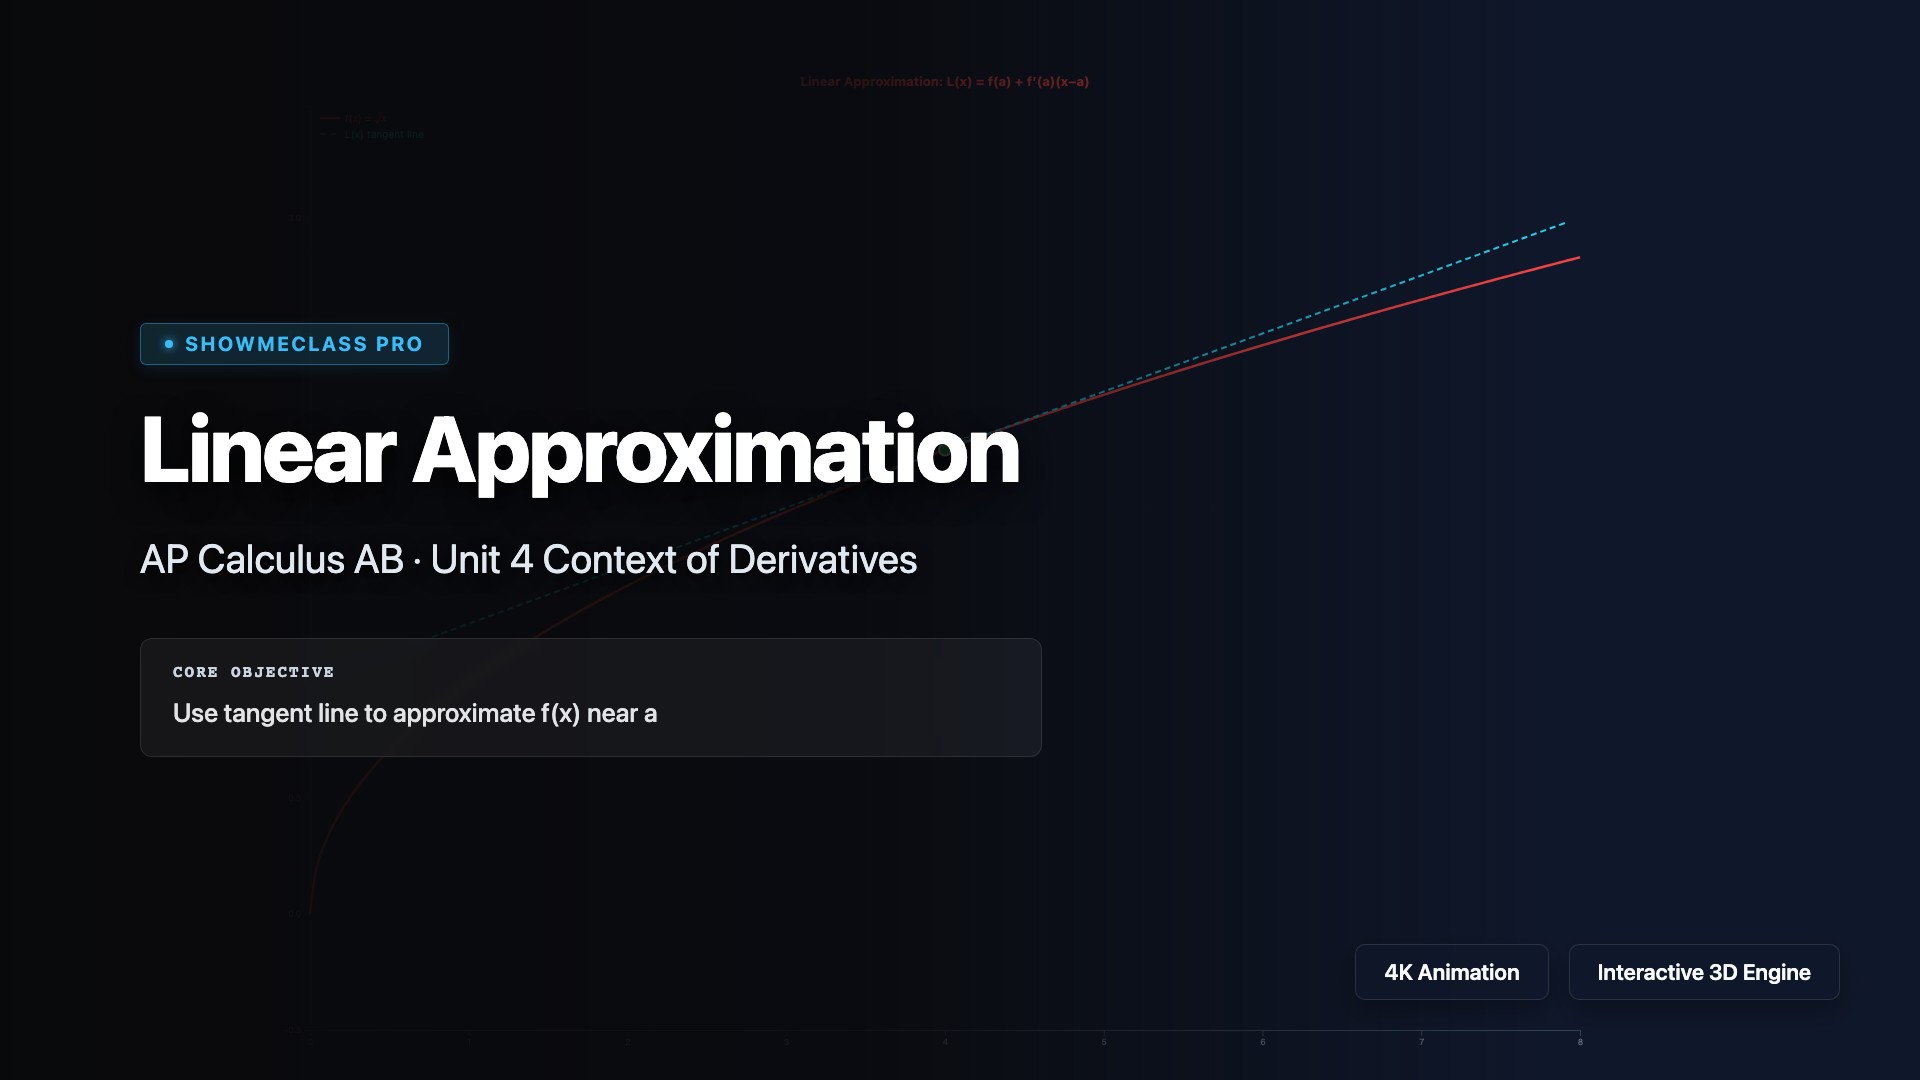
Linear Approximation & Differentials
Interactive linearization visualizer for 5 functions (√x, sin(x), eˣ, ln(x), 1/(1+x)). Shows tangent line L(x) = f(a) + f′(a)(x−a) overlaid on actual curve. Movable x-cursor with real-time exact vs approximate values, absolute and percentage error calculation.
u-Substitution Step-by-Step
Step-by-step walkthrough of u-substitution for 6 integral examples. Color-coded steps: identify u, find du, match dx, substitute, integrate, back-substitute. Covers standard patterns including definite integrals with bound conversion.
Accumulation Function Visualizer
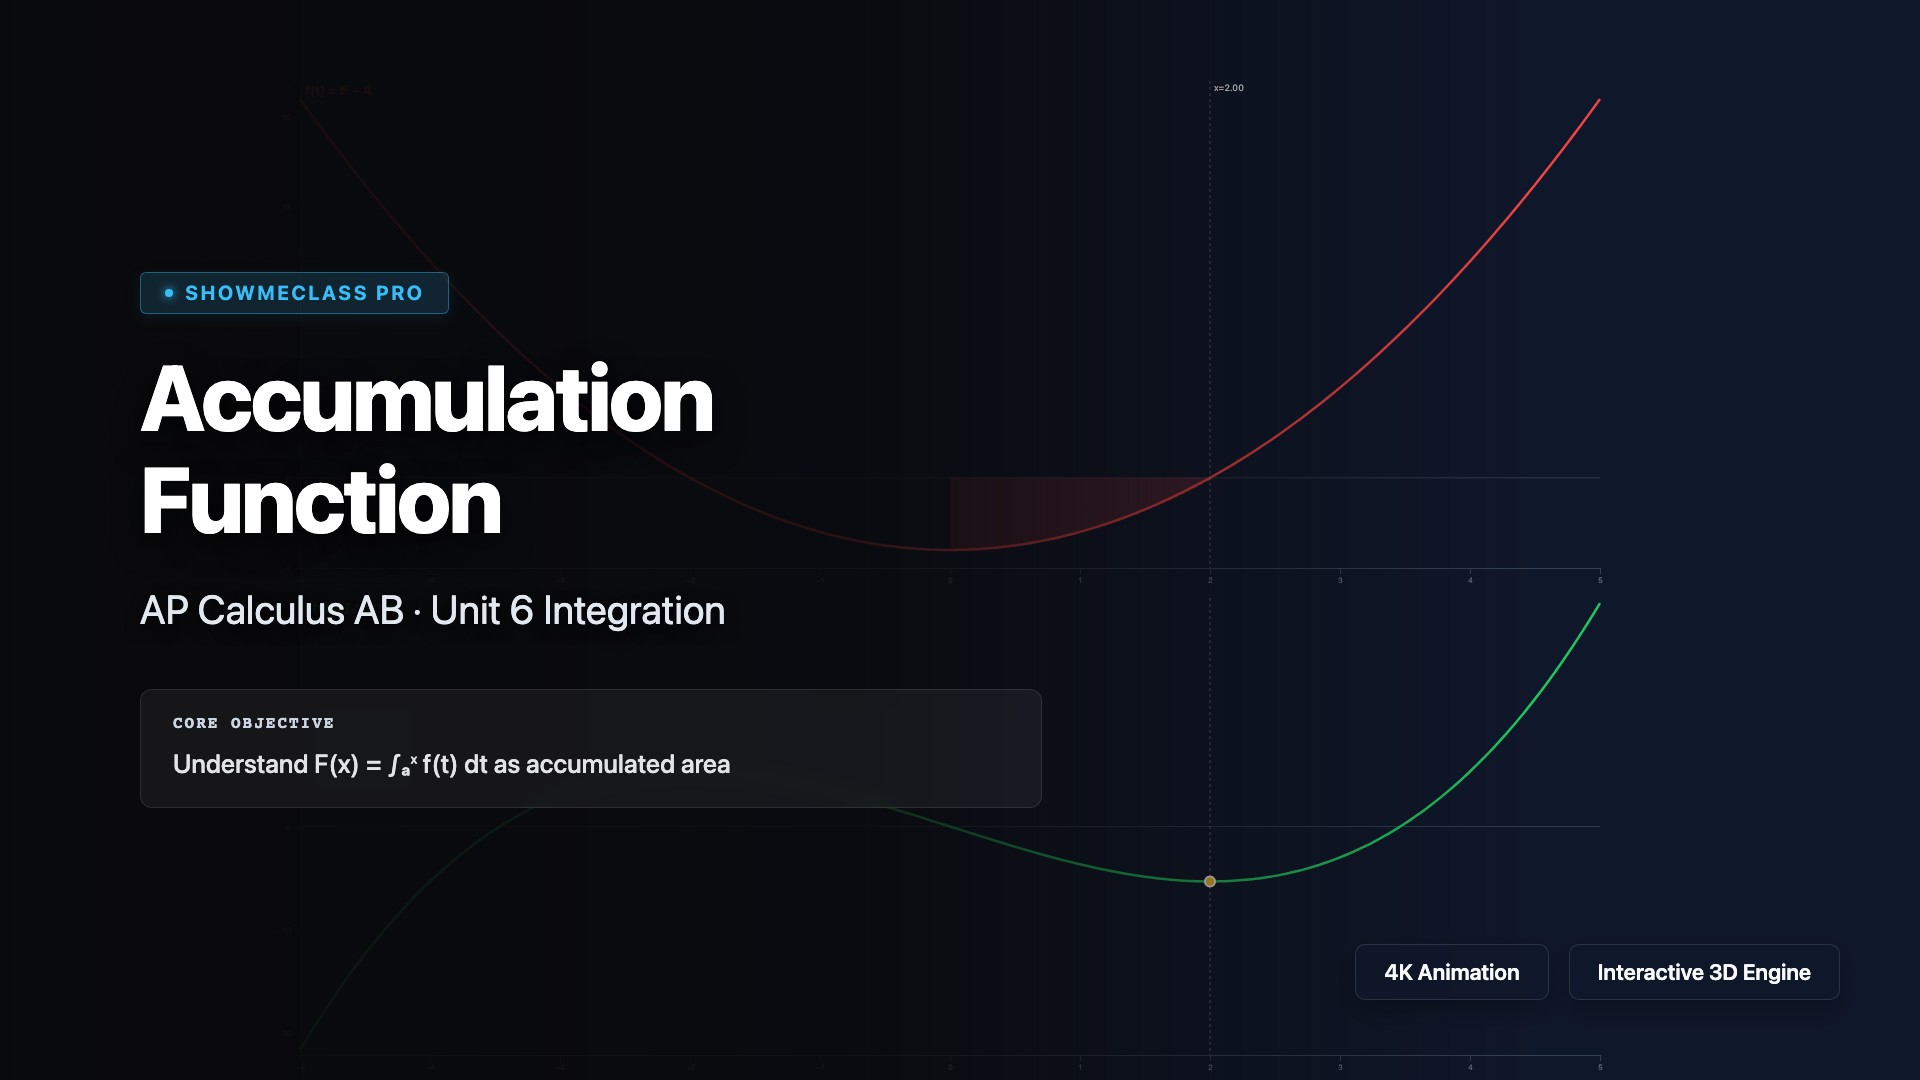
Dual-panel visualization of f(t) and F(x) = ∫ₐˣ f(t) dt. Shows signed area shading (green positive, red negative) on the integrand graph alongside the accumulation function. Demonstrates FTC Part 1: F′(x) = f(x). Adjustable upper limit x with 4 function examples.
Trapezoidal & Riemann Sum Approximation
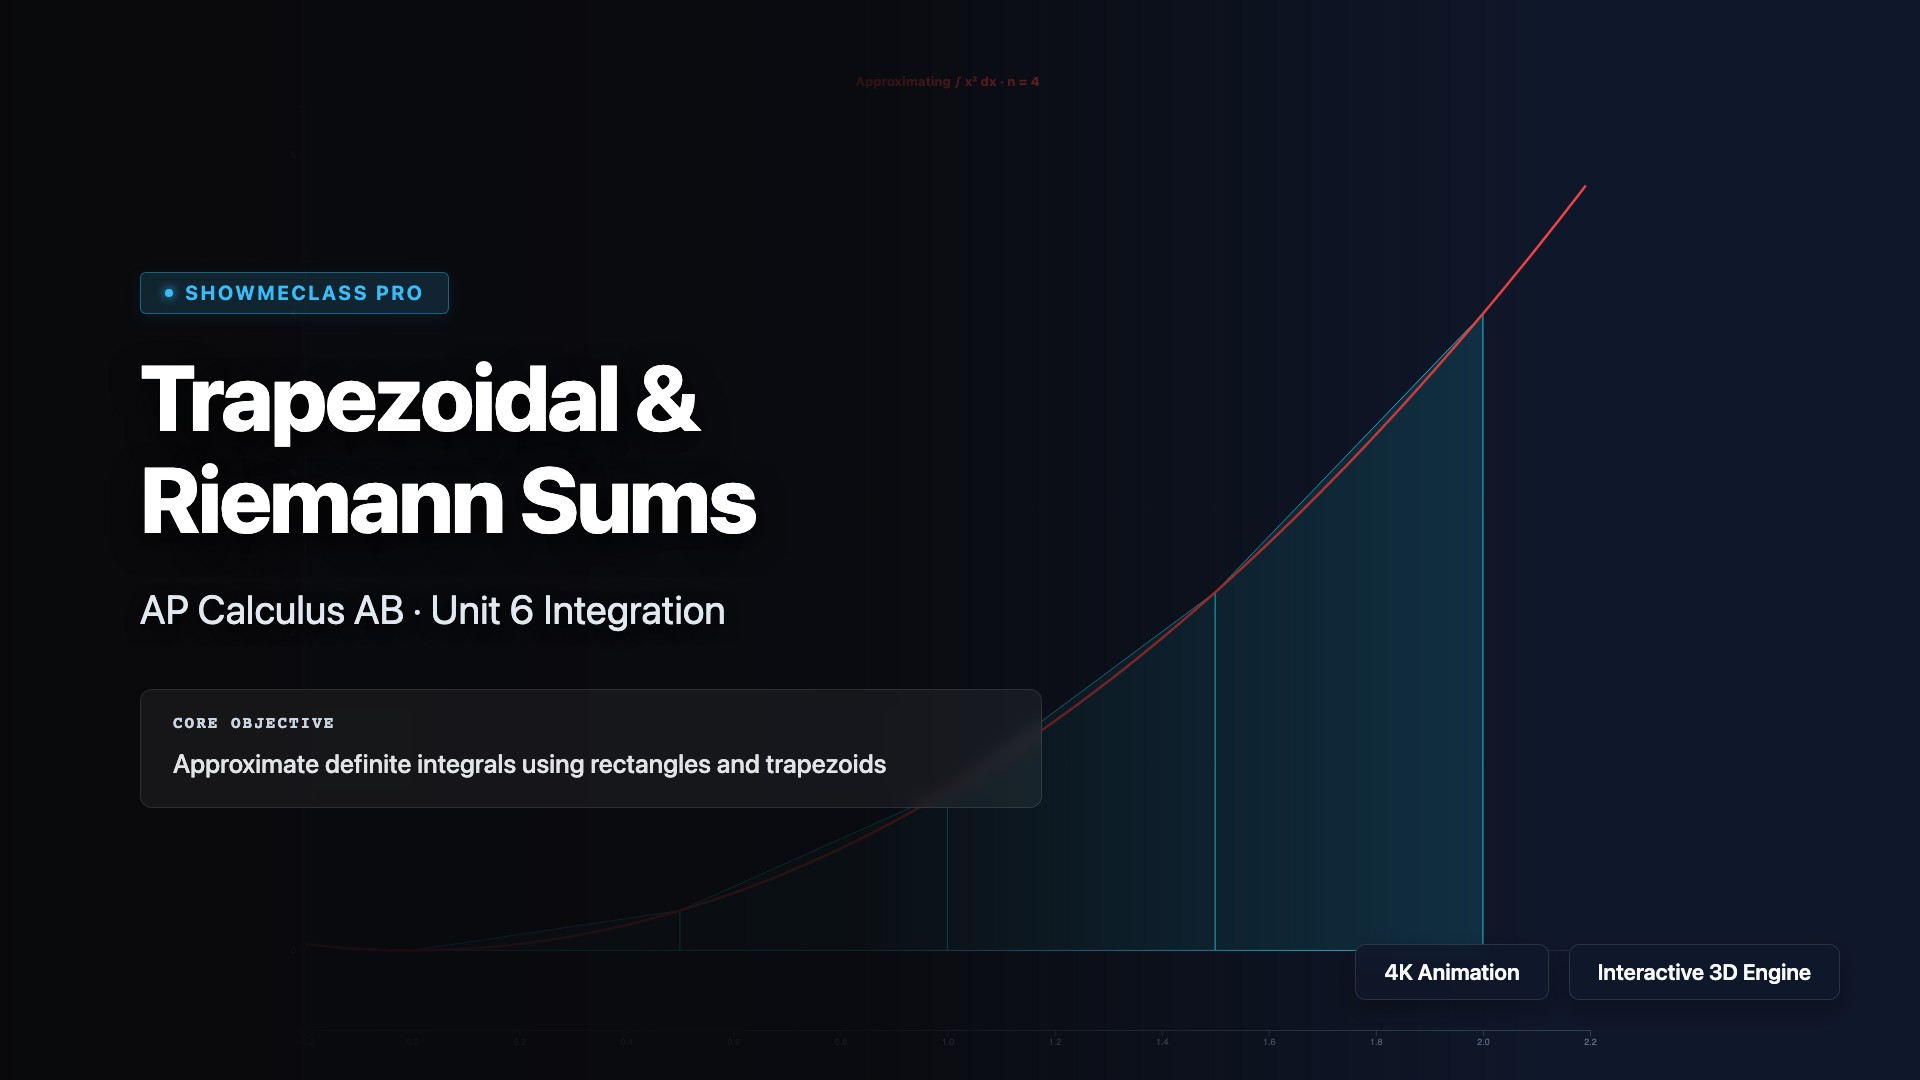
Interactive numerical integration comparing Left, Right, Midpoint, and Trapezoidal rules. 4 functions with adjustable number of subintervals (n=1 to 50). Shows exact value, approximation, absolute and percentage error. Visualizes rectangles/trapezoids overlaid on curve.
First & Second Derivative Test
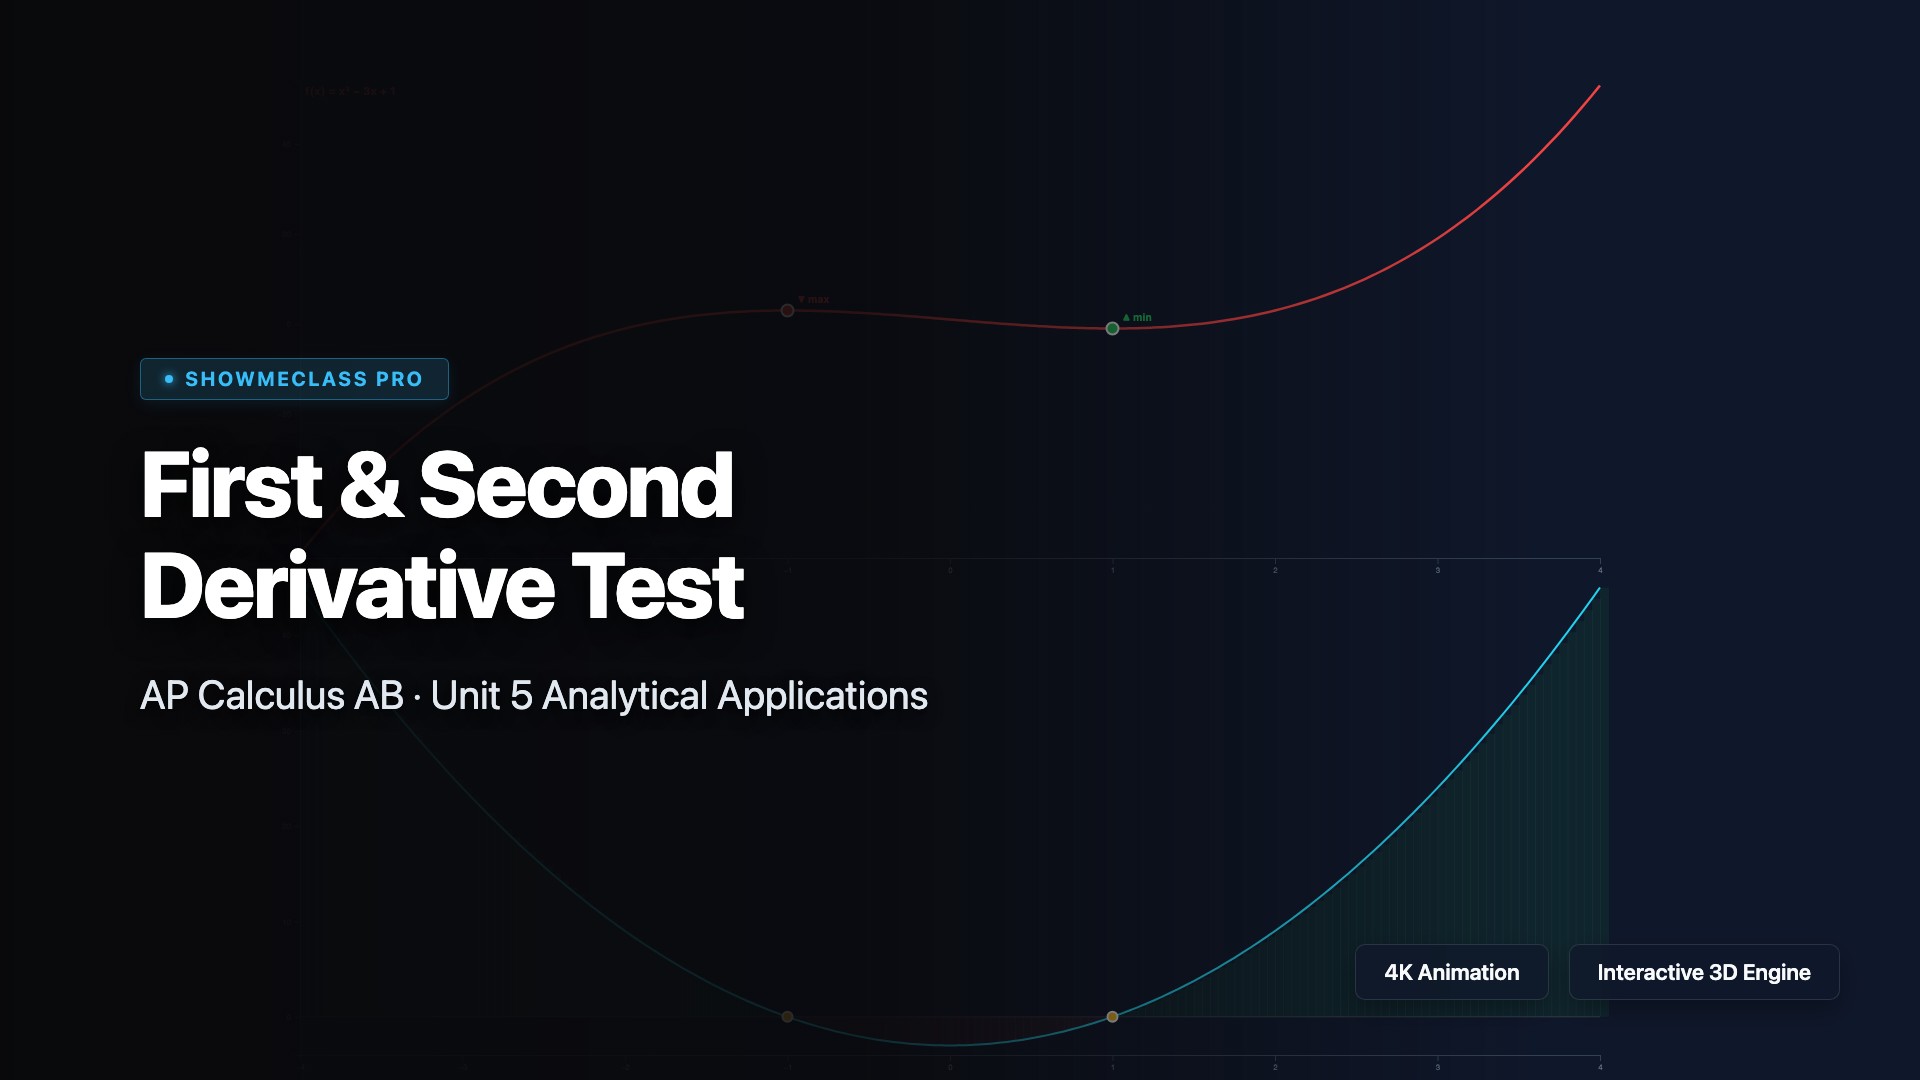
Dual-panel display of f(x) and f′(x) for 4 polynomial/exponential functions. Critical points marked with max/min labels, f′ sign shading (green=increasing, red=decreasing). Second derivative test verification at each critical point. Interactive function selection.
Average Value of a Function
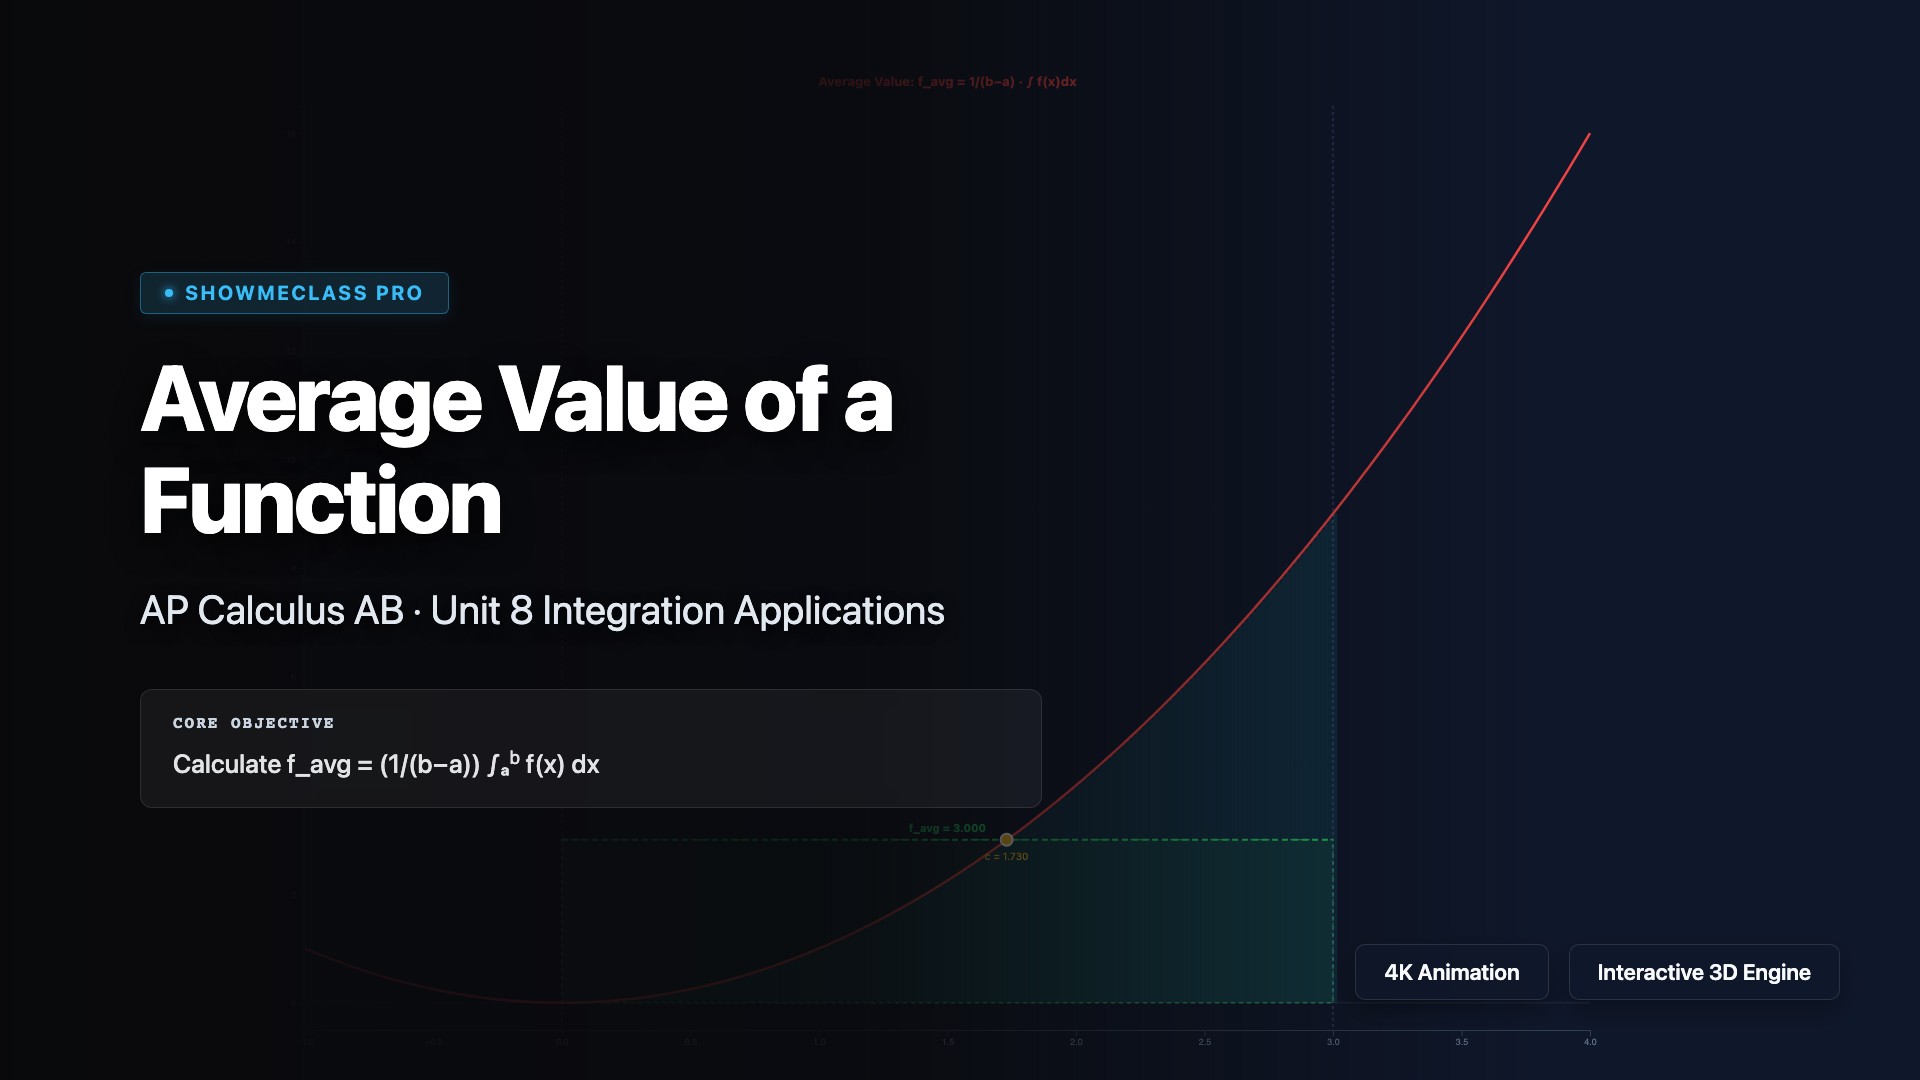
Interactive average value calculator showing f_avg = 1/(b−a)·∫f(x)dx with equal-area rectangle visualization. Green dashed line at f_avg height creates a rectangle with the same area as the integral. Finds MVT for Integrals c-value. Adjustable bounds a and b.