Showing 12 results

RC Circuit Transient Response
Analyze the asymptotic decay curves of isolated RC Circuits. Switch between charging and discharging phases to plot Voltage and Current dynamically against the Time Constant (τ = RC).

Lorentz Force 3D Particle Accelerator
Fire charged particles into a uniform magnetic field. Visualize cyclotronic motion derived from the cross product F = q(v × B) and measure the resulting orbital radius based on mass, velocity, and charge.
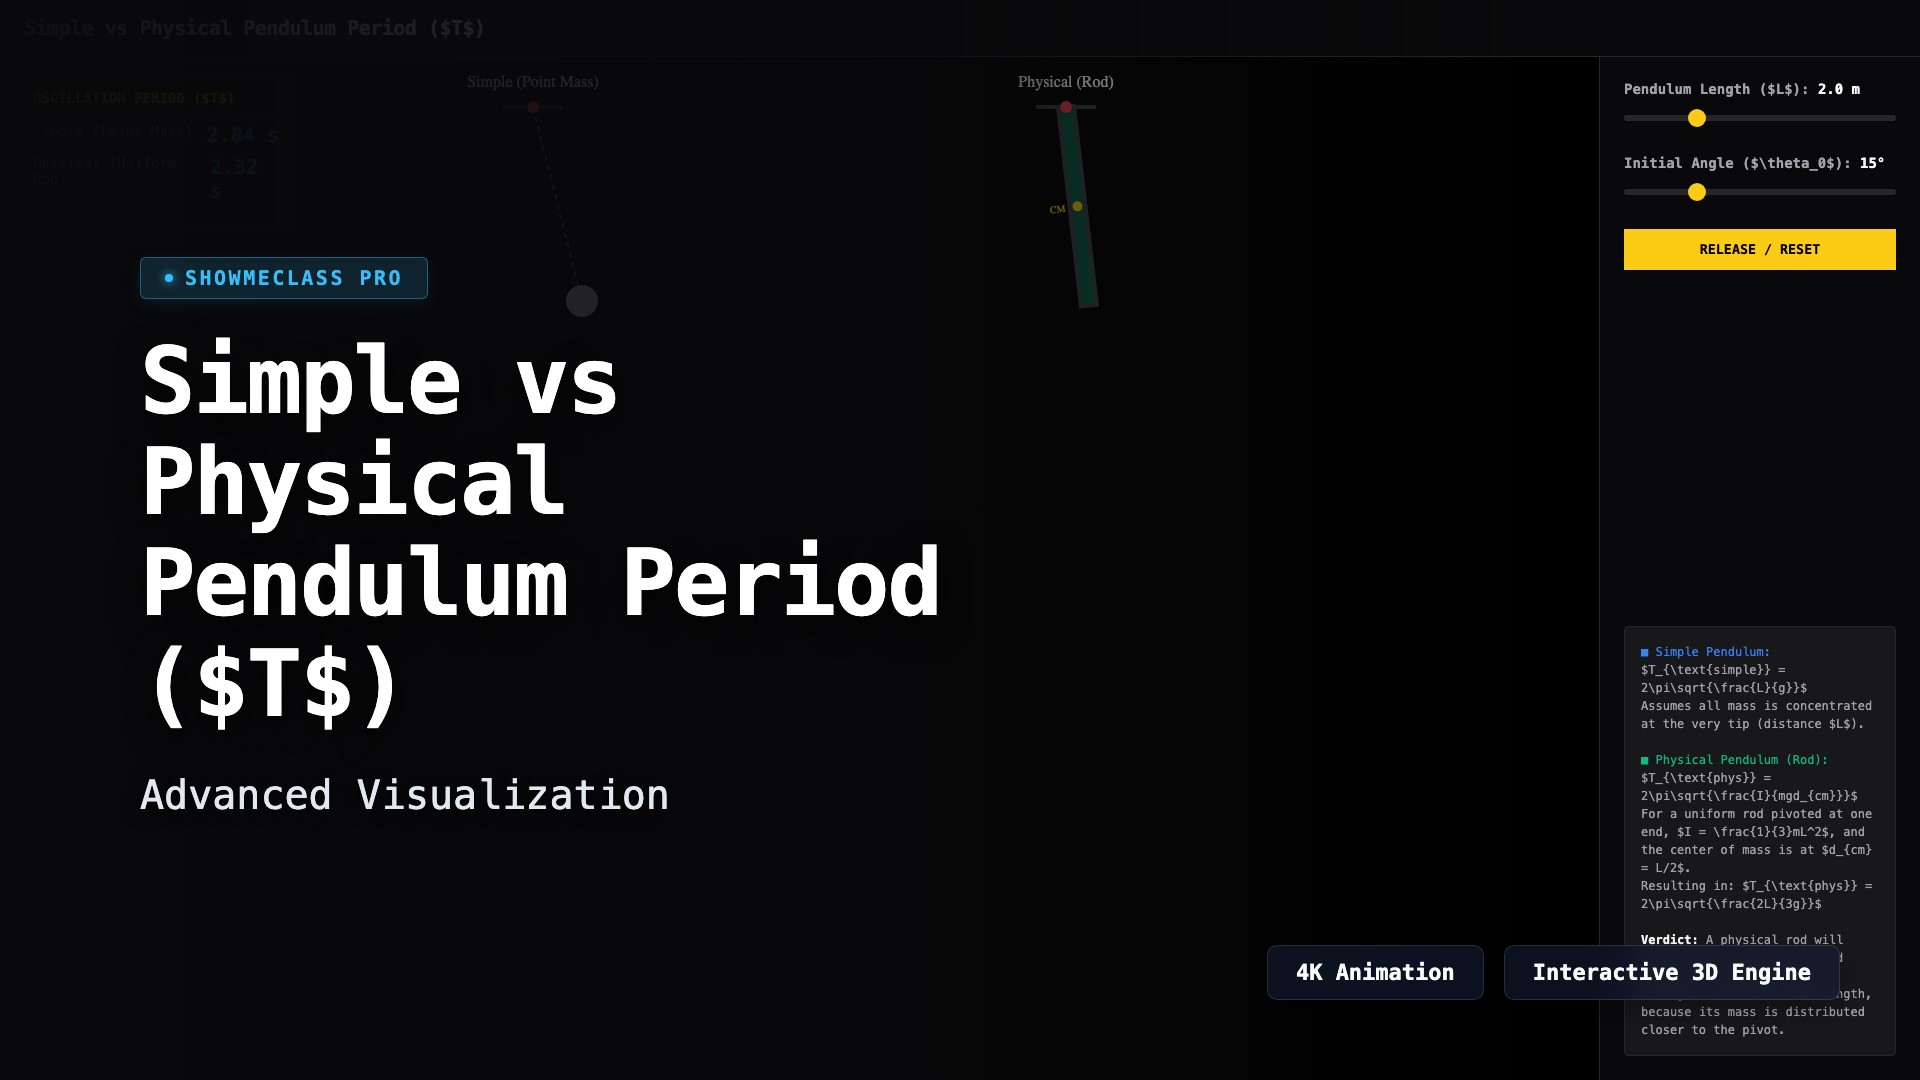
Simple vs Physical Pendulum Period
Simulate and compare the oscillation period of a point mass on a string (simple pendulum) versus a rigid uniform rod (physical pendulum) to visualize how mass distribution speeds up the rotational cycle.

Rolling vs Sliding Friction (Incline Race)
Compare the translational acceleration of a solid cylinder, a hollow cylinder, and a frictionless sliding block down an incline. Visualize how rotational inertia steals kinetic energy from linear motion.

Endocrine System Signaling Pathways
Simulate hormone cell signaling. Compare lipid-soluble steroid diffusion acting as a nuclear transcription factor versus water-soluble peptide binding that triggers a massive cAMP secondary messenger cascade.

RNA Transcription & Splicing Processing
Walk through the Central Dogma. Bind RNA Polymerase II to the promoter, elongate the pre-mRNA transcript, and execute post-transcriptional modifications including 5' Capping, Poly-A tailing, and spliceosome intron cleavage.
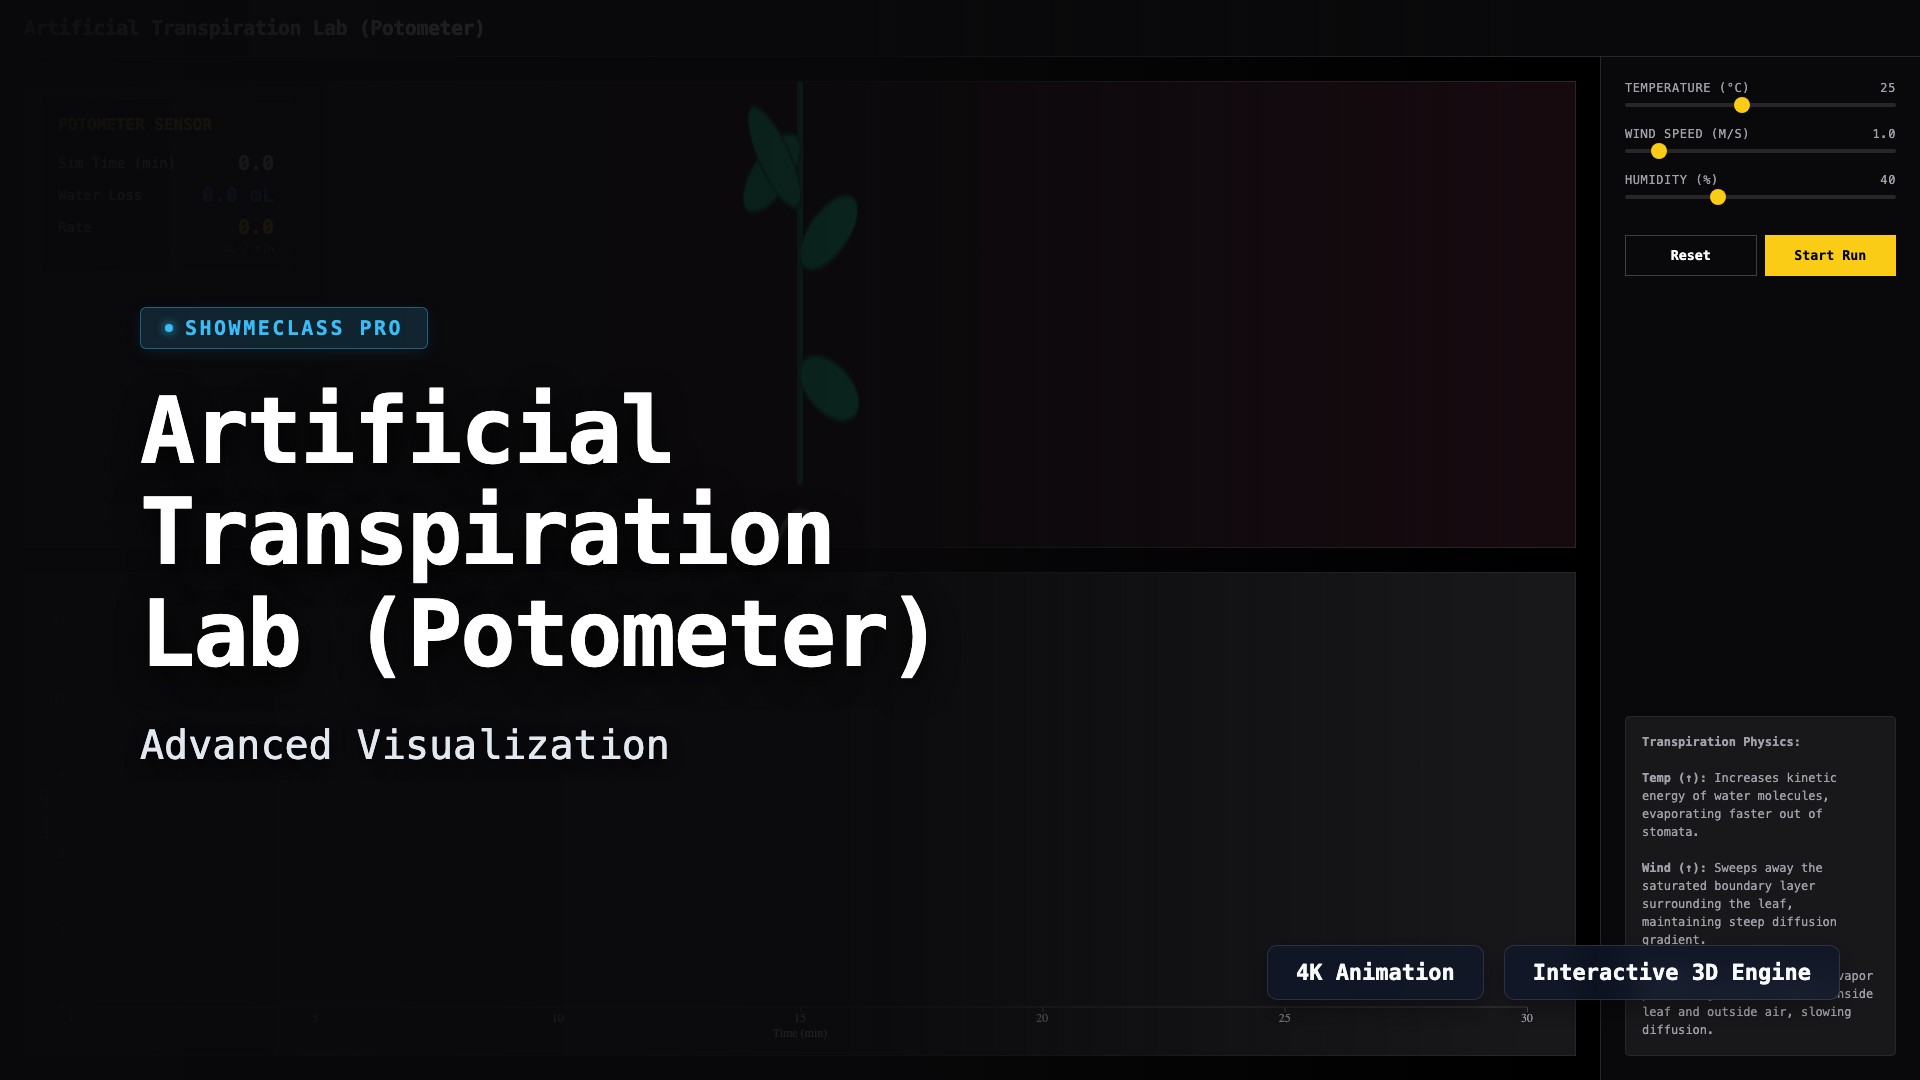
Artificial Transpiration Lab (Potometer)
Measure the rate of water loss in a simulated plant cutting using a virtual potometer. Adjust environmental physics variables including Temperature, Wind Speed, and Humidity to determine their exact multiplicative effects on evaporation.

Chi-Square Animal Behavior (Choice Chamber)
Simulate pillbug movement across varying environmental conditions (Light/Dark, Dry/Wet). Record real-time location data and dynamically calculate the Chi-Square (χ²) statistic to reject or fail to reject the null hypothesis of random distribution.
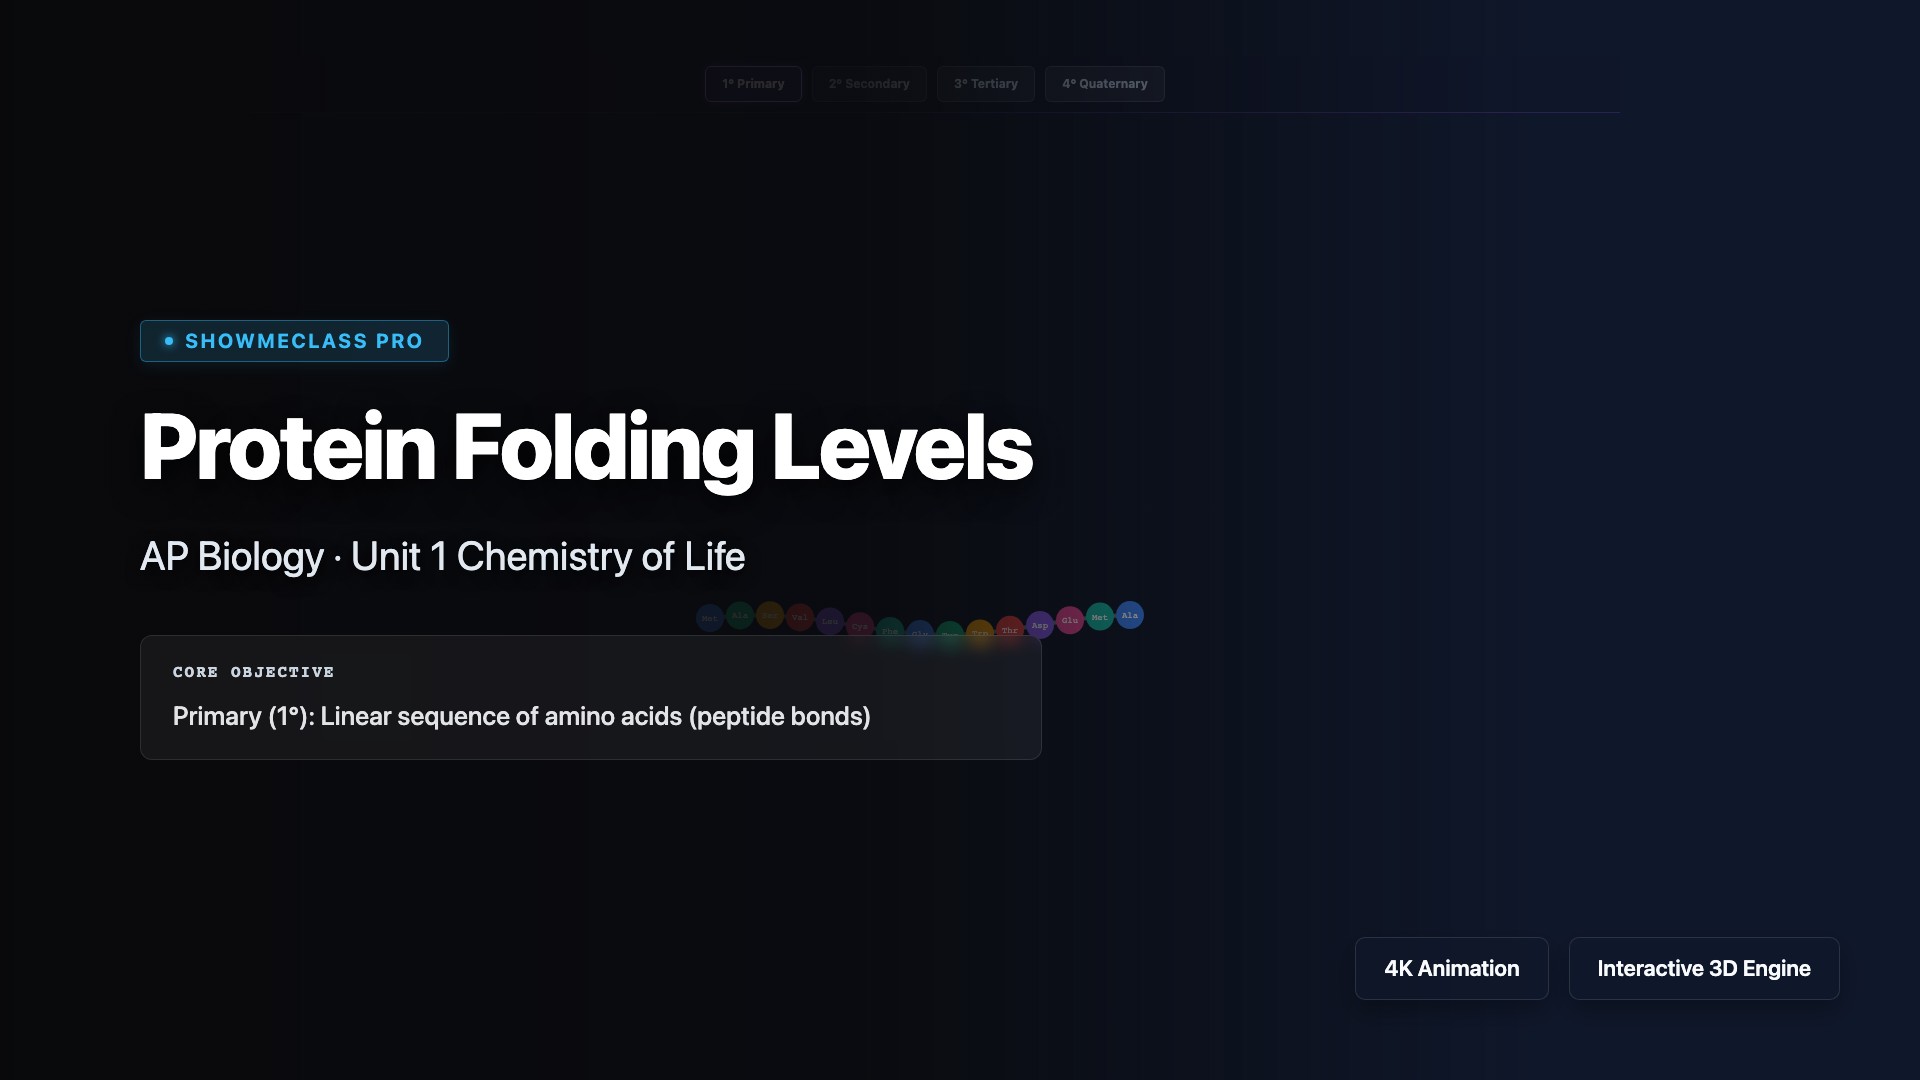
Protein Folding Levels (1°-4°)
Animated stepwise assembly of a protein from its primary amino acid sequence through alpha-helices/beta-sheets to complex 3D tertiary and quaternary structures, including extreme heat denaturation.
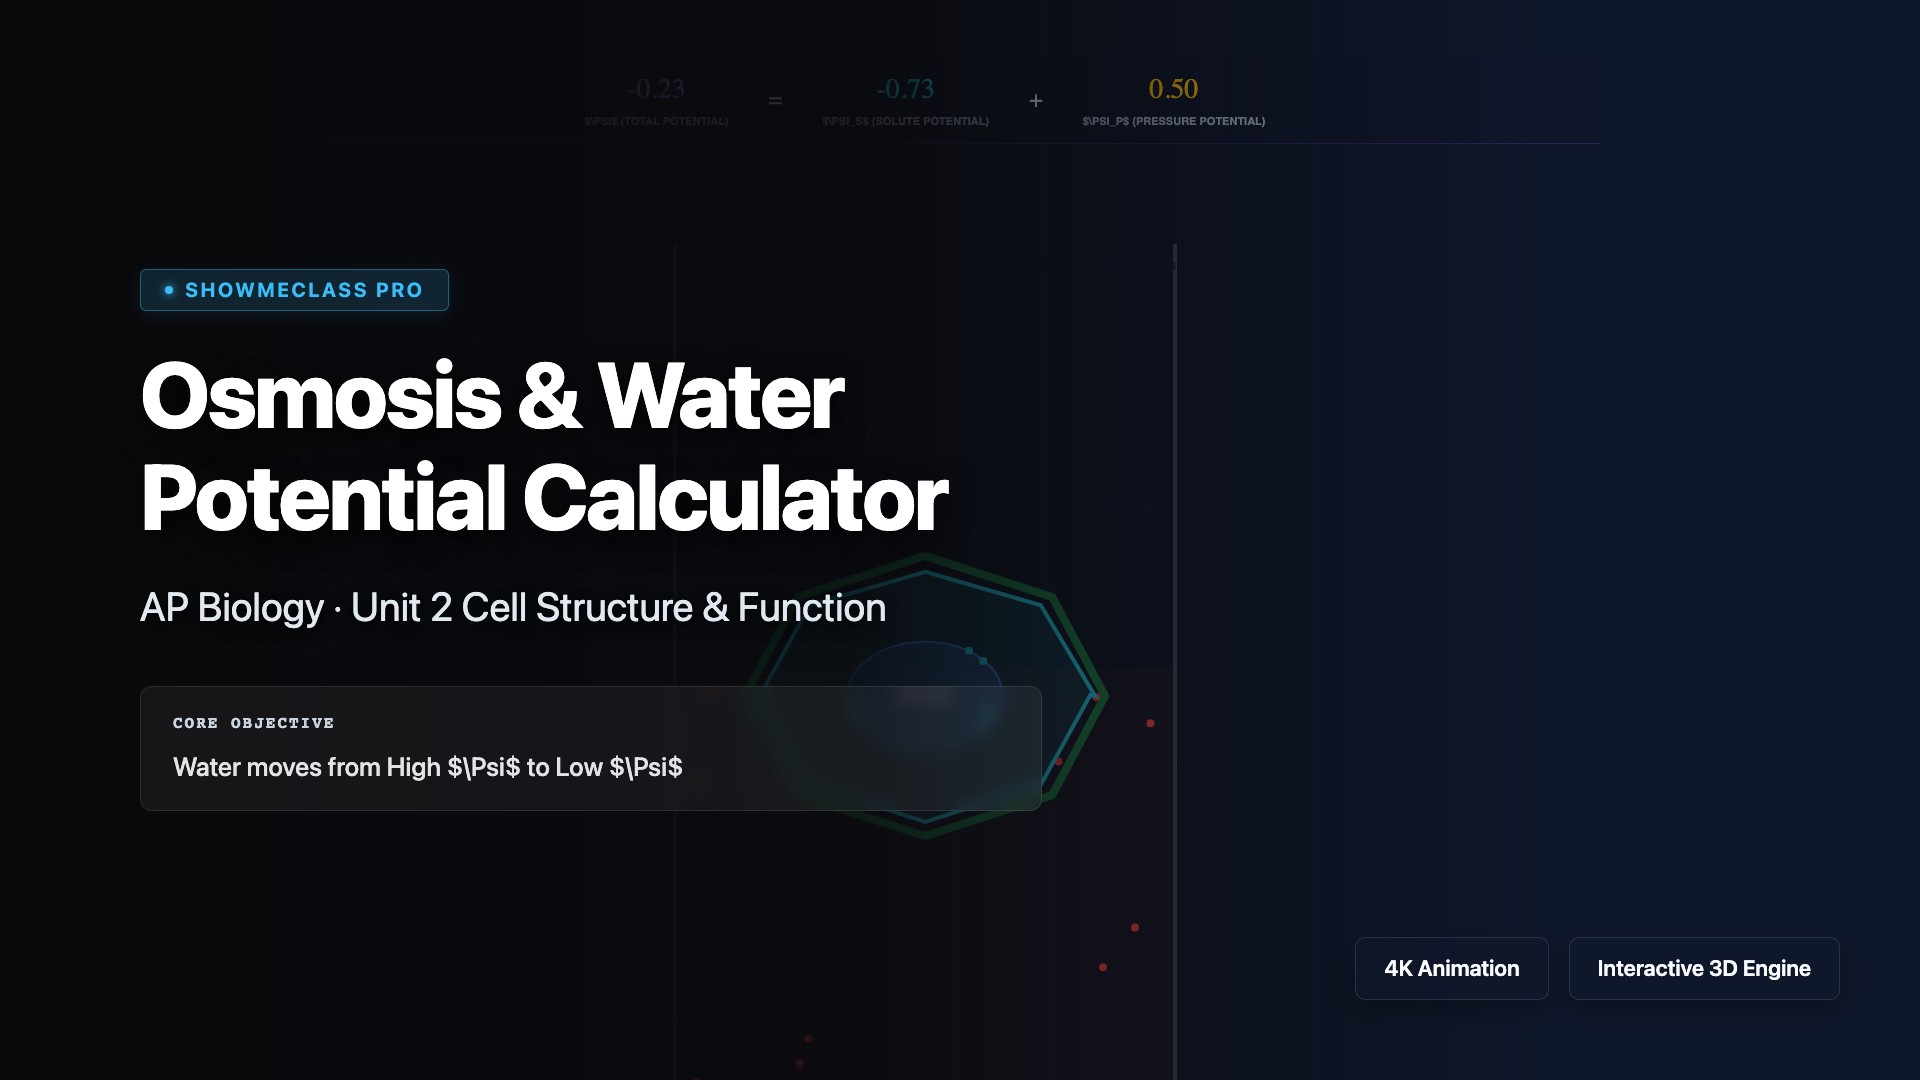
Osmosis & Water Potential Calculator
Calculate and visualize water potential (Ψ = Ψs + Ψp) across a plant cell membrane. Watch water movement and cell plasmolysis/turgidity based on hypertonic/hypotonic environments.
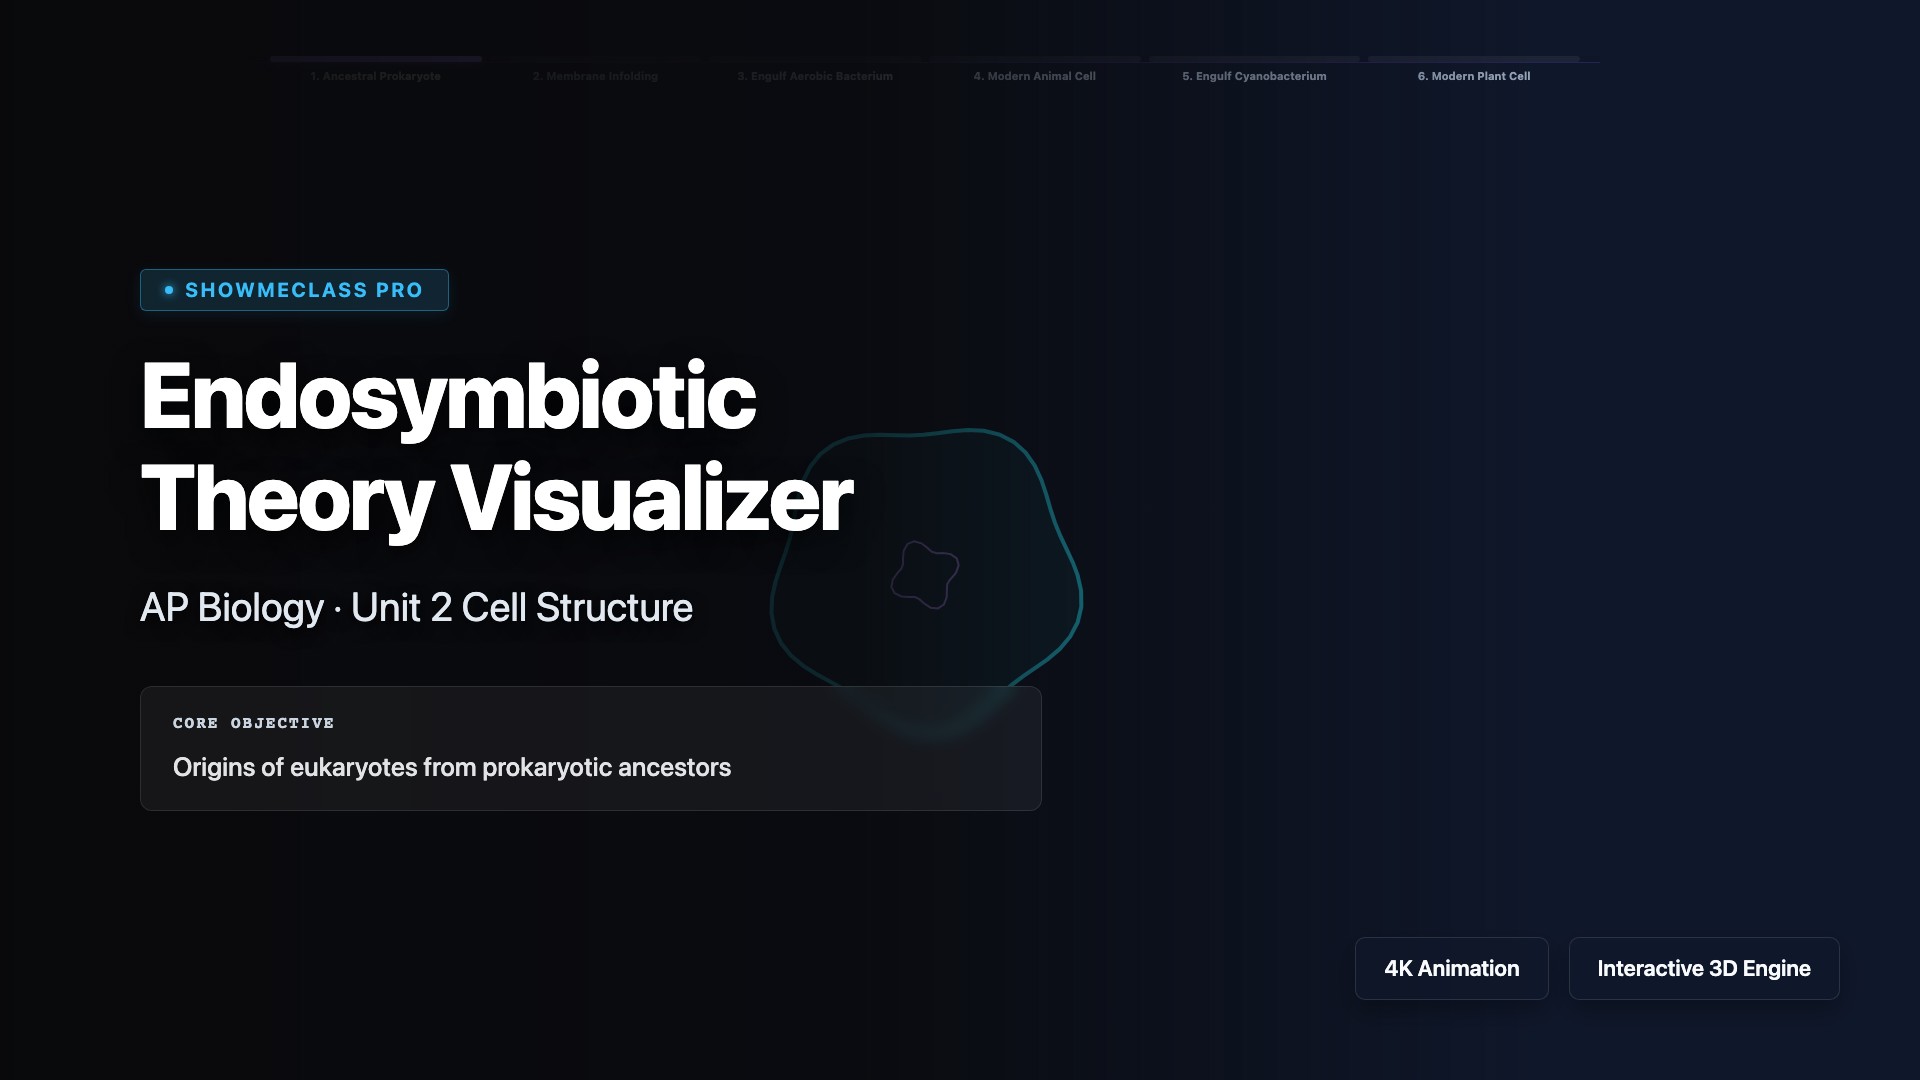
Endosymbiotic Theory Visualizer
Step through an animated history of a eukaryotic cell engulfing aerobic and photosynthetic bacteria to form mitochondria and chloroplasts, respectively.
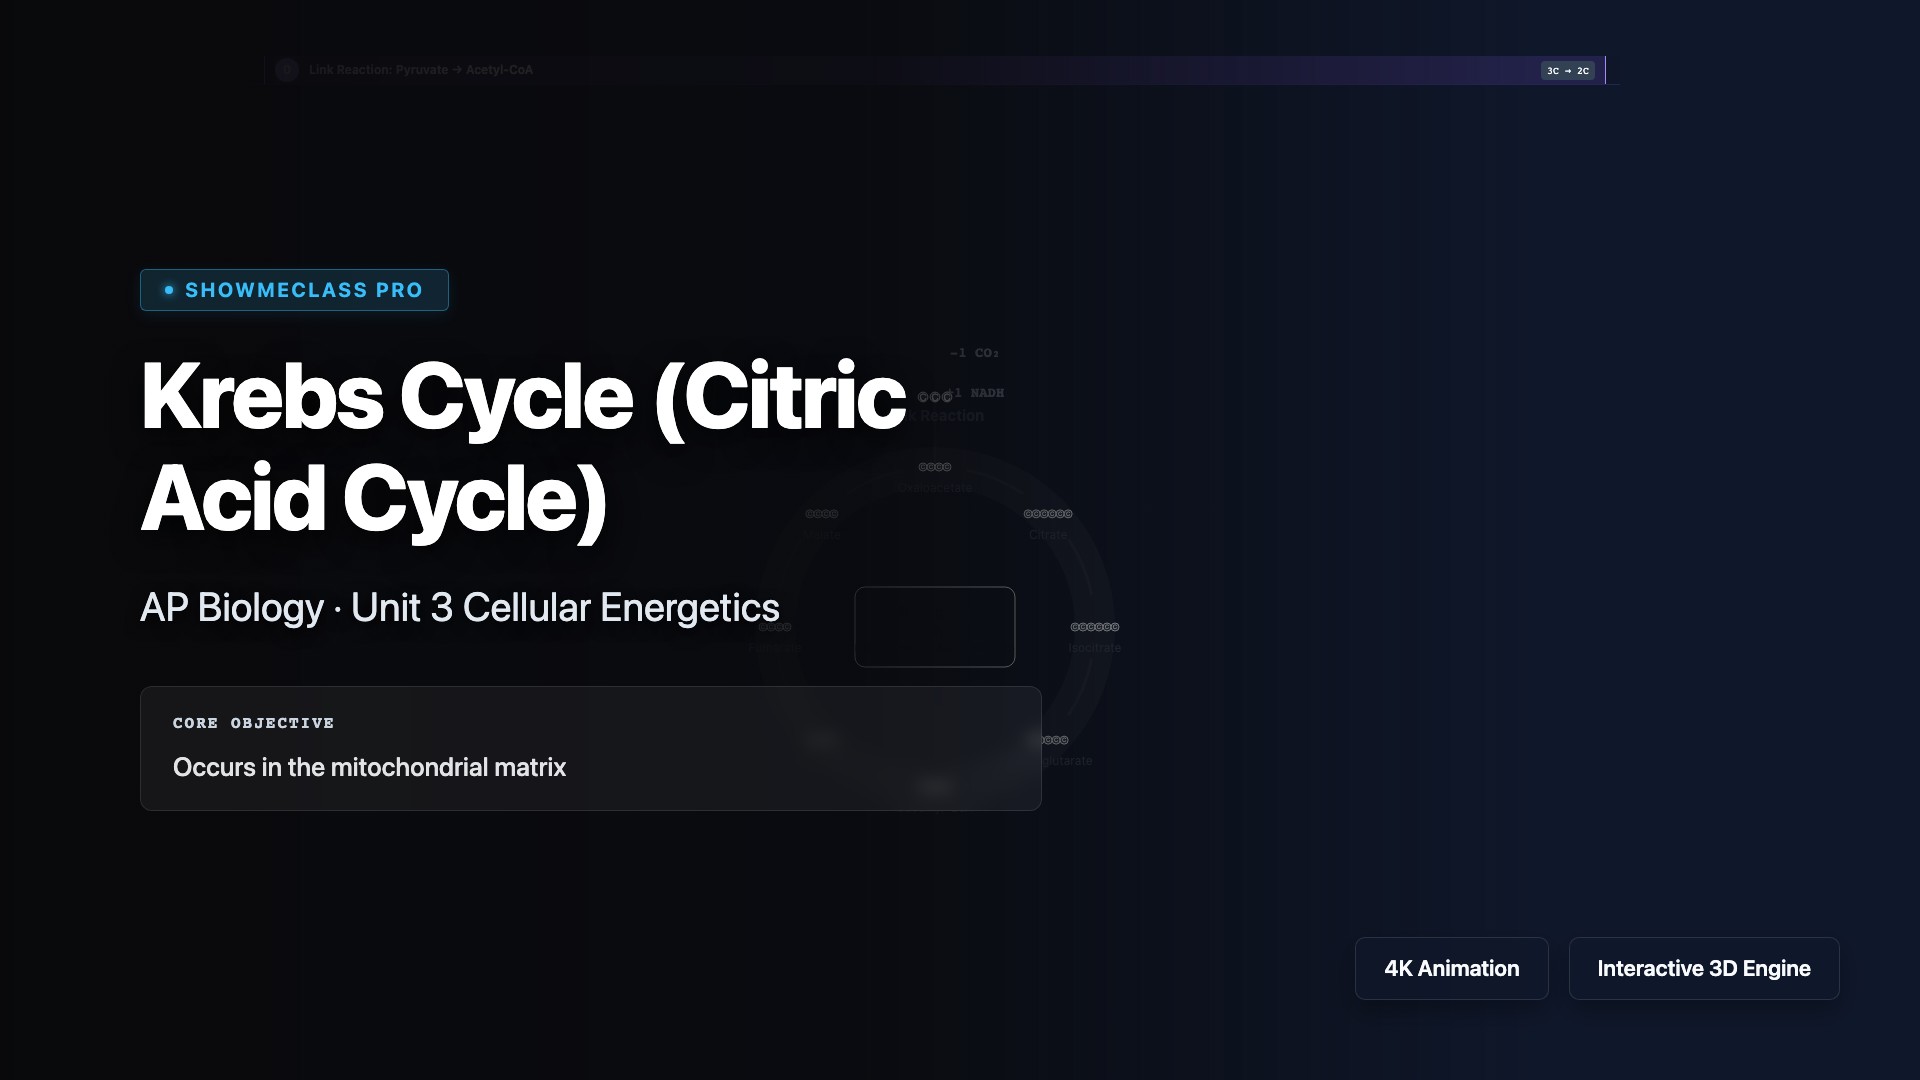
Krebs Cycle Step-by-Step
Step through the 8 stages of the Citric Acid Cycle, visualizing the breakdown of Acetyl-CoA and the tracking of Carbon, NADH, FADH₂, and ATP yields.