Showing 12 results
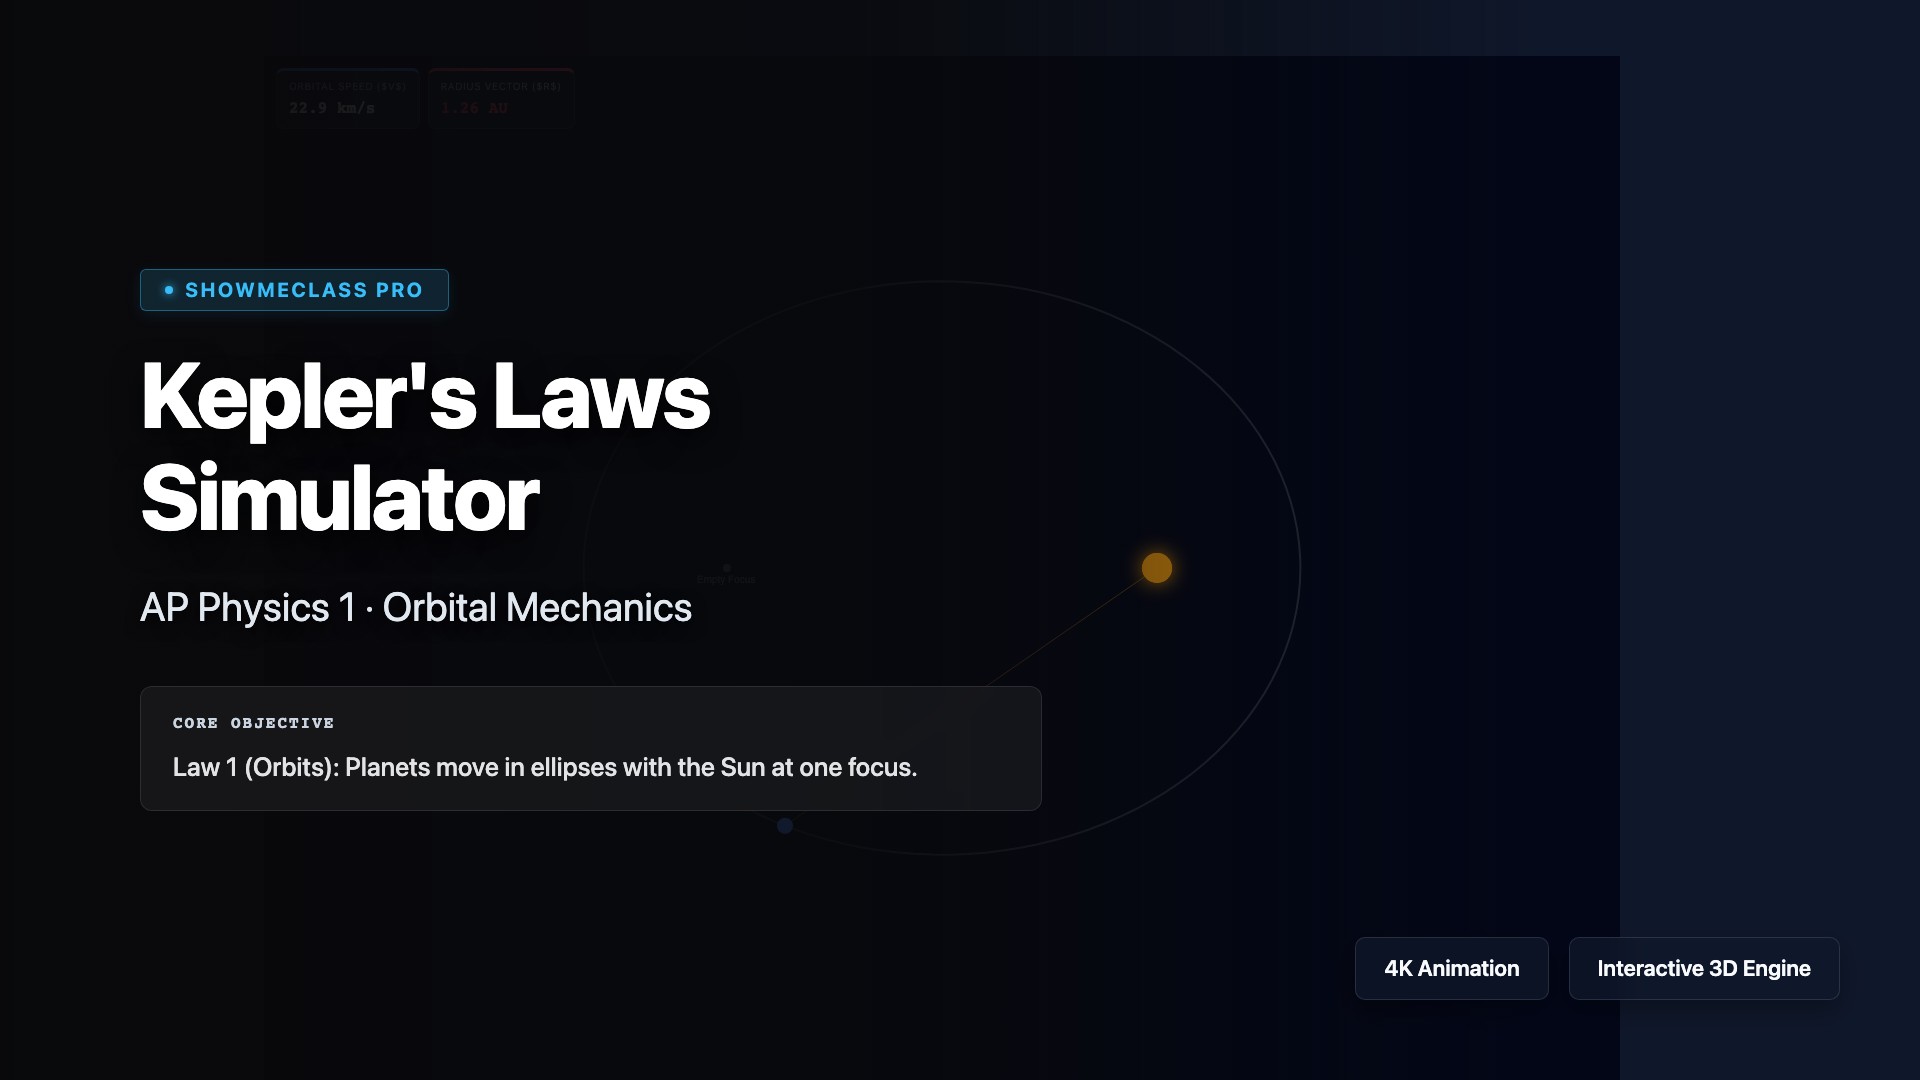
Kepler's Laws of Planetary Motion
Prove Kepler's Laws visually. Alter orbital eccentricity and watch as planets sweep out perfectly equal geometric areas in equal times, regardless of whether they are slingshotting past perihelion or crawling through aphelion.
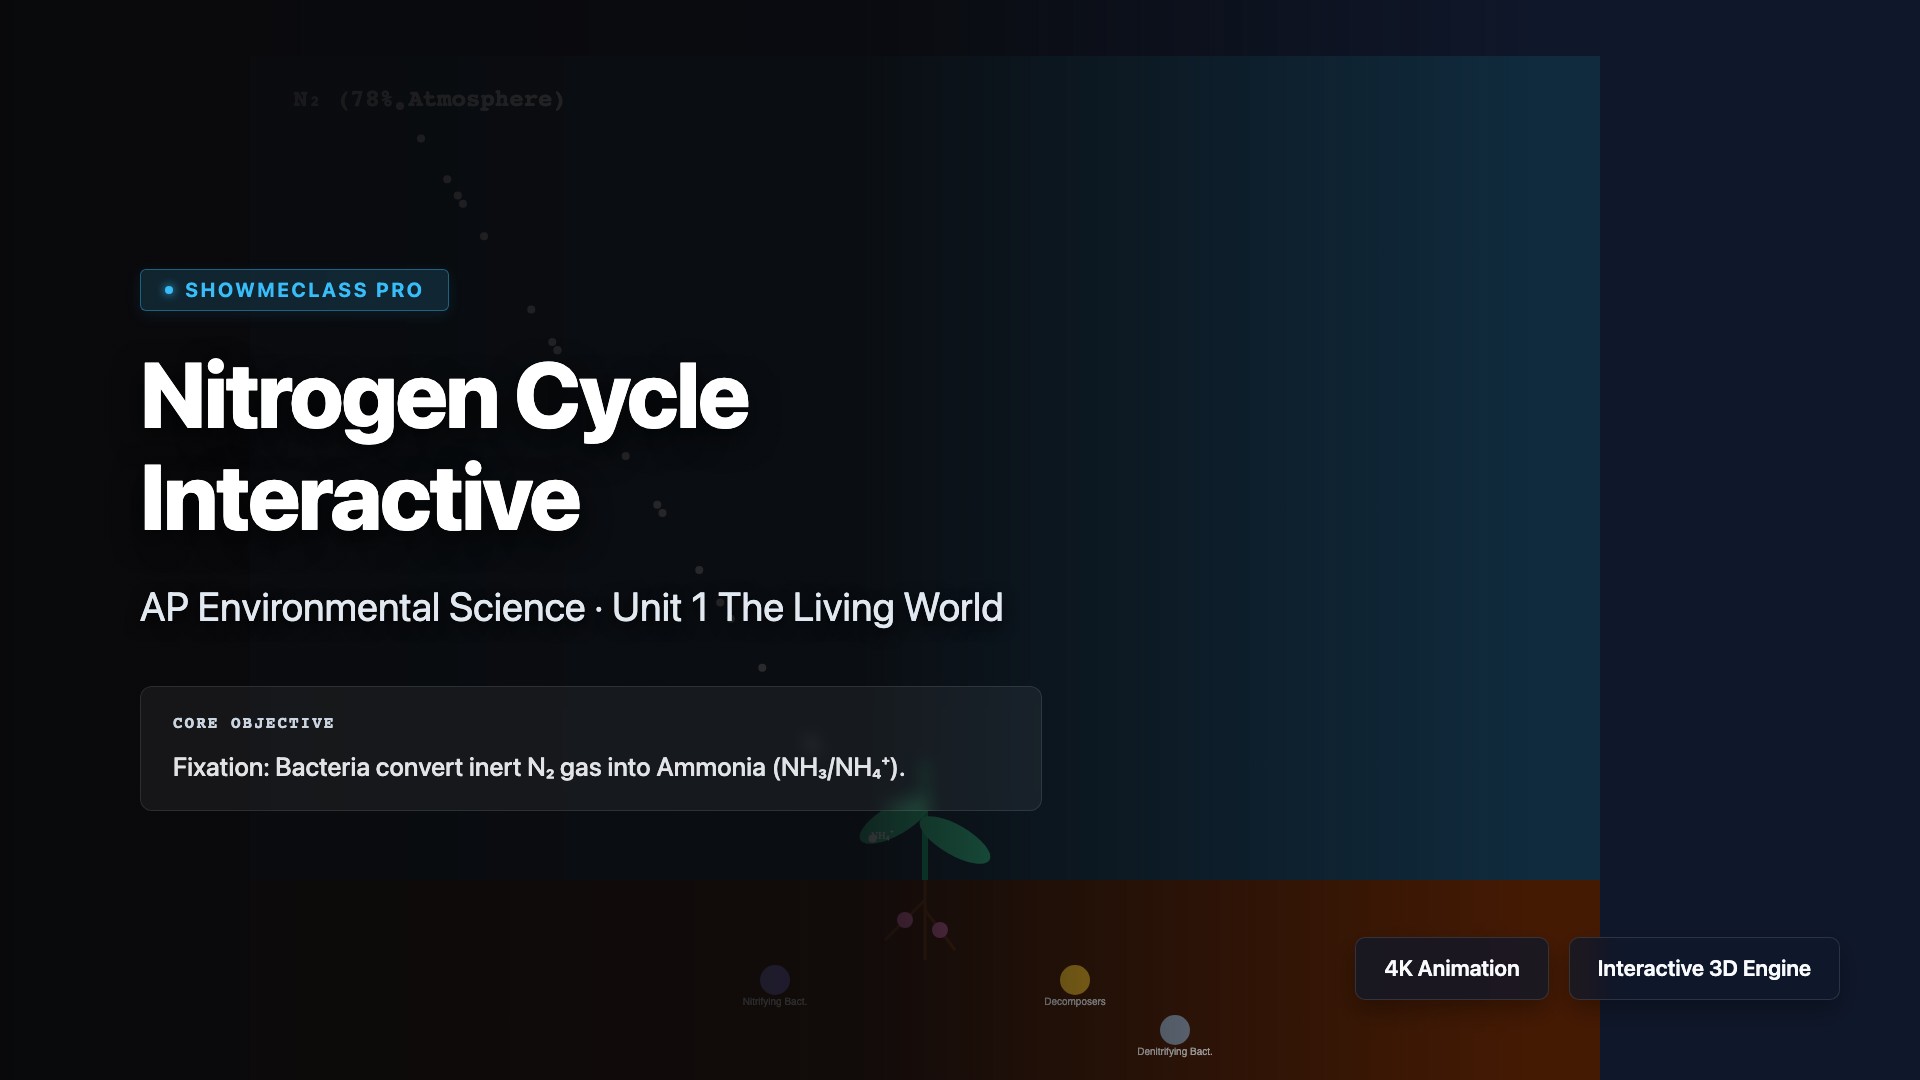
Nitrogen Cycle Interactive
Detailed APES Nitrogen Cycle interactive mapping the 5 chemical steps: Fixation, Nitrification, Assimilation, Ammonification, and Denitrification involving specific bacterial functions.
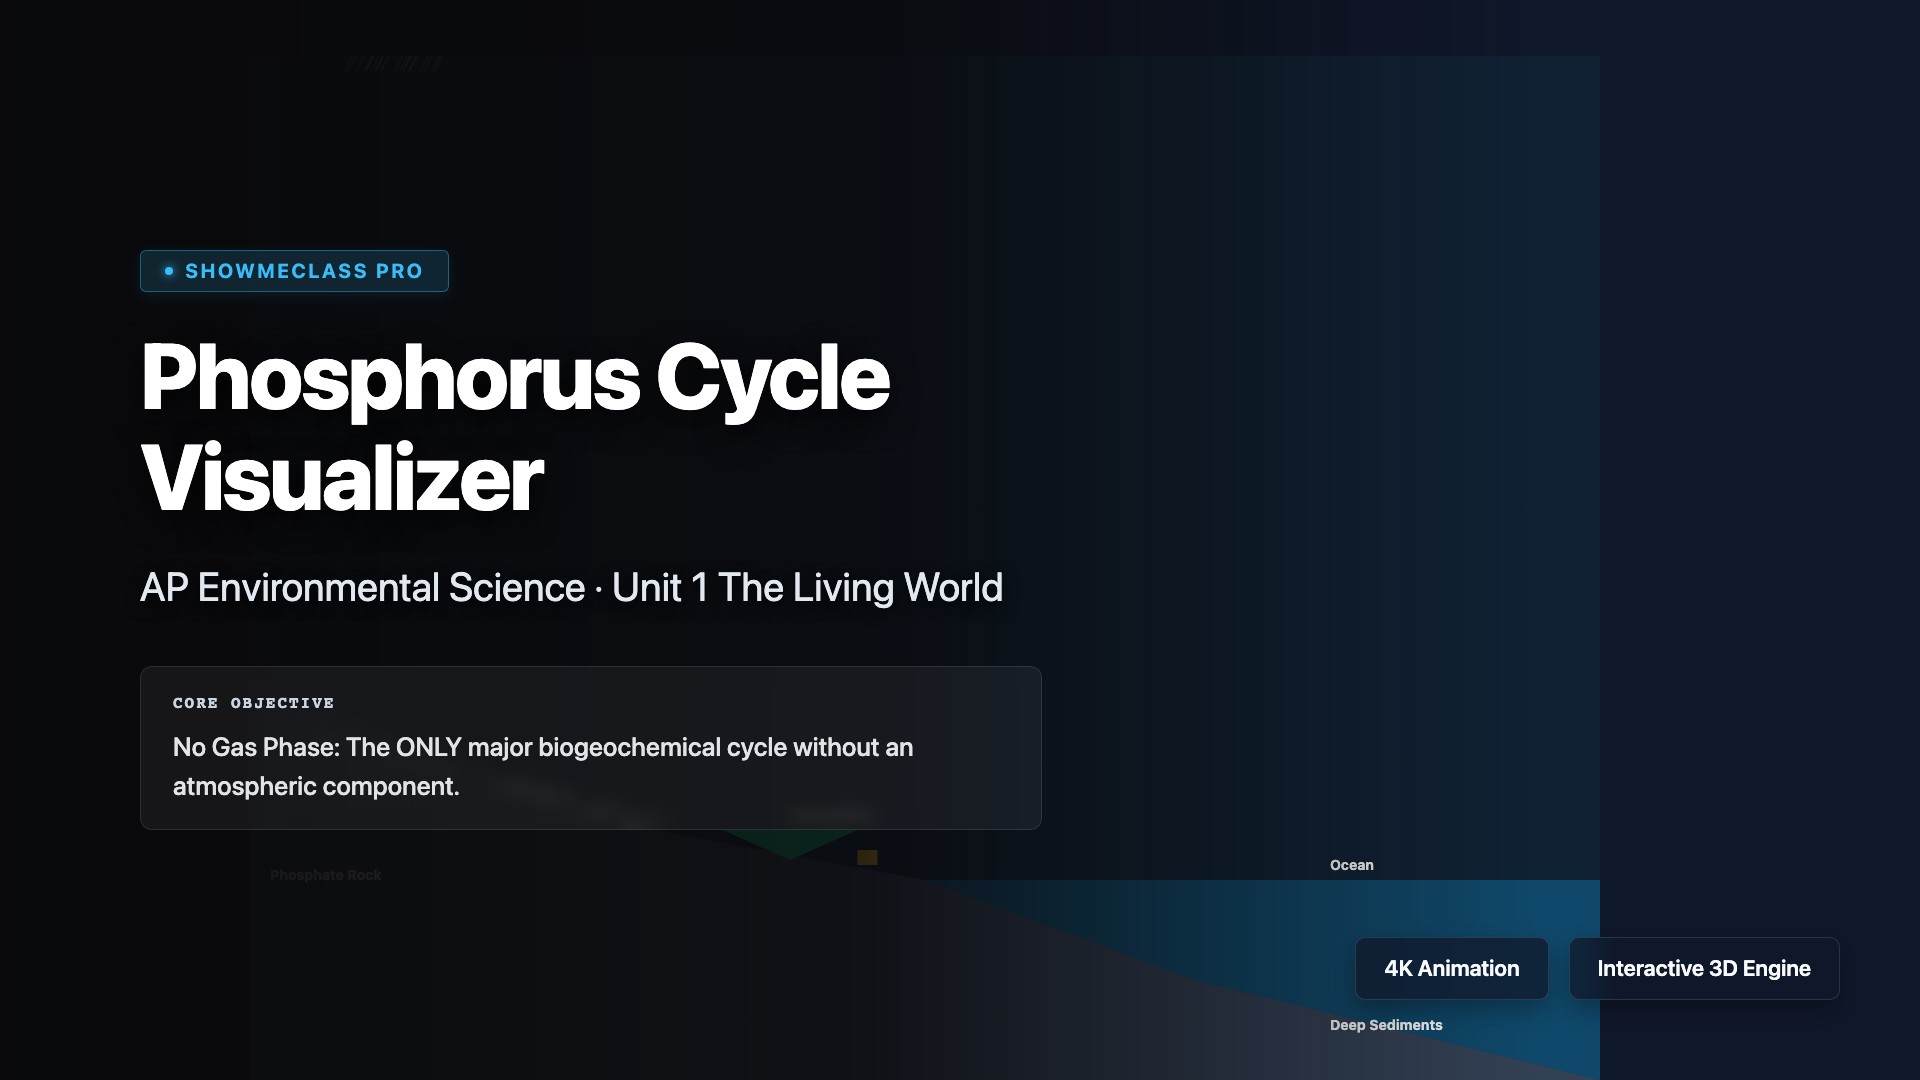
Phosphorus Cycle Visualizer
Phosphorus Cycle showing the absence of an atmospheric phase, slow rock weathering, biological assimilation into DNA/ATP, marine sedimentation, and long-term geologic uplift.

Ecological Succession Simulator
Ecological Succession simulation focused on APES concepts: comparing Biomass accumulation and Species Richness curves for Primary vs Secondary Succession over time.
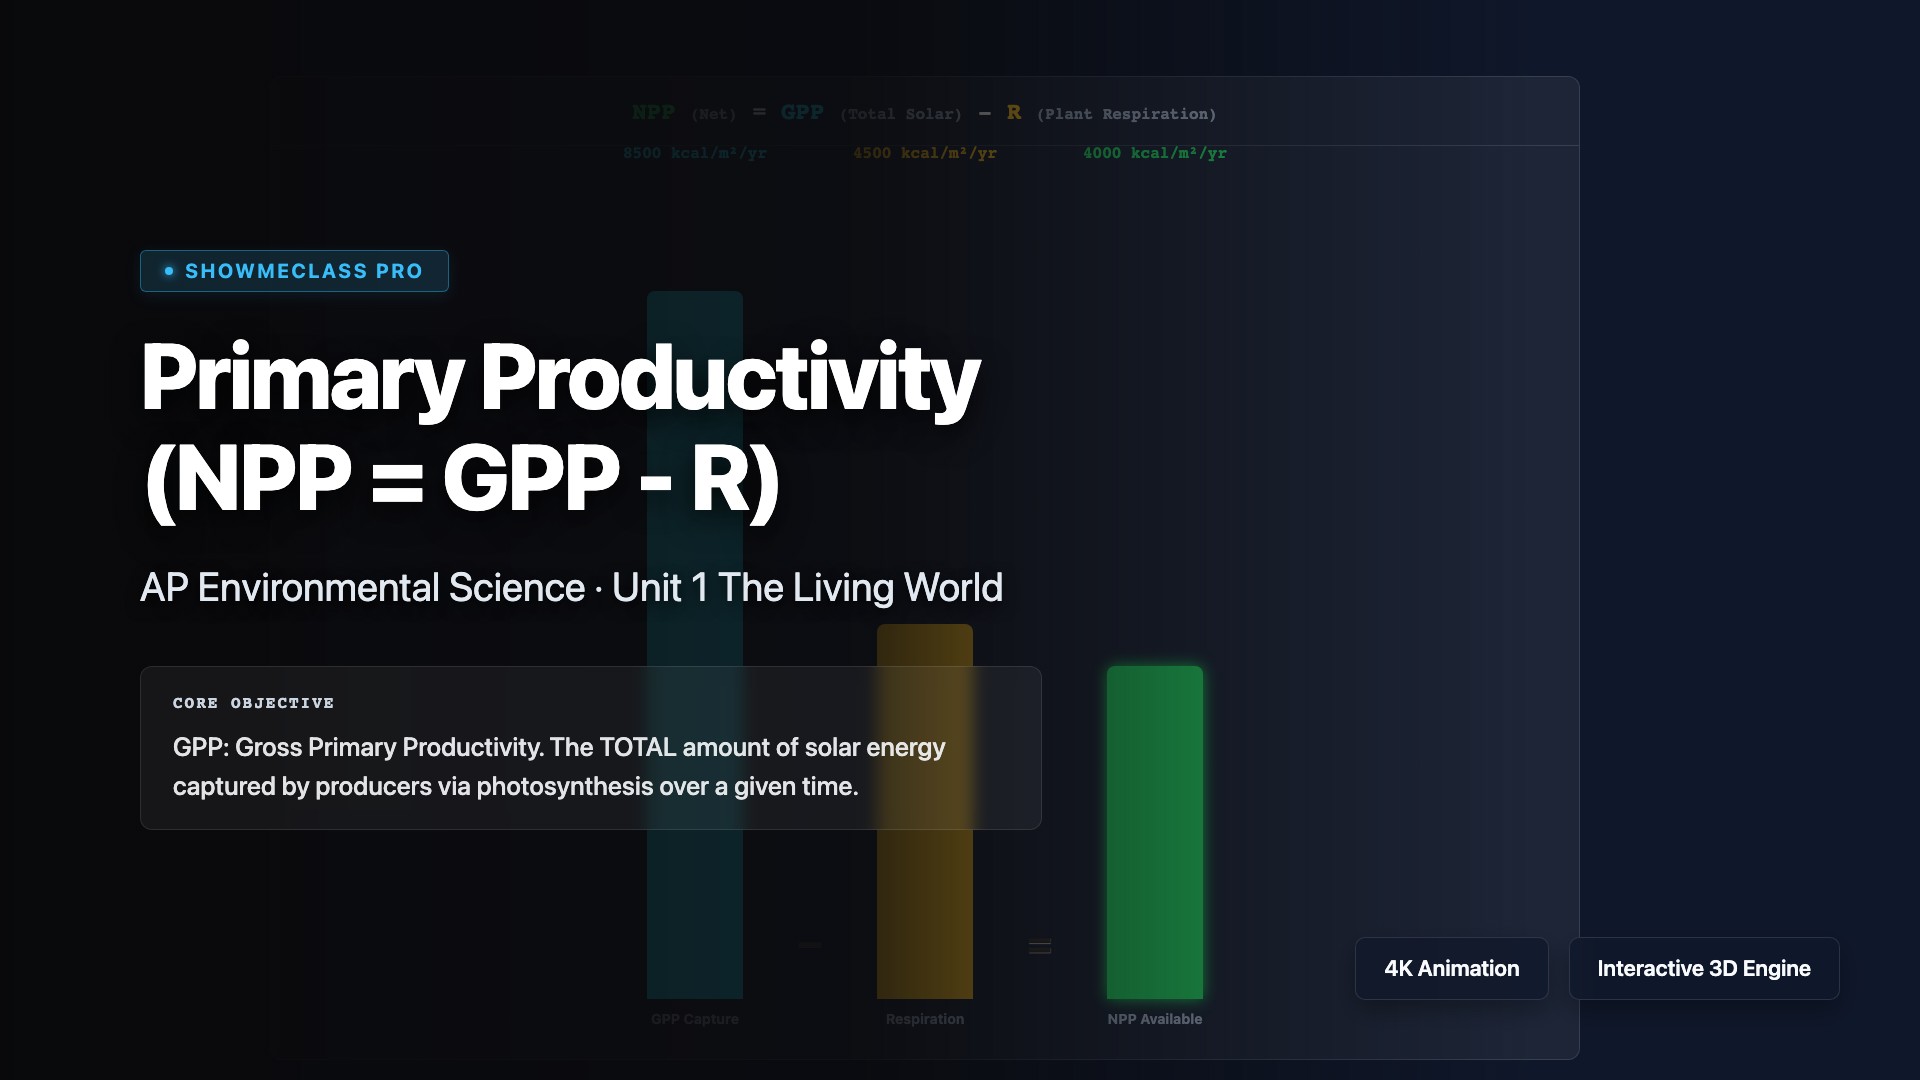
NPP & GPP Calculator
Tool to calculate and visualize Net Primary Productivity (NPP = GPP - Respiration). Explores the distinct productivity rates across various global biomes.
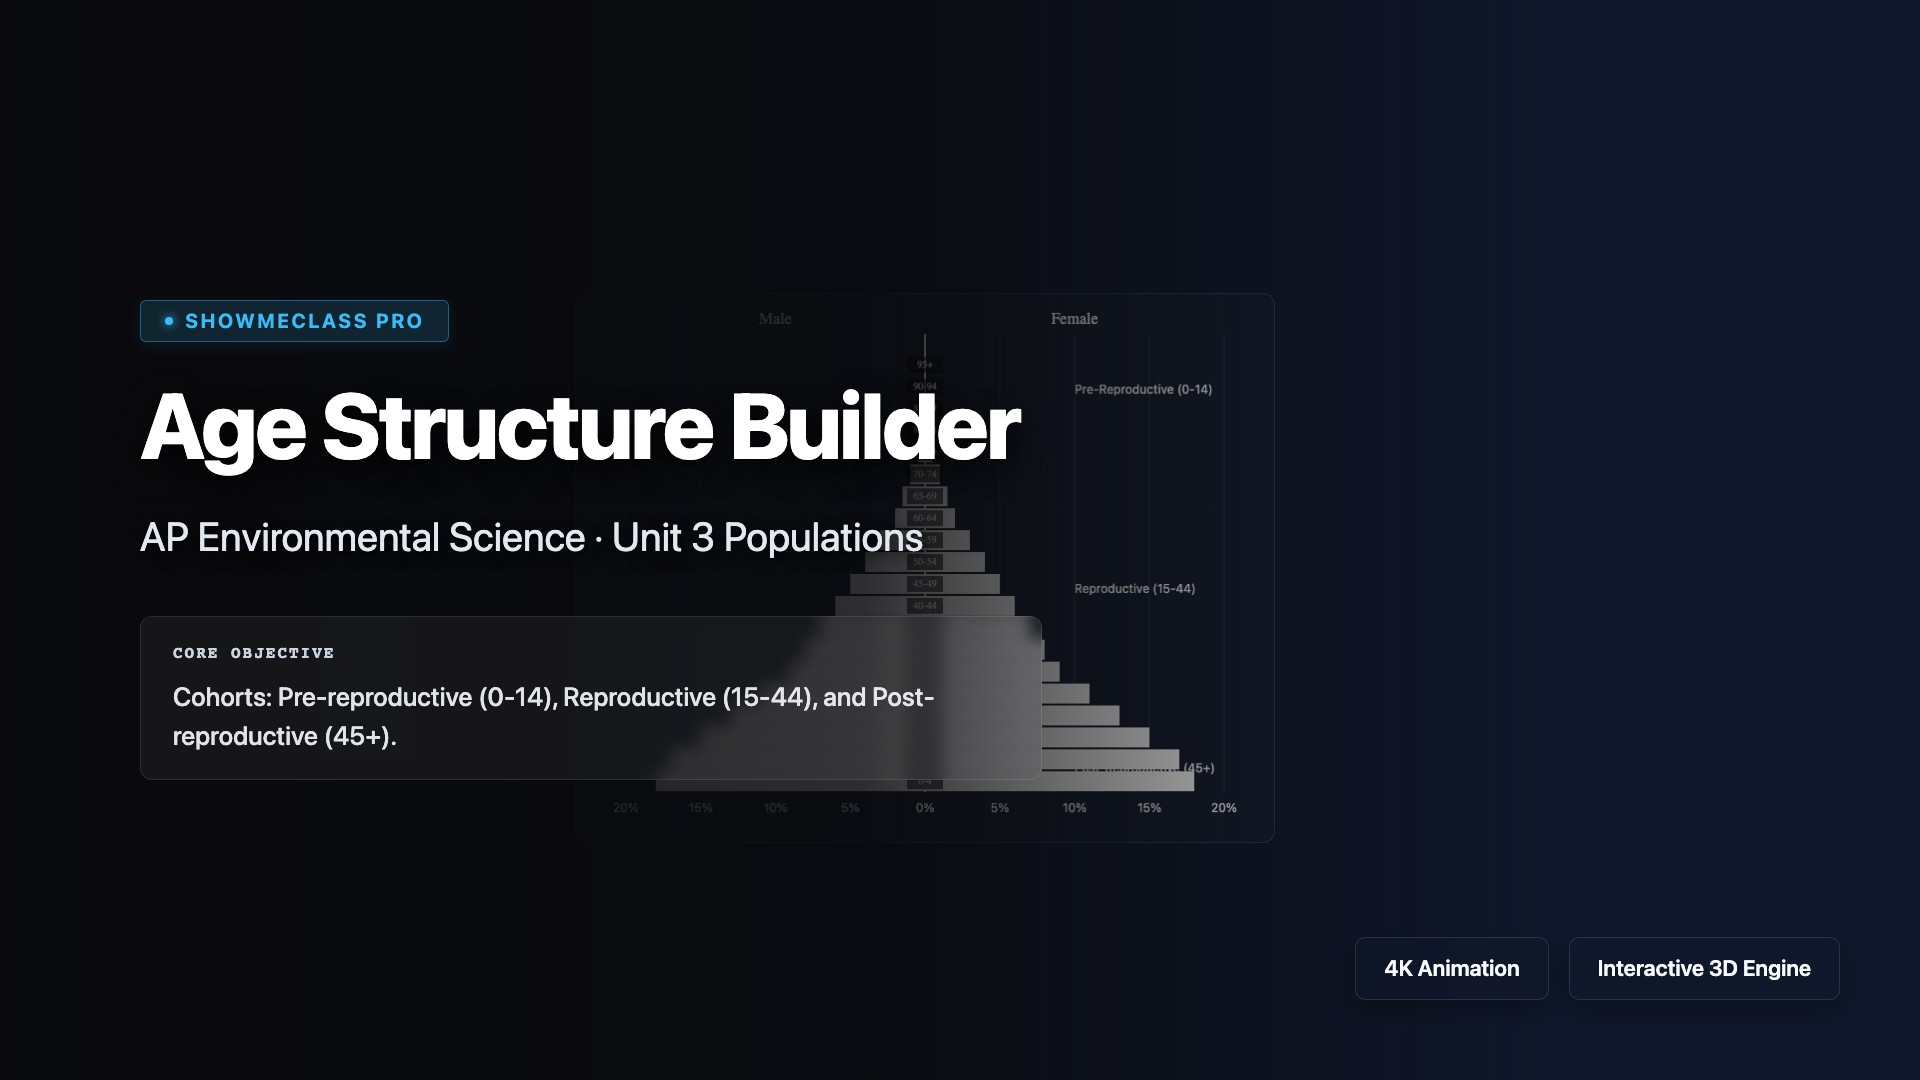
Age Structure Builder
Interactive Age Structure Pyramid Builder. Analyzes demographics, growth models (rapid, slow, stable, declining), and reproductive cohorts.
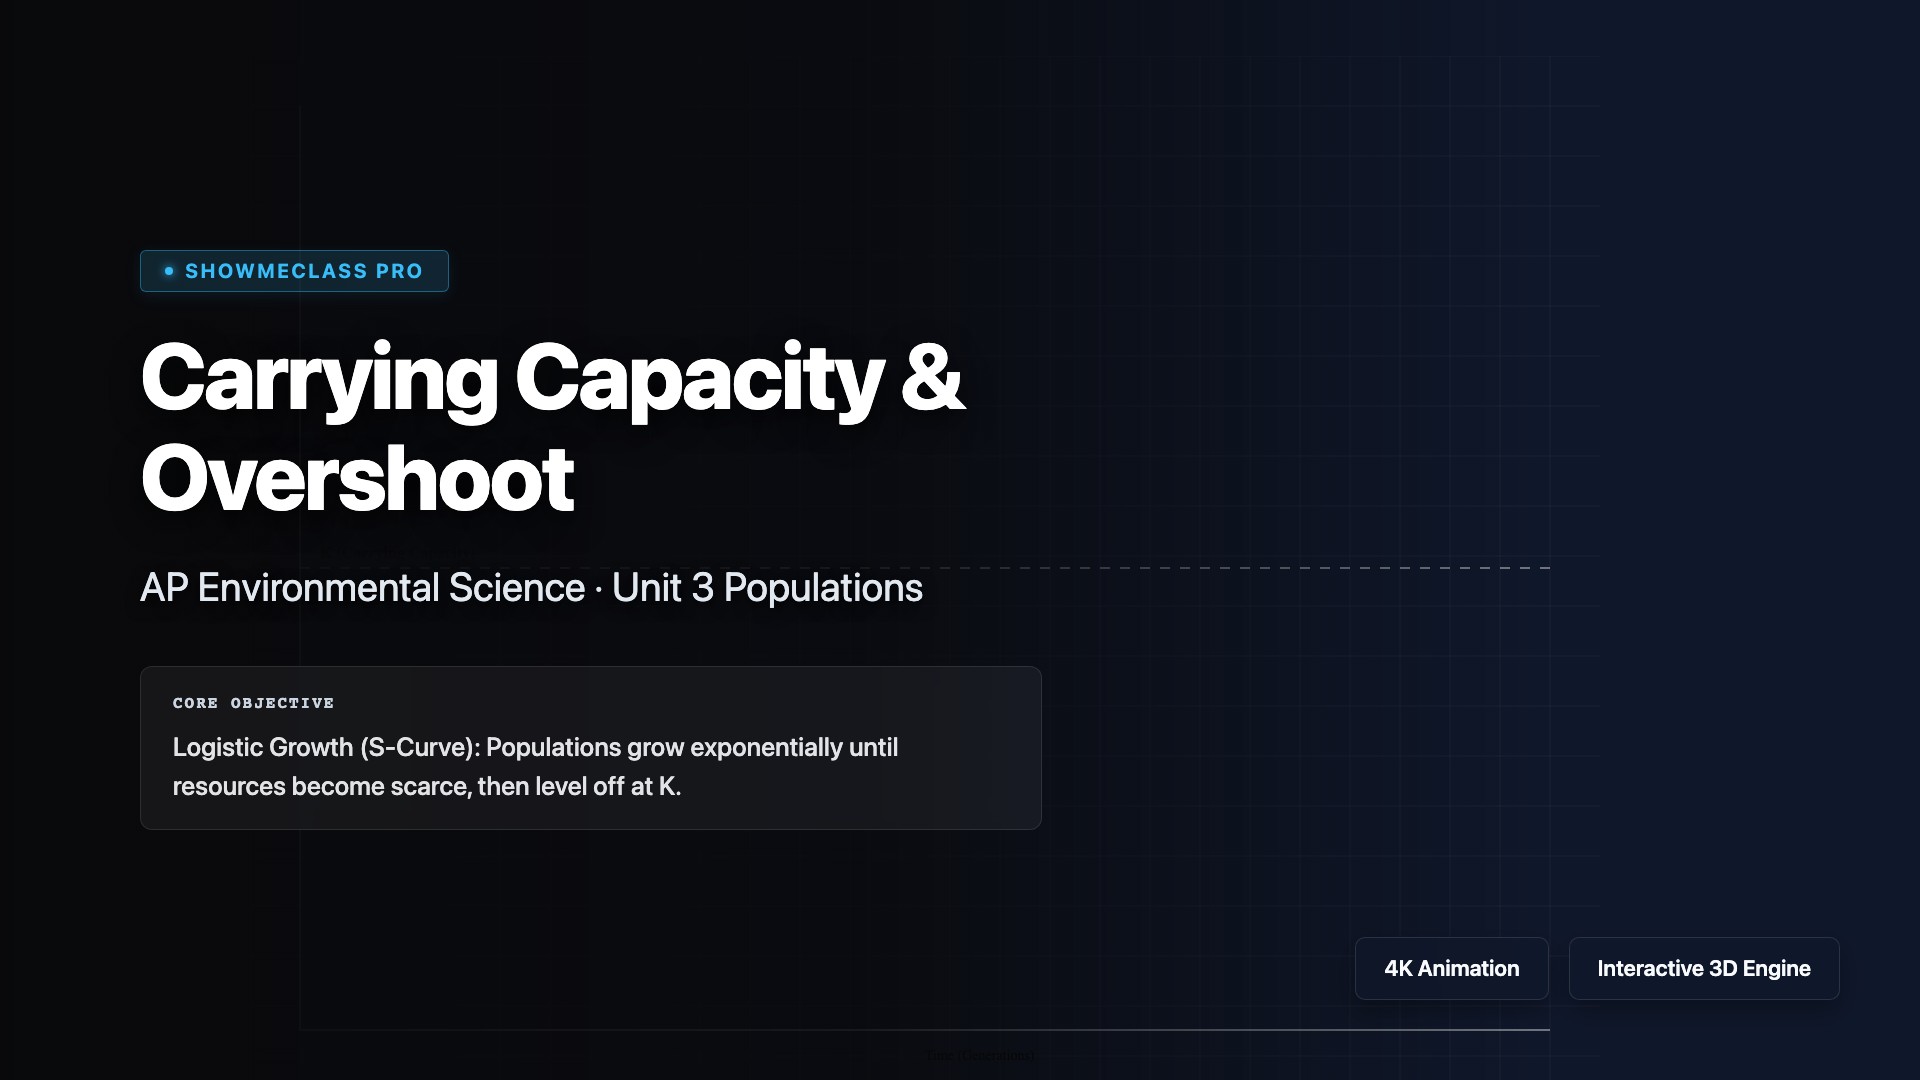
Carrying Capacity & Overshoot
Logistic population growth simulation modeling reproductive rate (r) lag, environmental carrying capacity limits (K), and severe resource overshoot dieback scenarios.
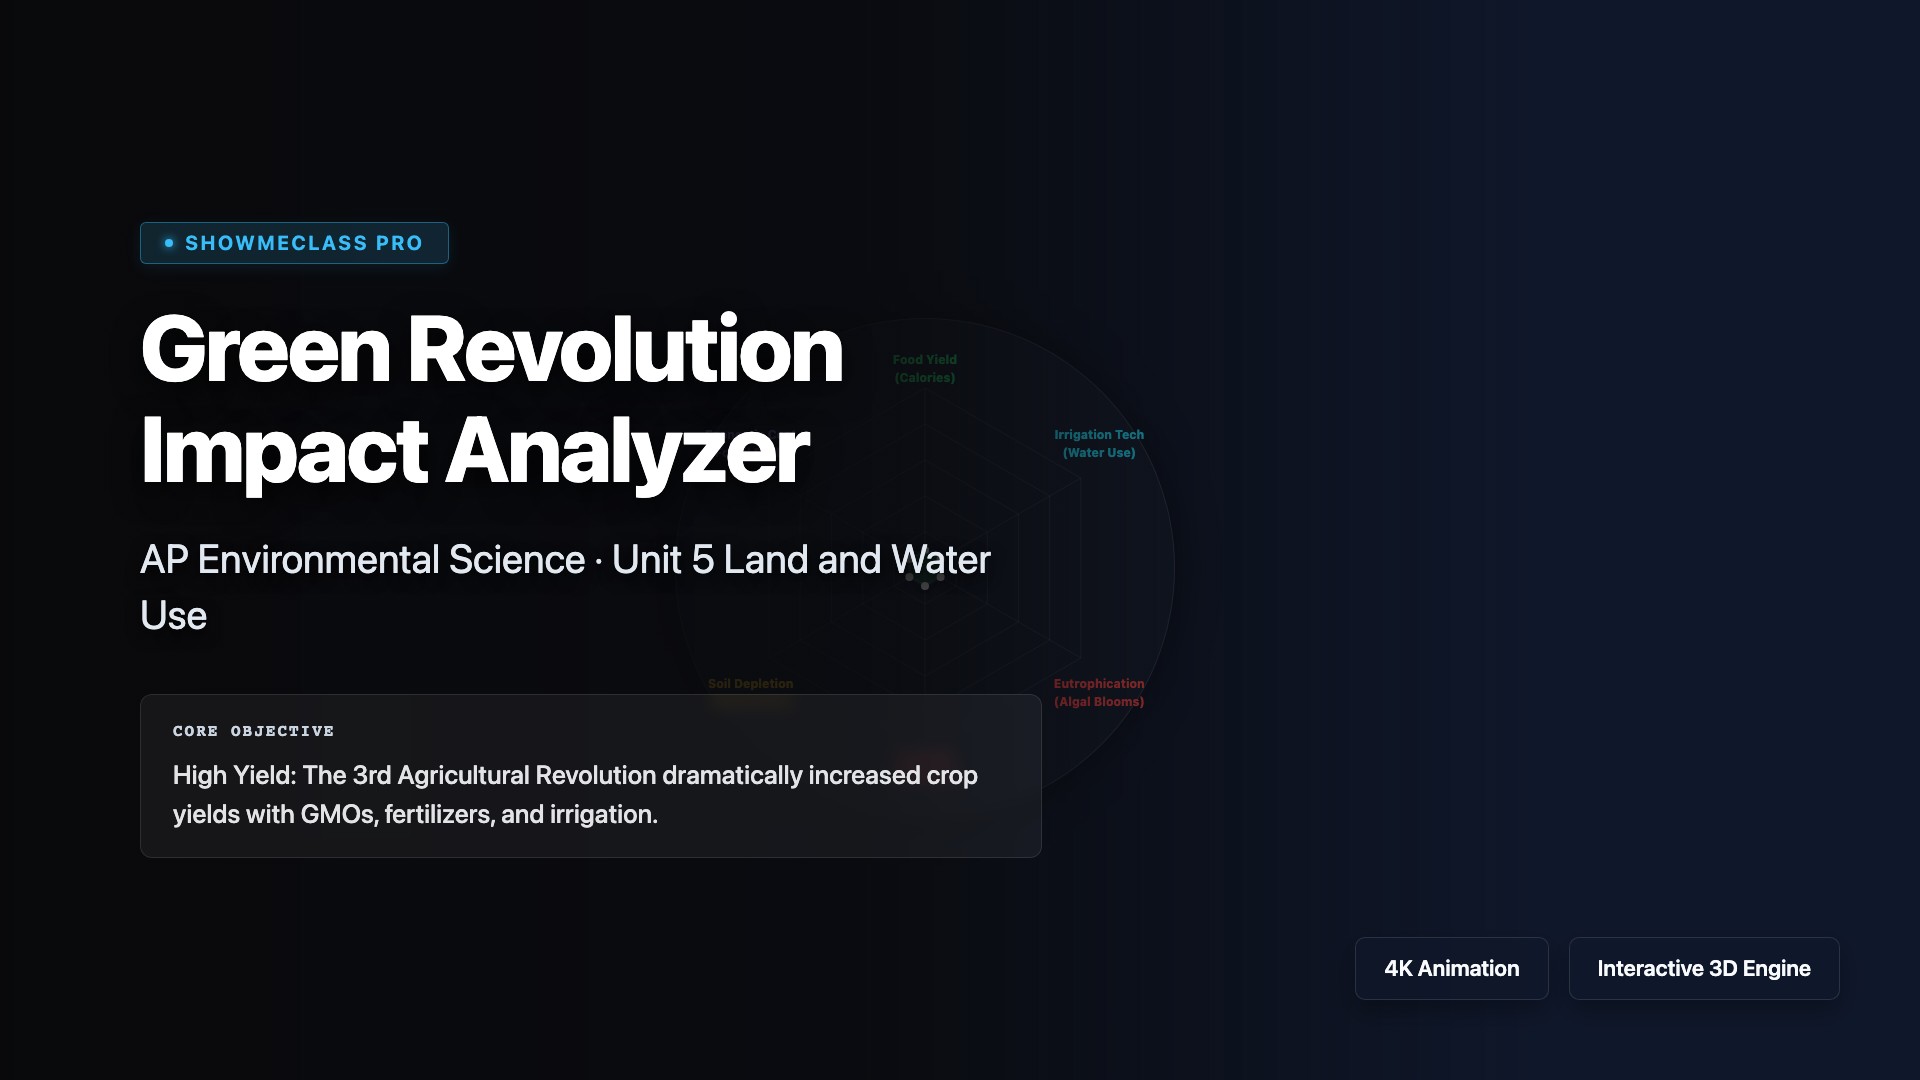
Green Revolution Impact Analyzer
Radar chart interactive exploring the trade-offs of the Green Revolution: drastically boosting yield via fertilizers and irrigation while risking eutrophication and salinization.
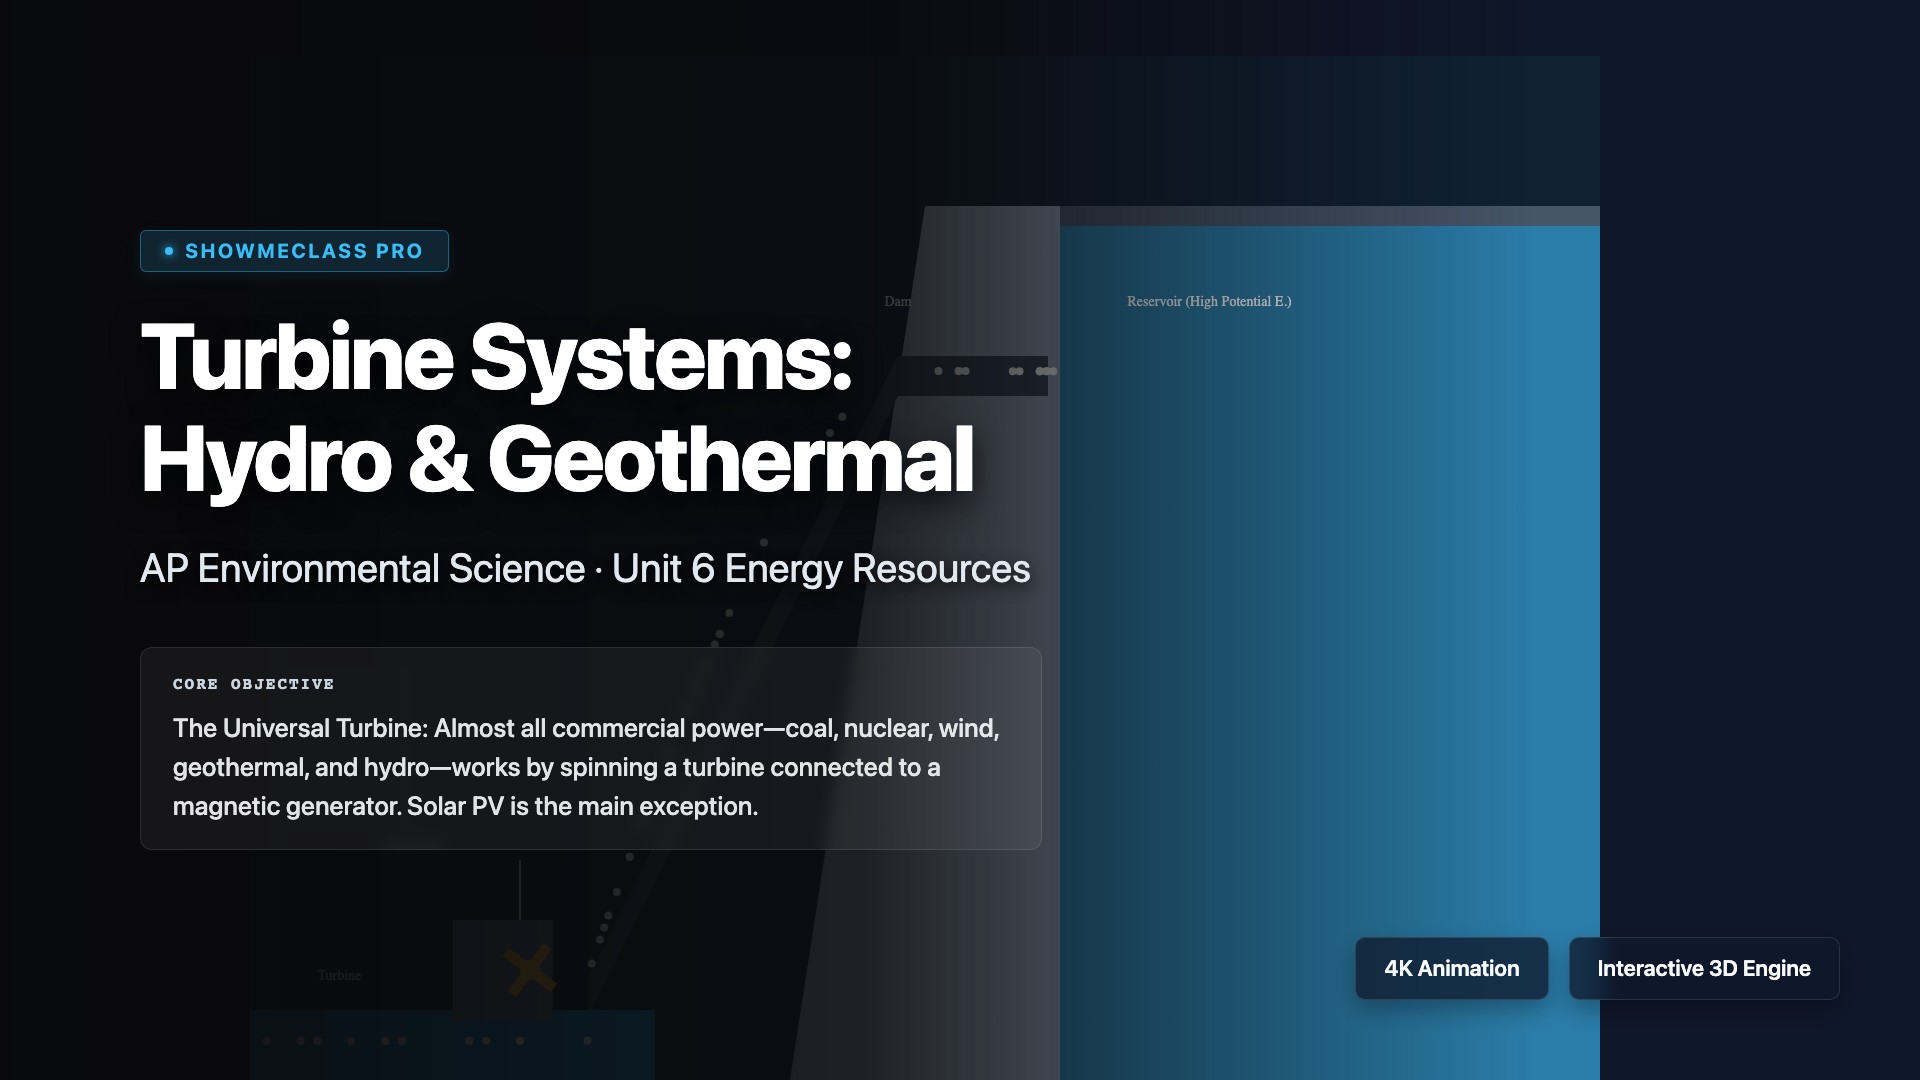
Turbine Systems: Hydro & Geothermal
Comparison of the ubiquitous turbine-generator electrical system, modeled for Gravity/Kinetic generation (Hydroelectric dam) and Heat/Steam generation (Geothermal mapping).
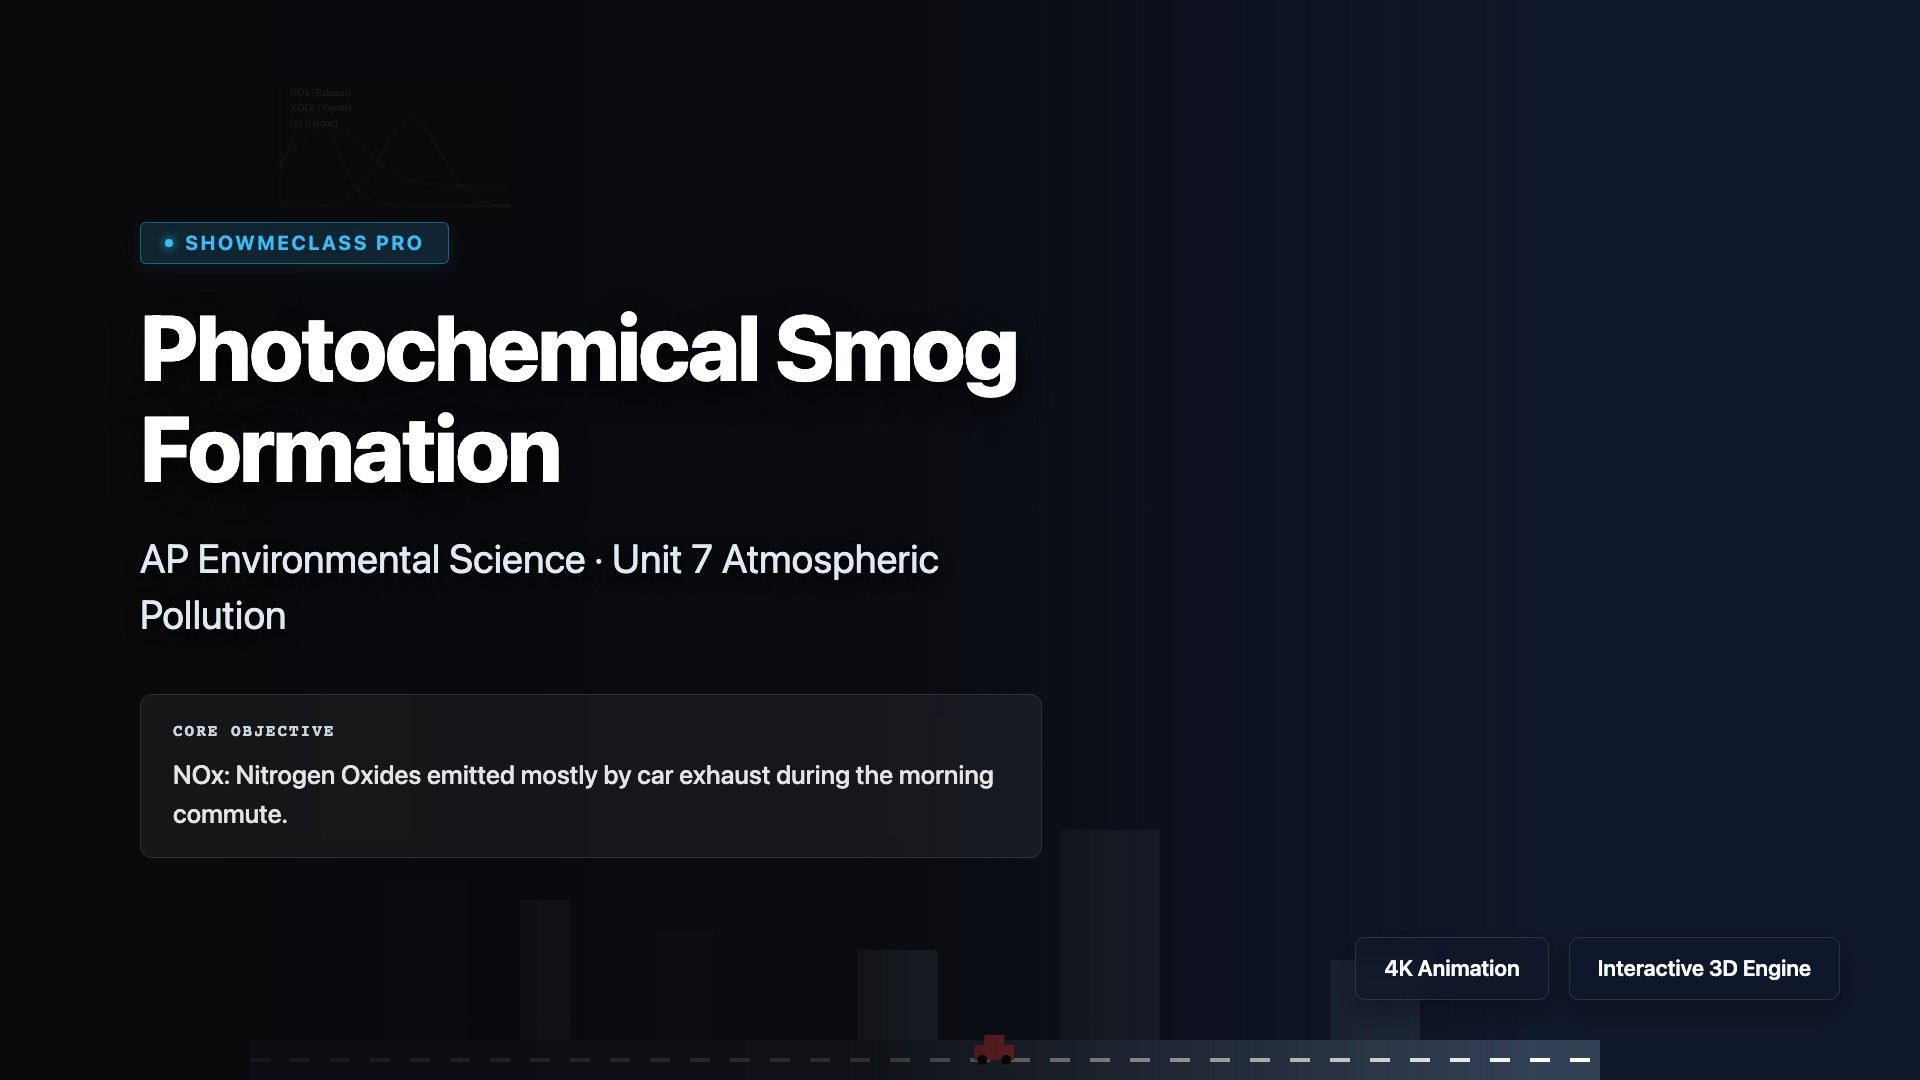
Photochemical Smog Formation
Interactive diurnal cycle simulator mapping the timing offset between morning commuter NOx emissions and peak afternoon photochemcial ozone formation.
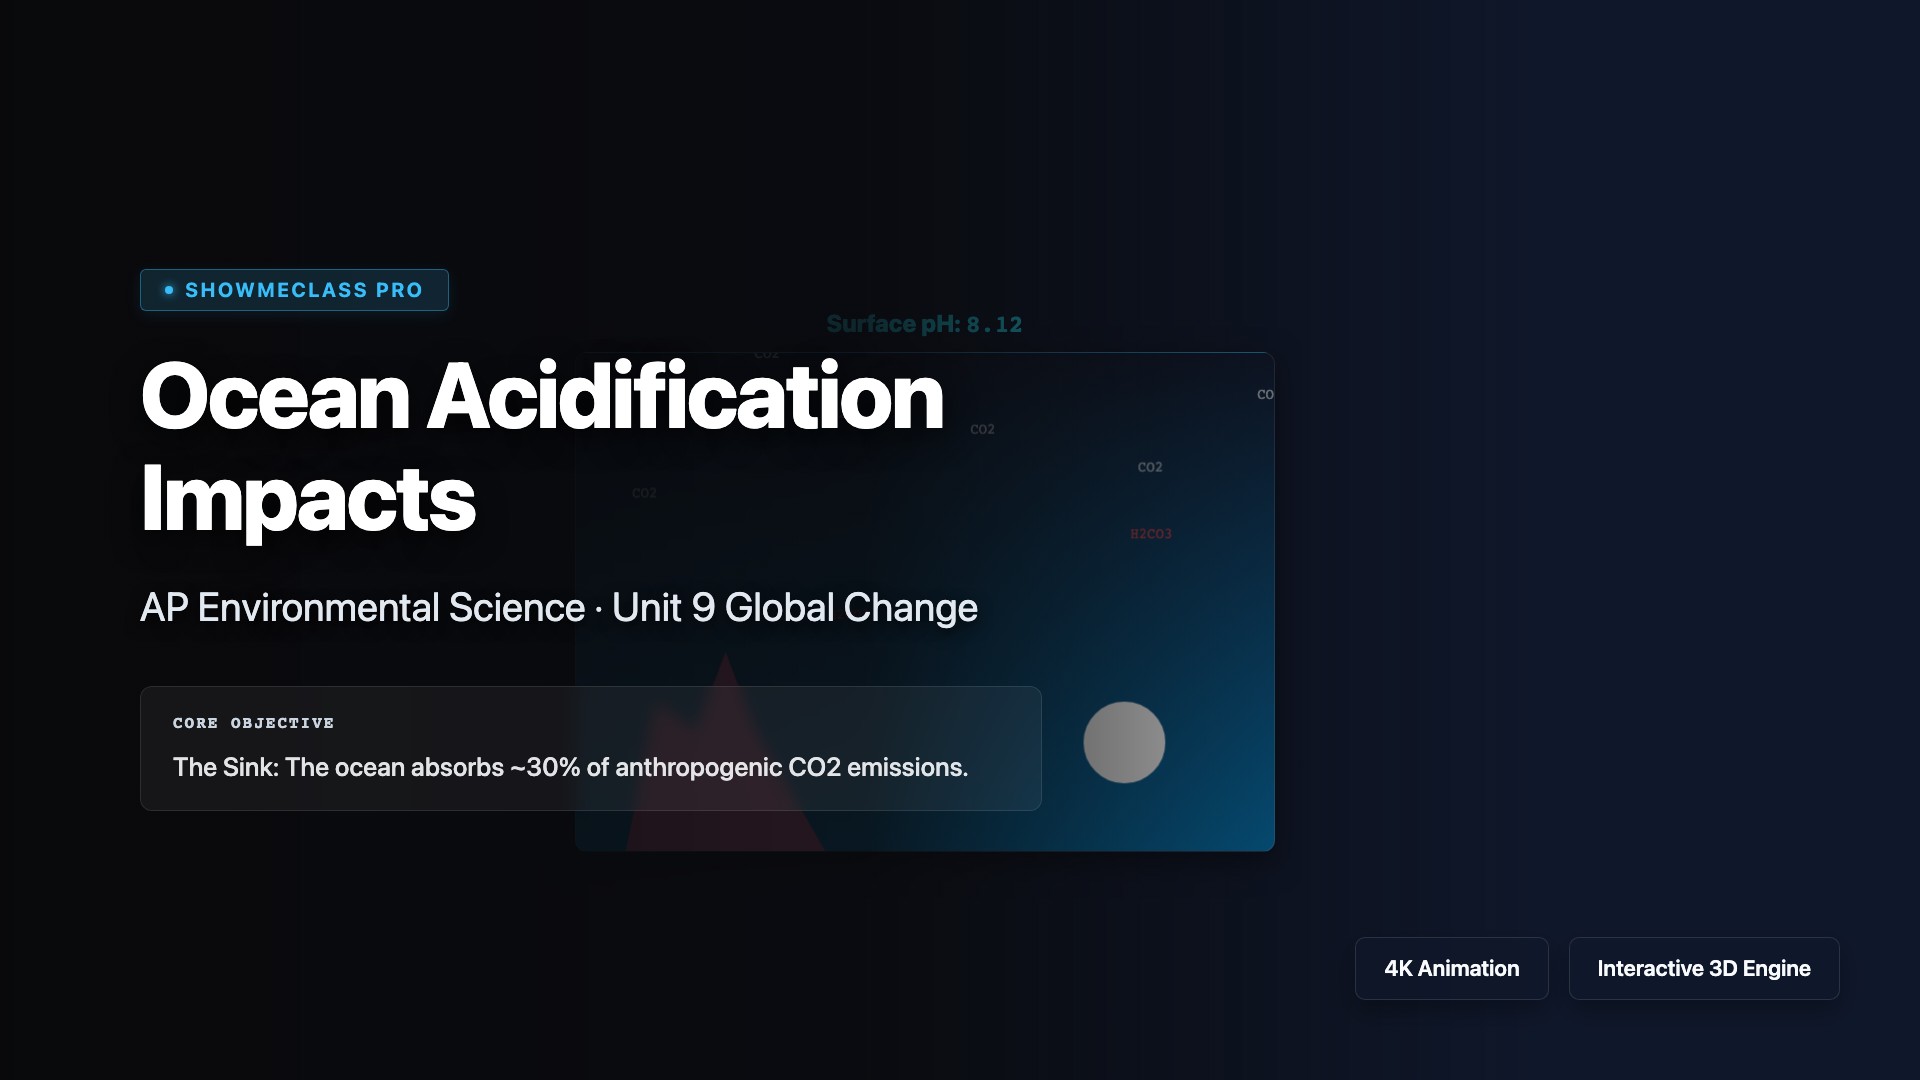
Ocean Acidification Impacts
Chemistry visualization of oceanic CO2 absorption forming Carbonic Acid. Tracks the precise mathematical pH logarithmic shift and devastating bio-calcification impacts (aragonite dissolution).
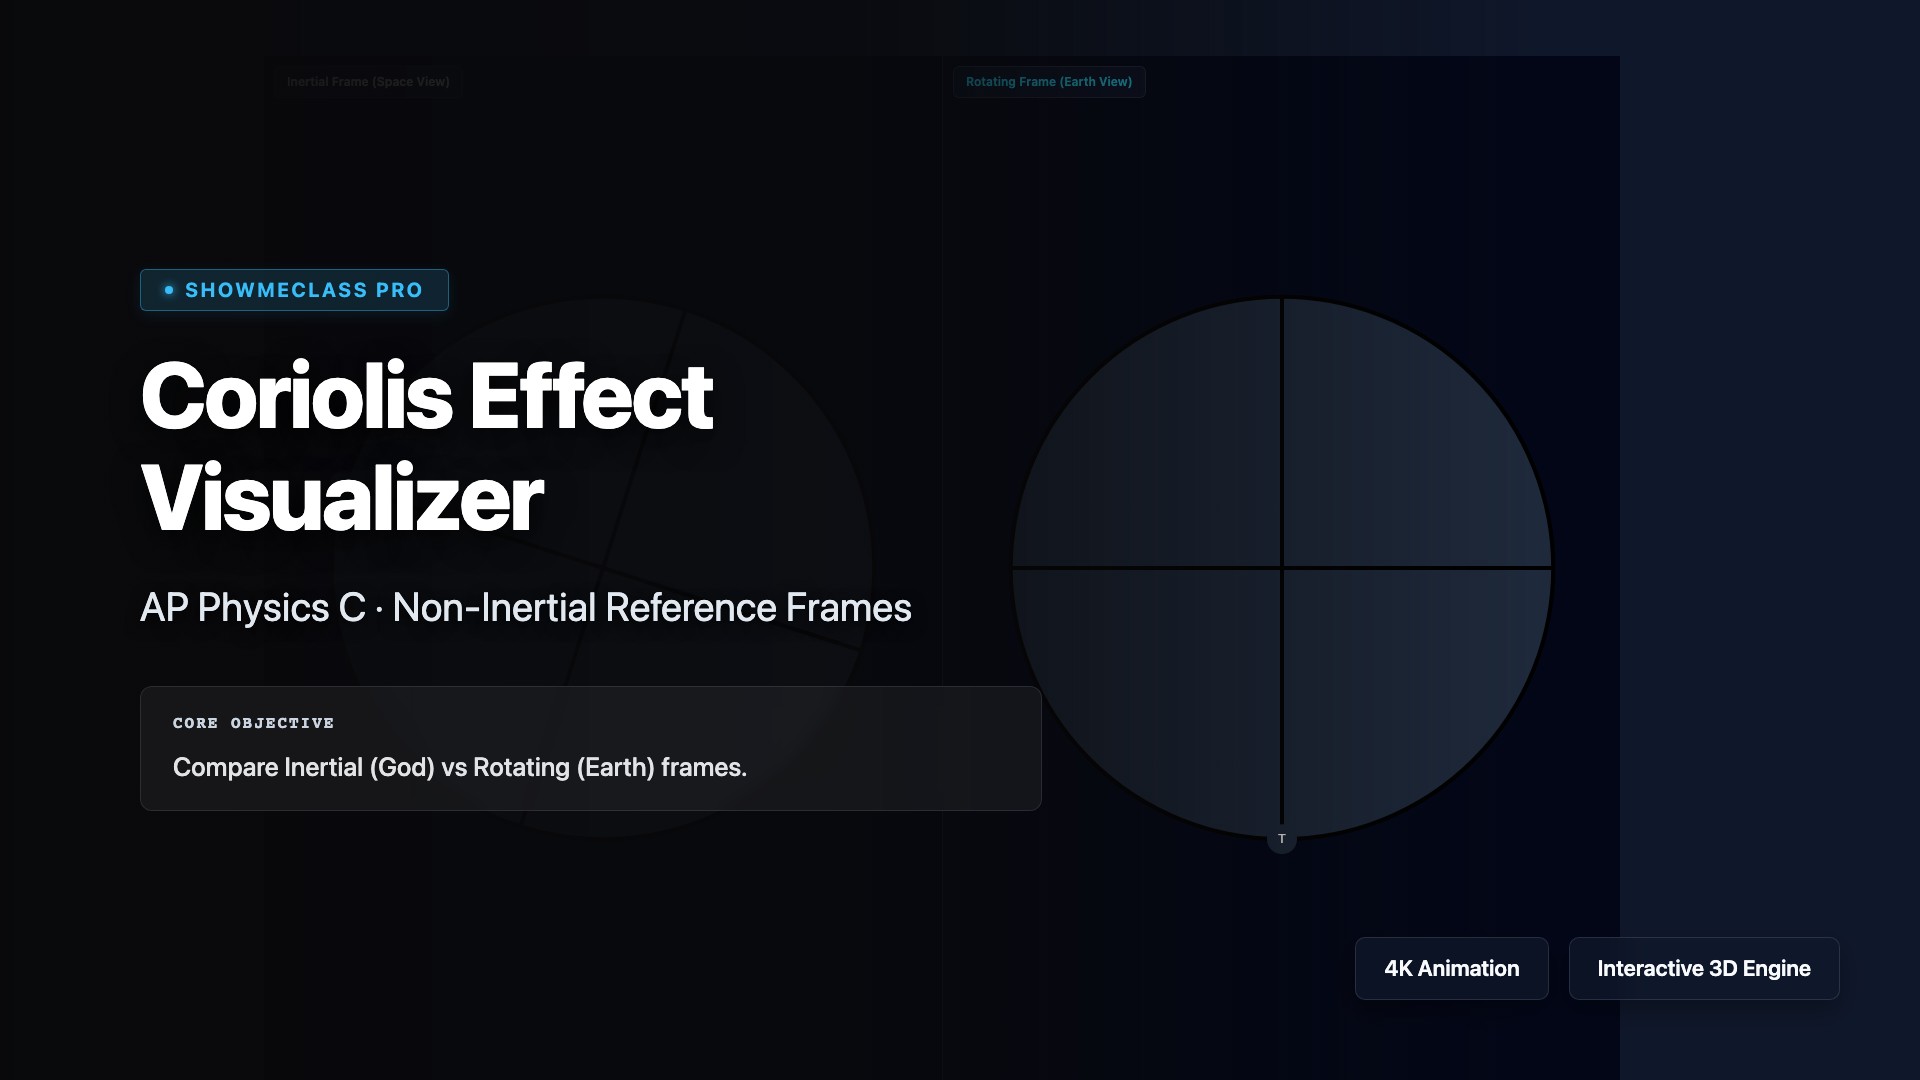
Coriolis Effect Visualizer
A split-screen comparison revealing the true nature of 'fictitious' forces. Watch a projectile travel in a perfectly straight line from an Inertial space perspective, while simultaneously generating a sweeping curved path on a Rotating earth frame.