Showing 12 results
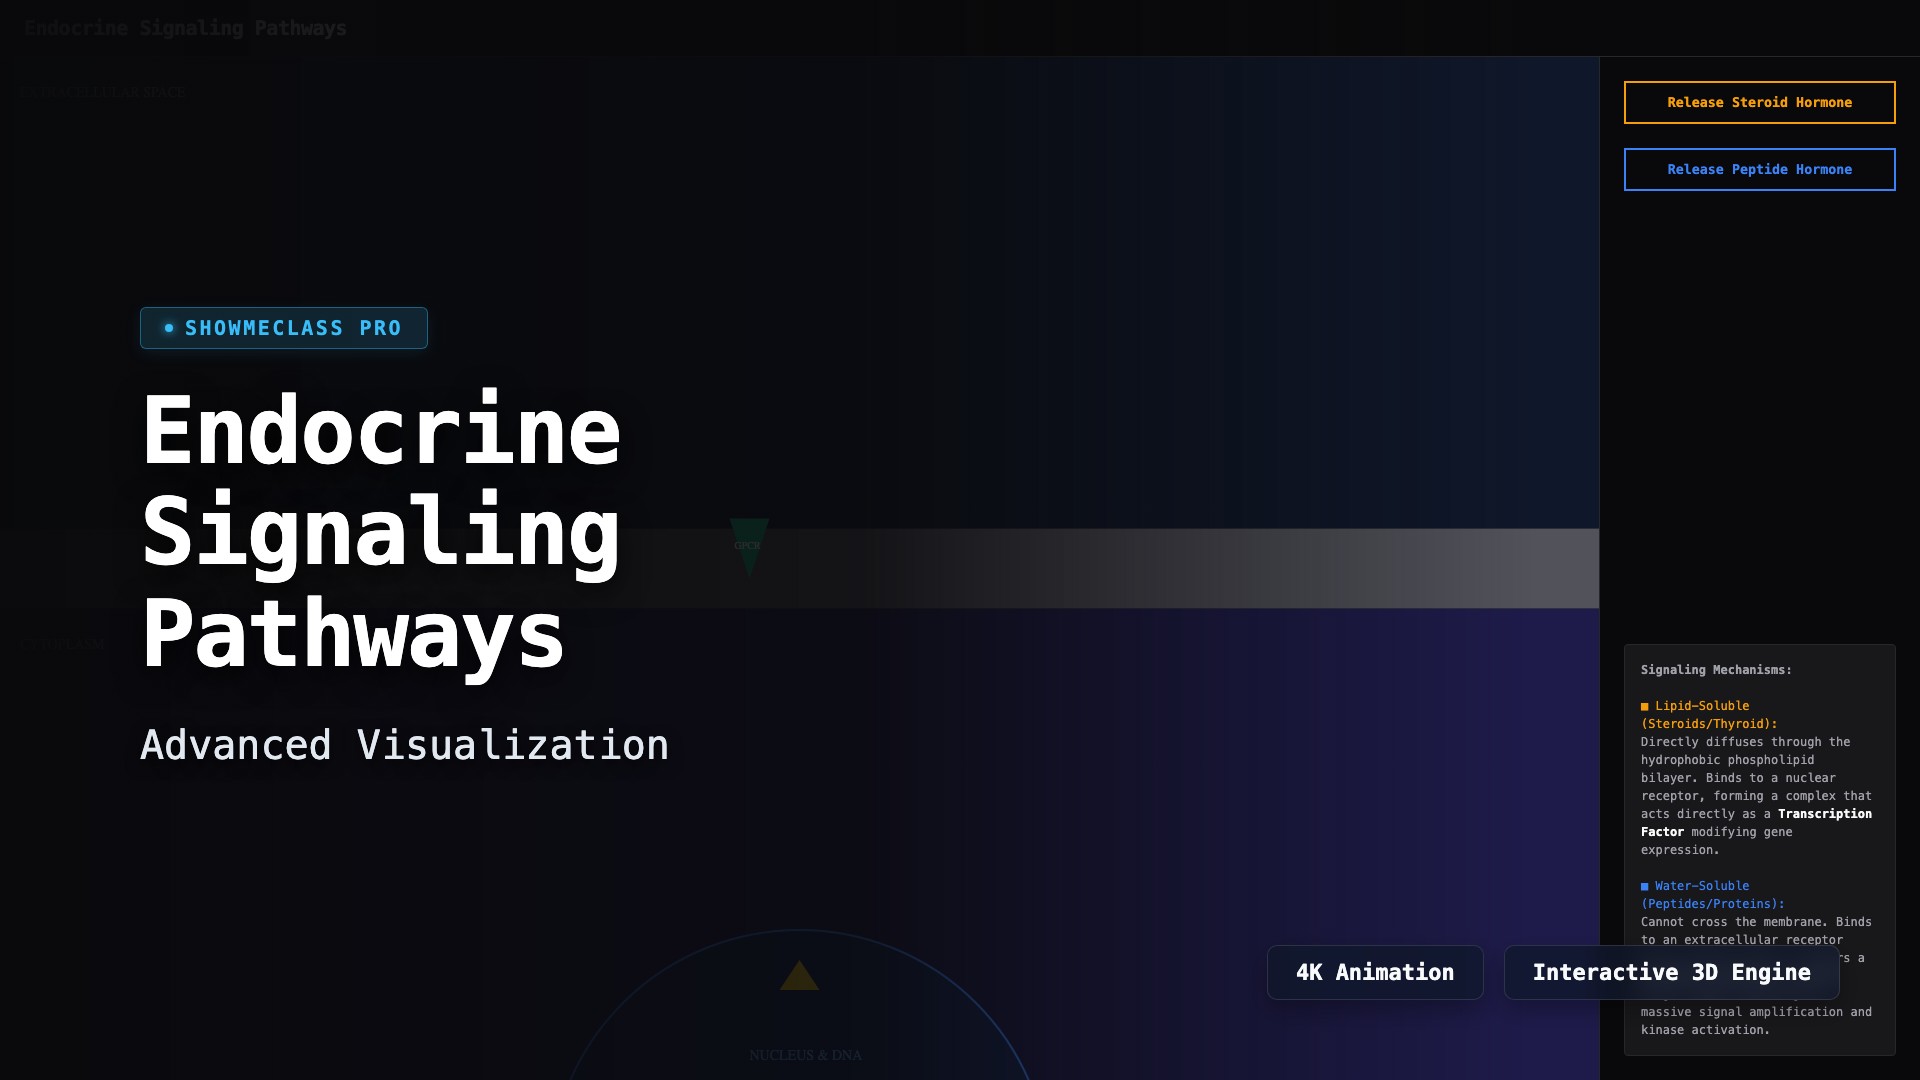
Endocrine System Signaling Pathways
Simulate hormone cell signaling. Compare lipid-soluble steroid diffusion acting as a nuclear transcription factor versus water-soluble peptide binding that triggers a massive cAMP secondary messenger cascade.
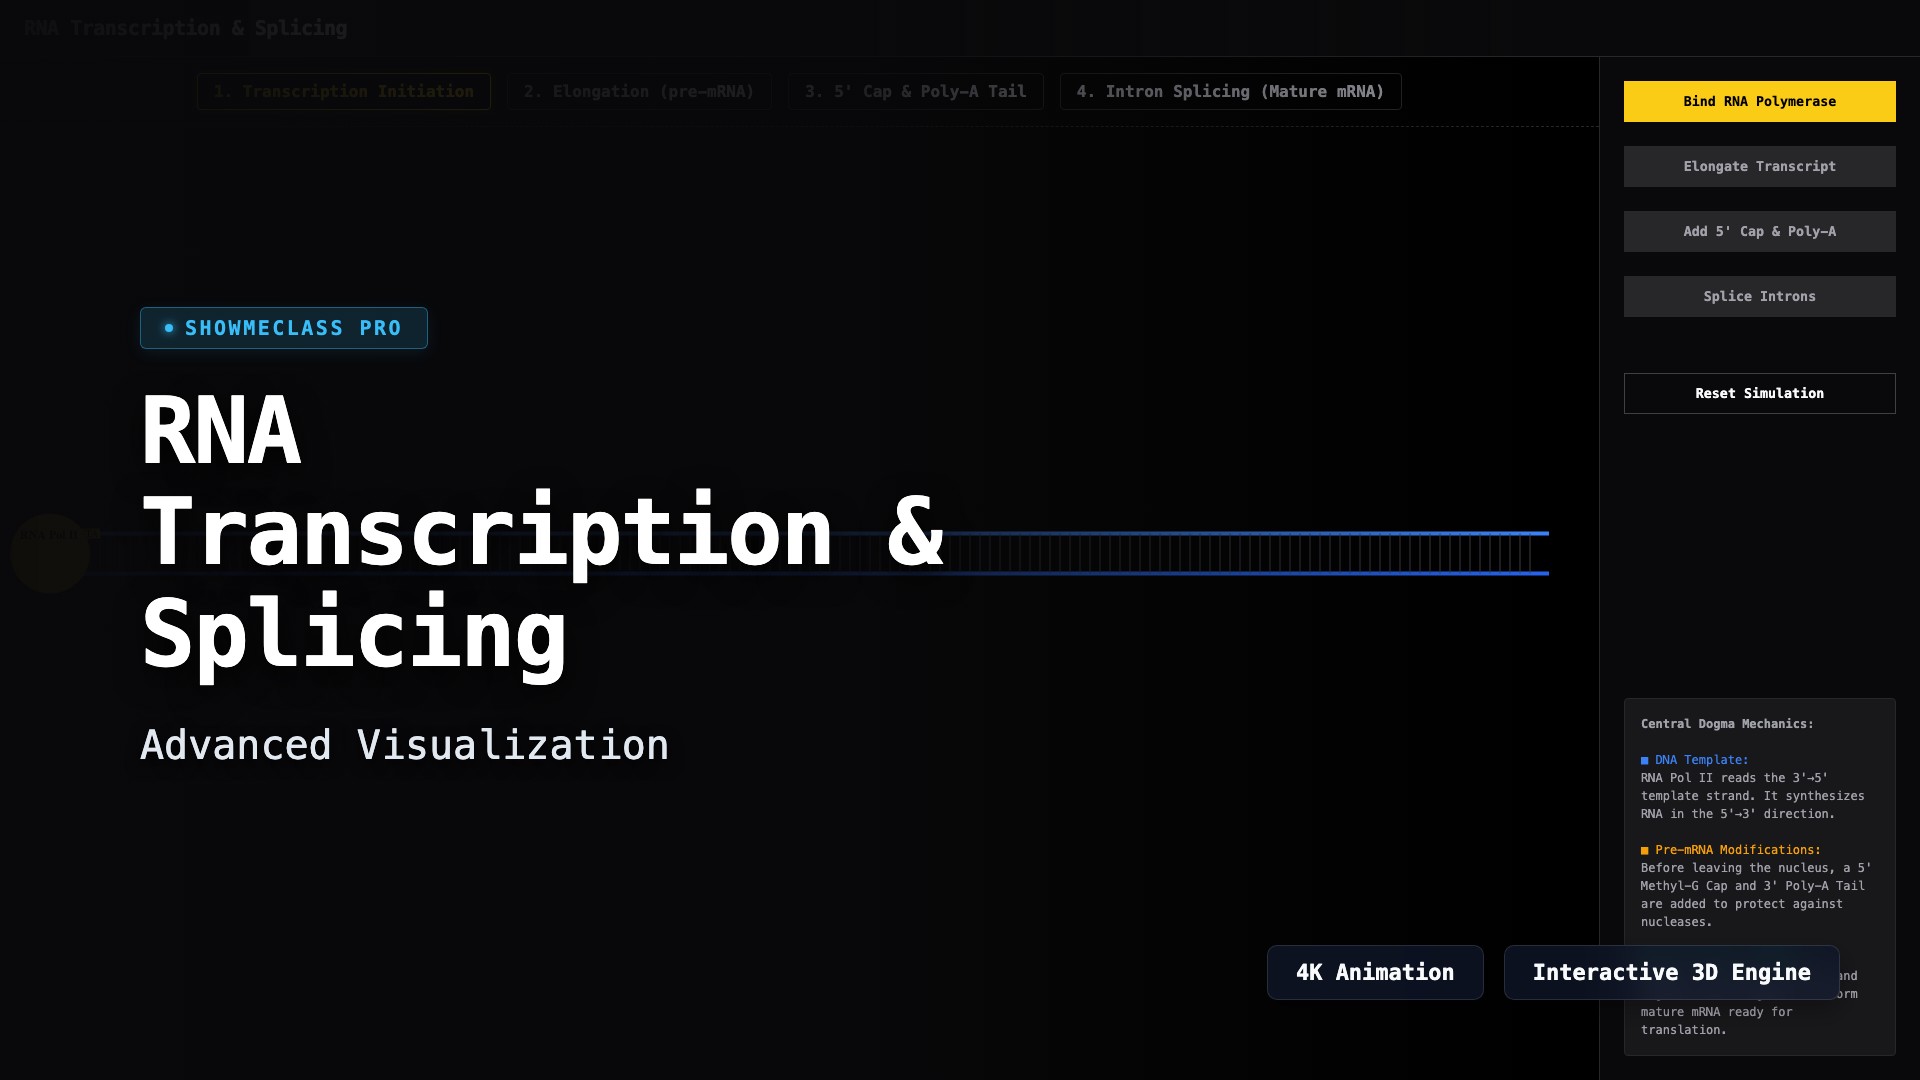
RNA Transcription & Splicing Processing
Walk through the Central Dogma. Bind RNA Polymerase II to the promoter, elongate the pre-mRNA transcript, and execute post-transcriptional modifications including 5' Capping, Poly-A tailing, and spliceosome intron cleavage.
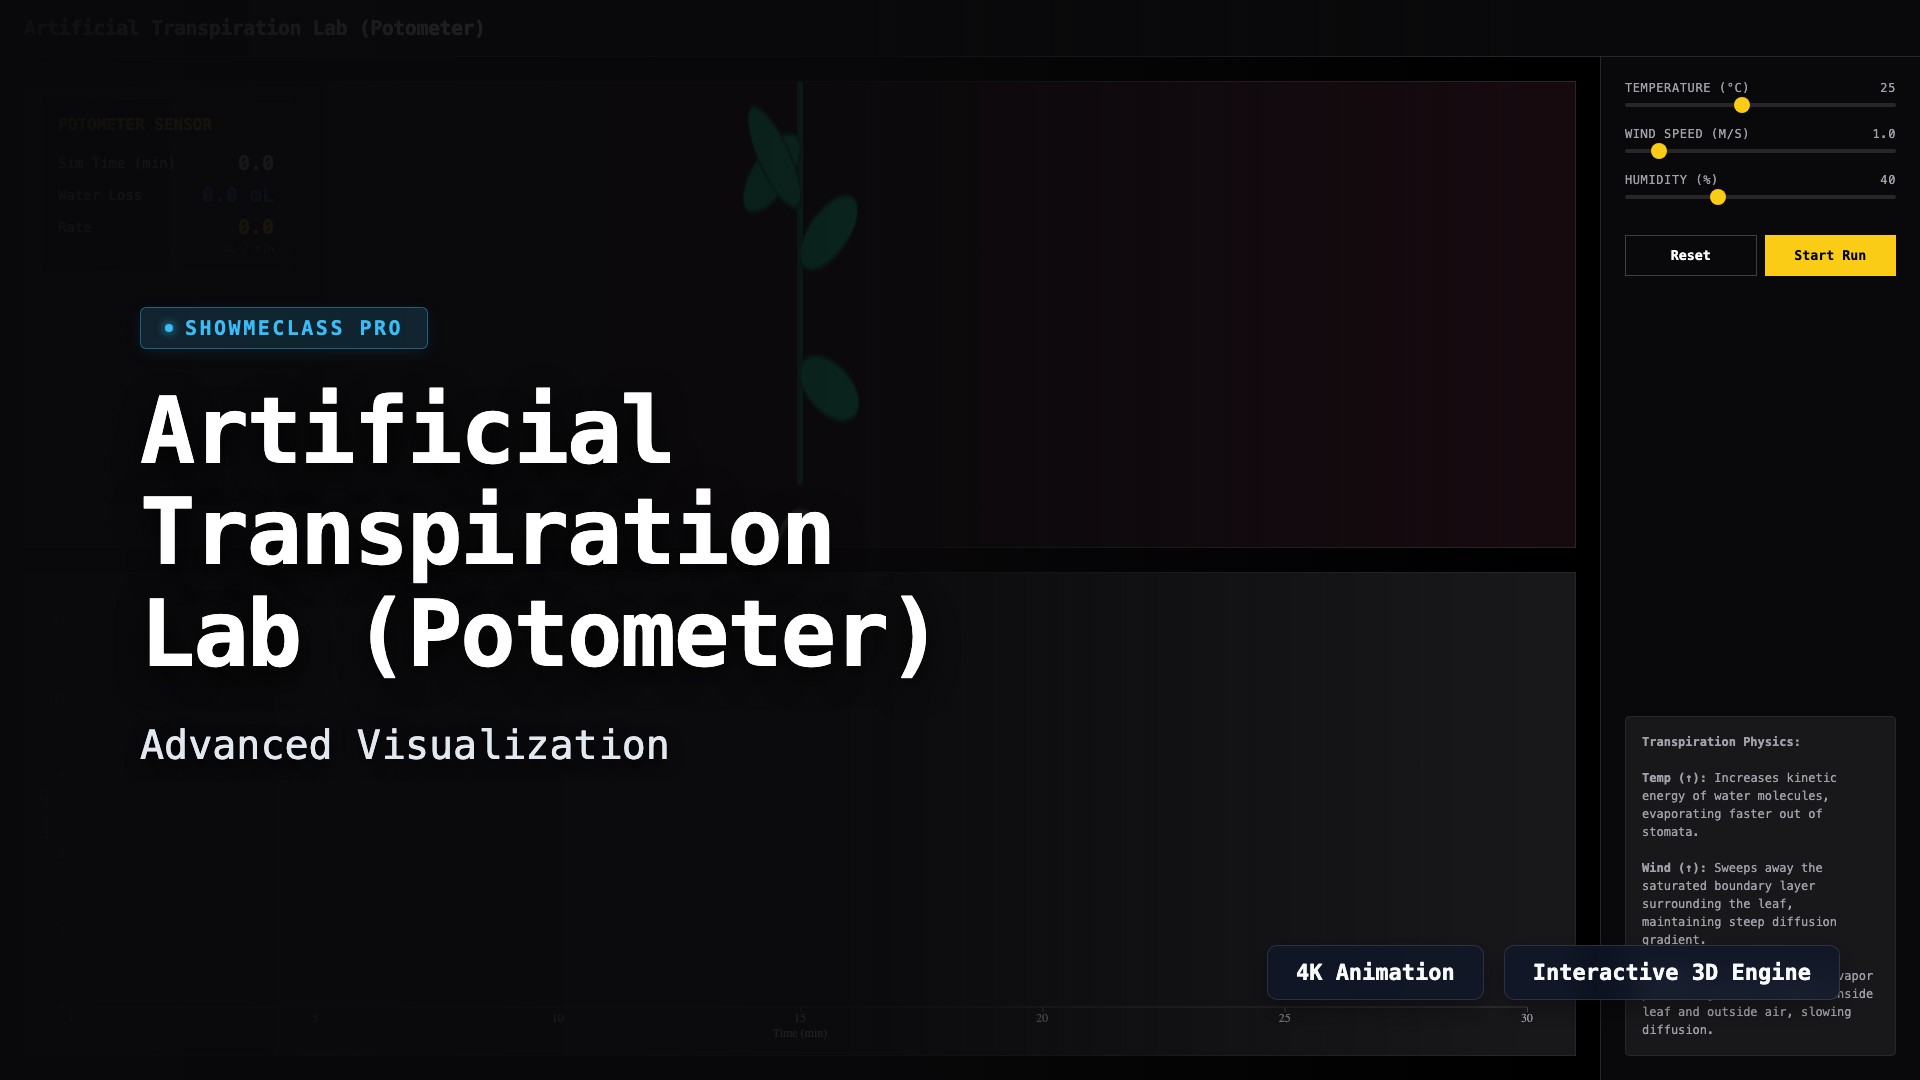
Artificial Transpiration Lab (Potometer)
Measure the rate of water loss in a simulated plant cutting using a virtual potometer. Adjust environmental physics variables including Temperature, Wind Speed, and Humidity to determine their exact multiplicative effects on evaporation.
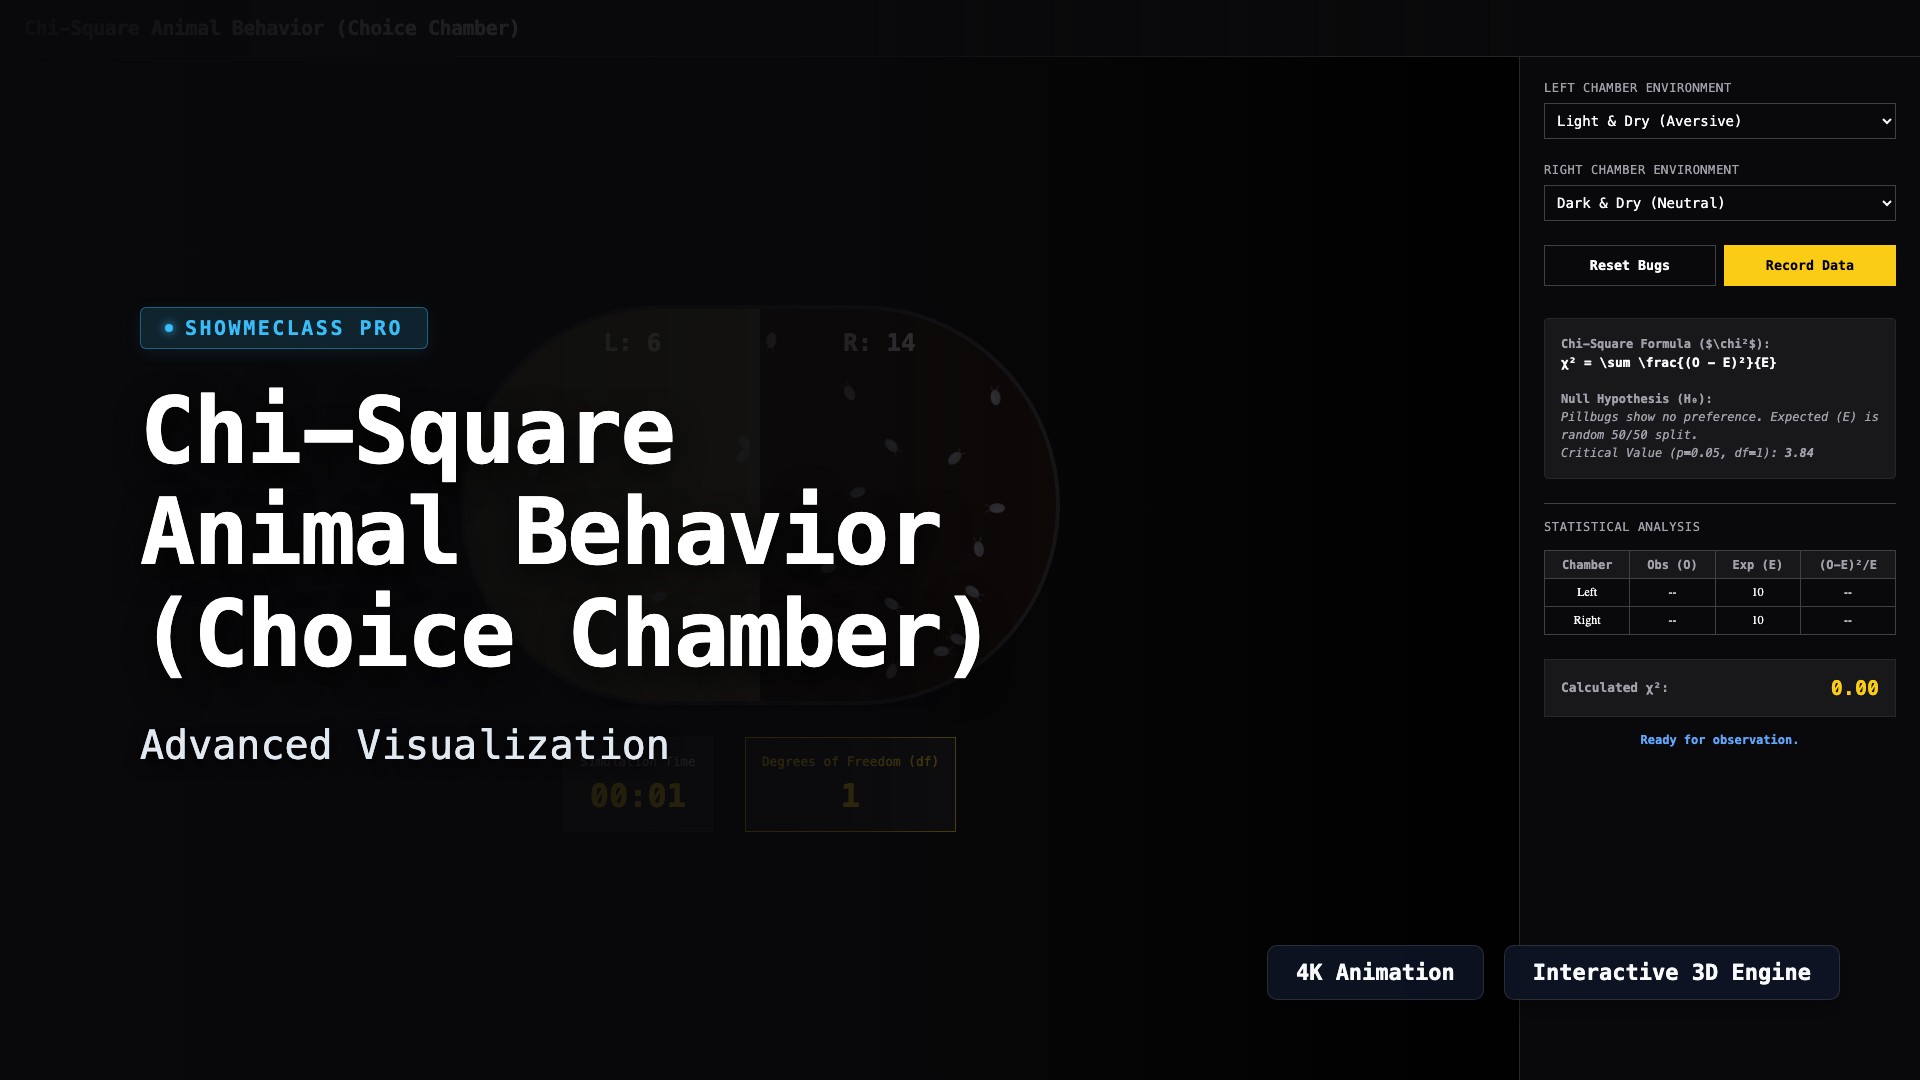
Chi-Square Animal Behavior (Choice Chamber)
Simulate pillbug movement across varying environmental conditions (Light/Dark, Dry/Wet). Record real-time location data and dynamically calculate the Chi-Square (χ²) statistic to reject or fail to reject the null hypothesis of random distribution.
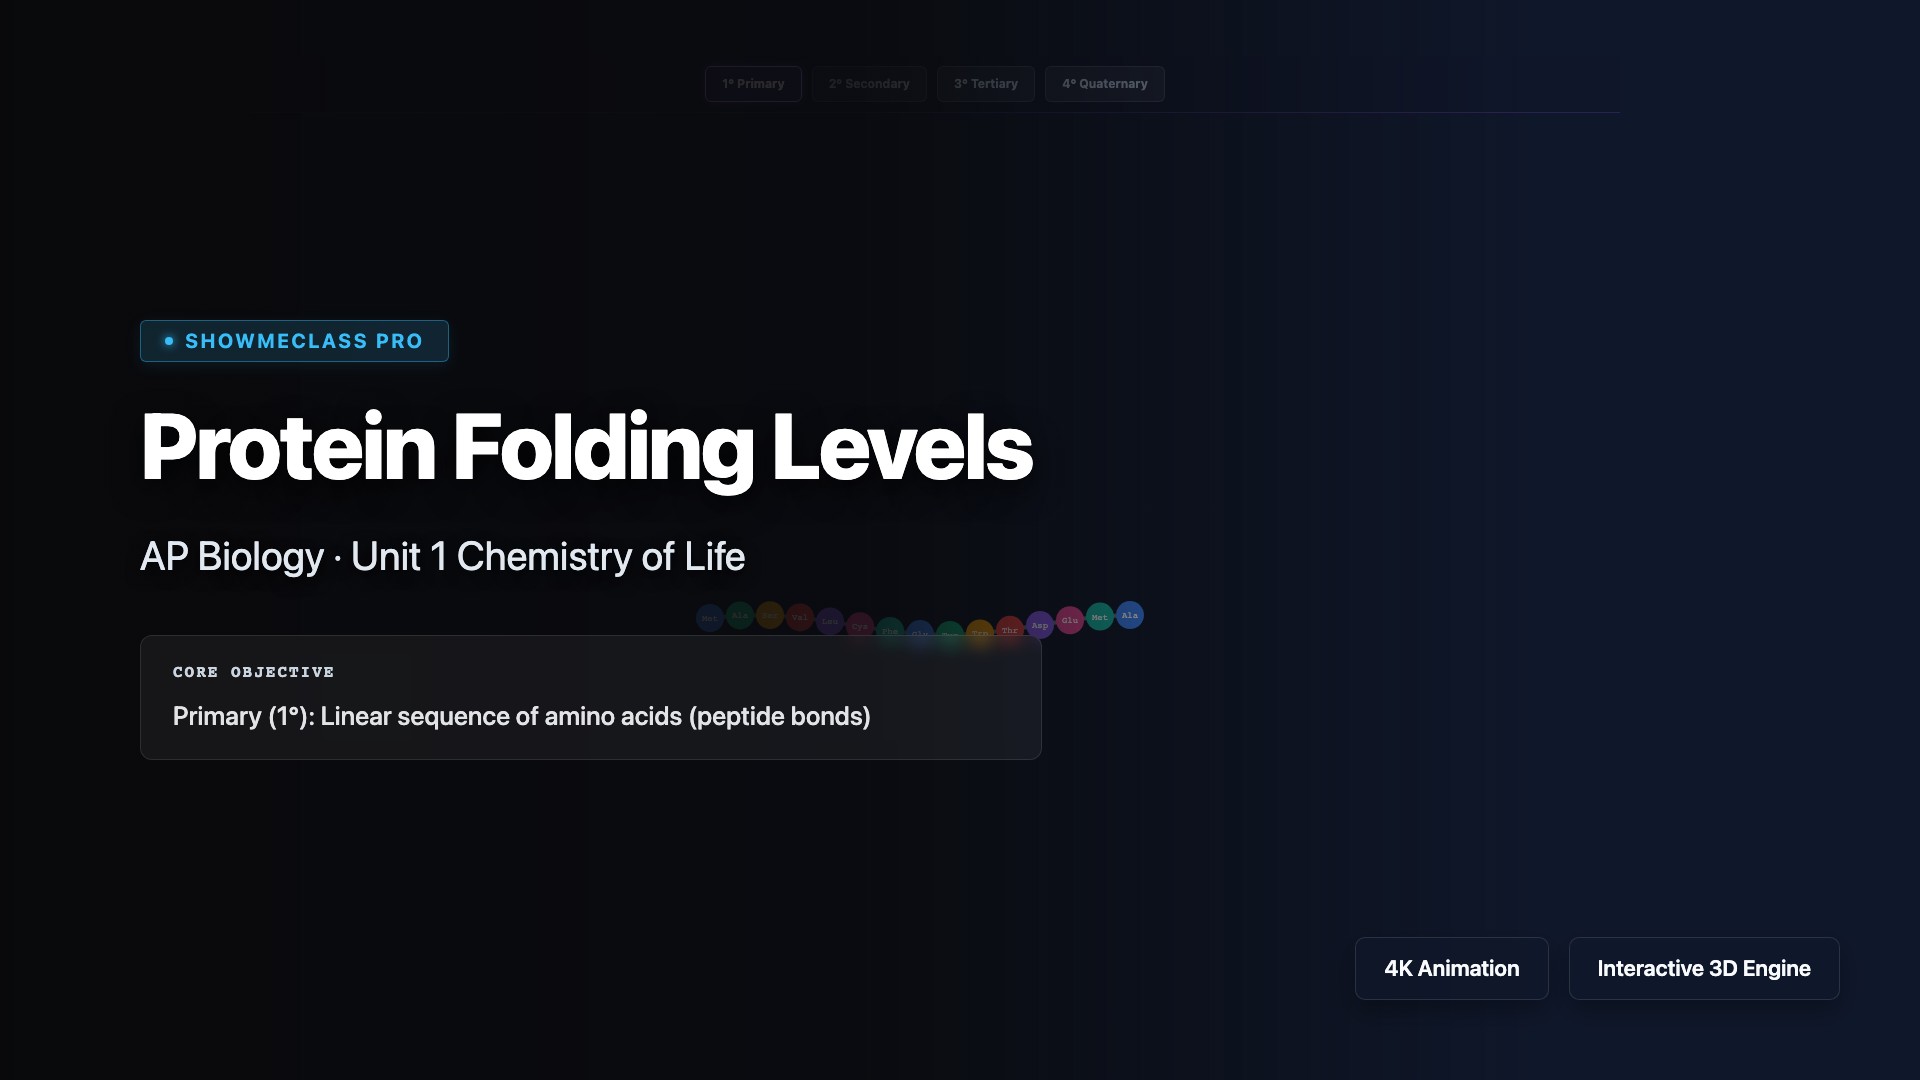
Protein Folding Levels (1°-4°)
Animated stepwise assembly of a protein from its primary amino acid sequence through alpha-helices/beta-sheets to complex 3D tertiary and quaternary structures, including extreme heat denaturation.
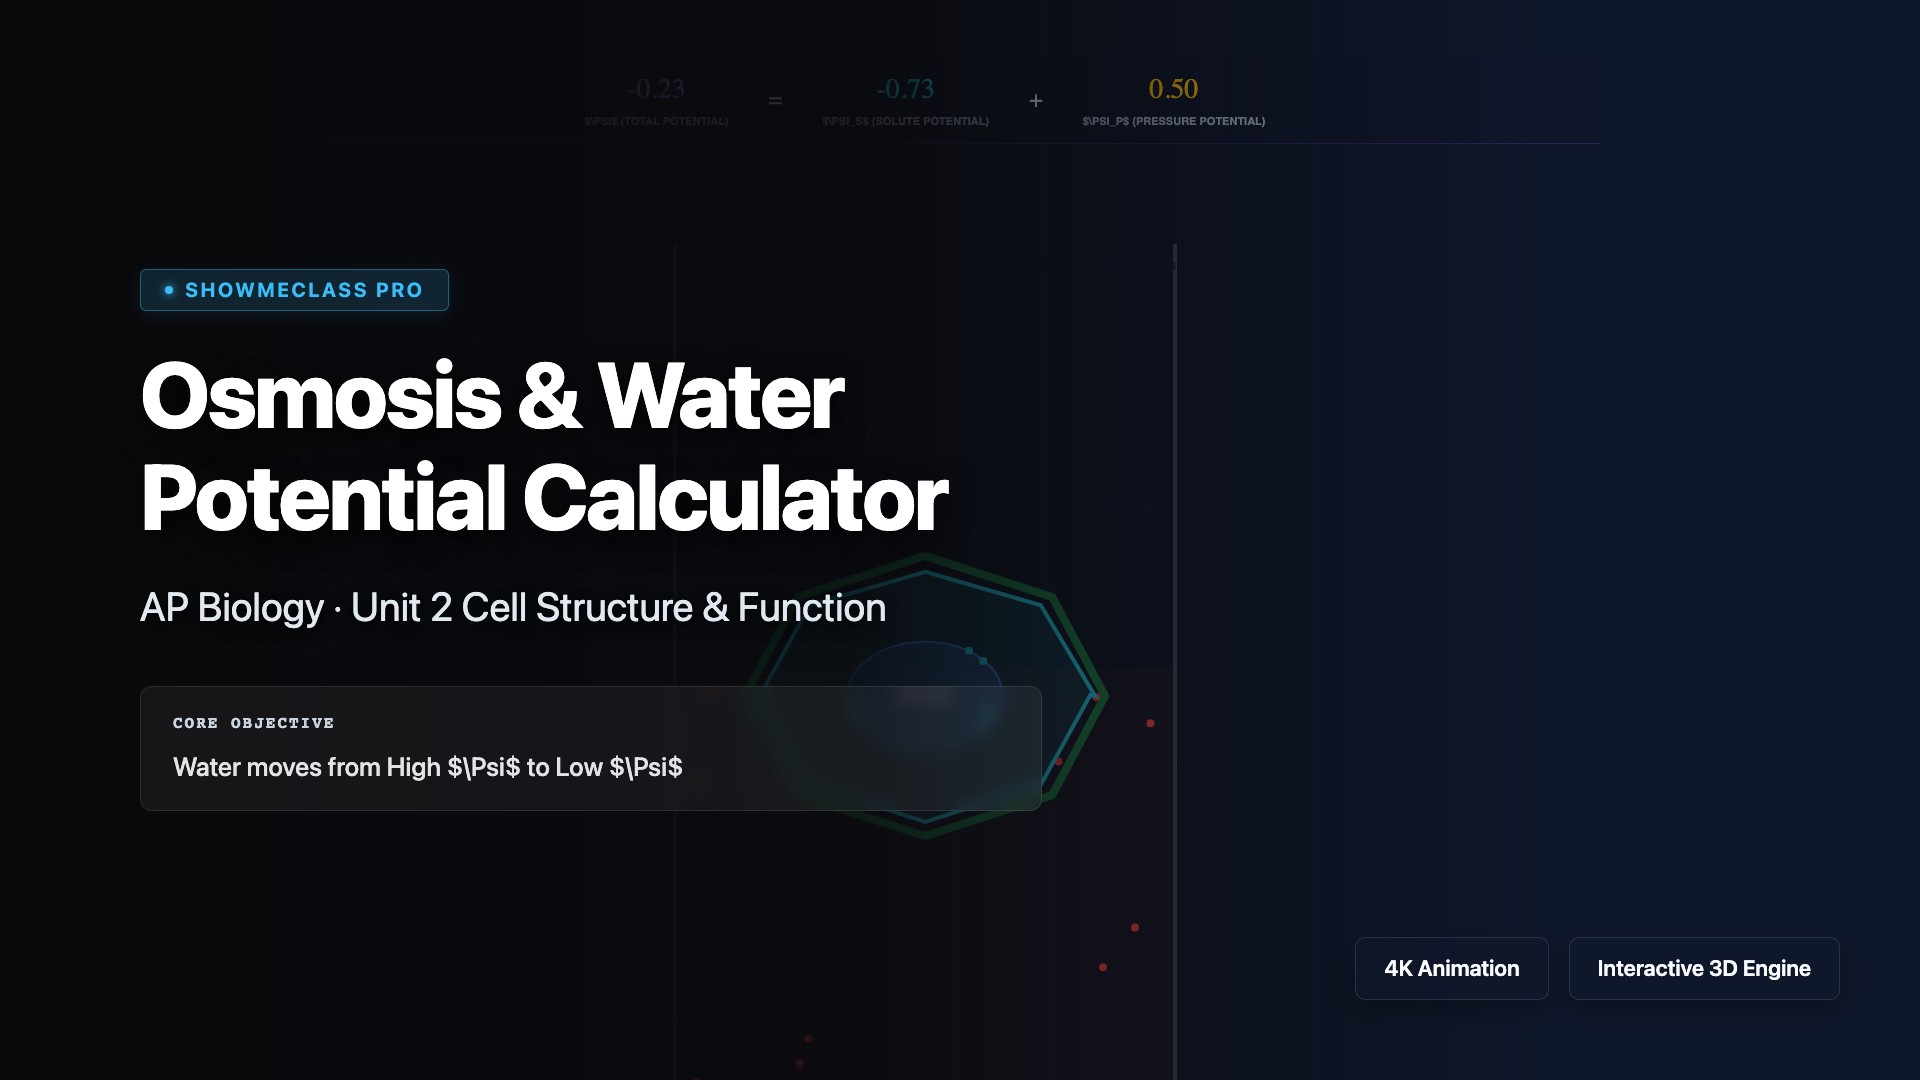
Osmosis & Water Potential Calculator
Calculate and visualize water potential (Ψ = Ψs + Ψp) across a plant cell membrane. Watch water movement and cell plasmolysis/turgidity based on hypertonic/hypotonic environments.
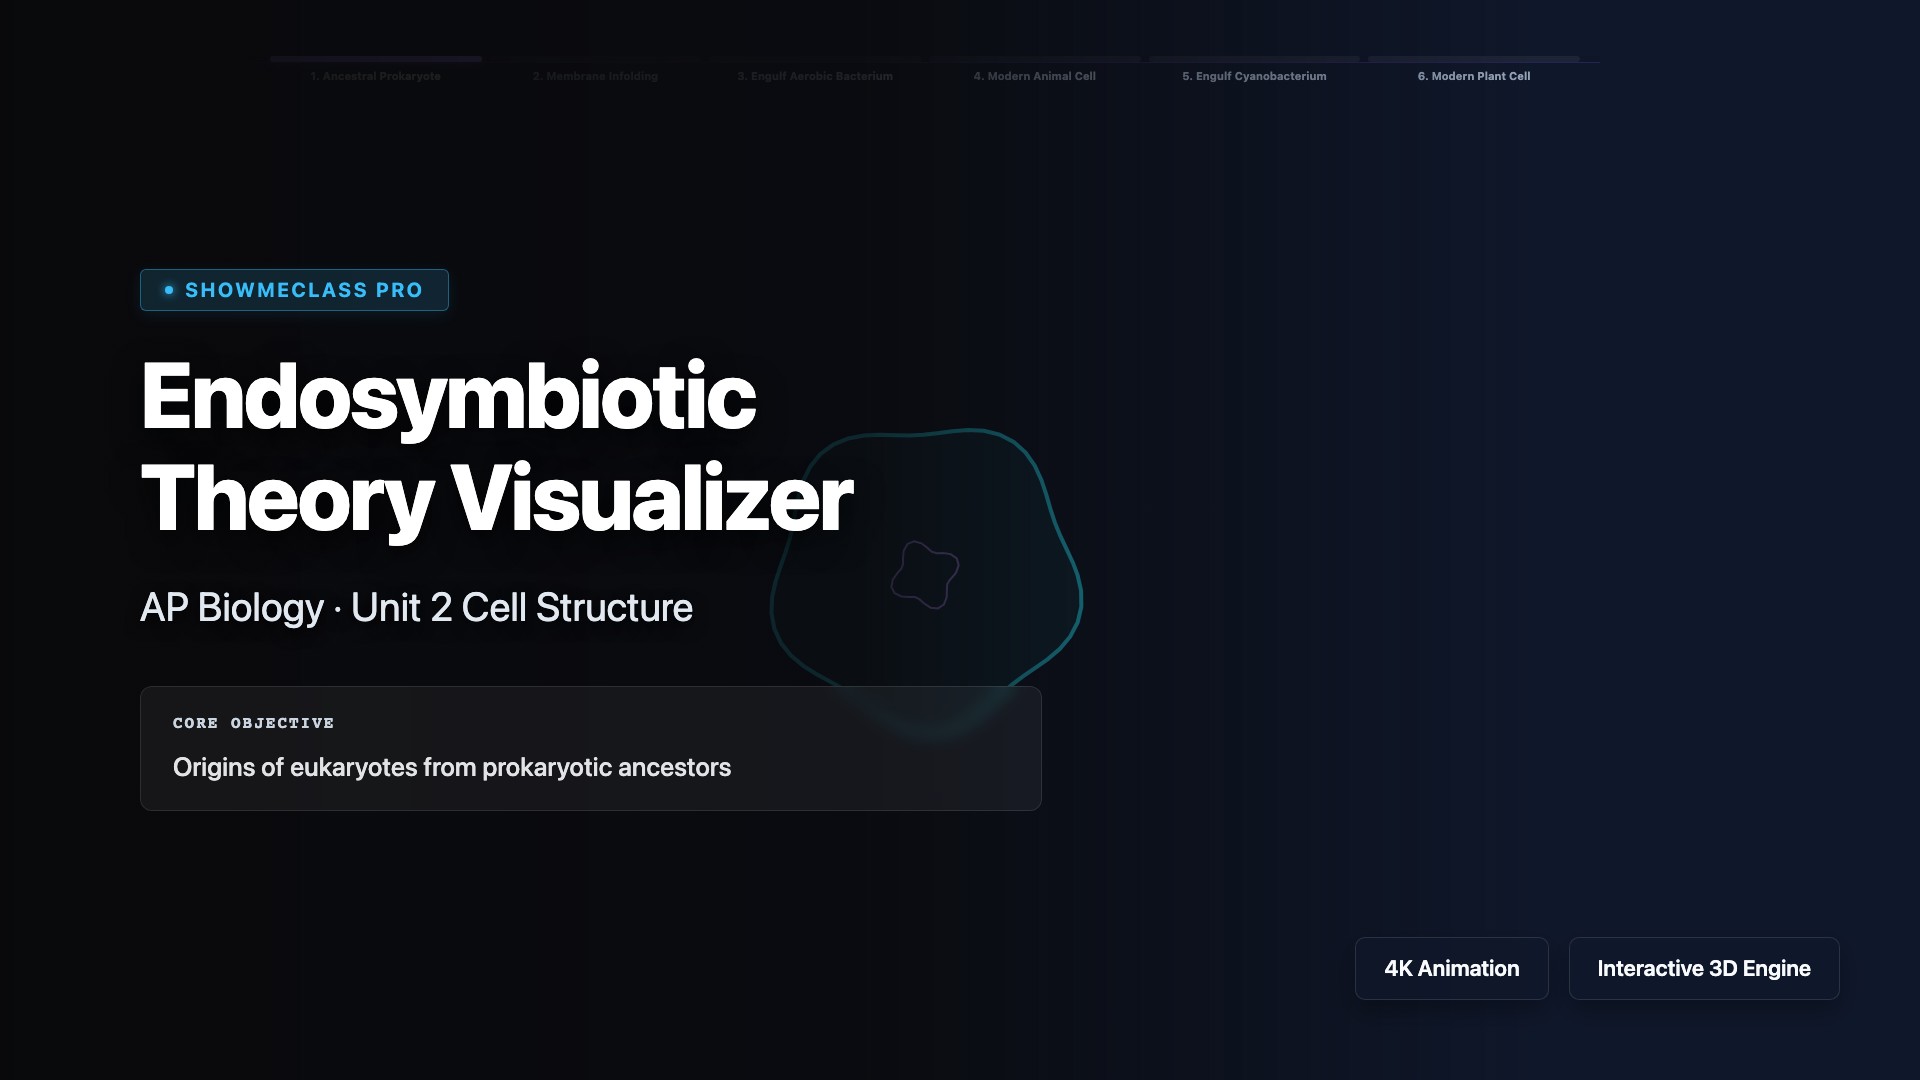
Endosymbiotic Theory Visualizer
Step through an animated history of a eukaryotic cell engulfing aerobic and photosynthetic bacteria to form mitochondria and chloroplasts, respectively.
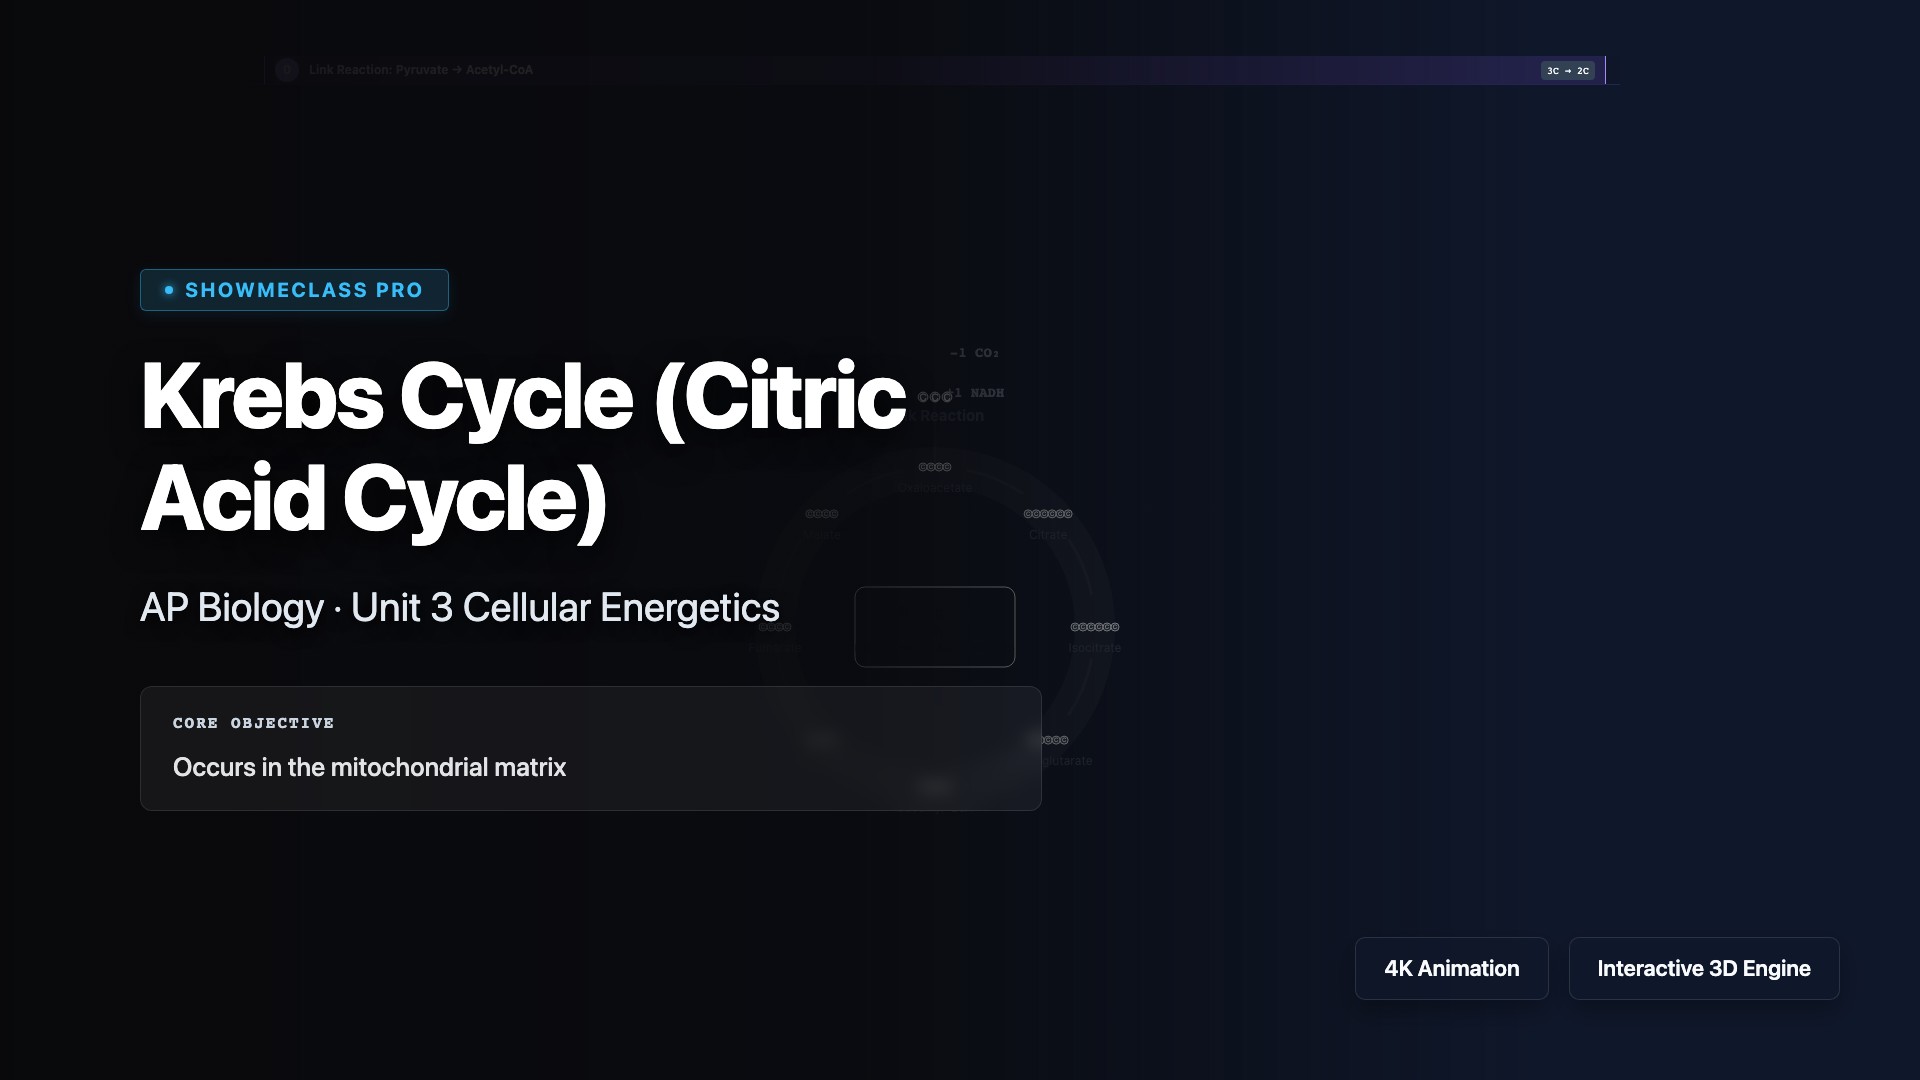
Krebs Cycle Step-by-Step
Step through the 8 stages of the Citric Acid Cycle, visualizing the breakdown of Acetyl-CoA and the tracking of Carbon, NADH, FADH₂, and ATP yields.
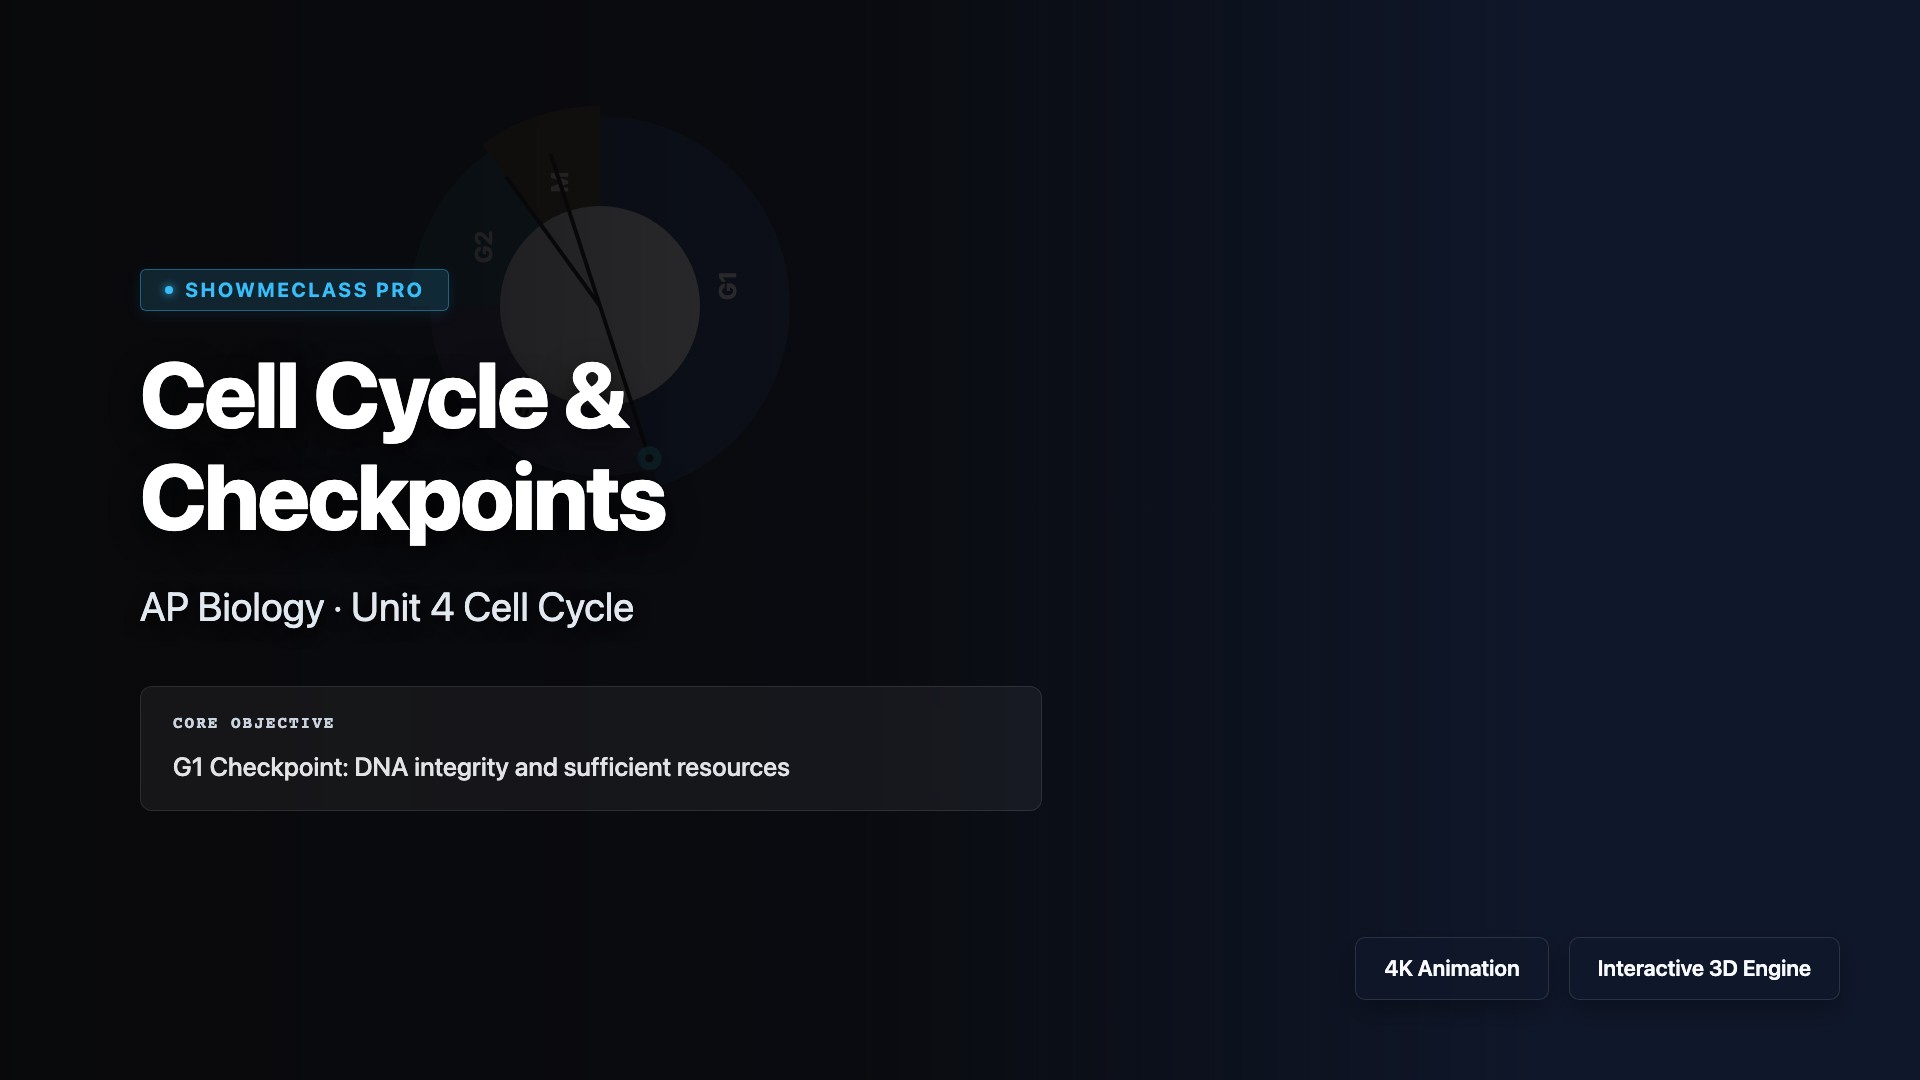
Cell Cycle & Checkpoints
Trace the cell cycle through Interphase and Mitosis. Mutate p53 tumor suppressors to bypass checkpoints, visualizing how unregulated division leads directly to cancer.
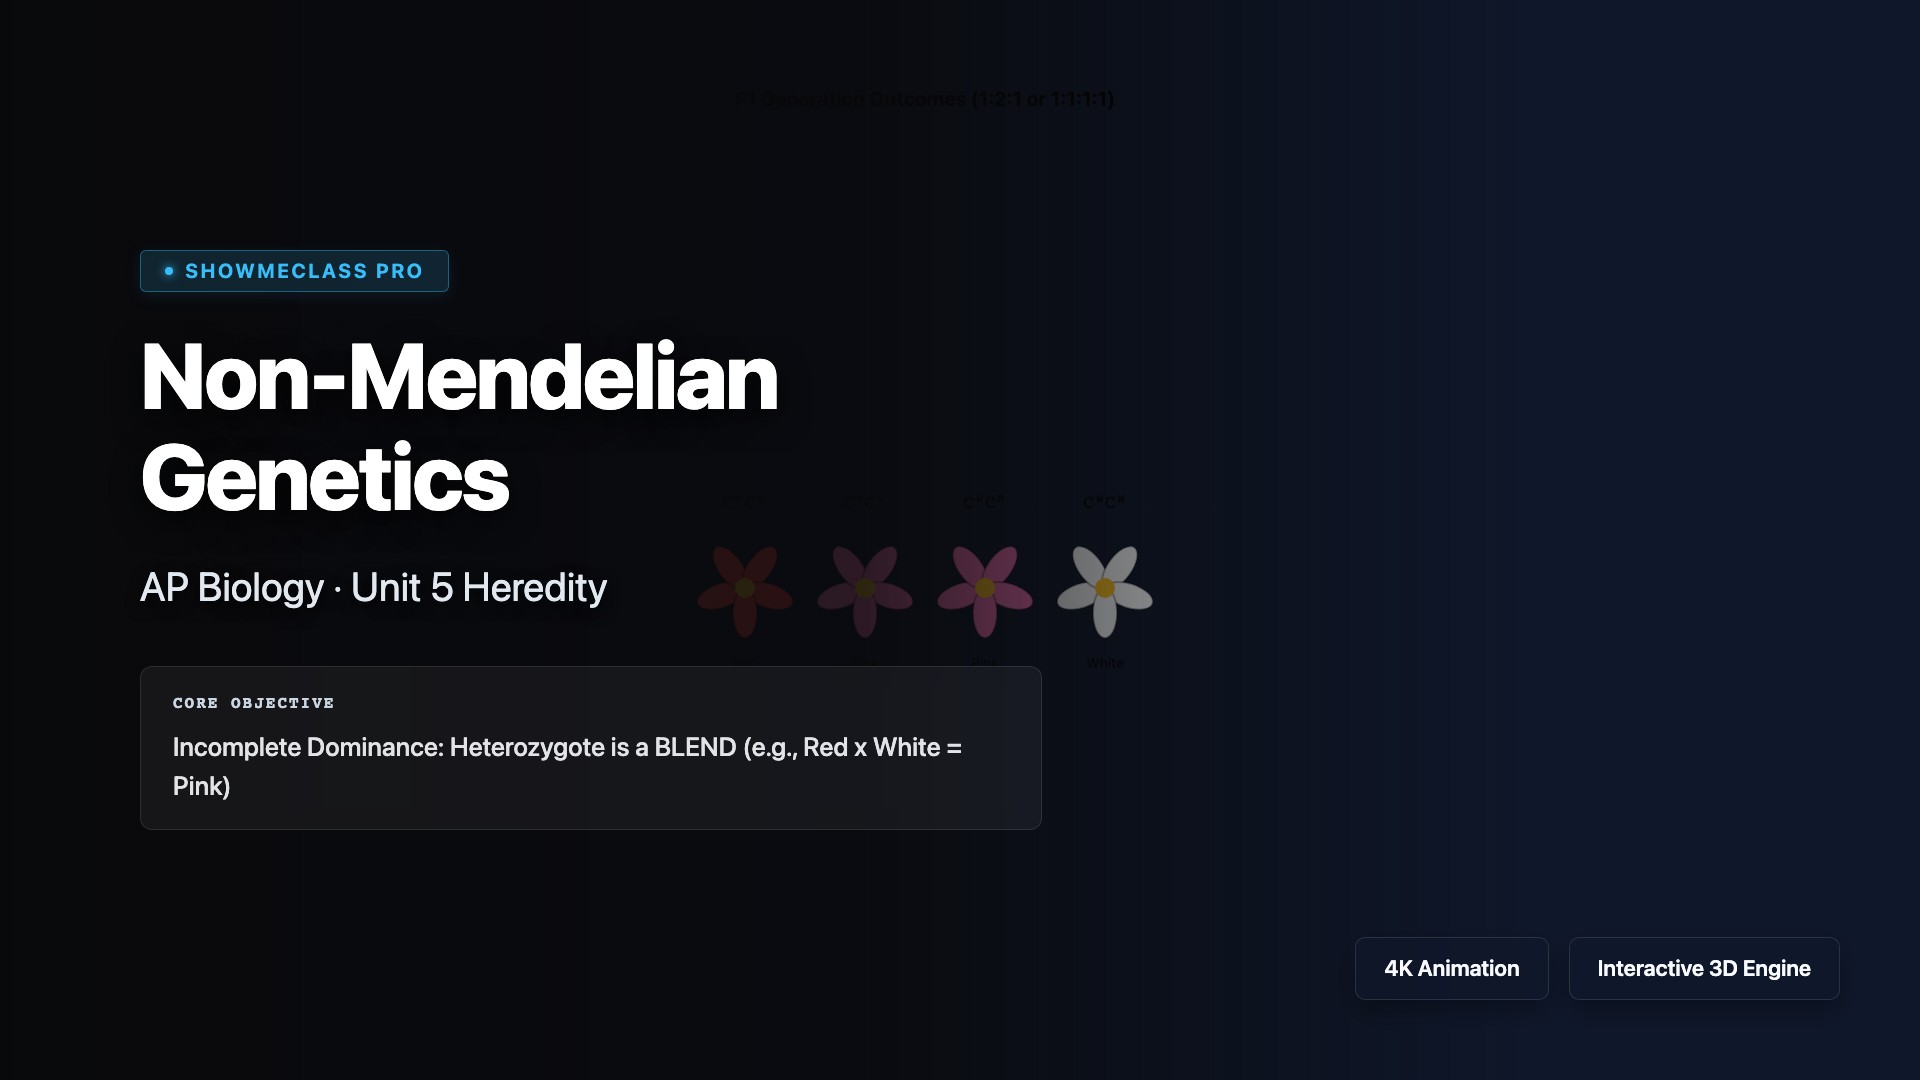
Non-Mendelian Genetics
Interactive Punnett Squares detailing Incomplete Dominance (Pink Flowers), Codominance (Roan Cattle), and Multiple Alleles (ABO Blood Types).
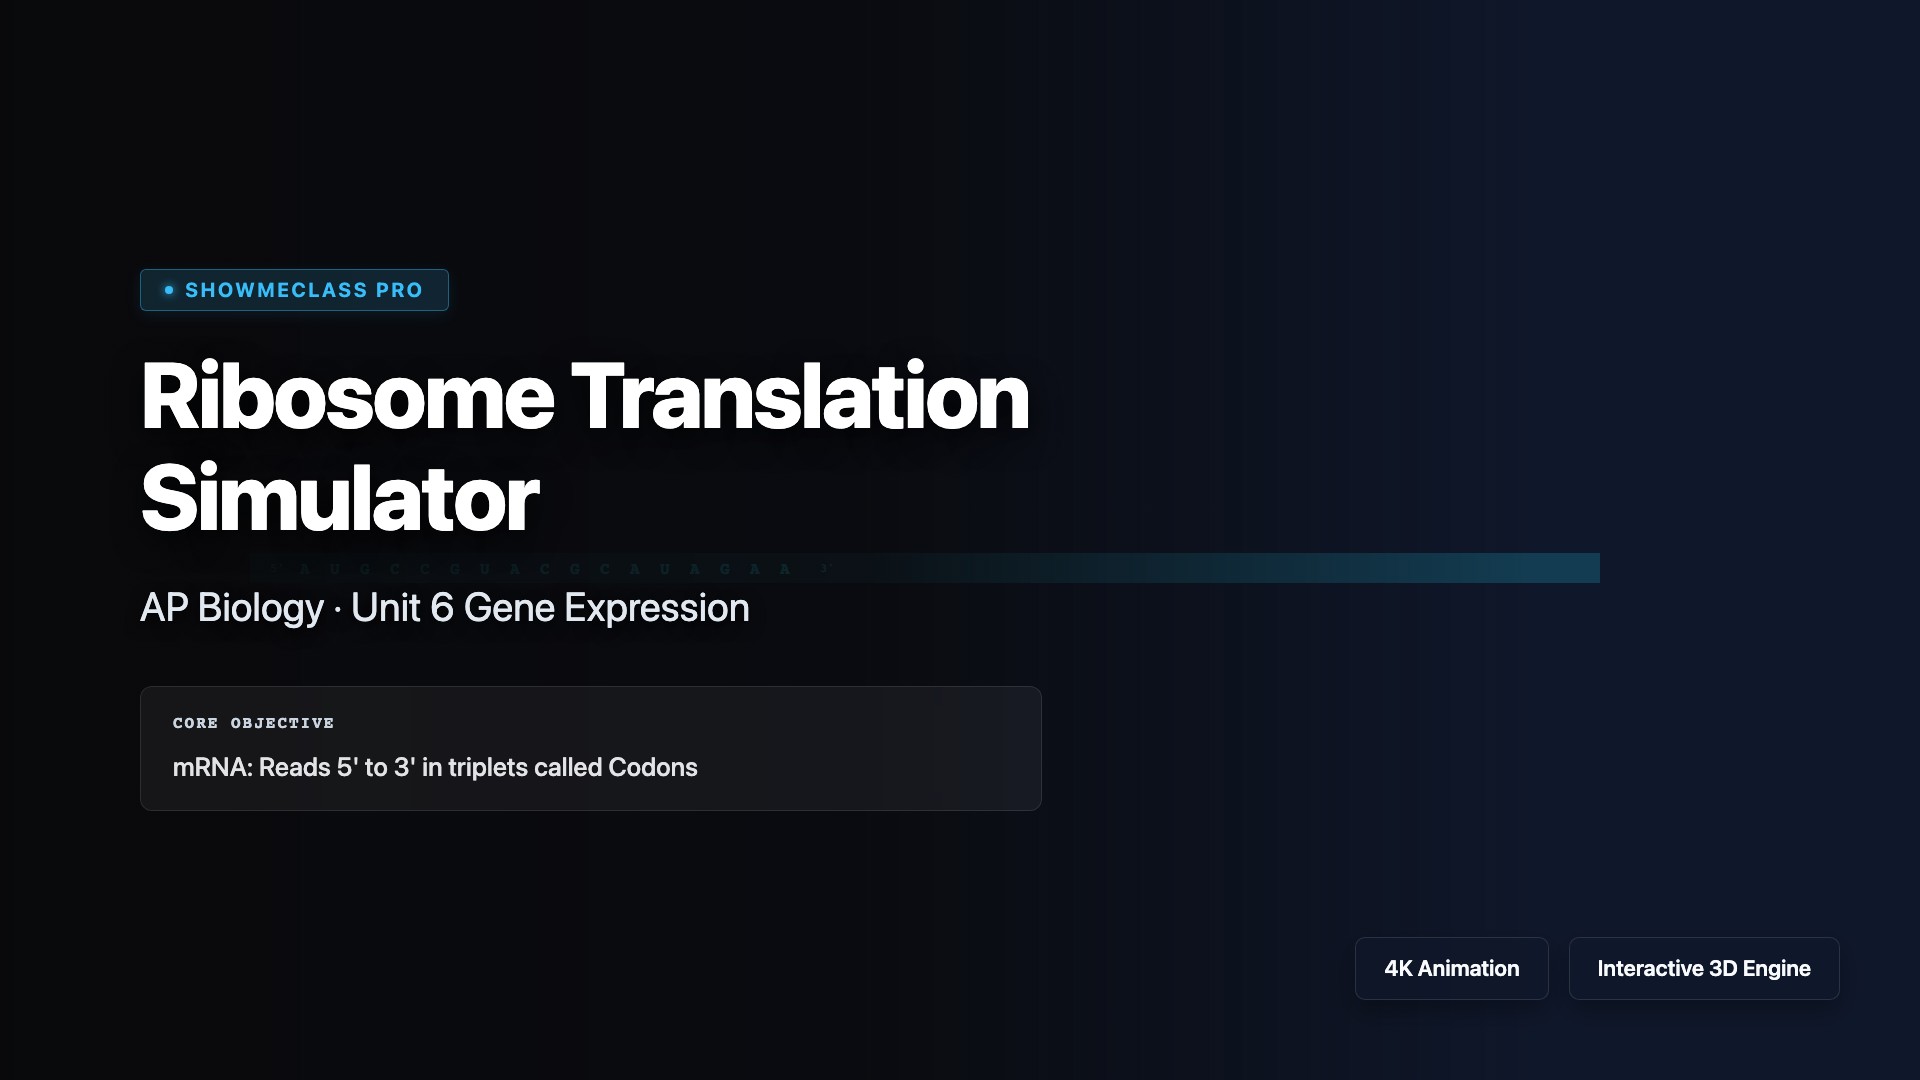
Ribosome Translation Simulator
Step through translation: Small/Large ribosomal subunit assembly, A/P/E site tRNA translocation, peptide bond formation, and termination at a STOP codon.
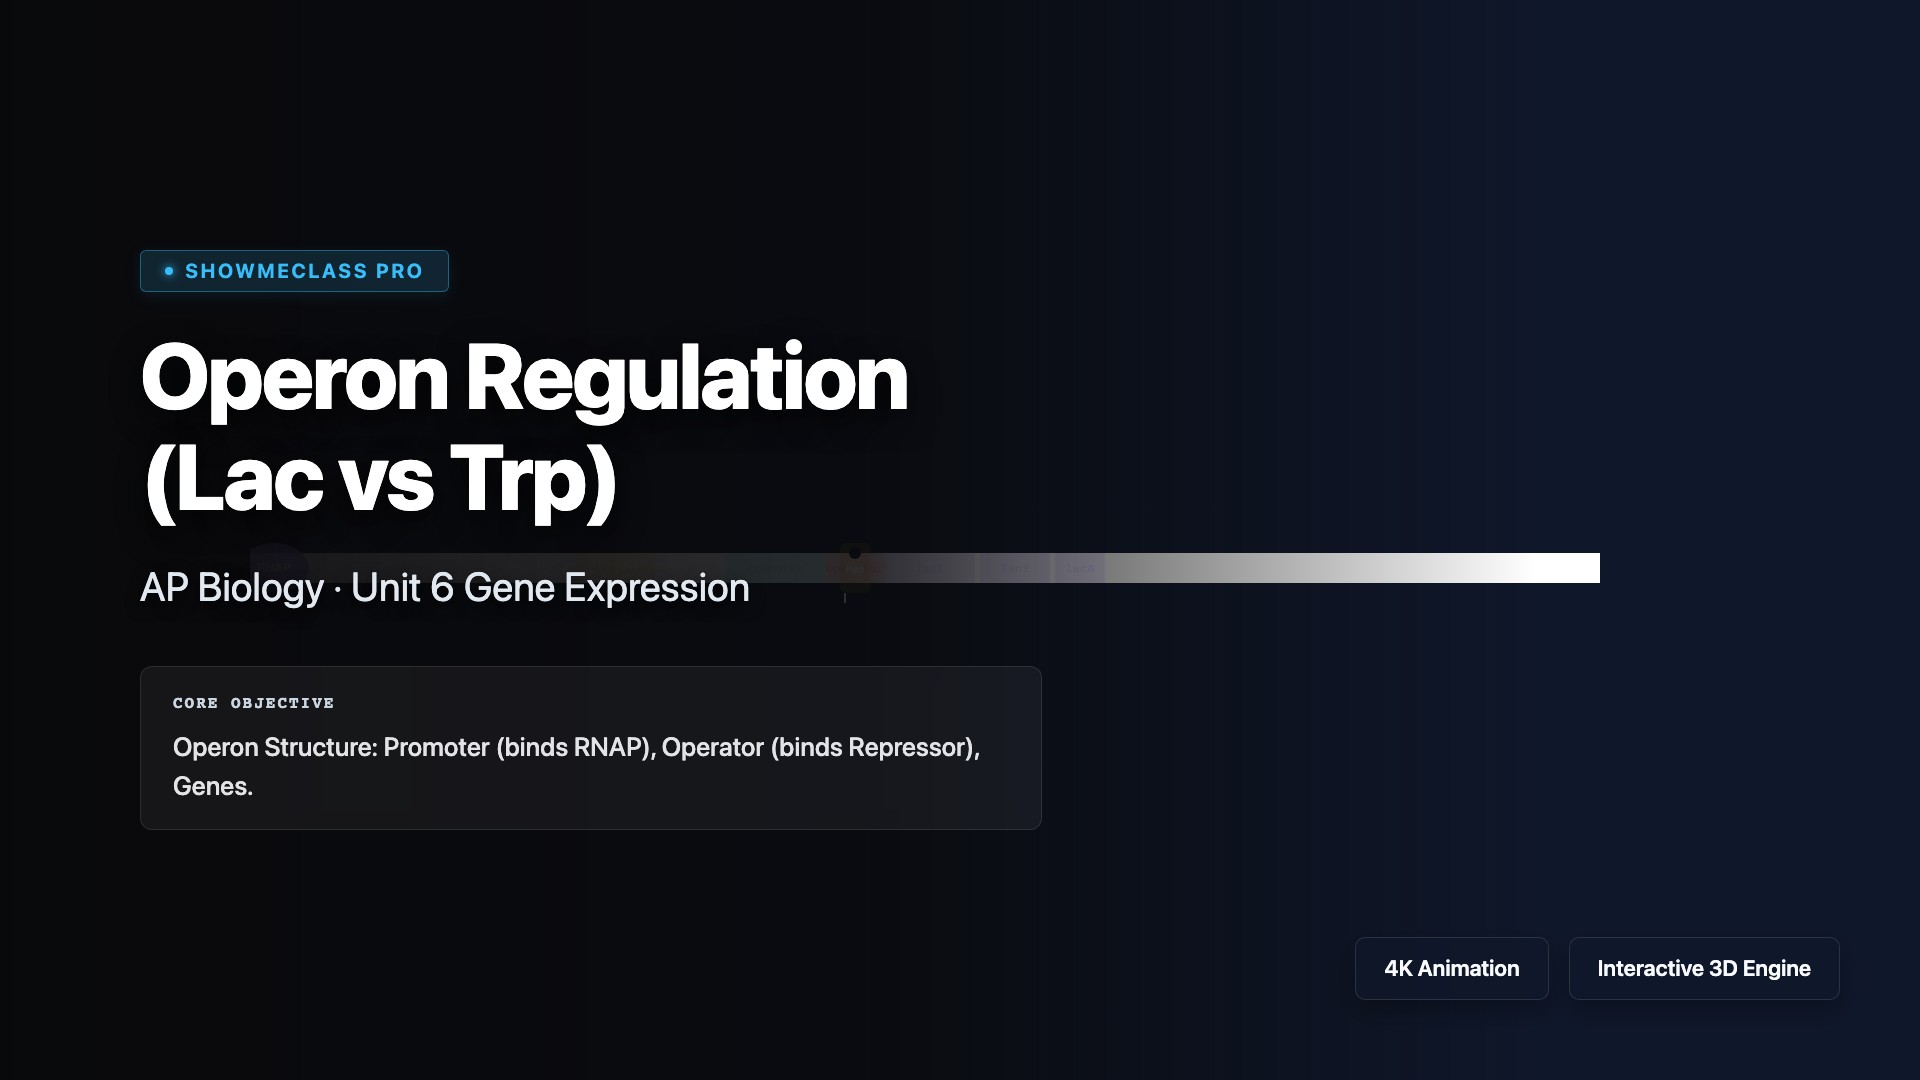
Operon Regulation (Lac vs Trp)
Compare Inducible (Lac) vs Repressible (Trp) bacterial operons. Toggle inducer/corepressor presence to observe immediate repressor conformational changes and RNAP blockage.