Phase Diagram Explorer
Interactive phase diagrams for H₂O and CO₂. Explore triple points, critical points, and supercritical fluid regions. Identify the phase at any T,P coordinate.
PHASE DIAGRAMS
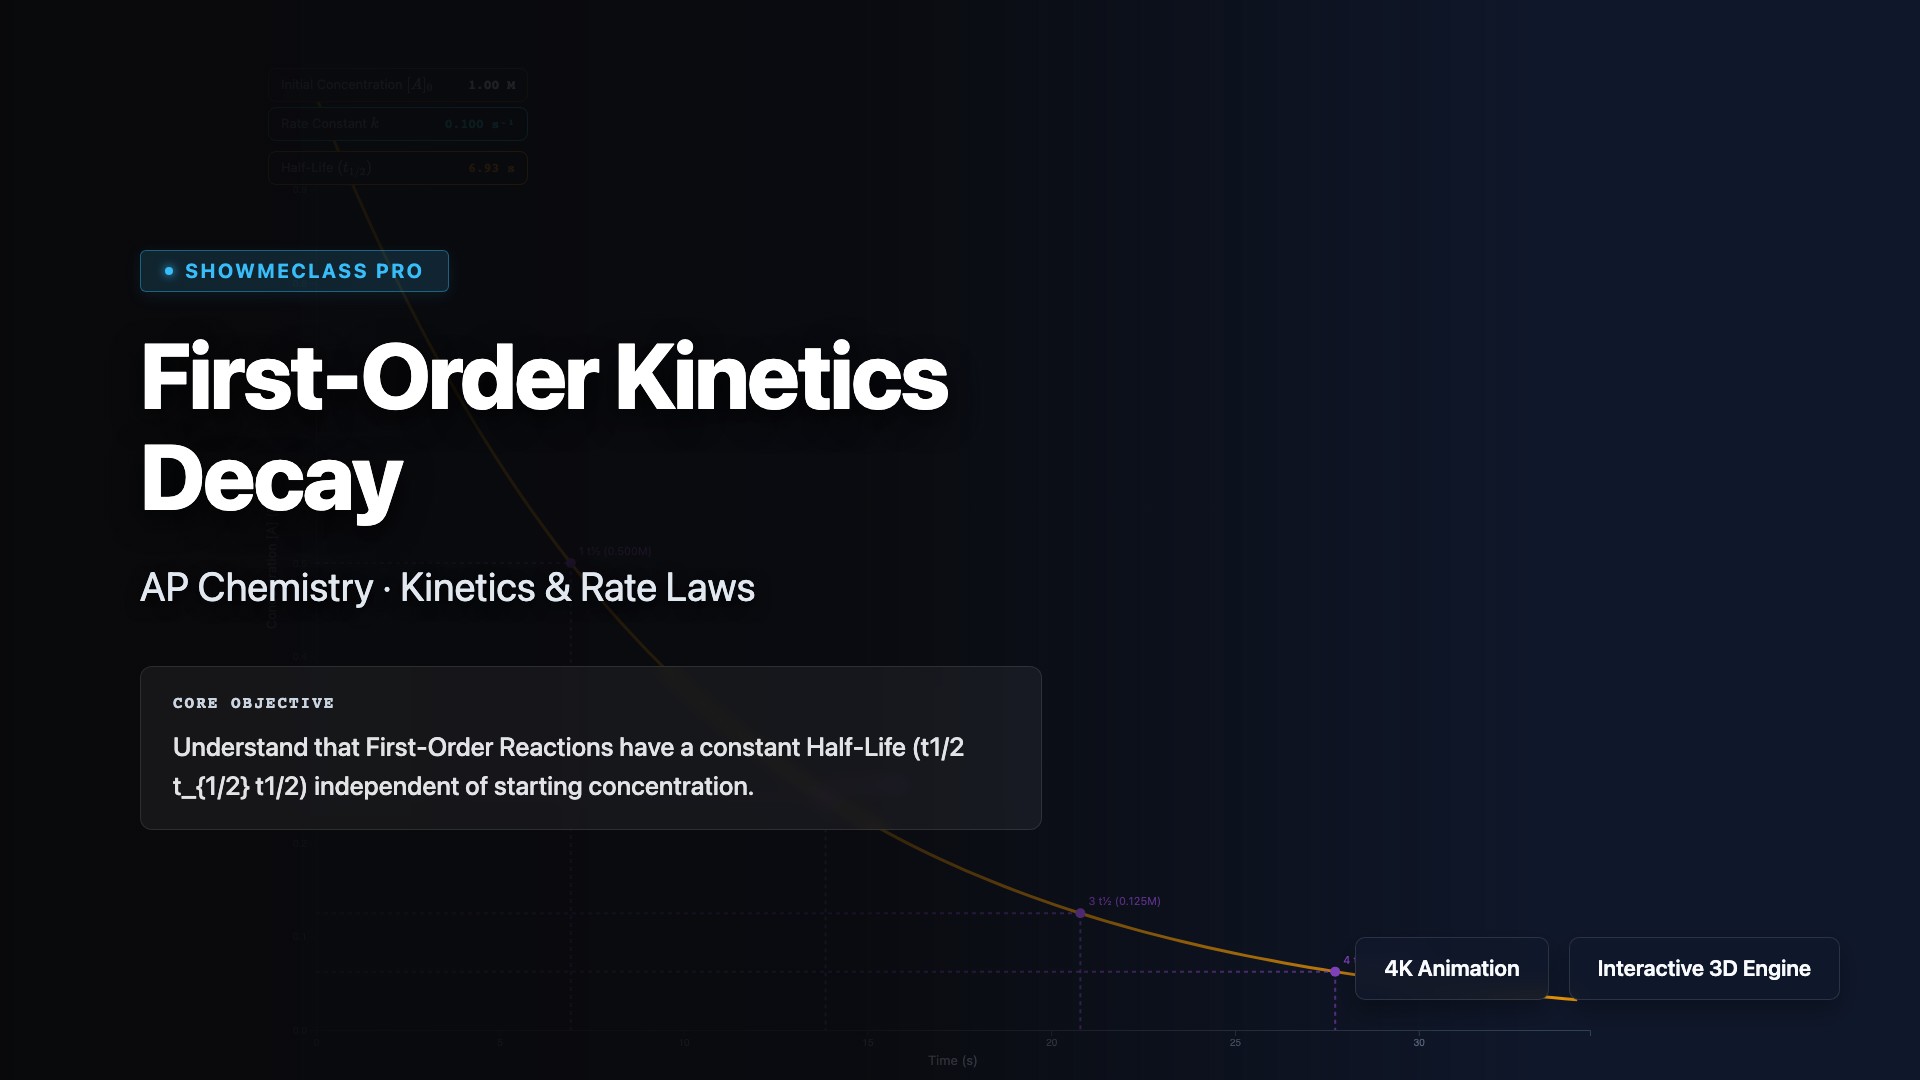
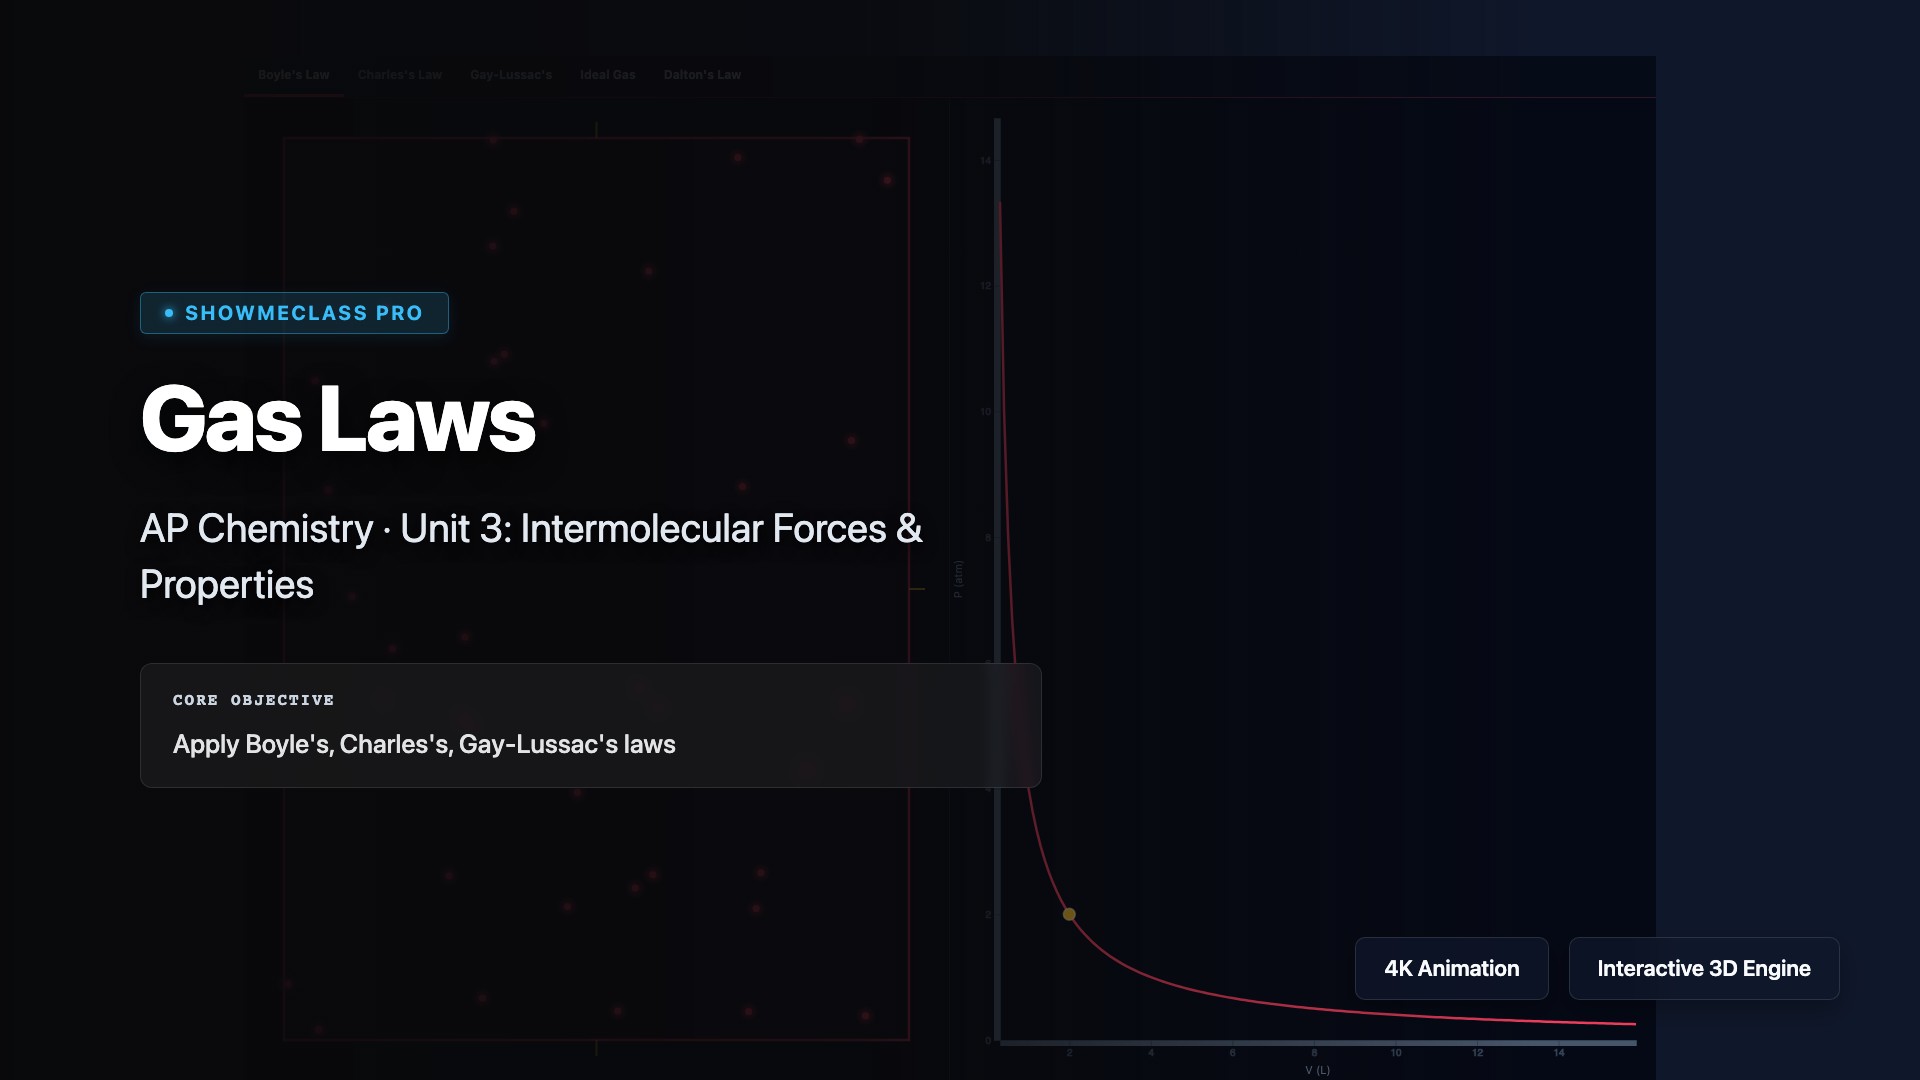
Graph of pressure vs. temperature showing the stable phases (solid, liquid, gas) of a substance.
CORE FORMULAS
Phase terms
AP EXAM CONNECTION
Unit: Unit 3: IMFs and Properties
Learning Objective: SAP-5.B
COMMON MISCONCEPTIONS
- Thinking the solid-liquid line always has a positive slope.
KEY TAKEAWAYS
- Pressure and temperature determine the physical state.