
Showing 12 results
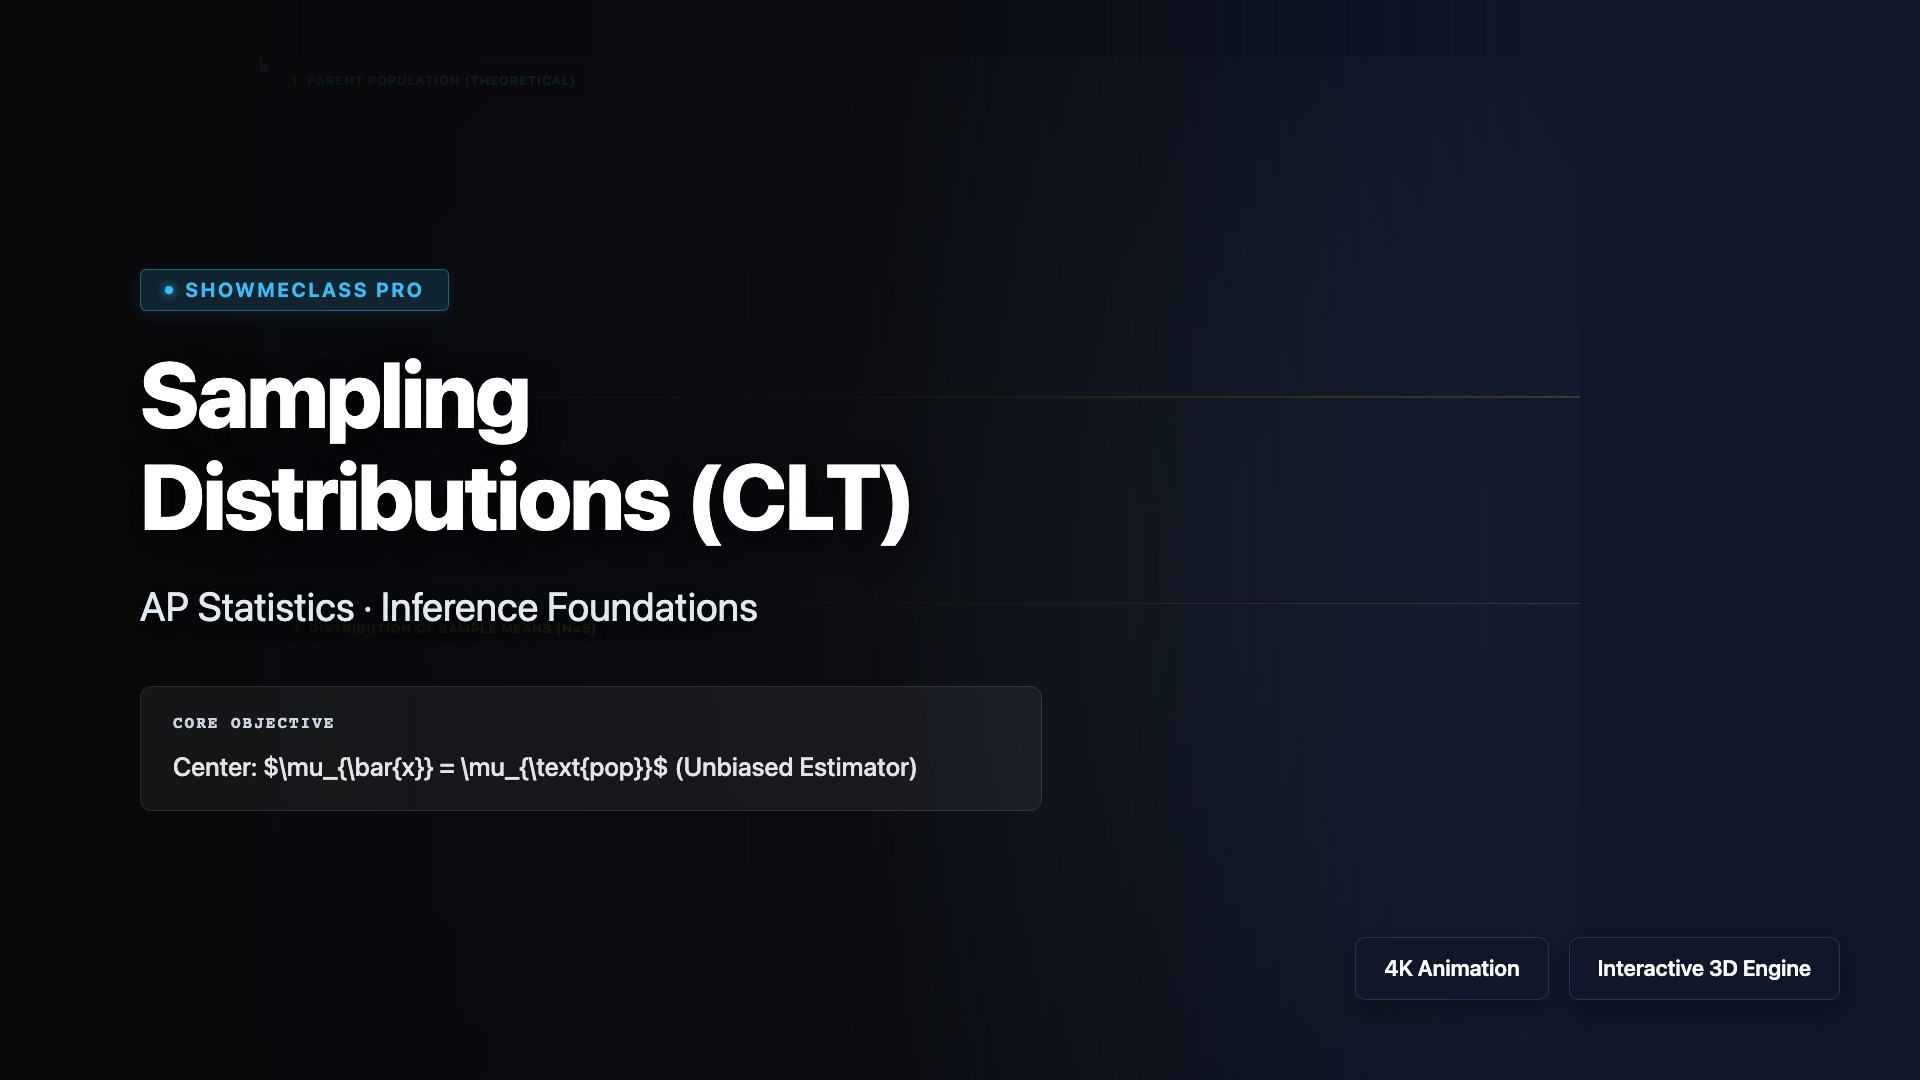
Sampling Distributions (CLT)
Dual-canvas integration rendering Central Limit Theorem convergence. Draws random Monte Carlo datasets mapping sample size variance crushing ($n \geq 30$ rule) converting arbitrary shapes (skewed/bimodal) into stable Gaussian sample-mean distributions.
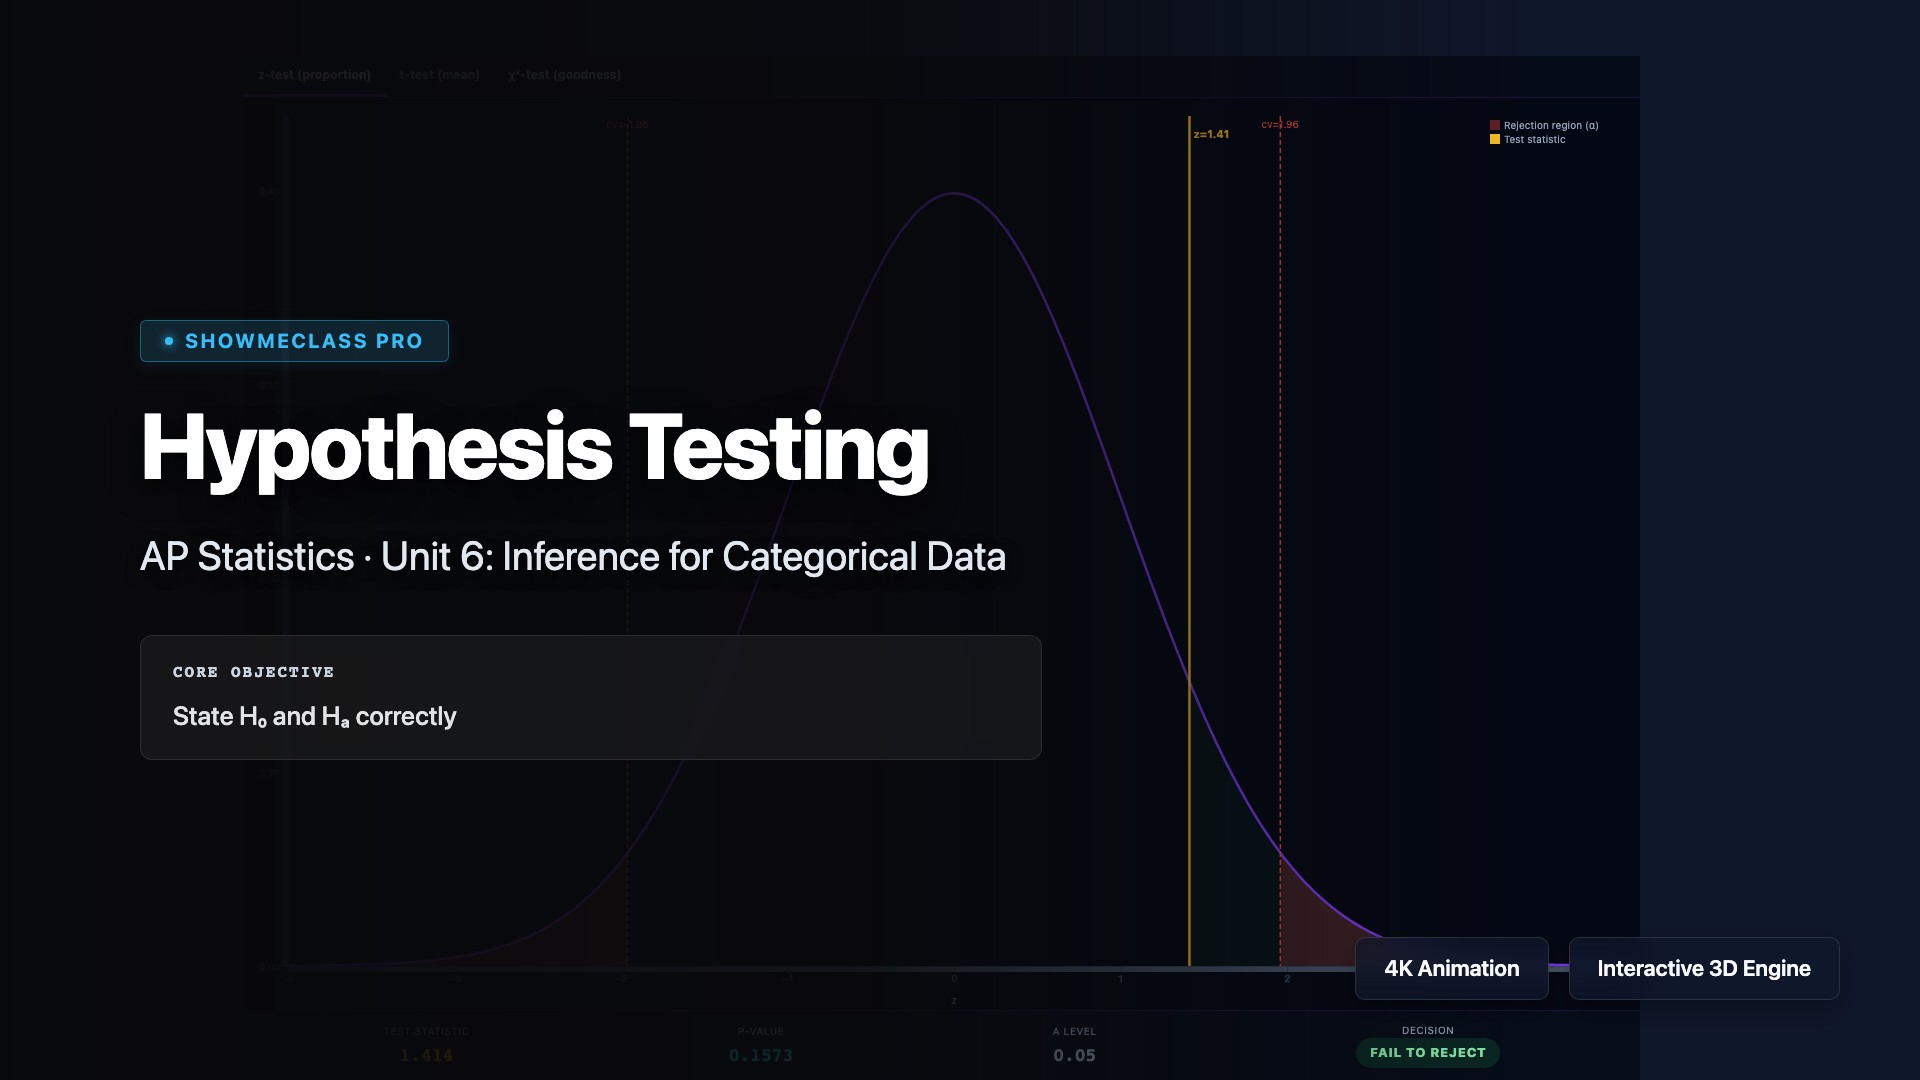
Hypothesis Testing Rules
Inferential hypothesis engine animating null model rejection thresholds vs interactive sample observed P-Value tails. Illuminates the deterministic binary conclusion states driven by fixed Alpha lines mapping Type I geometric error bounds visually.
ANOVA Variance Analysis
Interactive ANOVA interaction plotting $MS_{bet}$ vs $MS_{wit}$ signal-to-noise calculations natively. Combines adjustable uniform variance blocks mathematically linking structural layout changes actively to precise numerical F-Distribution test thresholds.
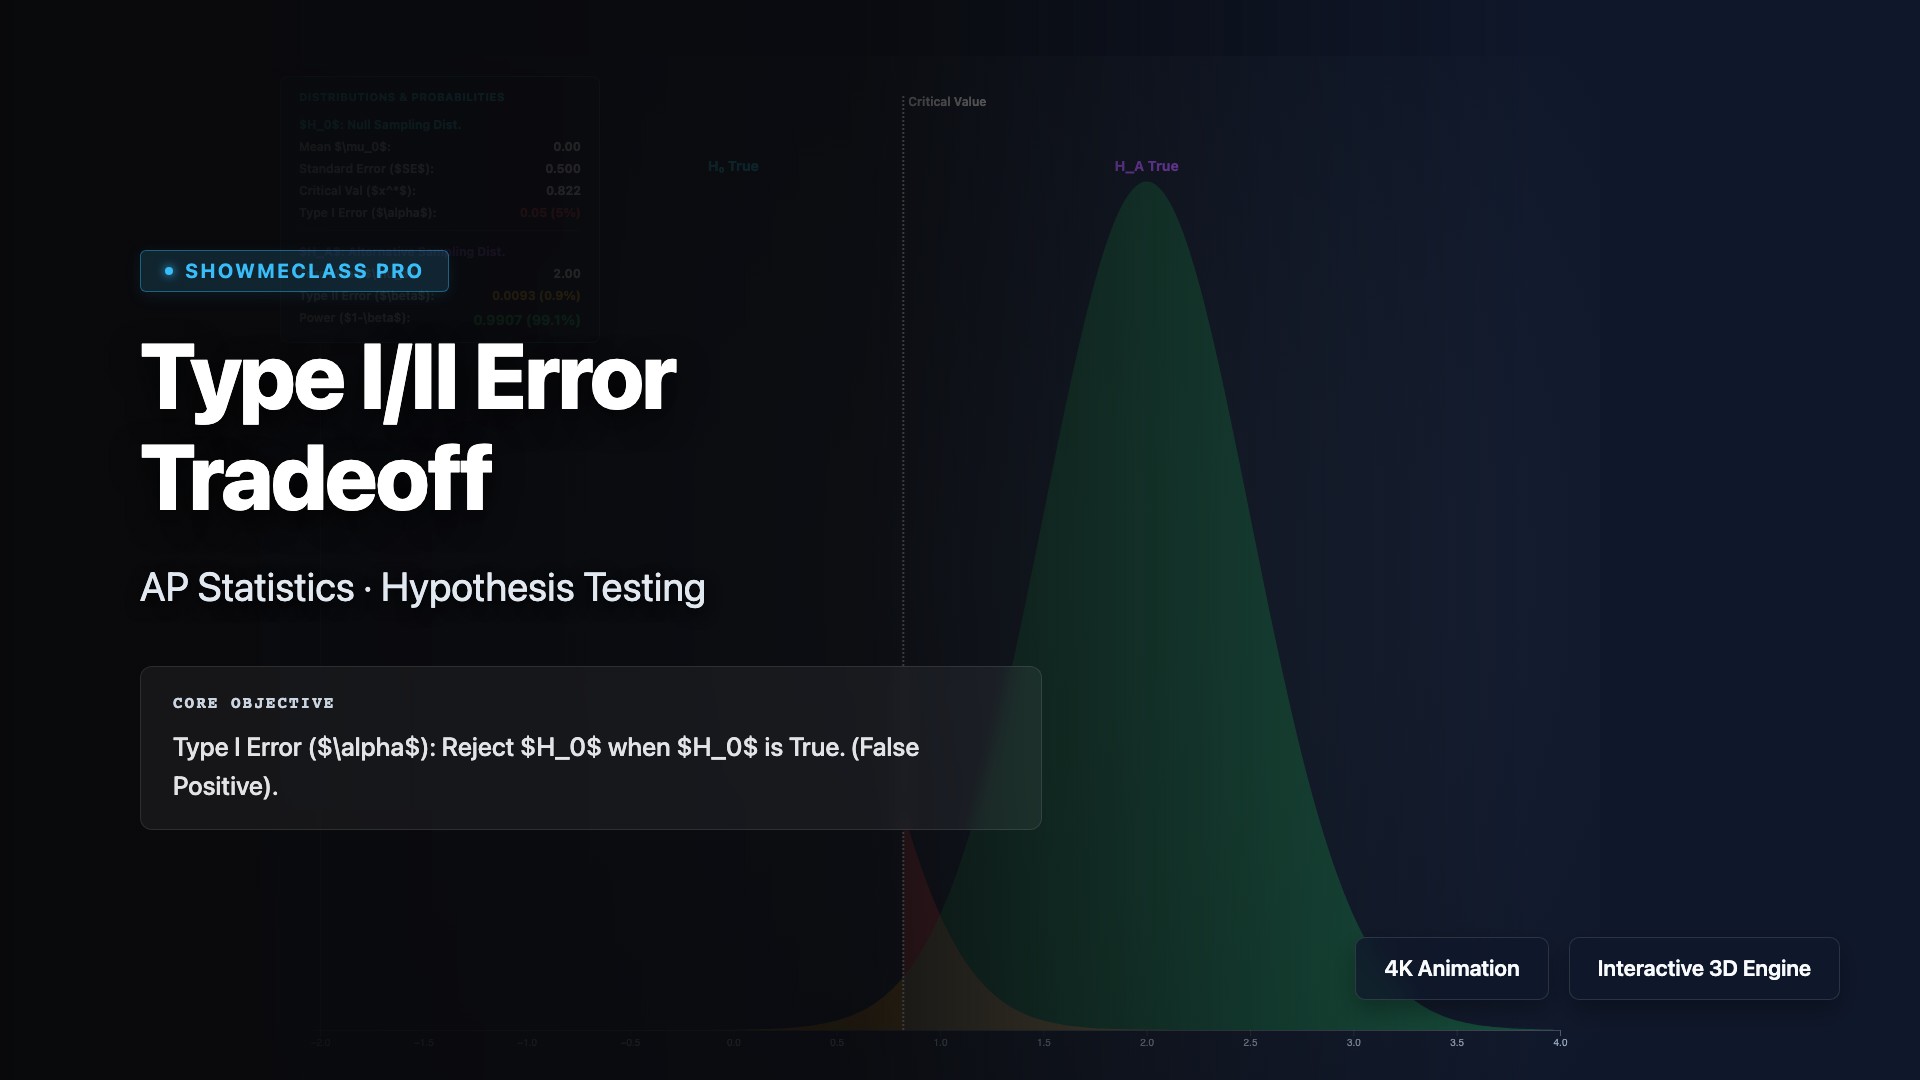
Type I & II Errors & Power
Interactive structural dual-distribution rendering plotting absolute hypothesis decision bounds. Animates the zero-sum mathematical see-saw between Alpha (Type I) restrictions severely punishing statistical Power translating into elevated Type II failures explicitly under sample size constrictions.

Indifference Curves & Budget Lines
Cobb-Douglas utility model showing indifference curves at multiple utility levels with adjustable budget constraint (income and prices). Visualizes optimal tangency point where MRS = price ratio for consumer equilibrium.

Oligopoly & Kinked Demand Curve
Kinked demand curve model explaining oligopoly price rigidity. Adjustable kink price and MC level demonstrate how the vertical MR gap allows cost changes without price adjustment — the core mechanism behind sticky prices in oligopolistic markets.
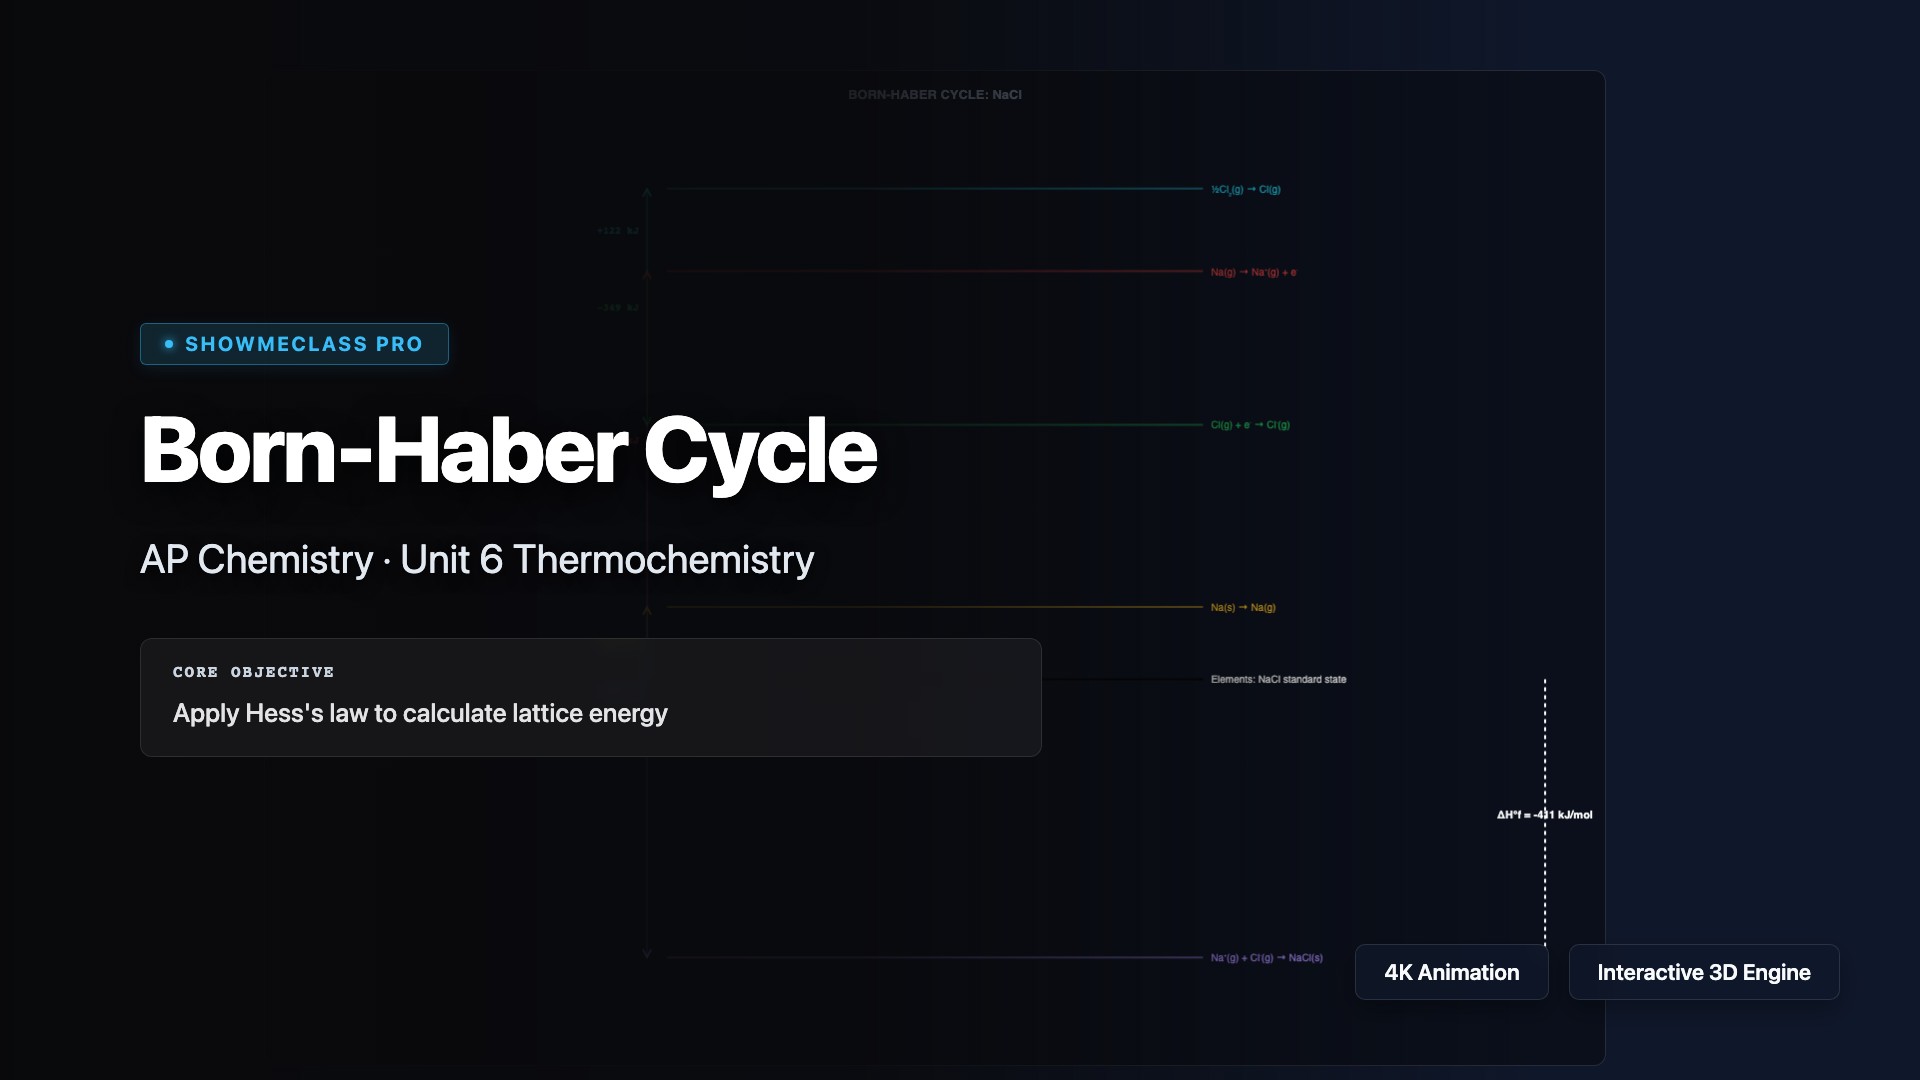
Born-Haber Cycle (Lattice Energy)
Visual energy level diagram for Born-Haber thermodynamic cycles. Explore 4 ionic compounds (NaCl, KBr, MgO, CaF₂) with verified thermodynamic data for each step: sublimation, ionization energy, bond dissociation, electron affinity, and lattice energy. Apply Hess's law to calculate lattice energy.
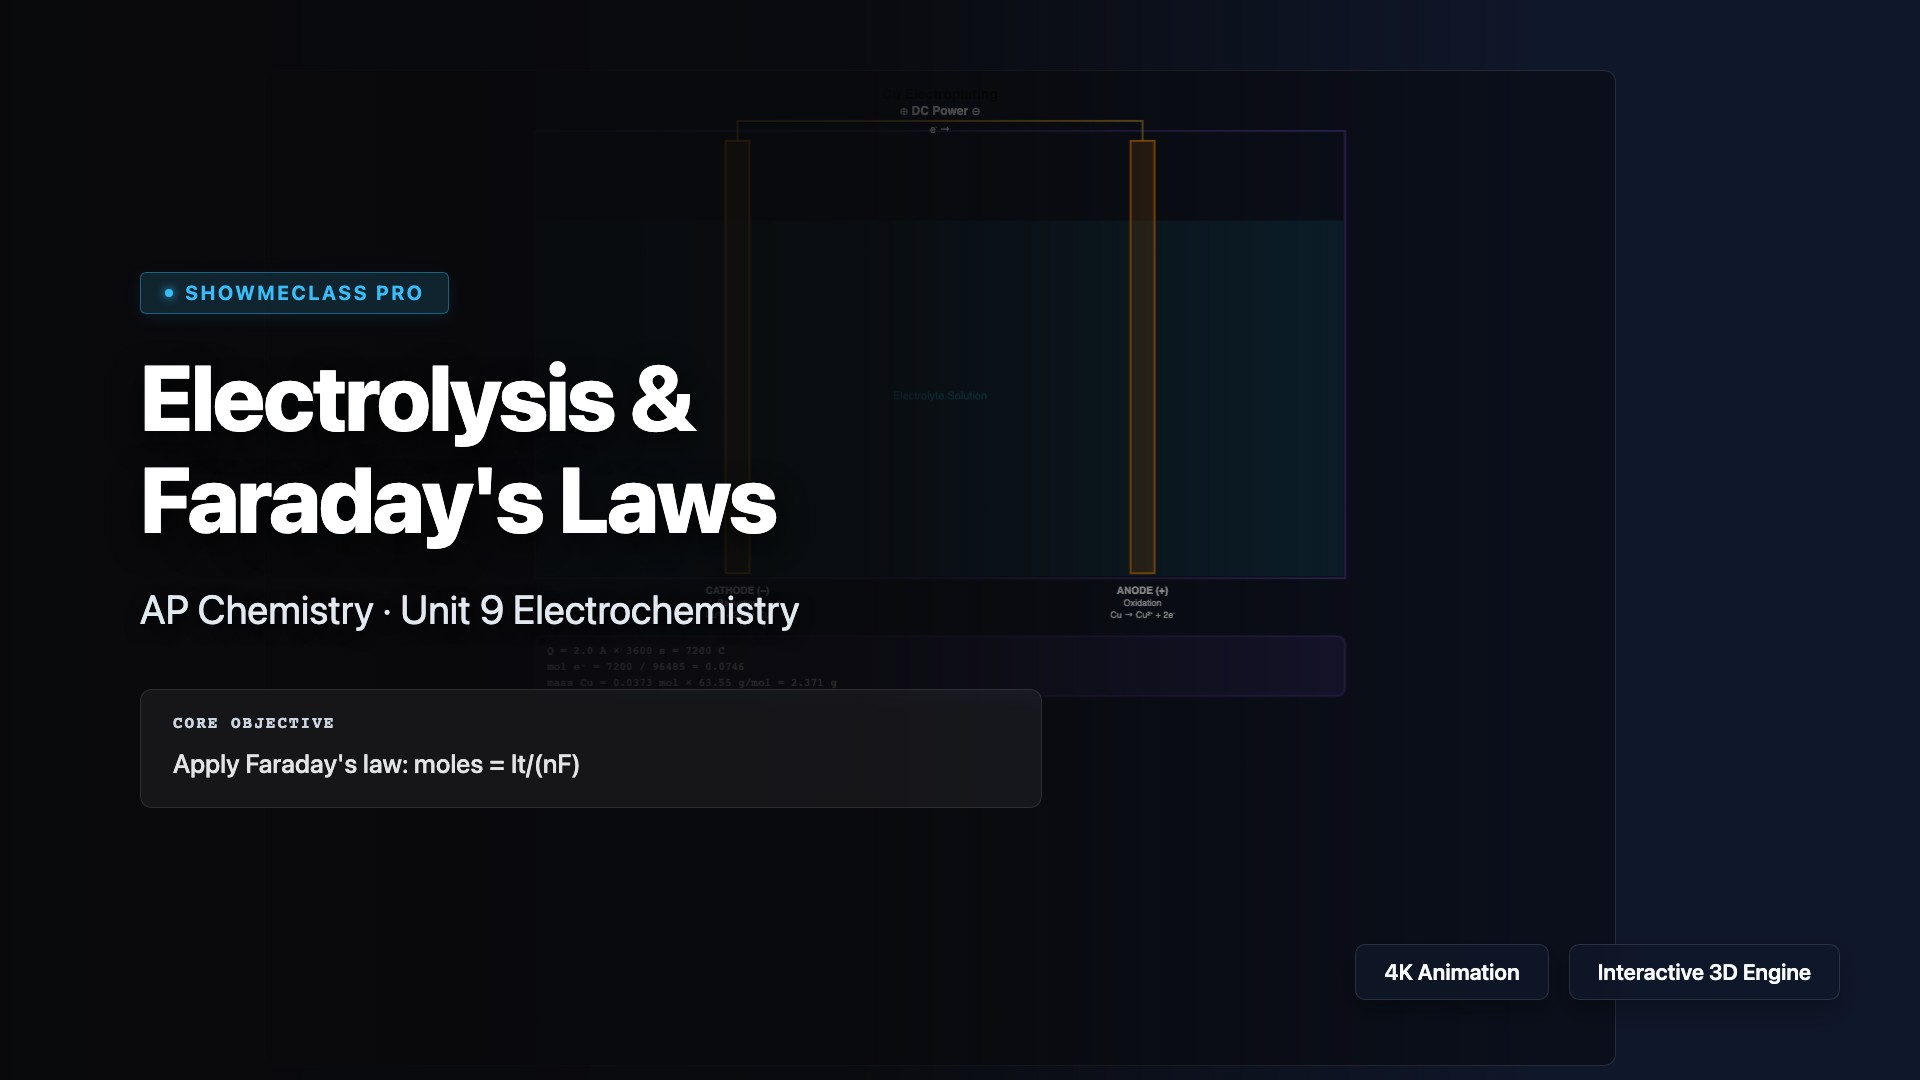
Electrolysis & Faraday's Laws
Interactive electrolysis cell simulator with Faraday's law calculations. Explore 4 electrolysis types (Cu plating, Ag plating, NaCl molten, Al smelting) with visual cell diagram showing cathode/anode reactions. Adjustable current and time with step-by-step Q→mol e⁻→mol product→mass calculation.
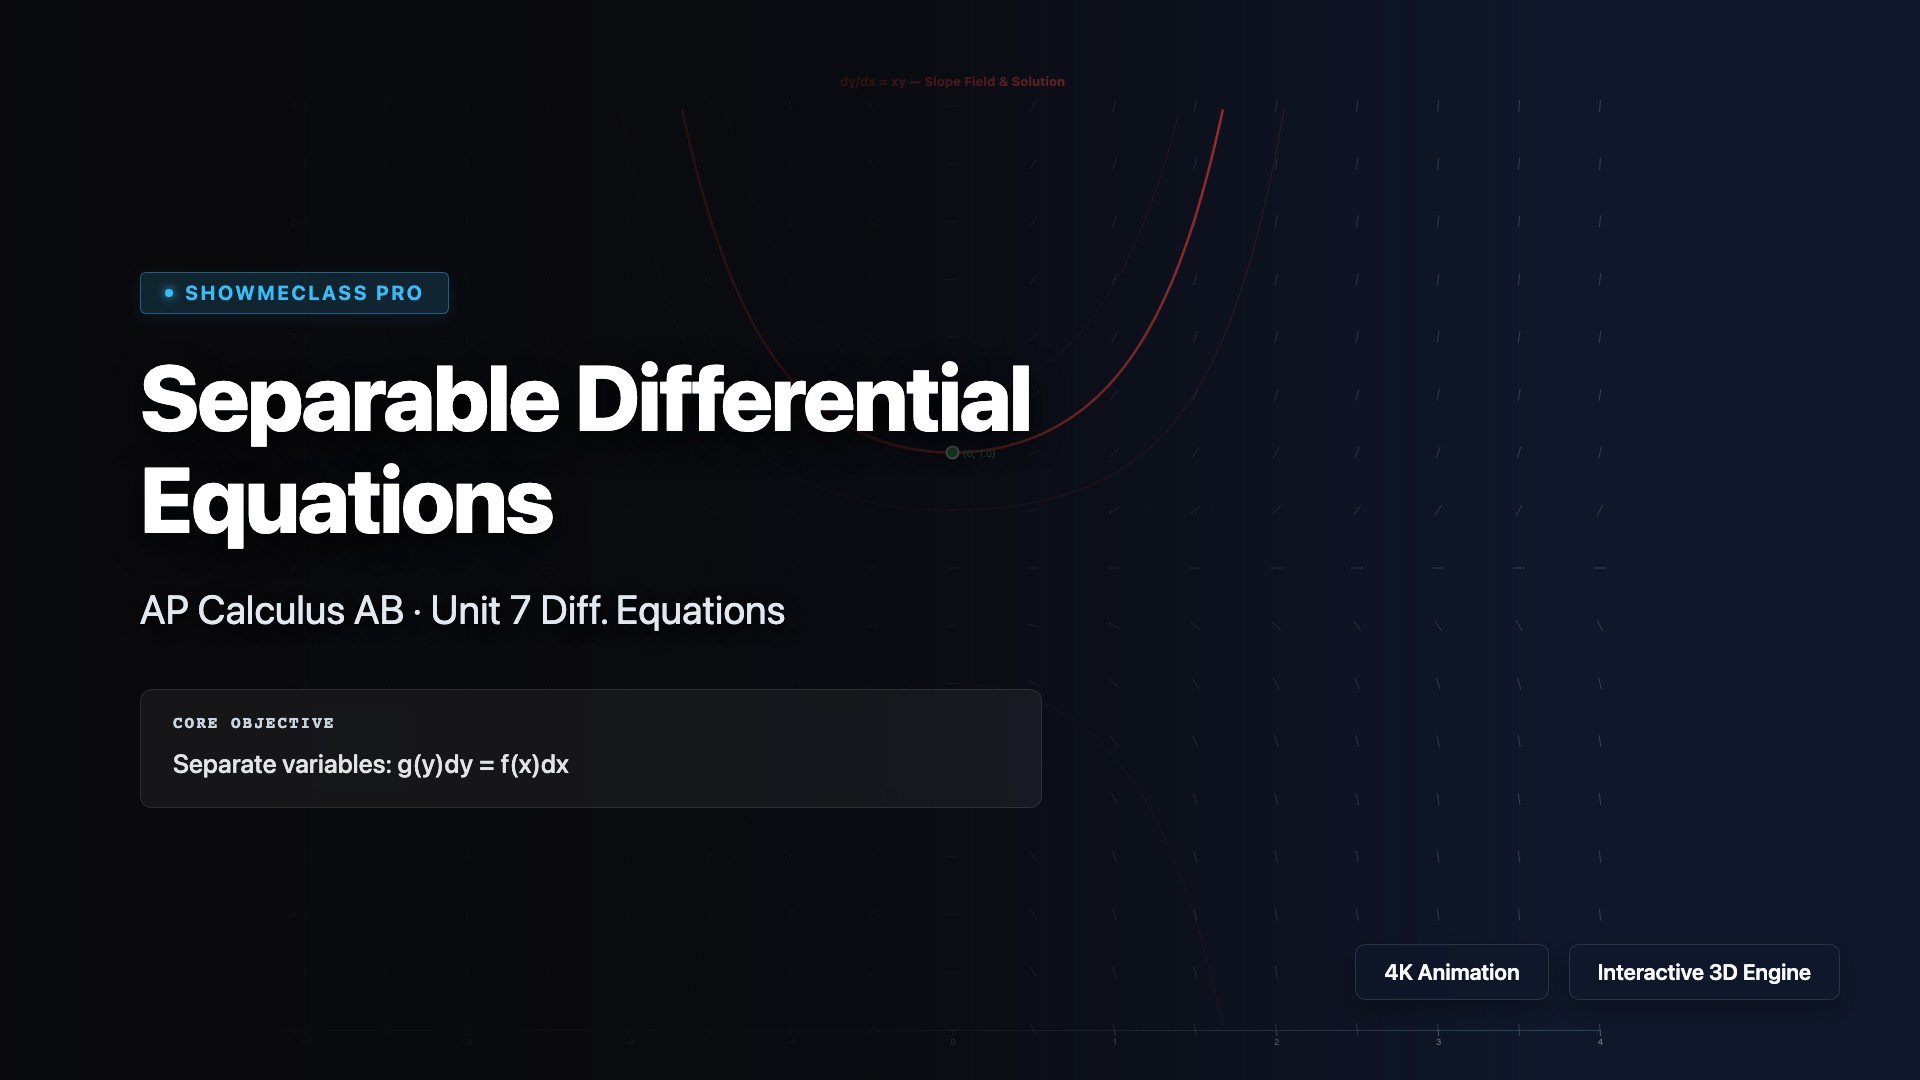
Separable Differential Equations
Slope field visualization with Euler method solution curves for 4 classic separable ODEs (dy/dx=xy, −y/x, y(1−y) logistic, x/y). Adjustable initial condition y₀ with multiple solution curves. Step-by-step separation and integration displayed.
Parametric Speed & Arc Length
Interactive parametric curve visualizer showing position, velocity vector, instantaneous speed |v(t)|, and arc length via Simpson integration. Animate particles along Cycloid, Ellipse, Lissajous, and Butterfly curves with real-time distance accumulation.
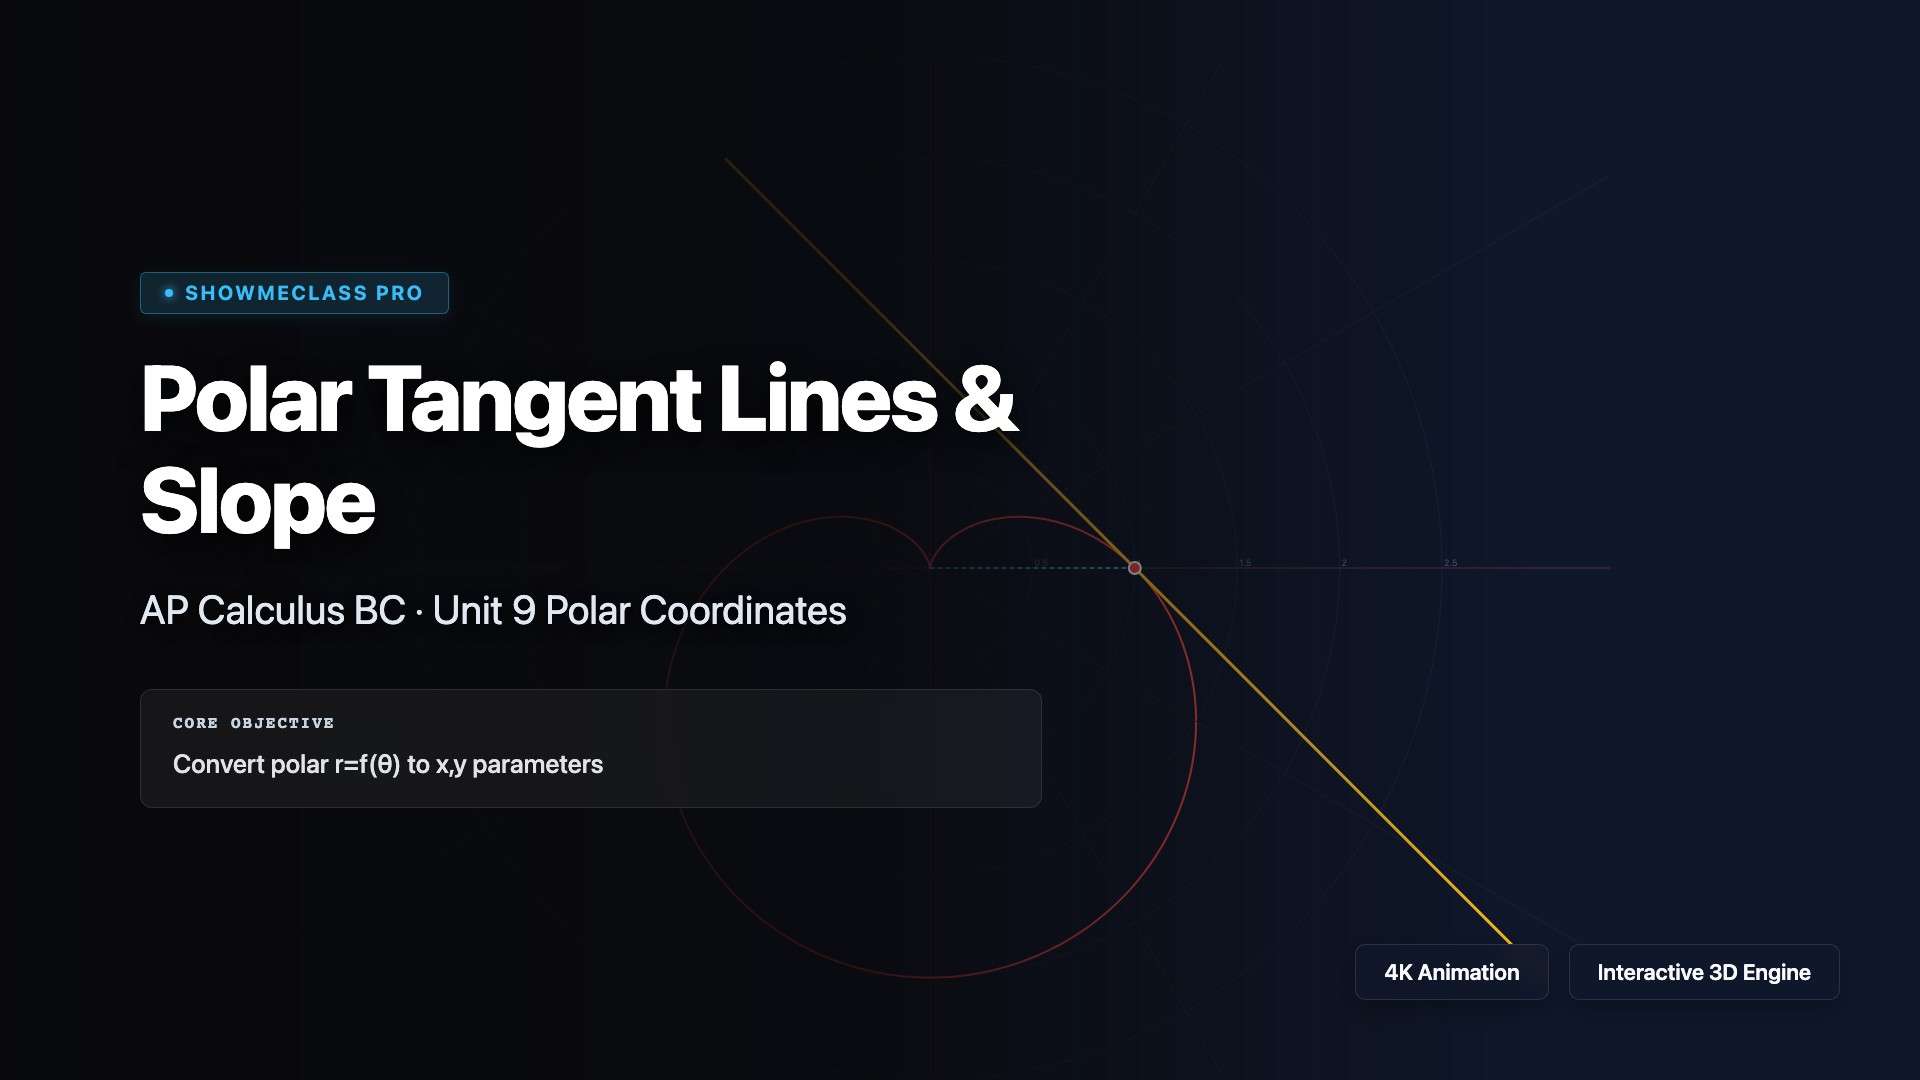
Polar Tangent Lines & Slope
Visualize dy/dx for polar curves r=f(θ) using the chain rule conversion to Cartesian. Shows tangent lines, radial vectors, and identifies horizontal/vertical tangents on Cardioid, Rose, Limaçon, and Lemniscate curves.
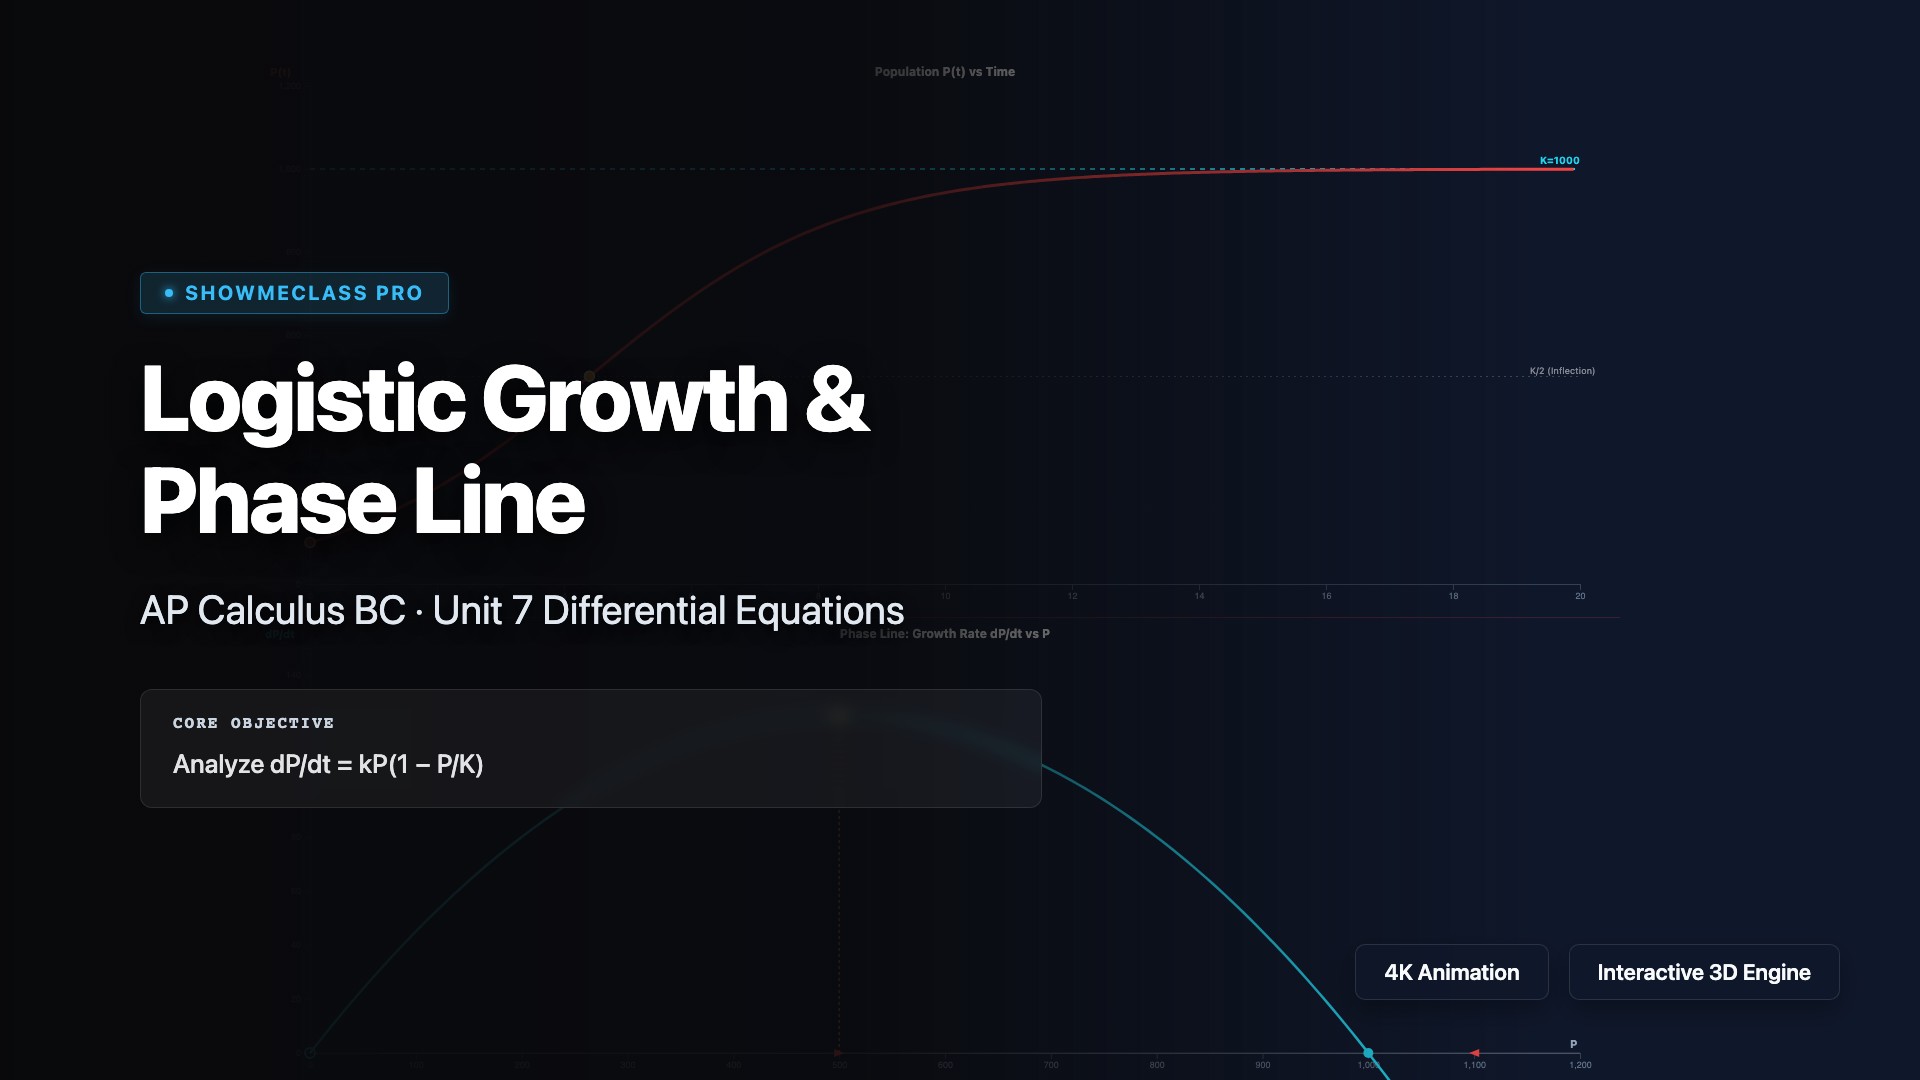
Logistic Growth & Phase Line
Dual-panel logistic differential equation analyzer. Top: P(t) solution curve with carrying capacity K and inflection at K/2. Bottom: dP/dt vs P parabolic phase space showing stable/unstable equilibria and maximum growth rate. Adjustable k, K, and P₀.