Showing 12 results

Kidney Nephron Countercurrent Multiplier
Visualize the complex osmotic gradients of the Loop of Henle. Observe how the active transport of NaCl in the ascending limb drives the passive reabsorption of H2O in the descending limb and collecting duct via ADH regulation.
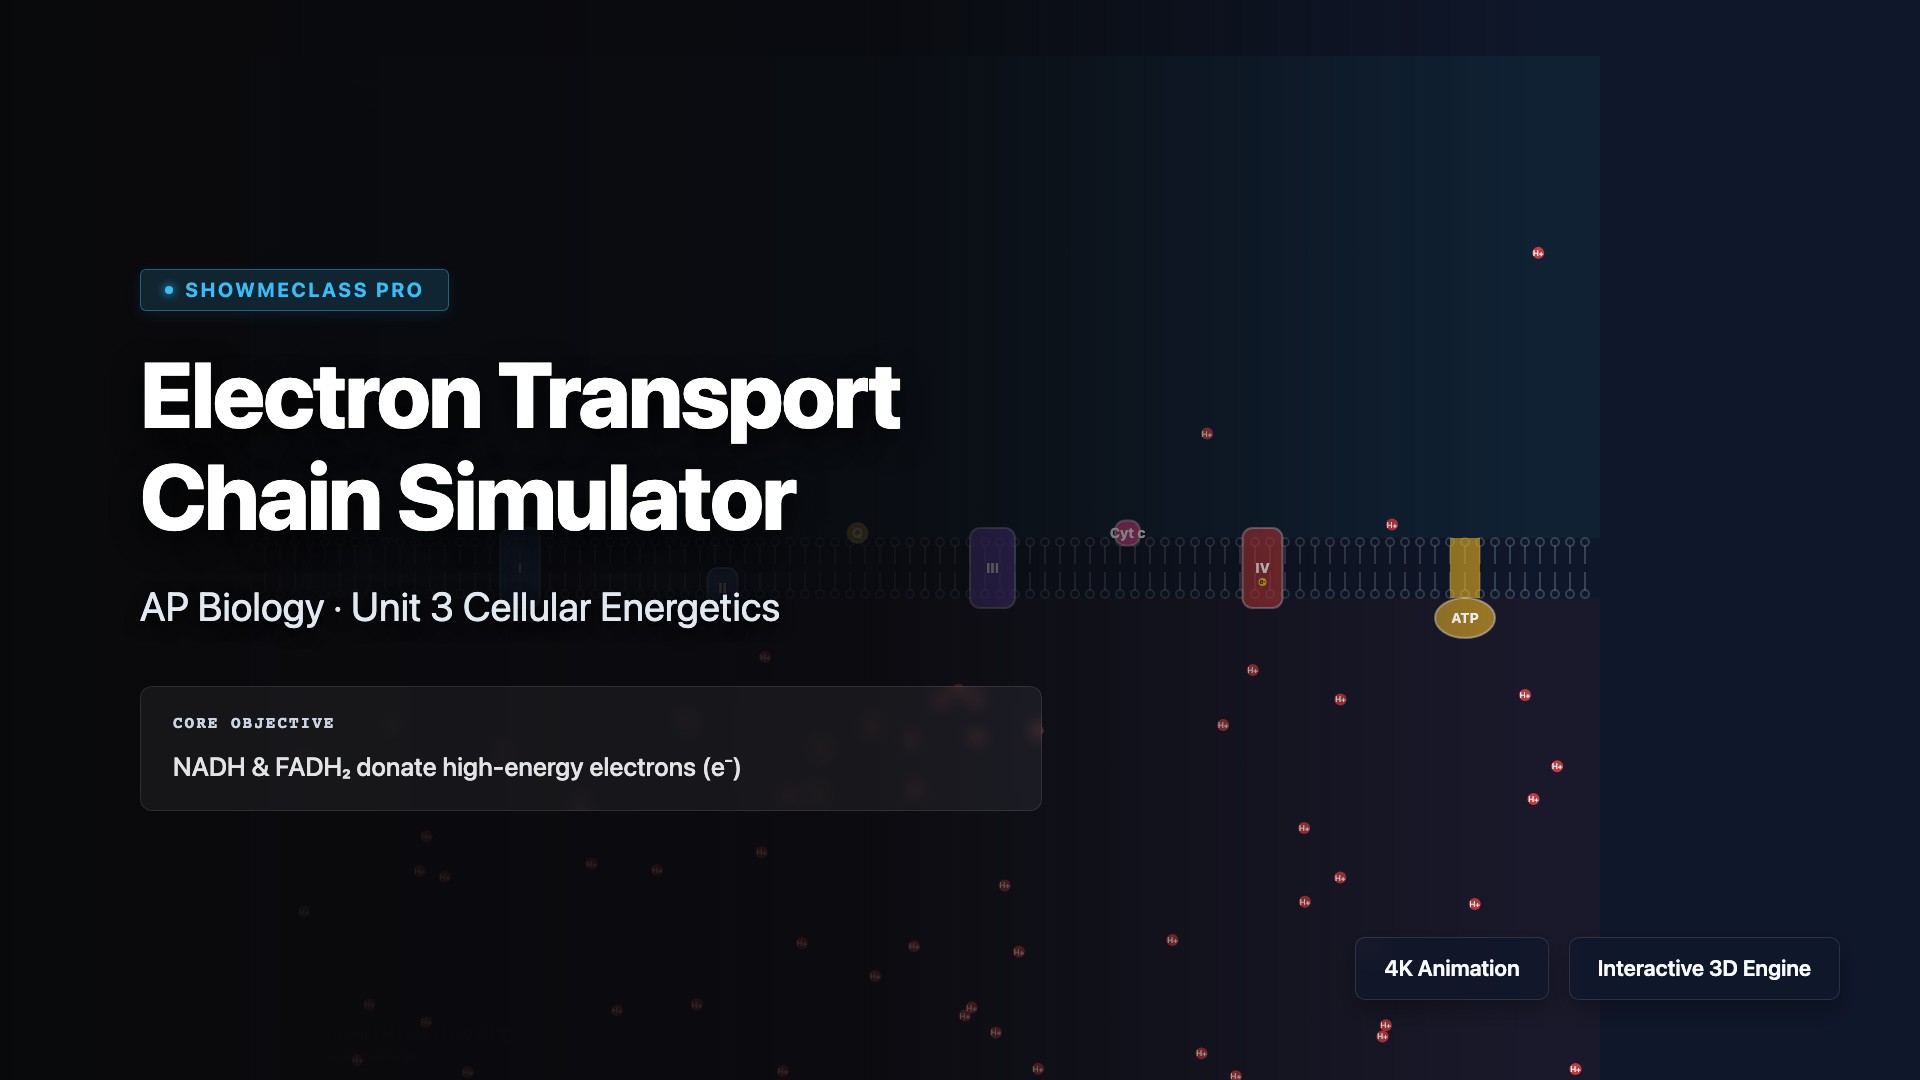
Electron Transport Chain Simulator
Interact with Mitochondrion Complexes I-IV and ATP Synthase. Adjust NADH/O₂ supplies and apply inhibitors (Cyanide, DNP) to observe effects on the proton motive force.

Signal Transduction Pathway
Trigger an epinephrine signaling cascade spanning Reception (GPCR), Transduction (G-protein, Adenylyl Cyclase, cAMP), and Response (PKA kinase amplification).
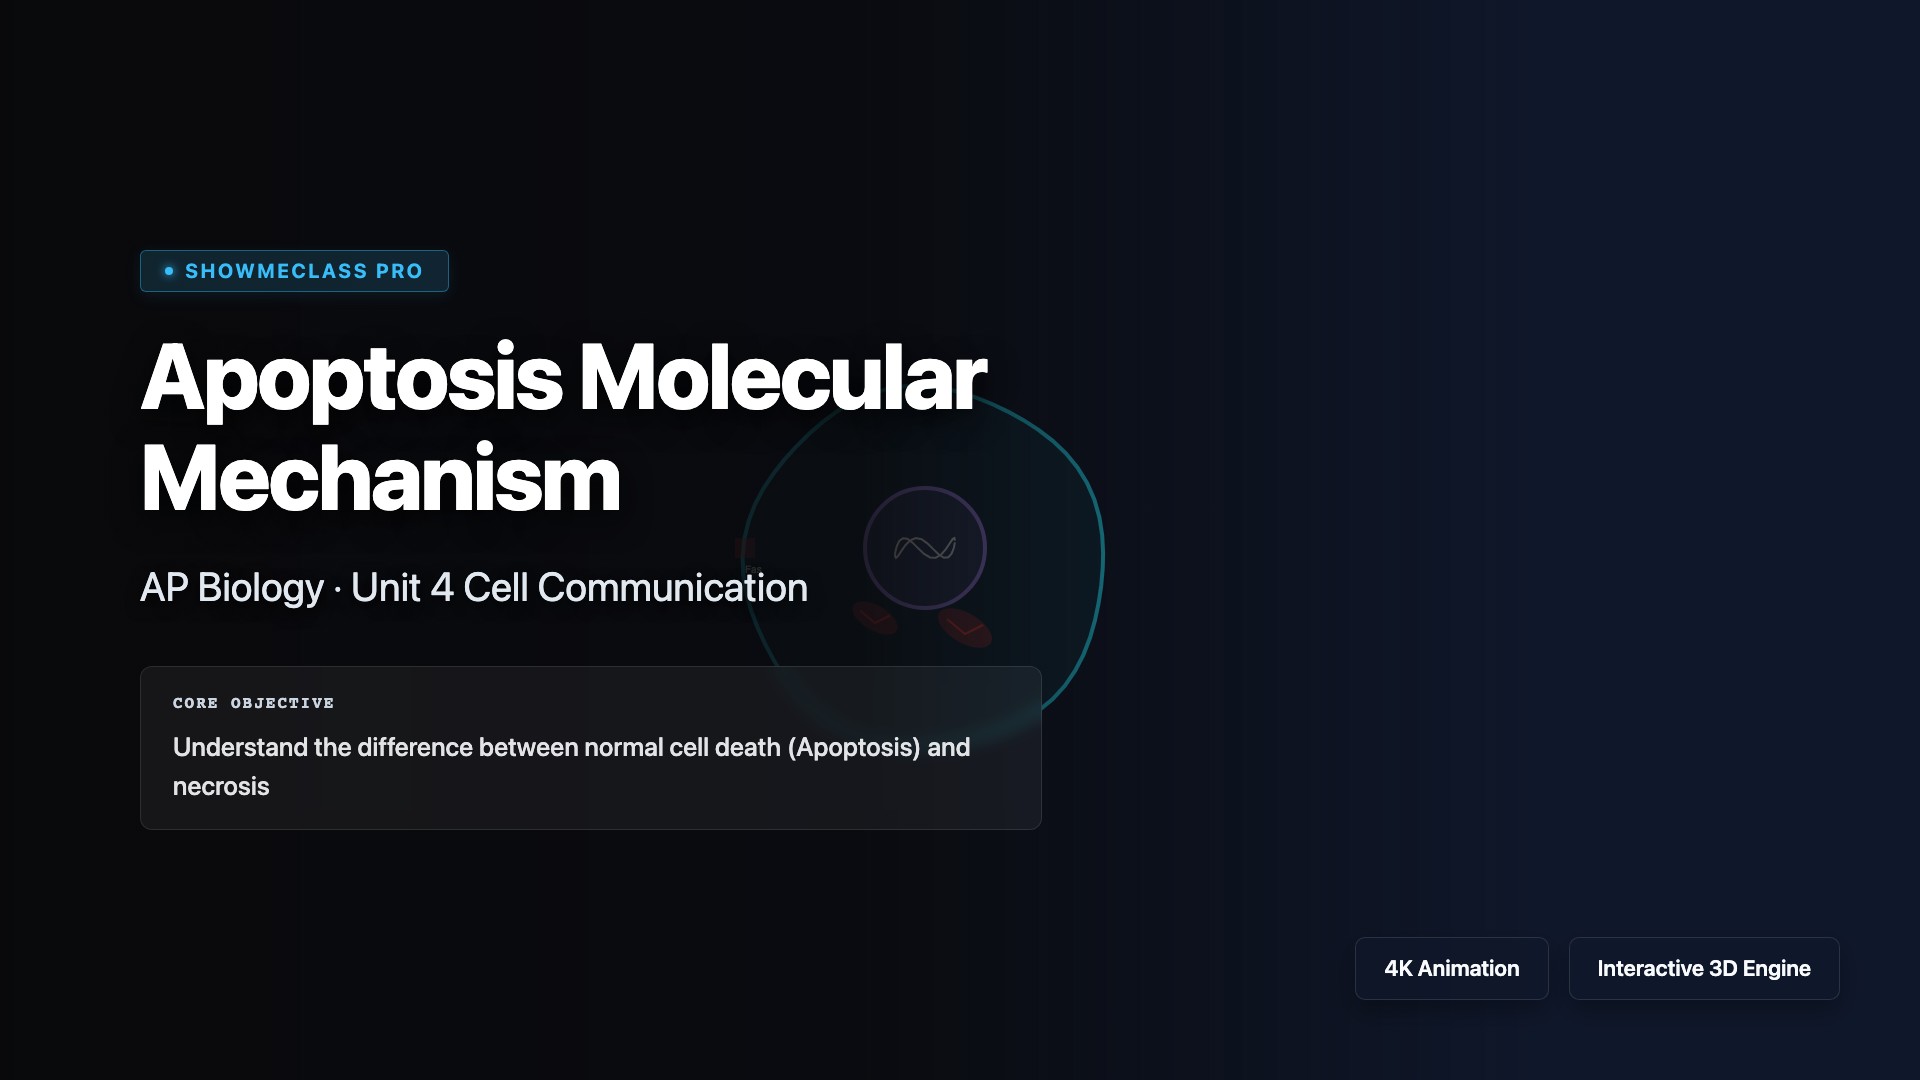
Apoptosis Molecular Mechanism
Trigger the intrinsic (mitochondrial/cytochrome c leakage) or extrinsic pathways of programmed cell death leading to the destructive Caspase cascade and cellular blebbing.
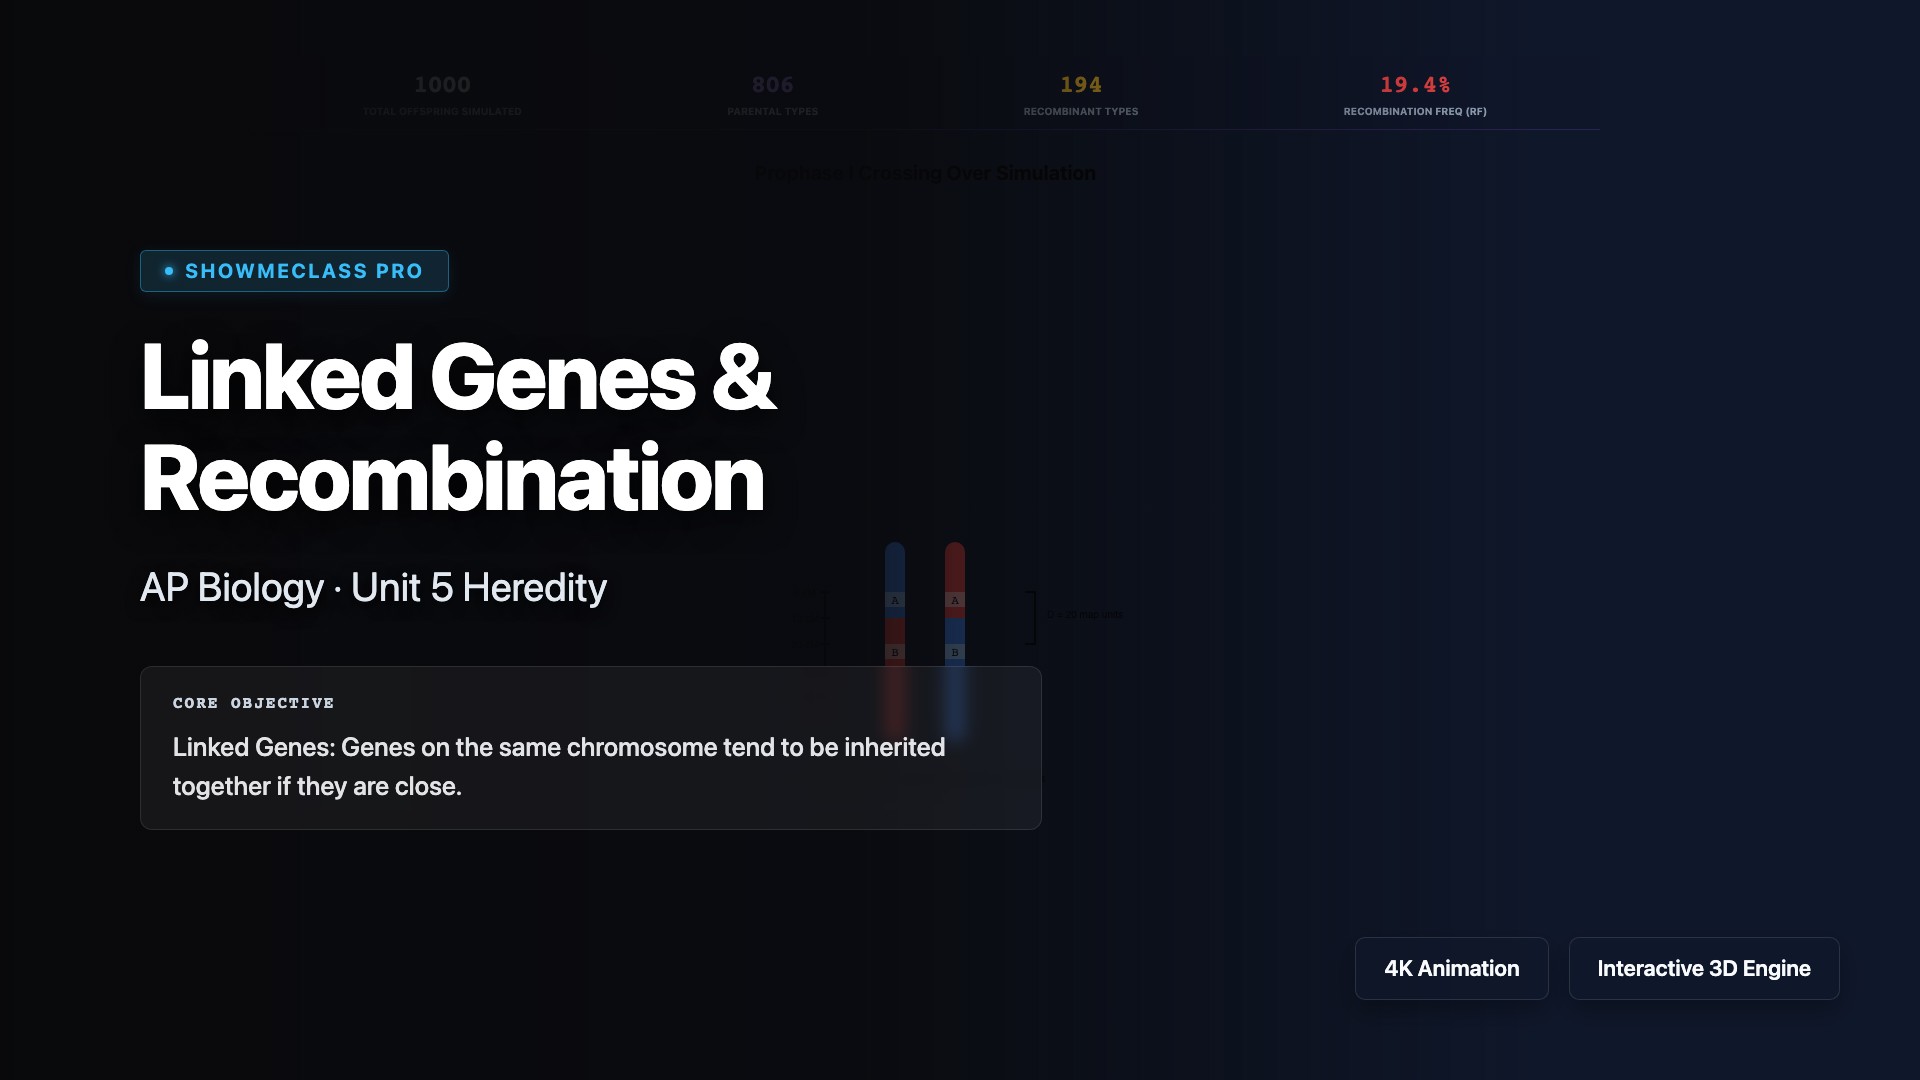
Linked Genes & Recombination
Adjust the physical map units between two genes to observe the dynamic probability of Prophase I crossing over and mathematically predict offspring Recombination Frequency.

Epigenetic Regulation
Visualize how DNA Methylation tightly coils chromatin (turning genes OFF) and Histone Acetylation loosens chromatin (turning genes ON), bypassing the underlying DNA sequence.
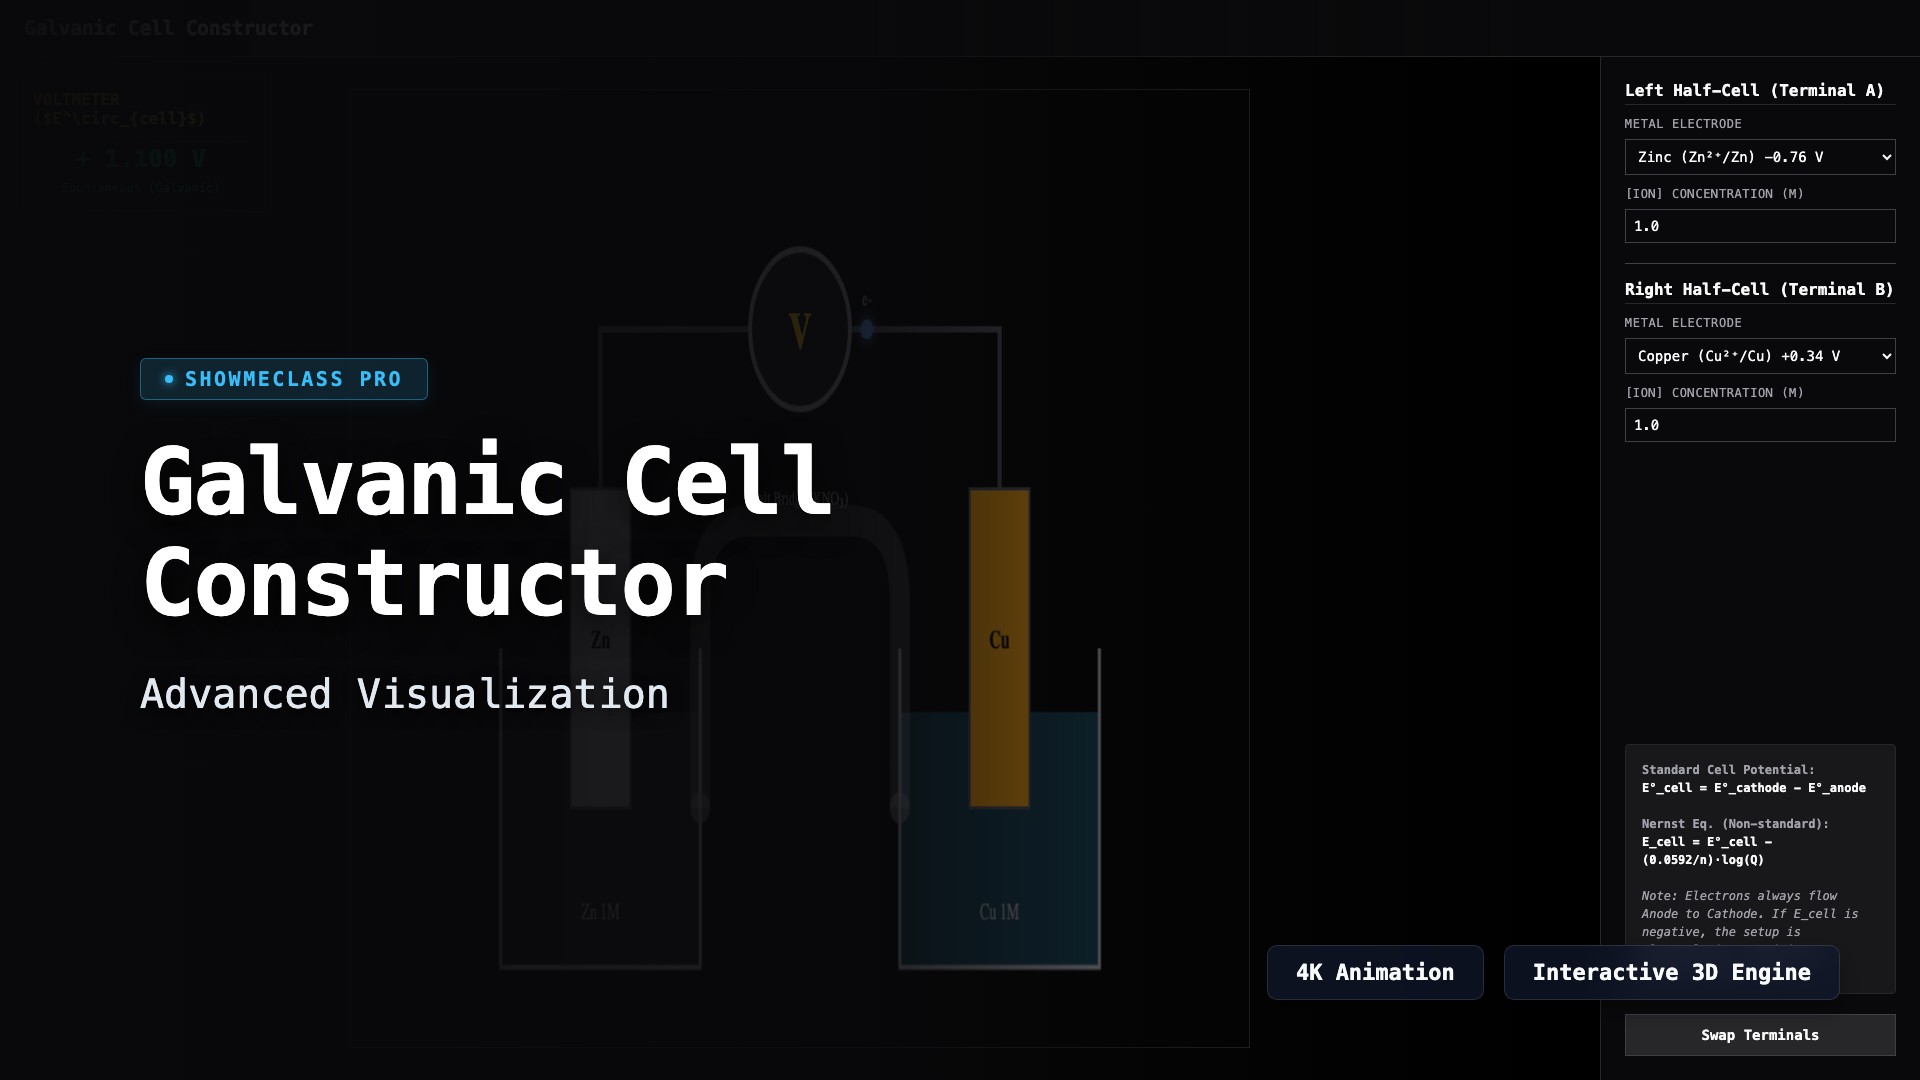
Galvanic Cell Constructor
Construct custom voltaic circuits using Zn, Cu, and Ag half-cells. The simulator utilizes real Standard Reduction Potentials and applies the Nernst Equation to calculate cell potential dynamically across varying molarities.
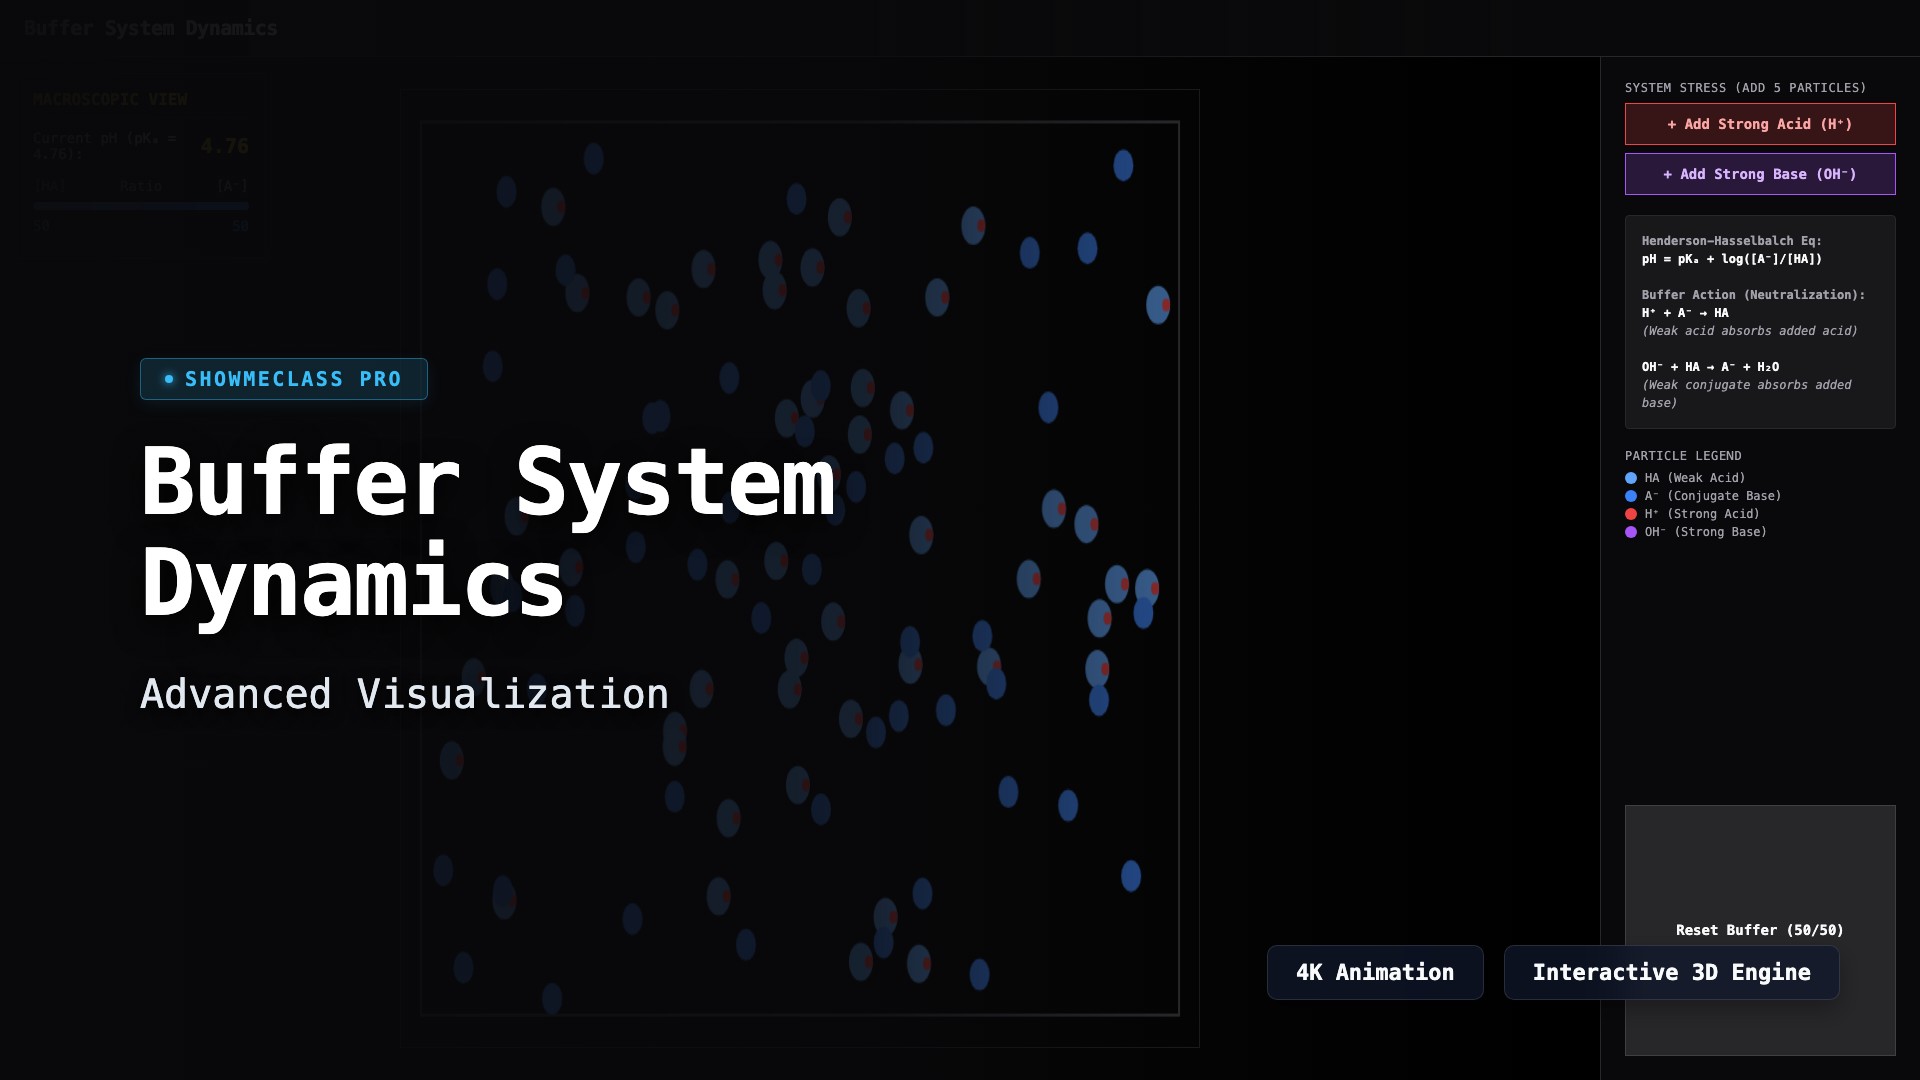
Buffer System Dynamics
Visualize a macroscopic particle-level buffer system reacting to the influx of strong acids (H⁺) or strong bases (OH⁻). Observe Henderson-Hasselbalch equations dynamically adapt as the buffer capacity successfully resists dramatic pH changes.
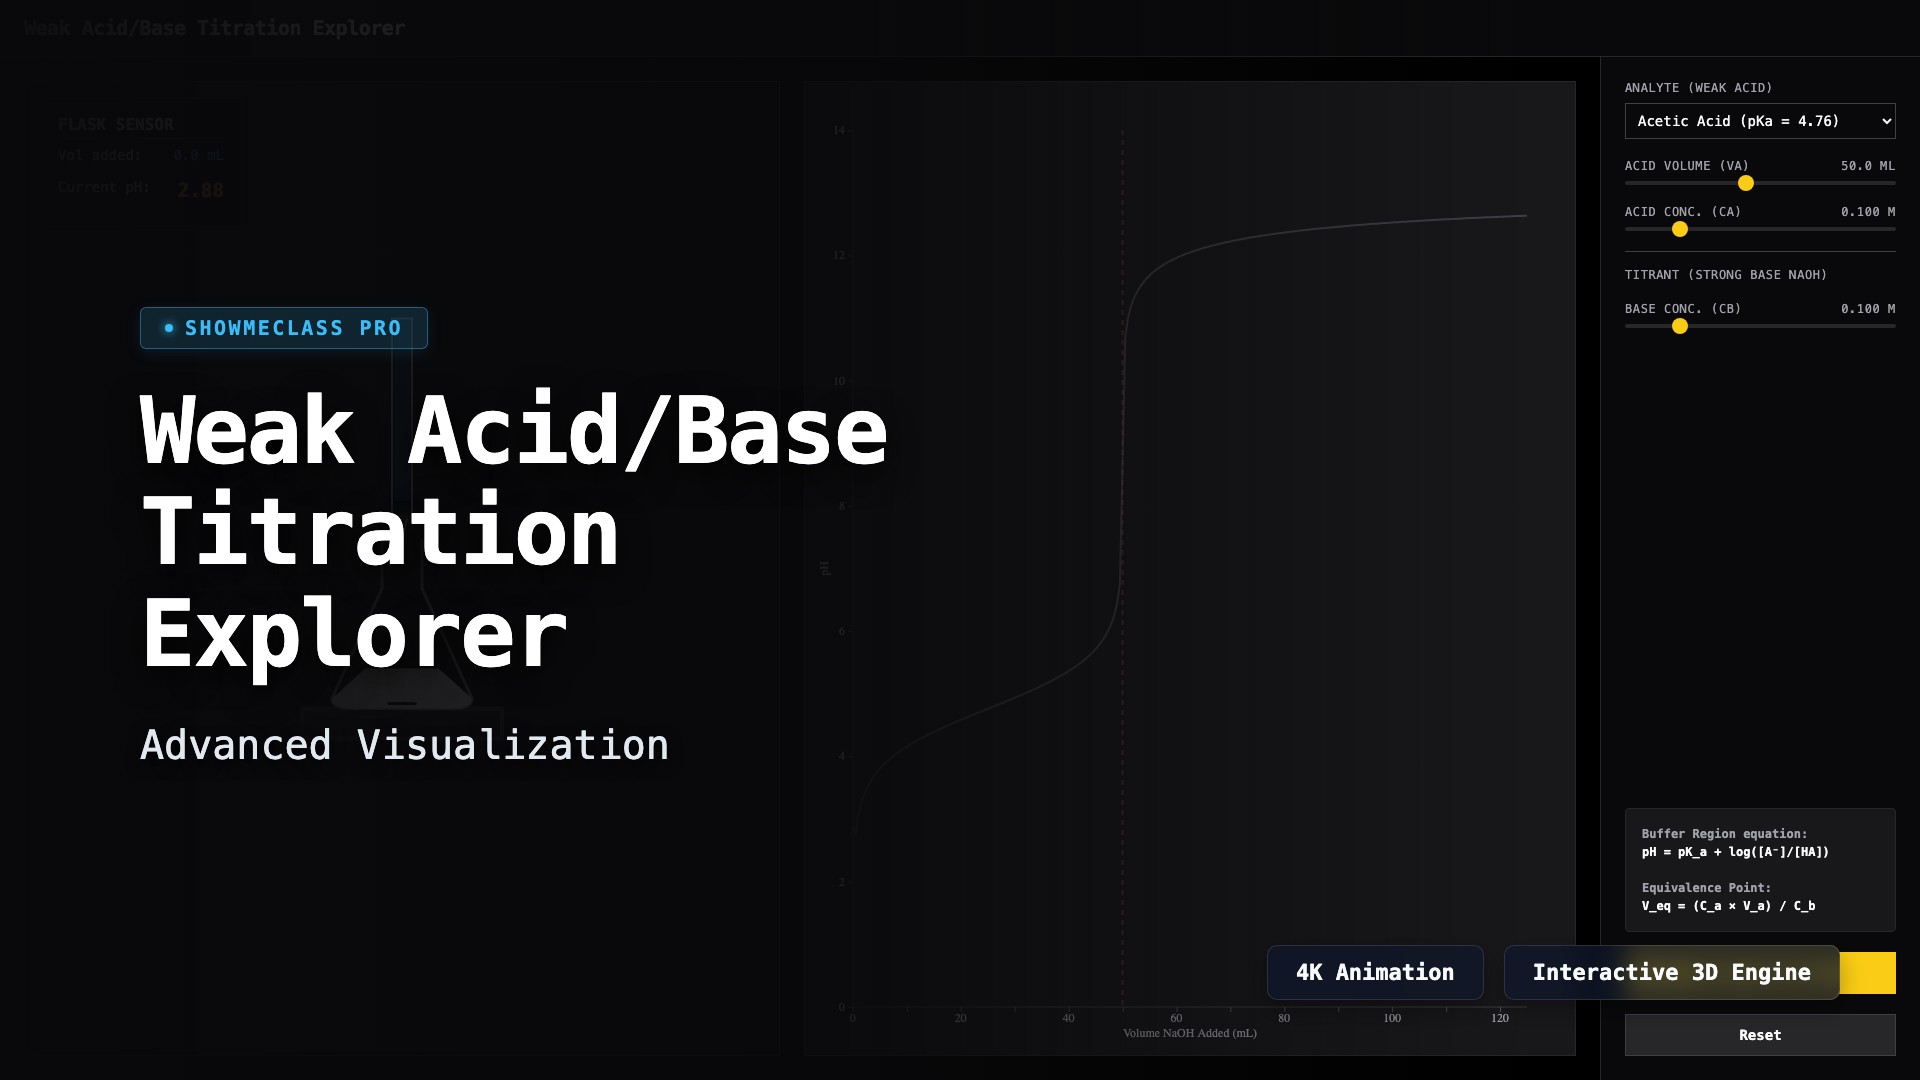
Weak Acid/Base Titration Explorer
Perform a simulated titration dropping strong base into a weak acid. The simulator mathematically calculates real-time buffer regions, half-equivalence points, and post-equivalence spikes dynamically, plotting the exact sigmoidal pH titration curve.
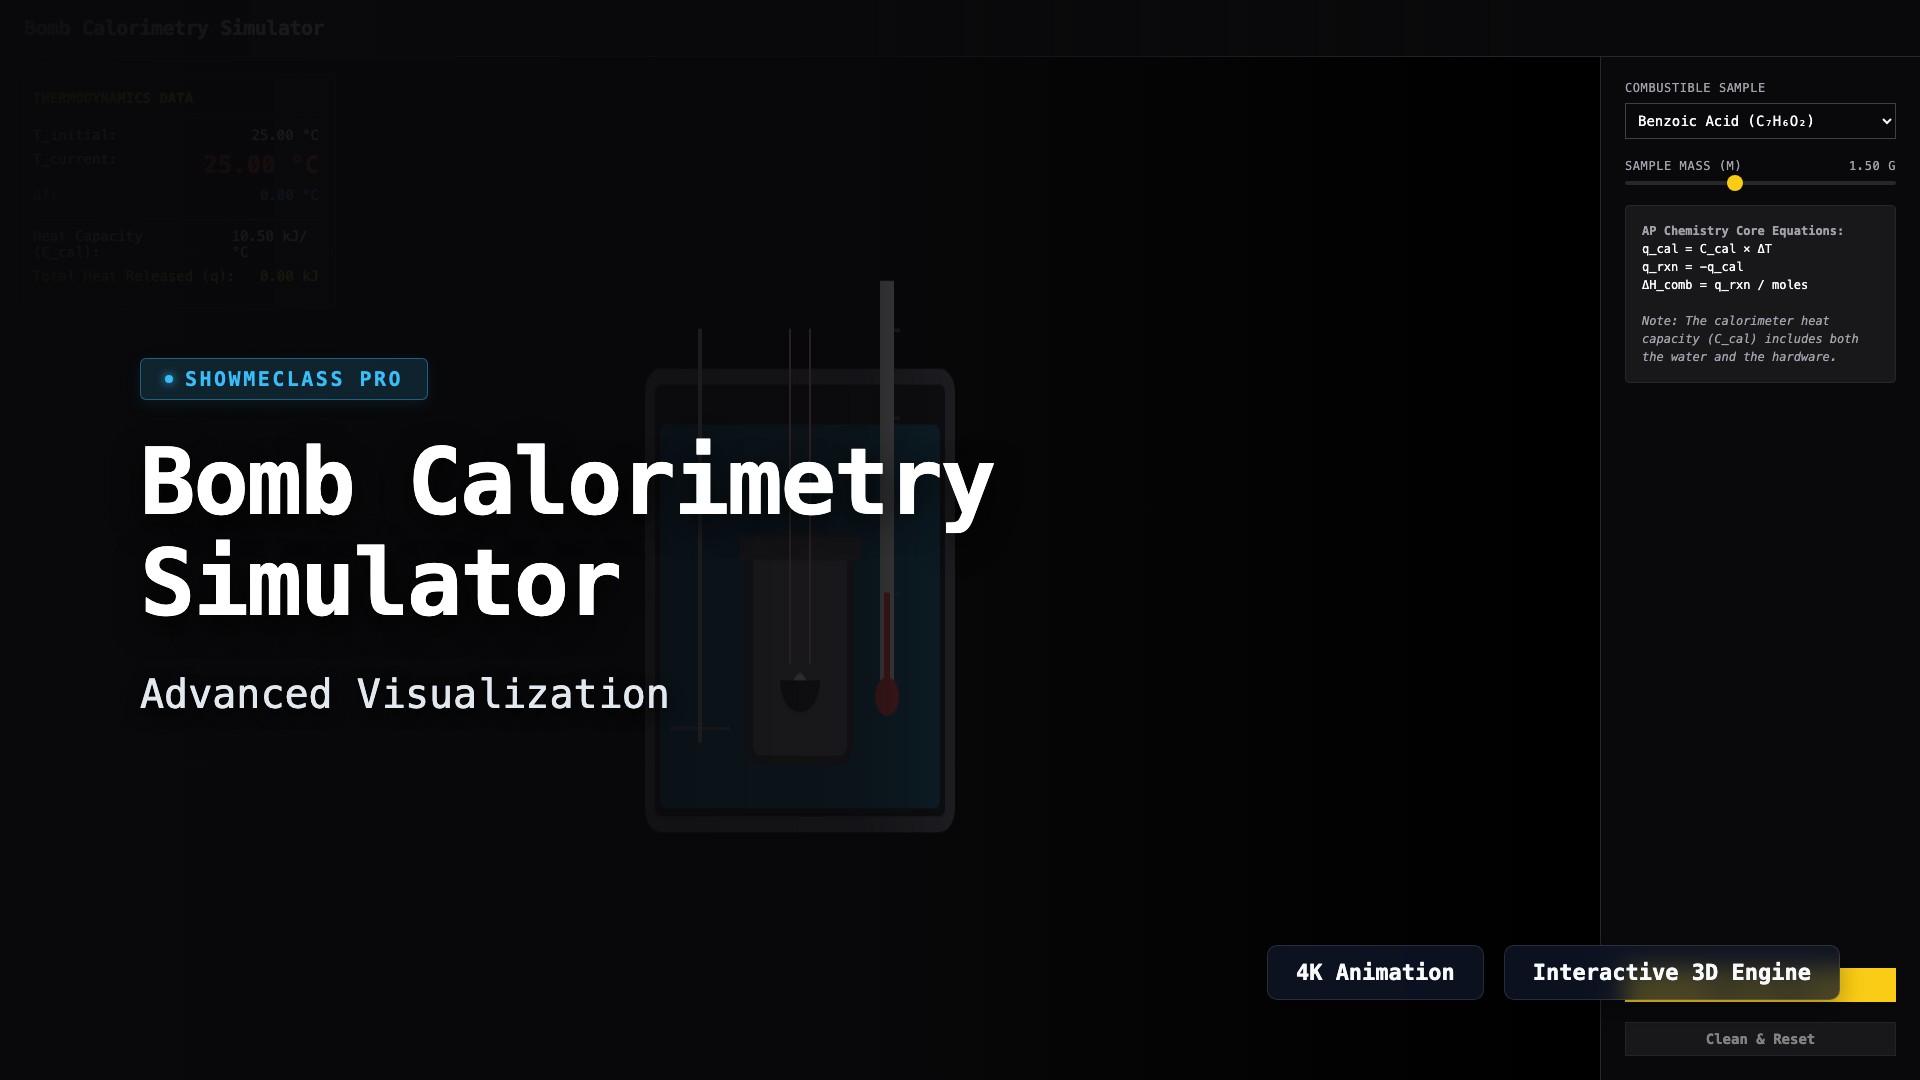
Bomb Calorimetry Simulator
Simulate a constant-volume bomb calorimeter to compute the molar heat of combustion (ΔH_comb). Ignite different organic samples and dynamically measure the highly precise temperature rise to calculate the heat absorbed by the system.
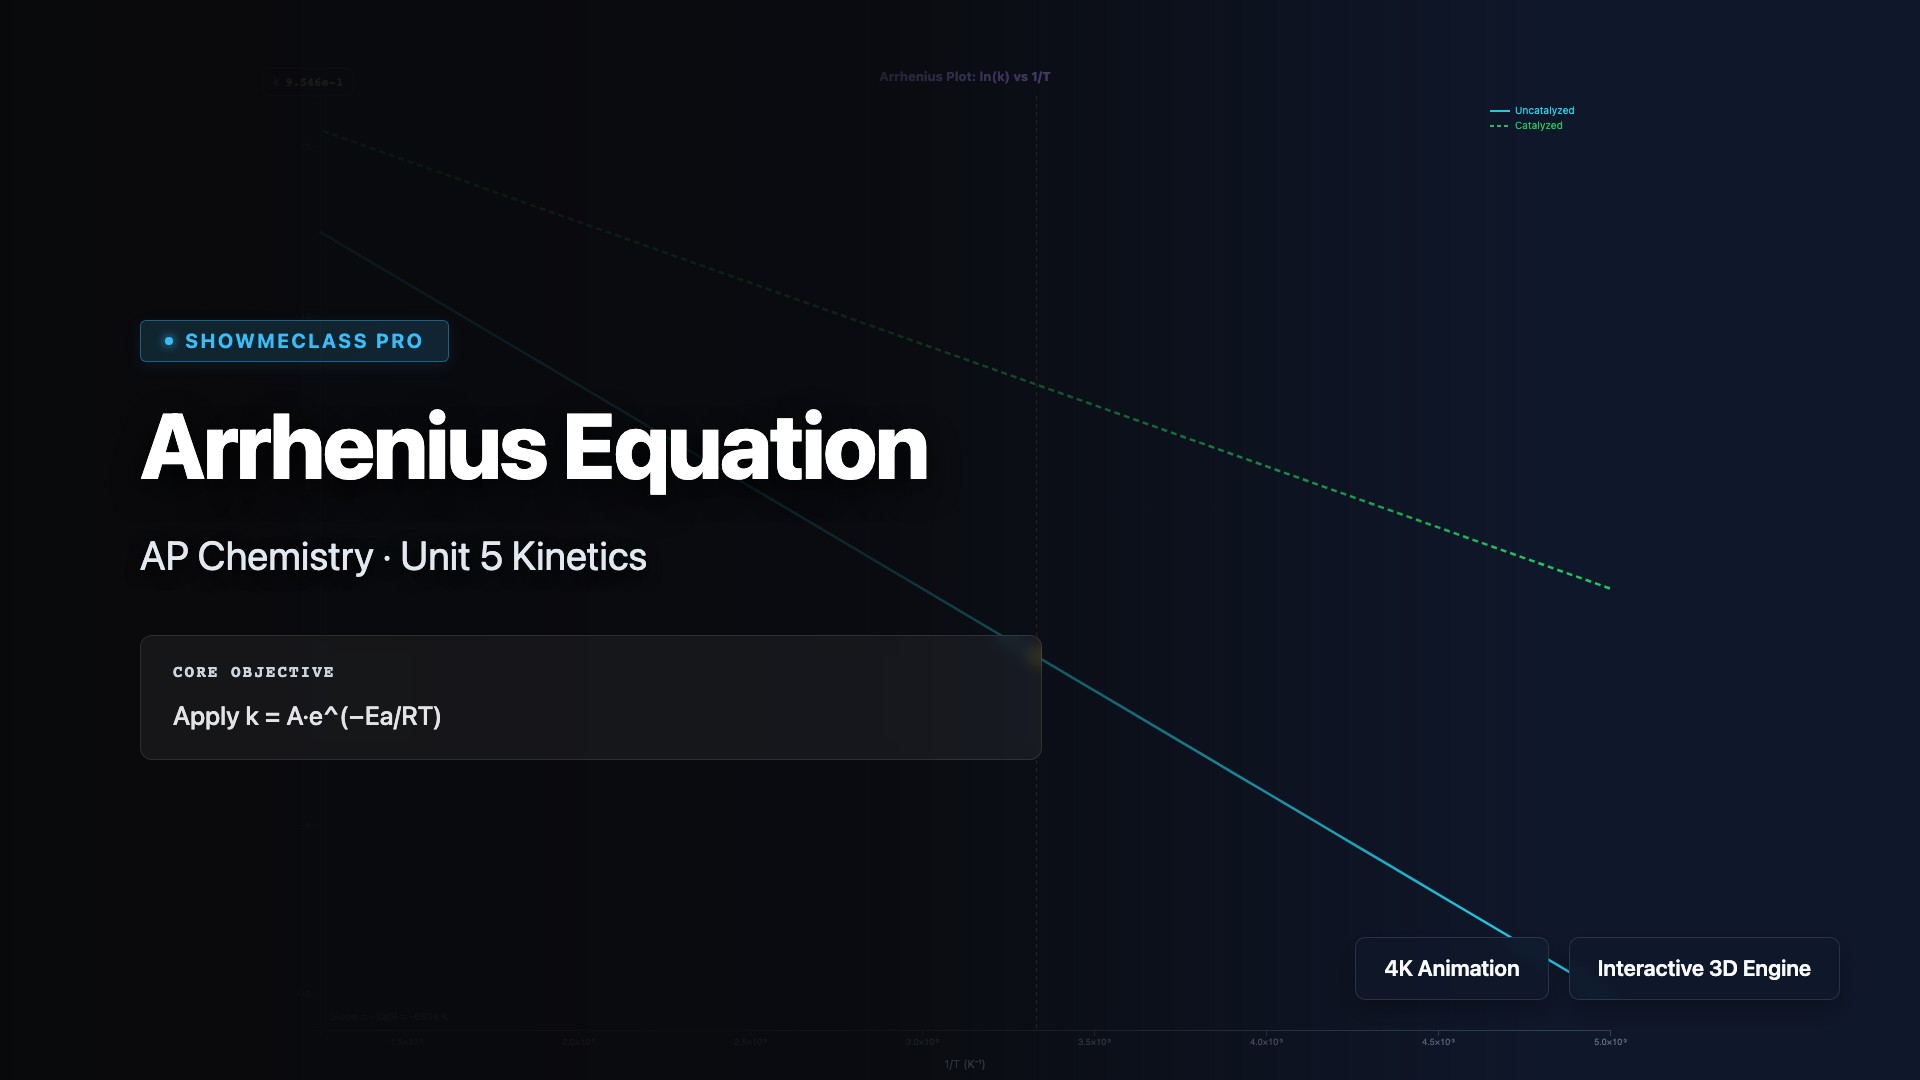
Arrhenius Equation (Rate vs Temperature)
Visualize the Arrhenius equation k = Ae^(−Ea/RT) with adjustable Ea and temperature. Compare catalyzed vs uncatalyzed reactions on a ln(k) vs 1/T plot.
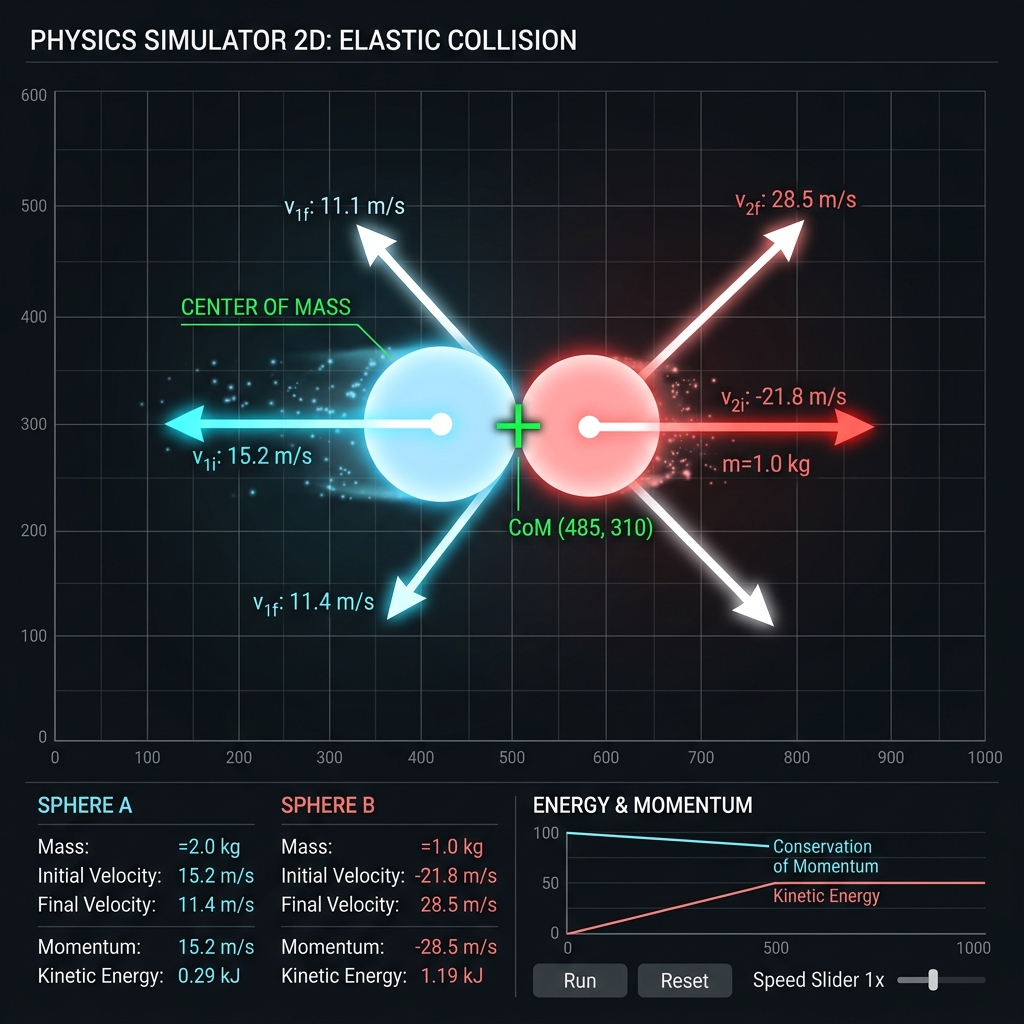
2D Center of Mass Collision Simulator
Simulate 2D elastic collisions from both the Laboratory and Center of Mass reference frames. Visualize how the total momentum in the COM frame always remains exactly zero, creating perfectly symmetric scattering trajectories.