Showing 12 results
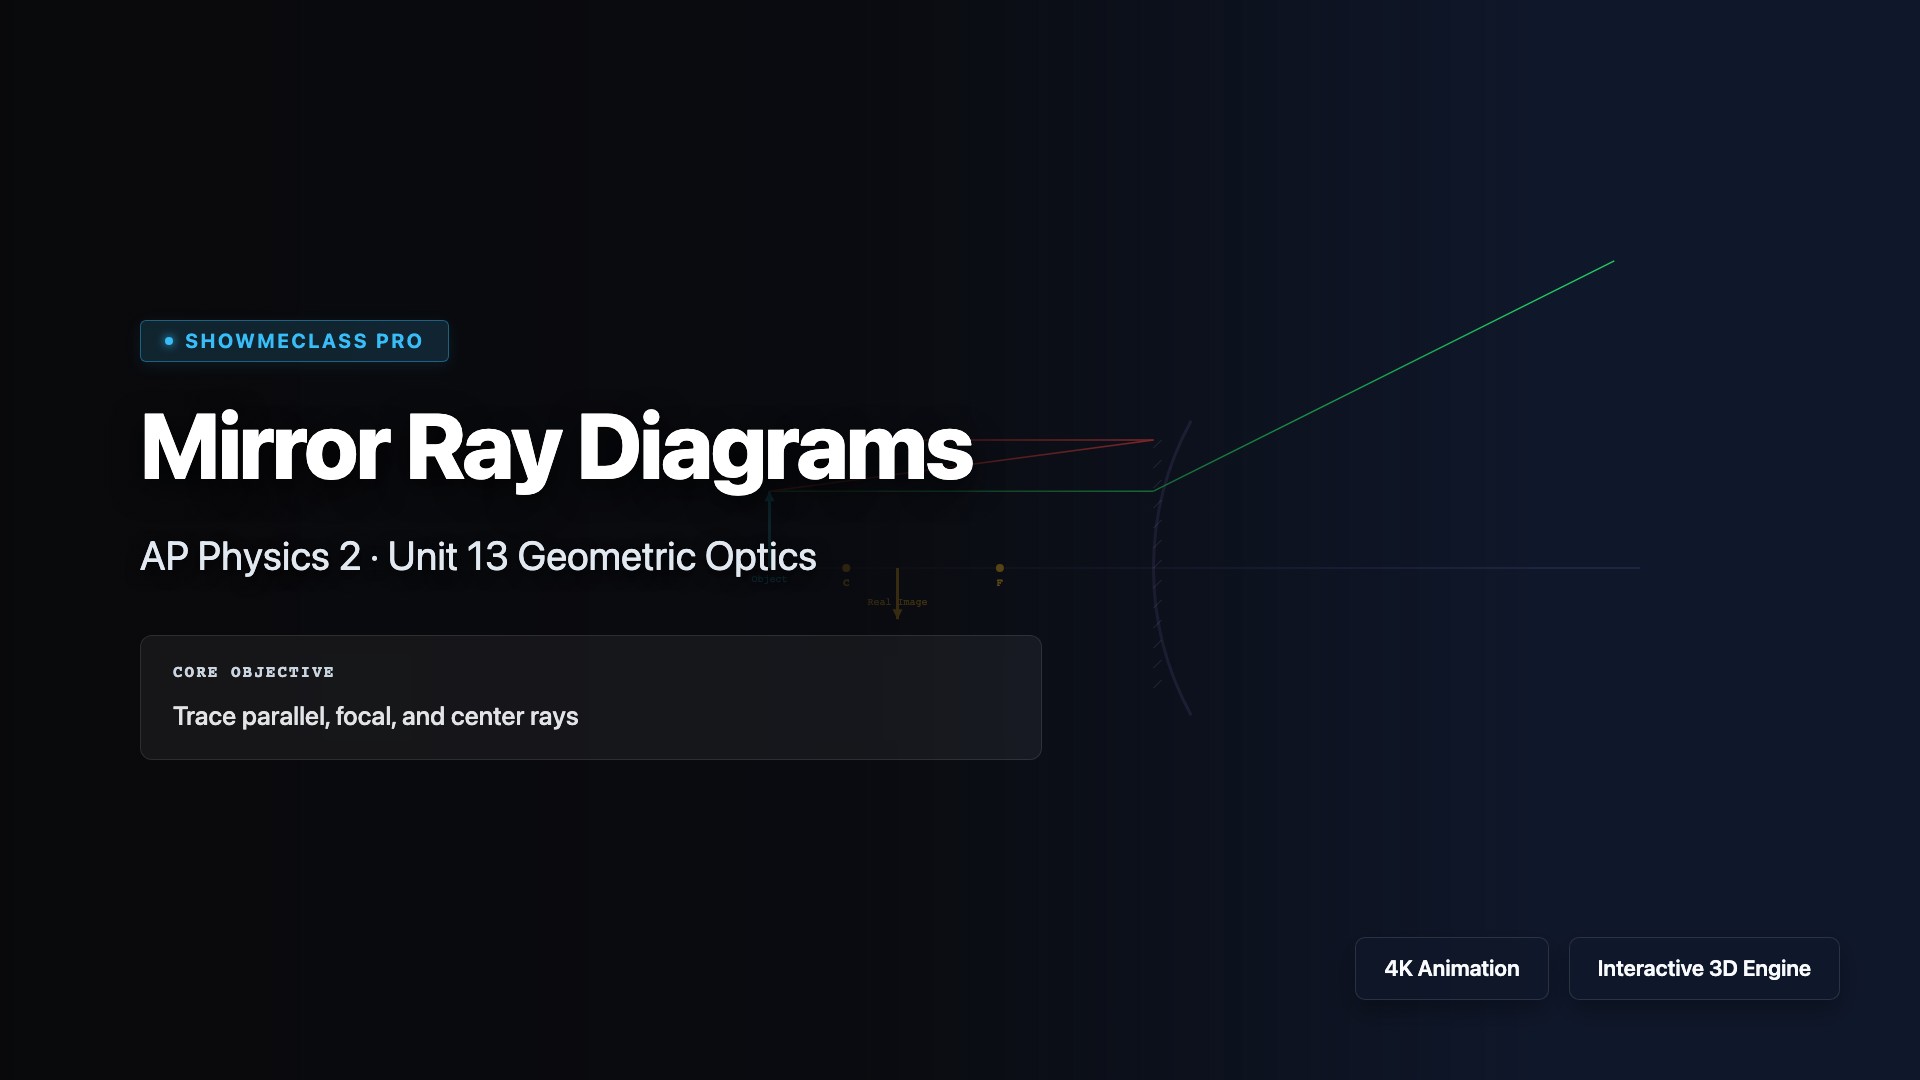
Concave & Convex Mirror Ray Diagrams
Trace parallel and focal rays for concave/convex mirrors. Calculate image distance, height, magnification, and identify real vs virtual images.
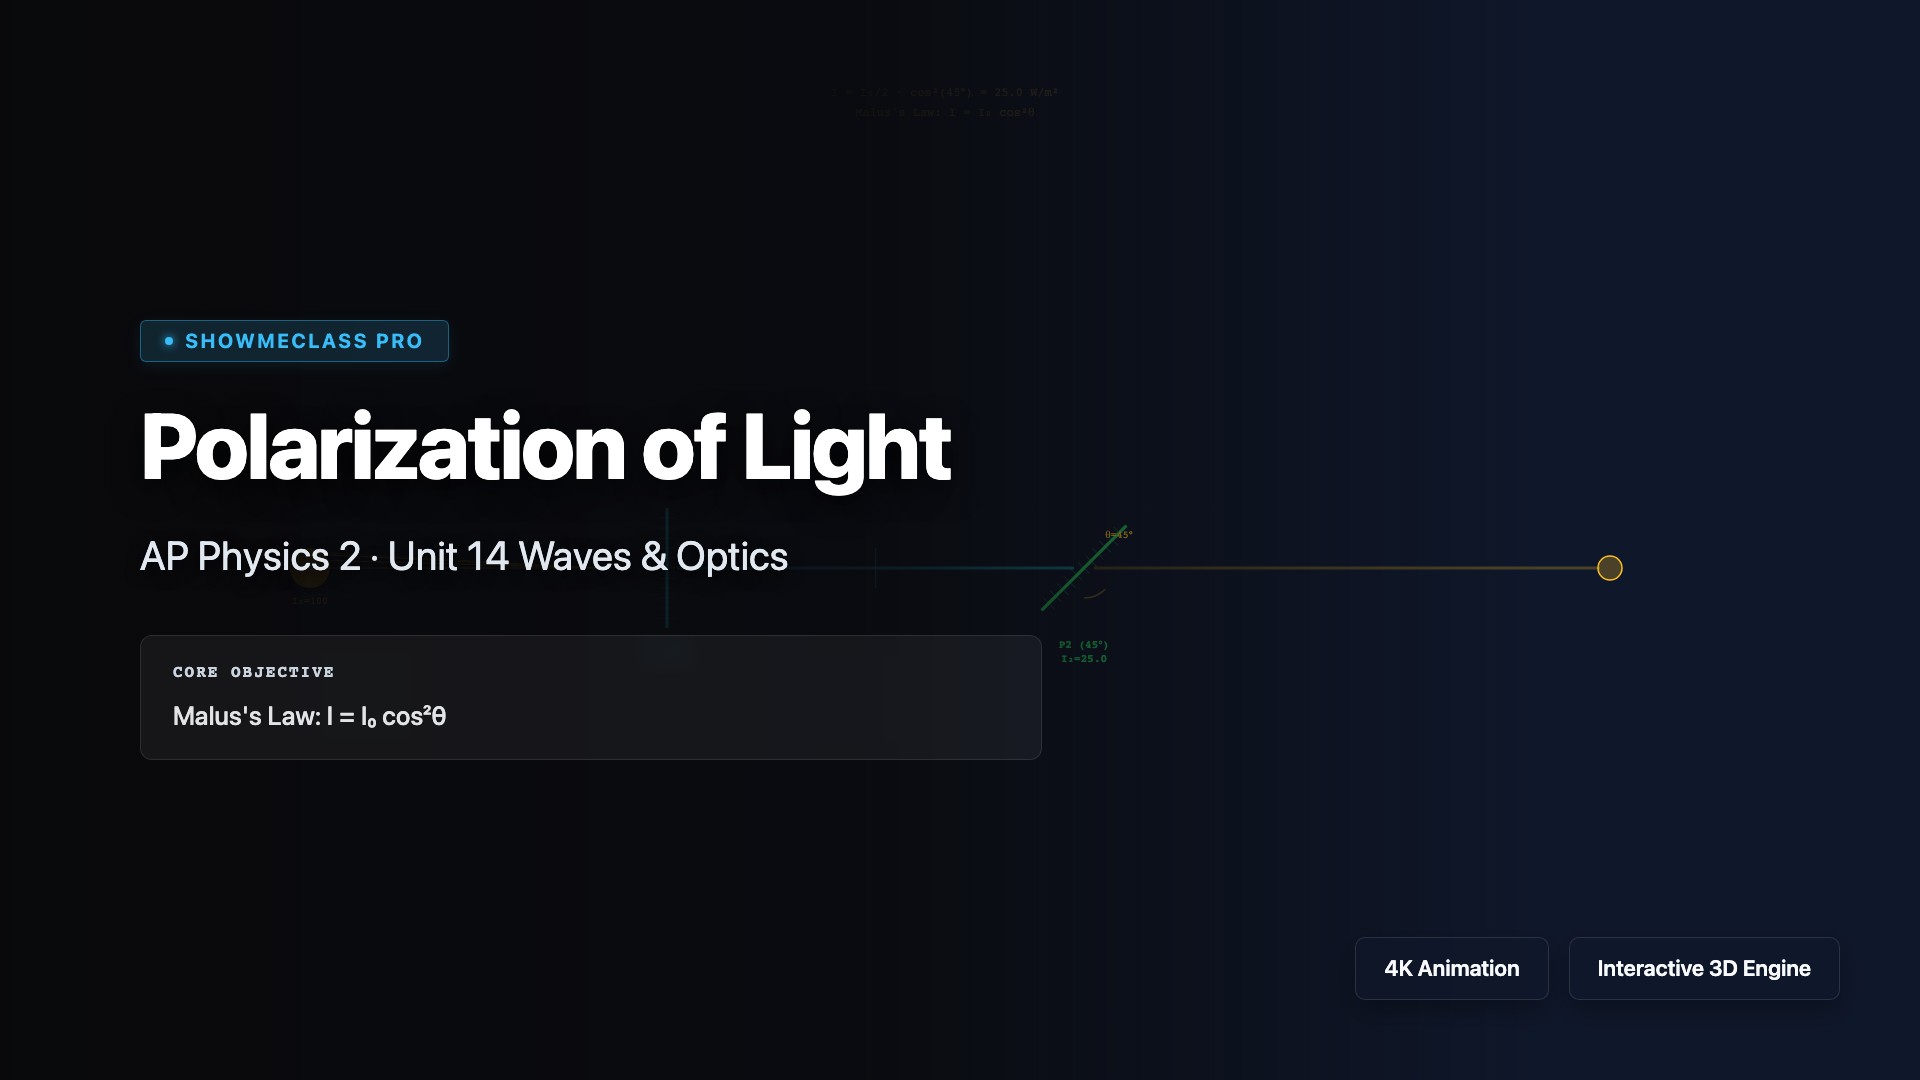
Polarization of Light (Malus's Law)
Malus's Law I = I₀cos²θ with two-polarizer system. Adjust polarizer angles and see transmitted intensity change. Crossed polarizers block all light.
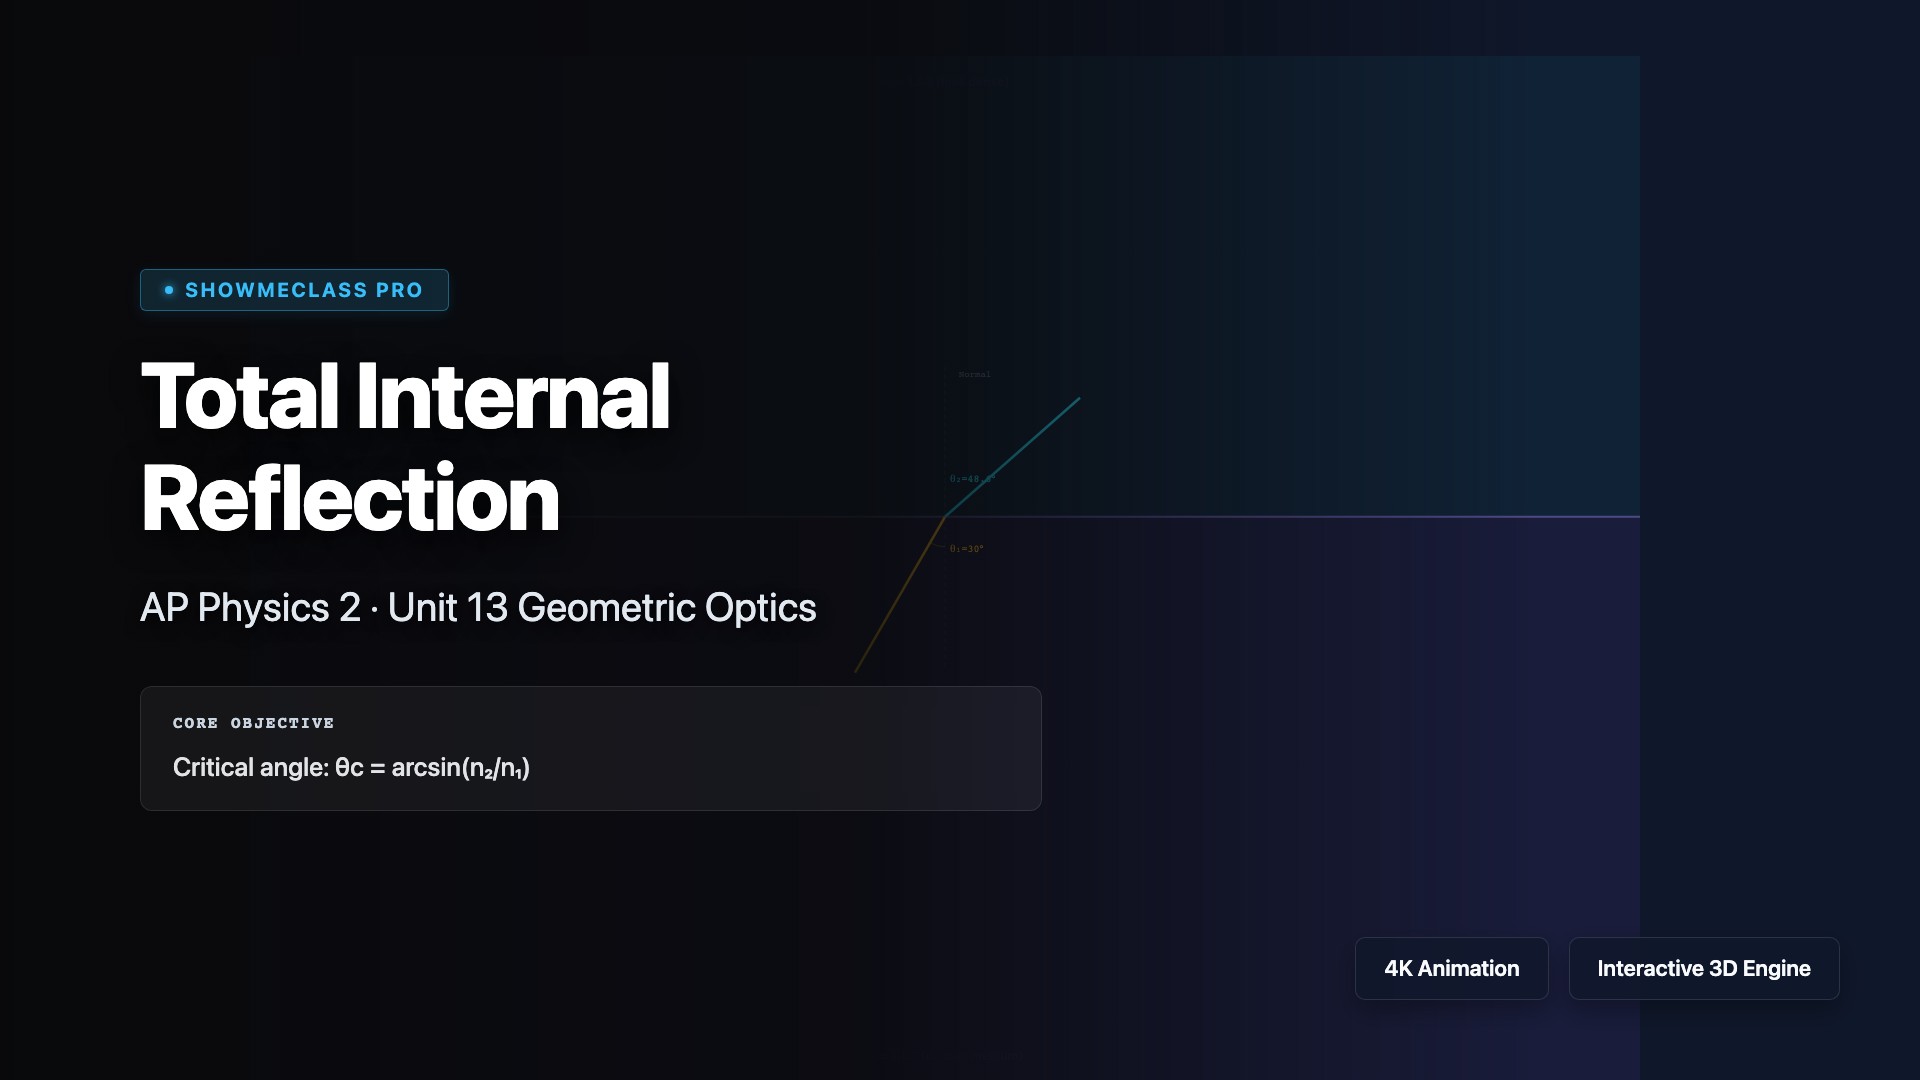
Total Internal Reflection & Fiber Optics
Adjust angle of incidence and refractive indices to observe total internal reflection. Critical angle θc = arcsin(n₂/n₁). Snell's Law visualization.
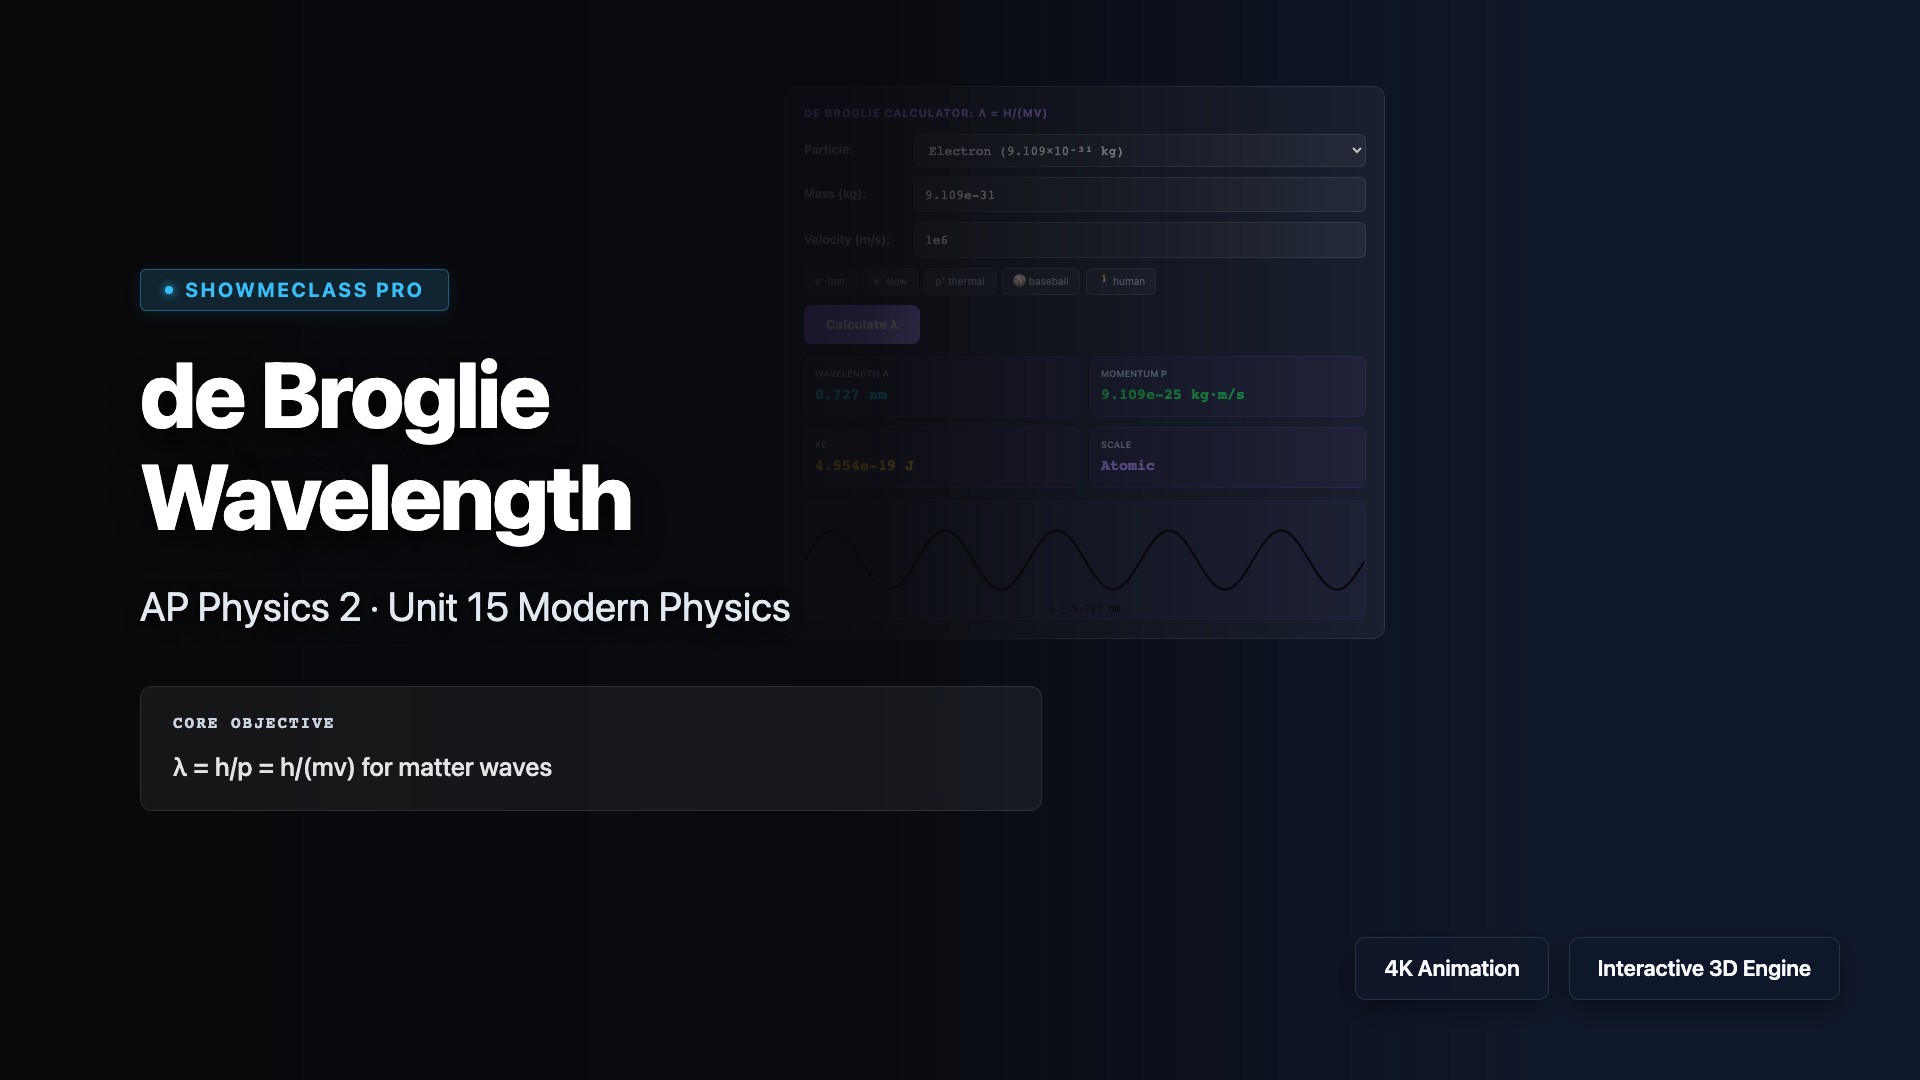
de Broglie Wavelength Calculator
Calculate matter wave wavelength λ = h/(mv). Presets for electron, proton, baseball, and human. Shows scale comparison and wave visualization.

Radioactive Decay Chain (U-238 → Pb-206)
Complete U-238 decay series to stable Pb-206 with 14 steps. Shows α/β⁻ decay type, mass/atomic number changes, and half-lives.
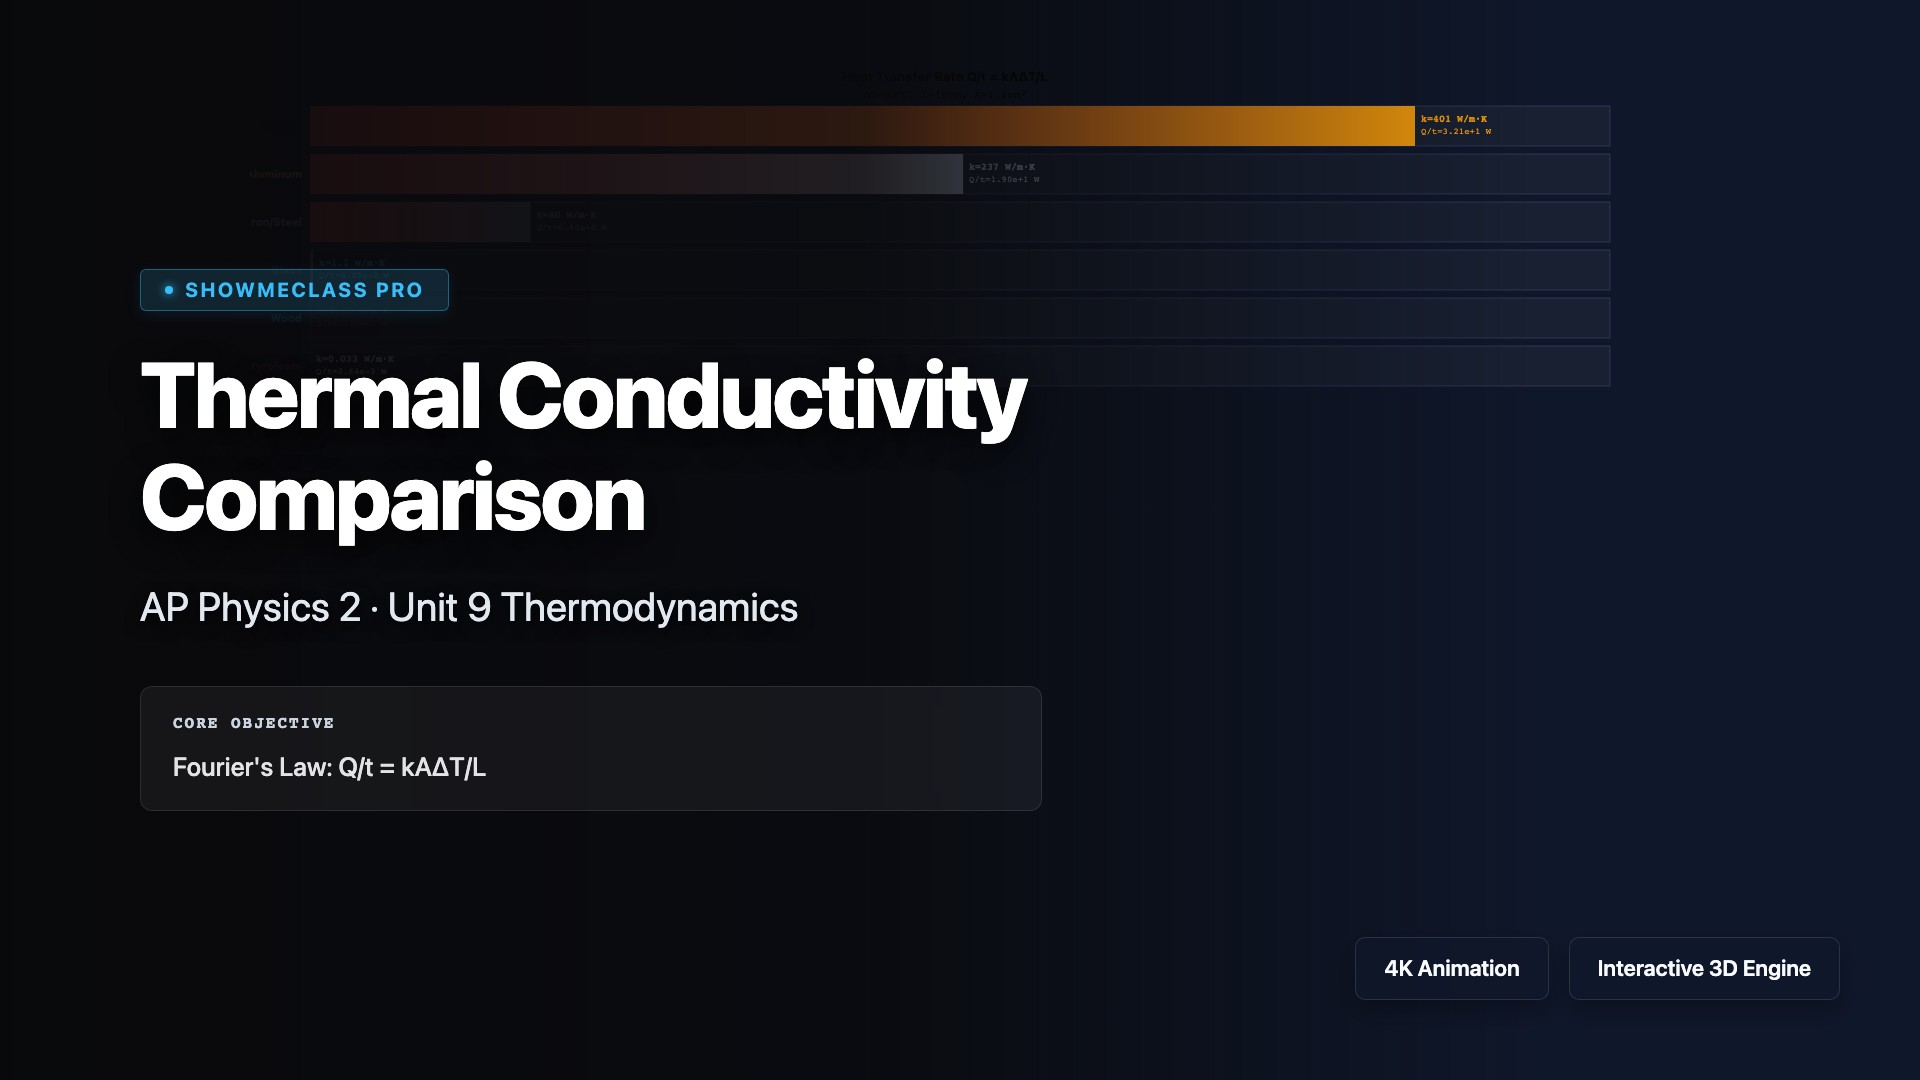
Thermal Conductivity Comparison
Compare heat transfer rates of 6 materials (copper to styrofoam) using Fourier's Law Q/t = kAΔT/L. Adjustable temperature, length, and area.
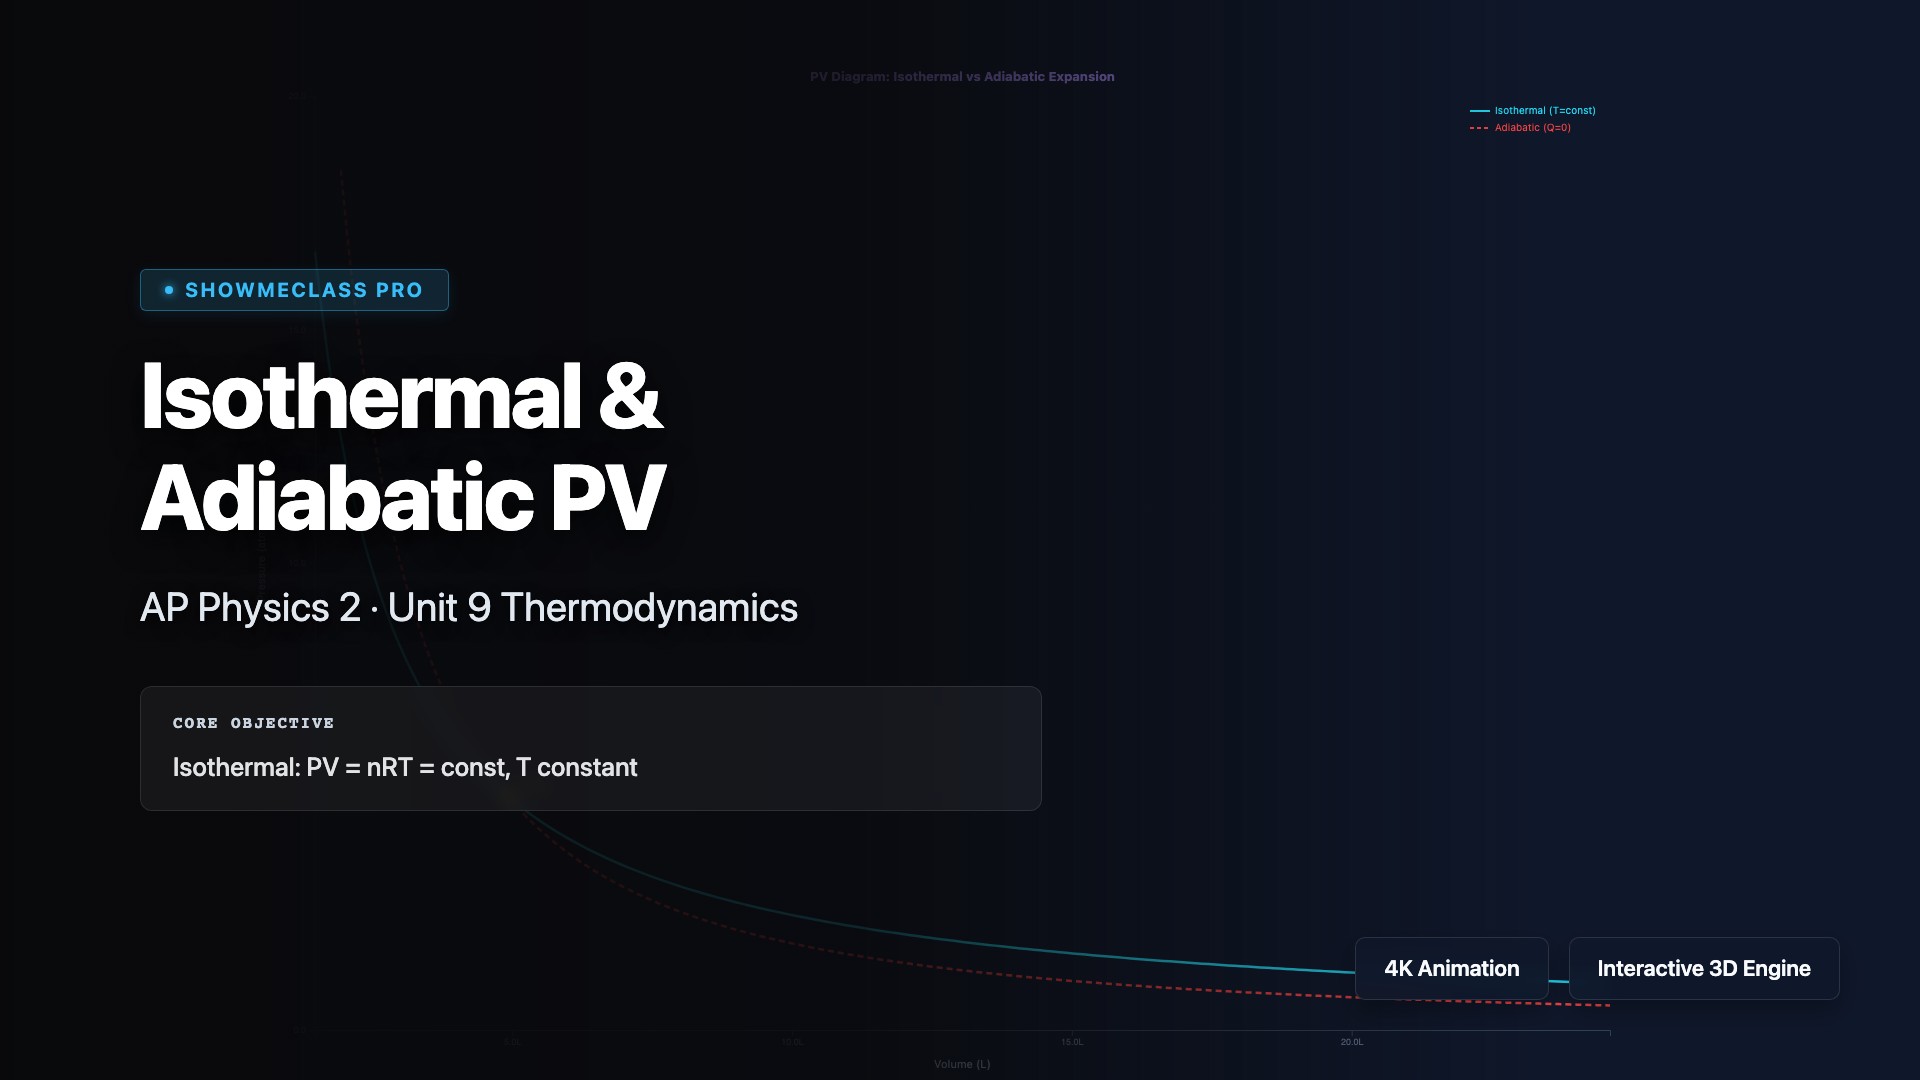
Isothermal & Adiabatic PV Processes
PV diagram overlay of isothermal (PV=nRT) and adiabatic (PVᵞ=const) processes. Compare curve steepness and work done for expansion.
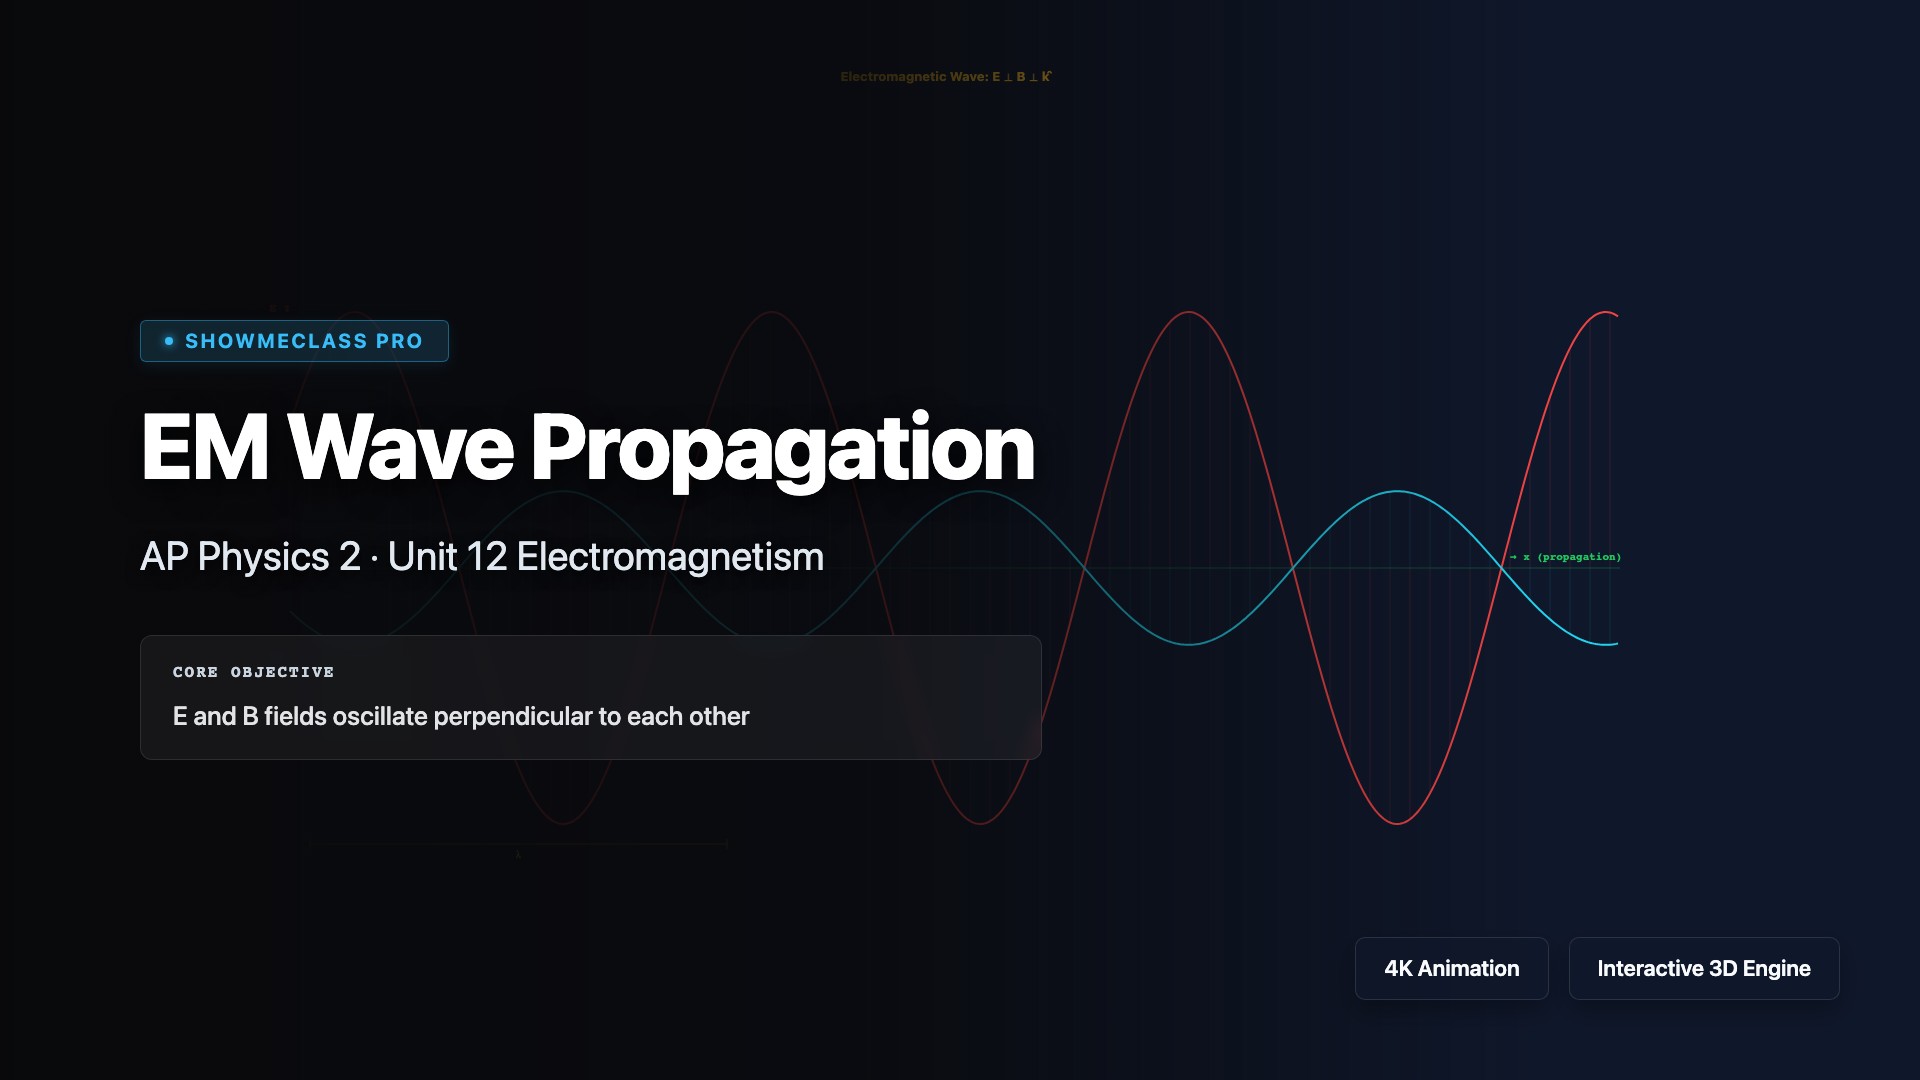
Electromagnetic Wave Propagation
Animated EM wave with perpendicular E and B field oscillation. Adjustable frequency, amplitude, and propagation speed with wavelength marker.
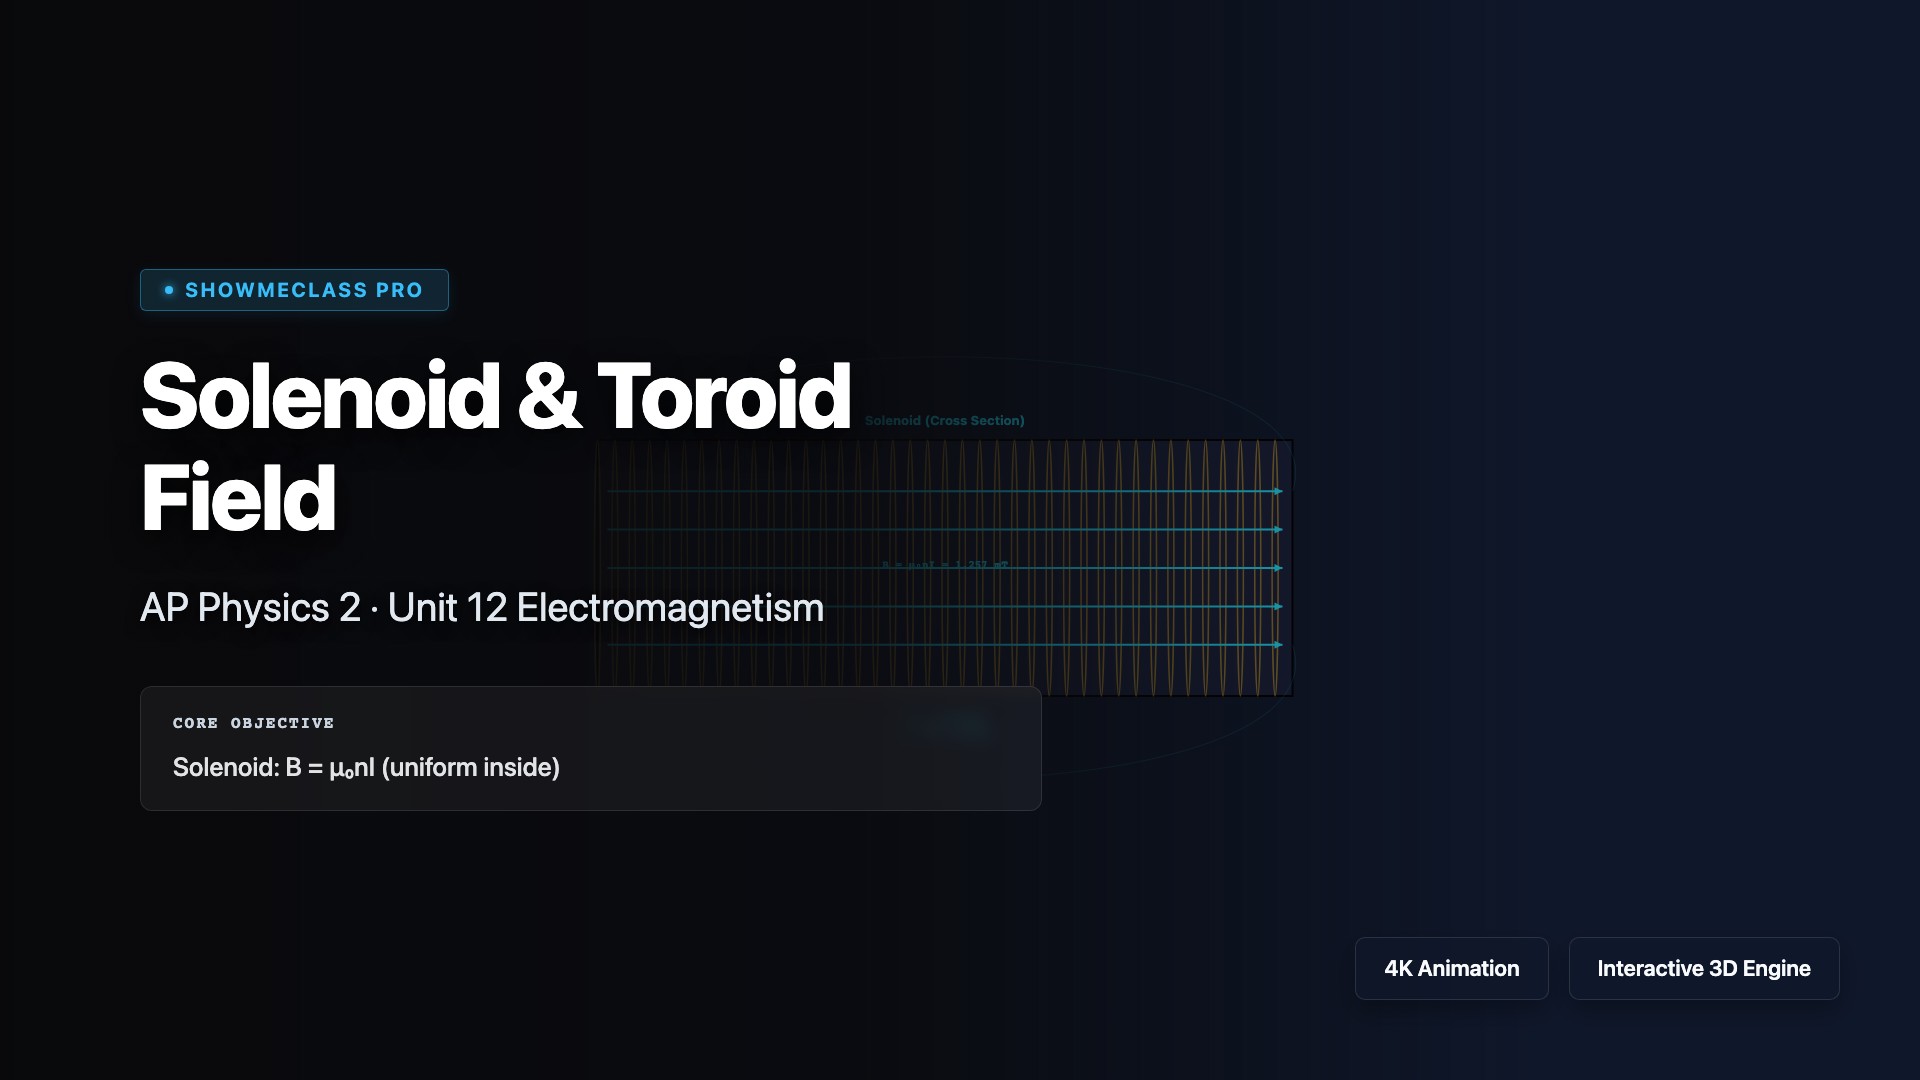
Solenoid & Toroid Magnetic Field
Visualize magnetic field inside solenoid (B=μ₀nI) and toroid (B=μ₀NI/2πr). Shows coil turns, field lines, and B=0 outside.
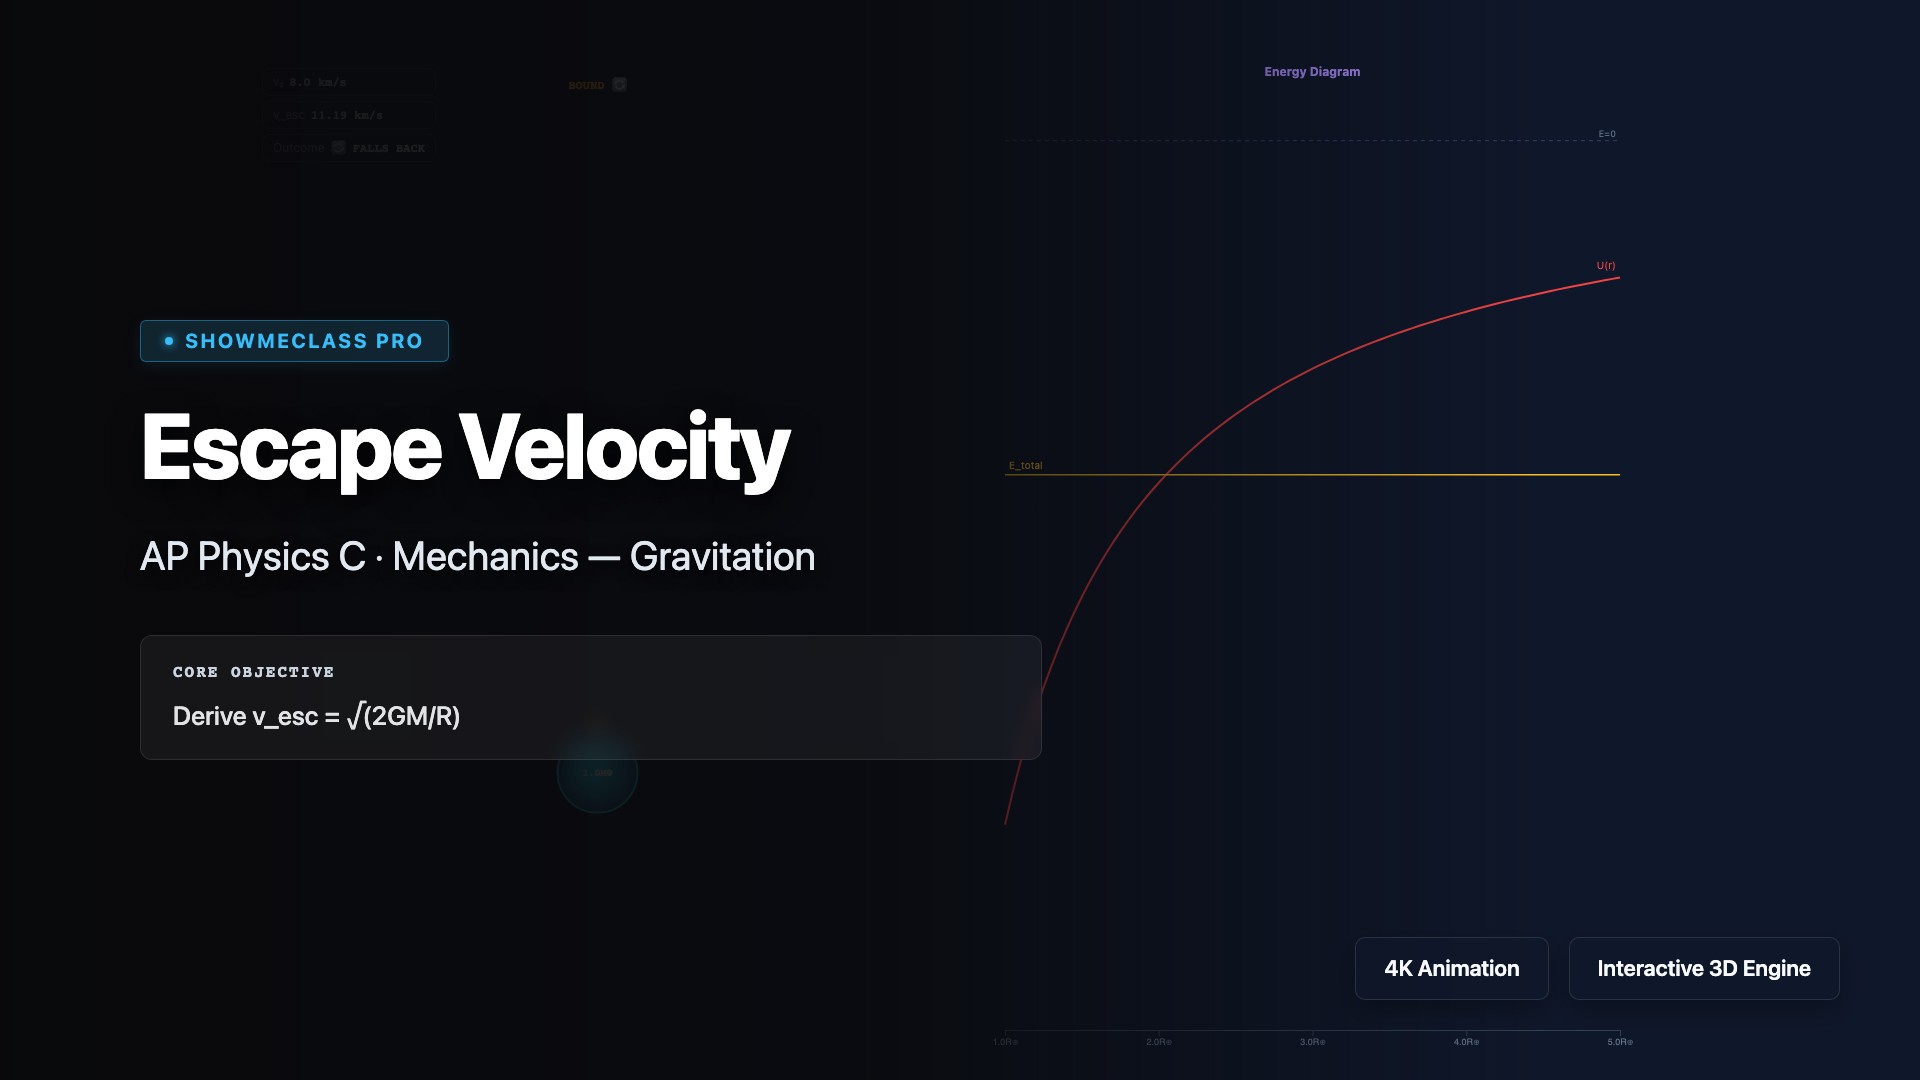
Escape Velocity & Gravitational Binding
Launch a projectile and see whether it escapes or falls back. Energy diagram shows U(r) vs total energy. Compare escape velocities of Earth, Mars, Jupiter, and Moon.

Chi-Square Goodness of Fit
Calculate and visualize the Chi-Square test statistic. Compare expected vs observed dice rolls across categories and plot how deviations force the P-value into the rejection region.
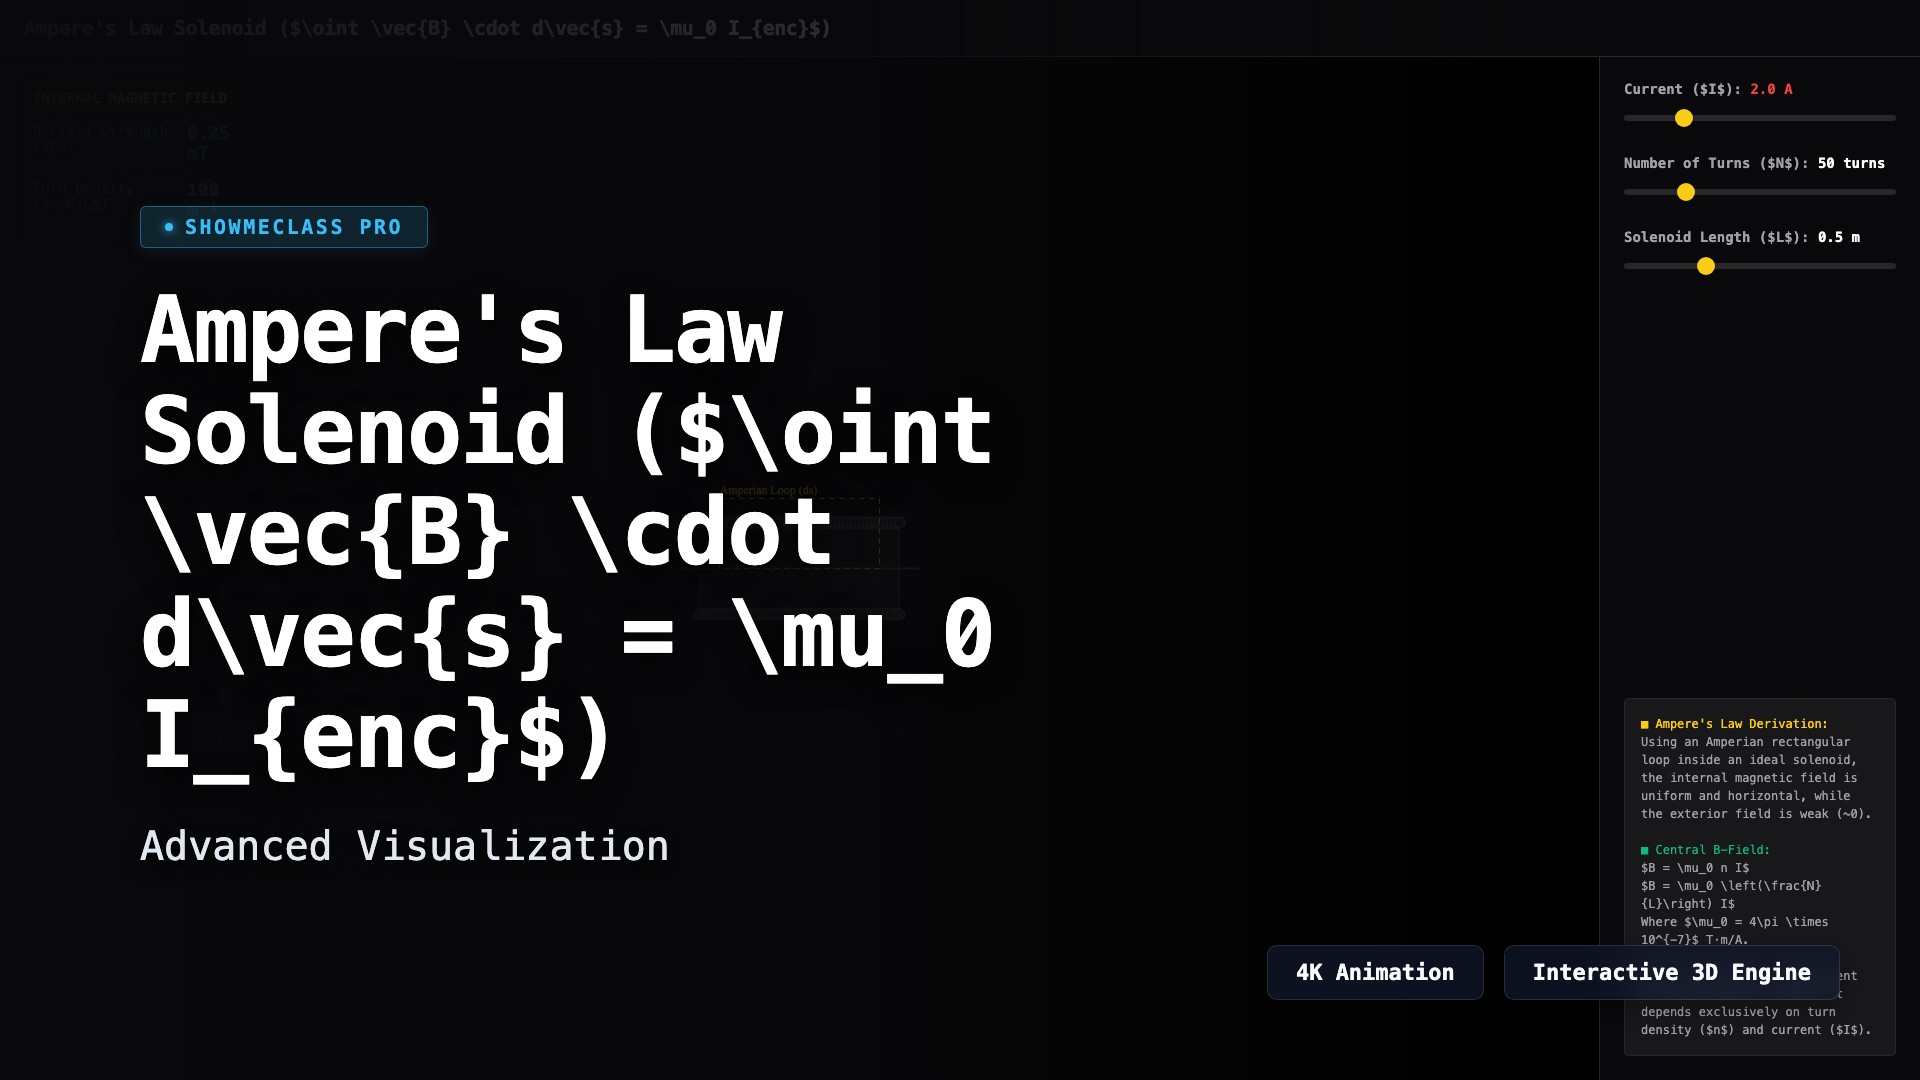
Ampere's Law Solenoid Constructor
Construct an ideal solenoid and visualize the uniform internal magnetic field utilizing Ampere's Law. Adjust current I, solenoid length L, and turn count N to map B-field intensity.