Showing 12 results
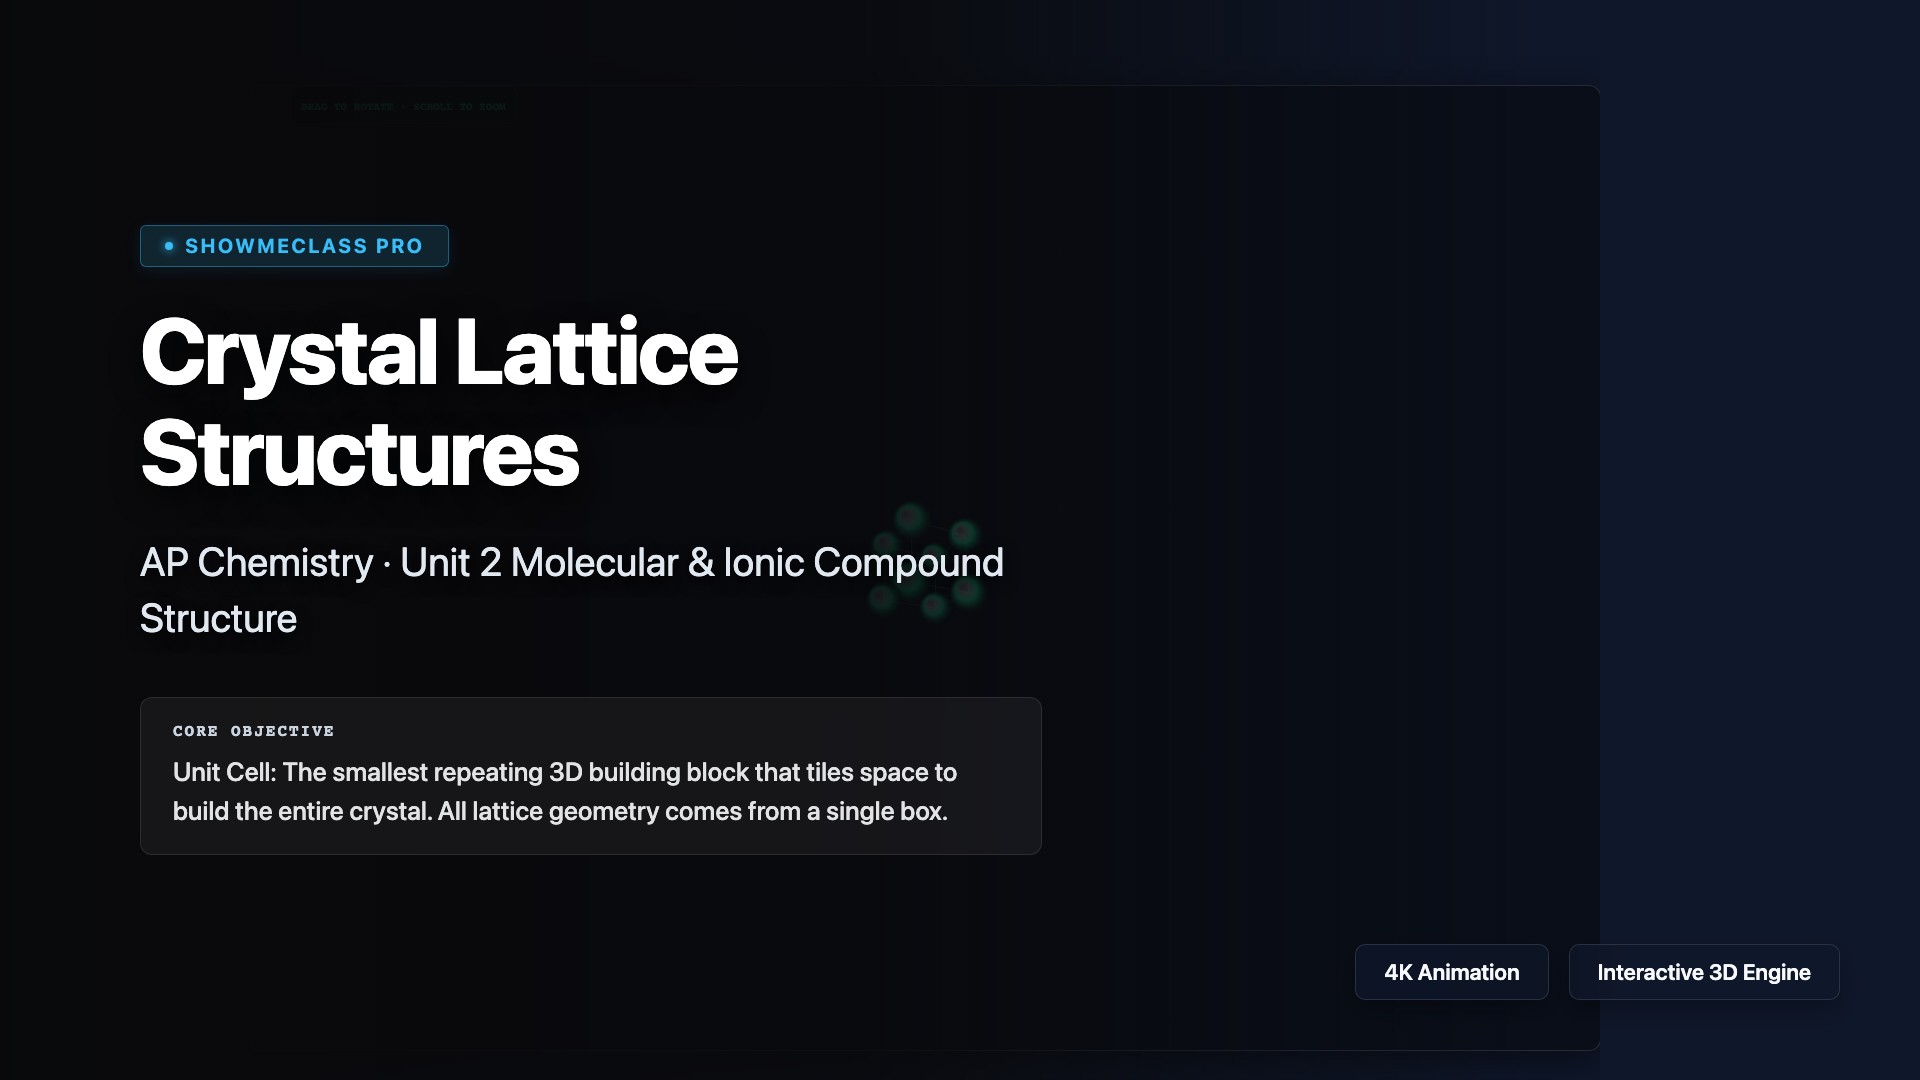
Crystal Lattice Structures (FCC/BCC/HCP)
3D rotatable crystal lattice visualizer for SC/BCC/FCC/HCP unit cells. Demonstrates atom-sharing fractions (corner ×1/8, face ×1/2, body ×1), packing efficiency percentages, coordination numbers, and edge-to-radius geometric relationships interactively.
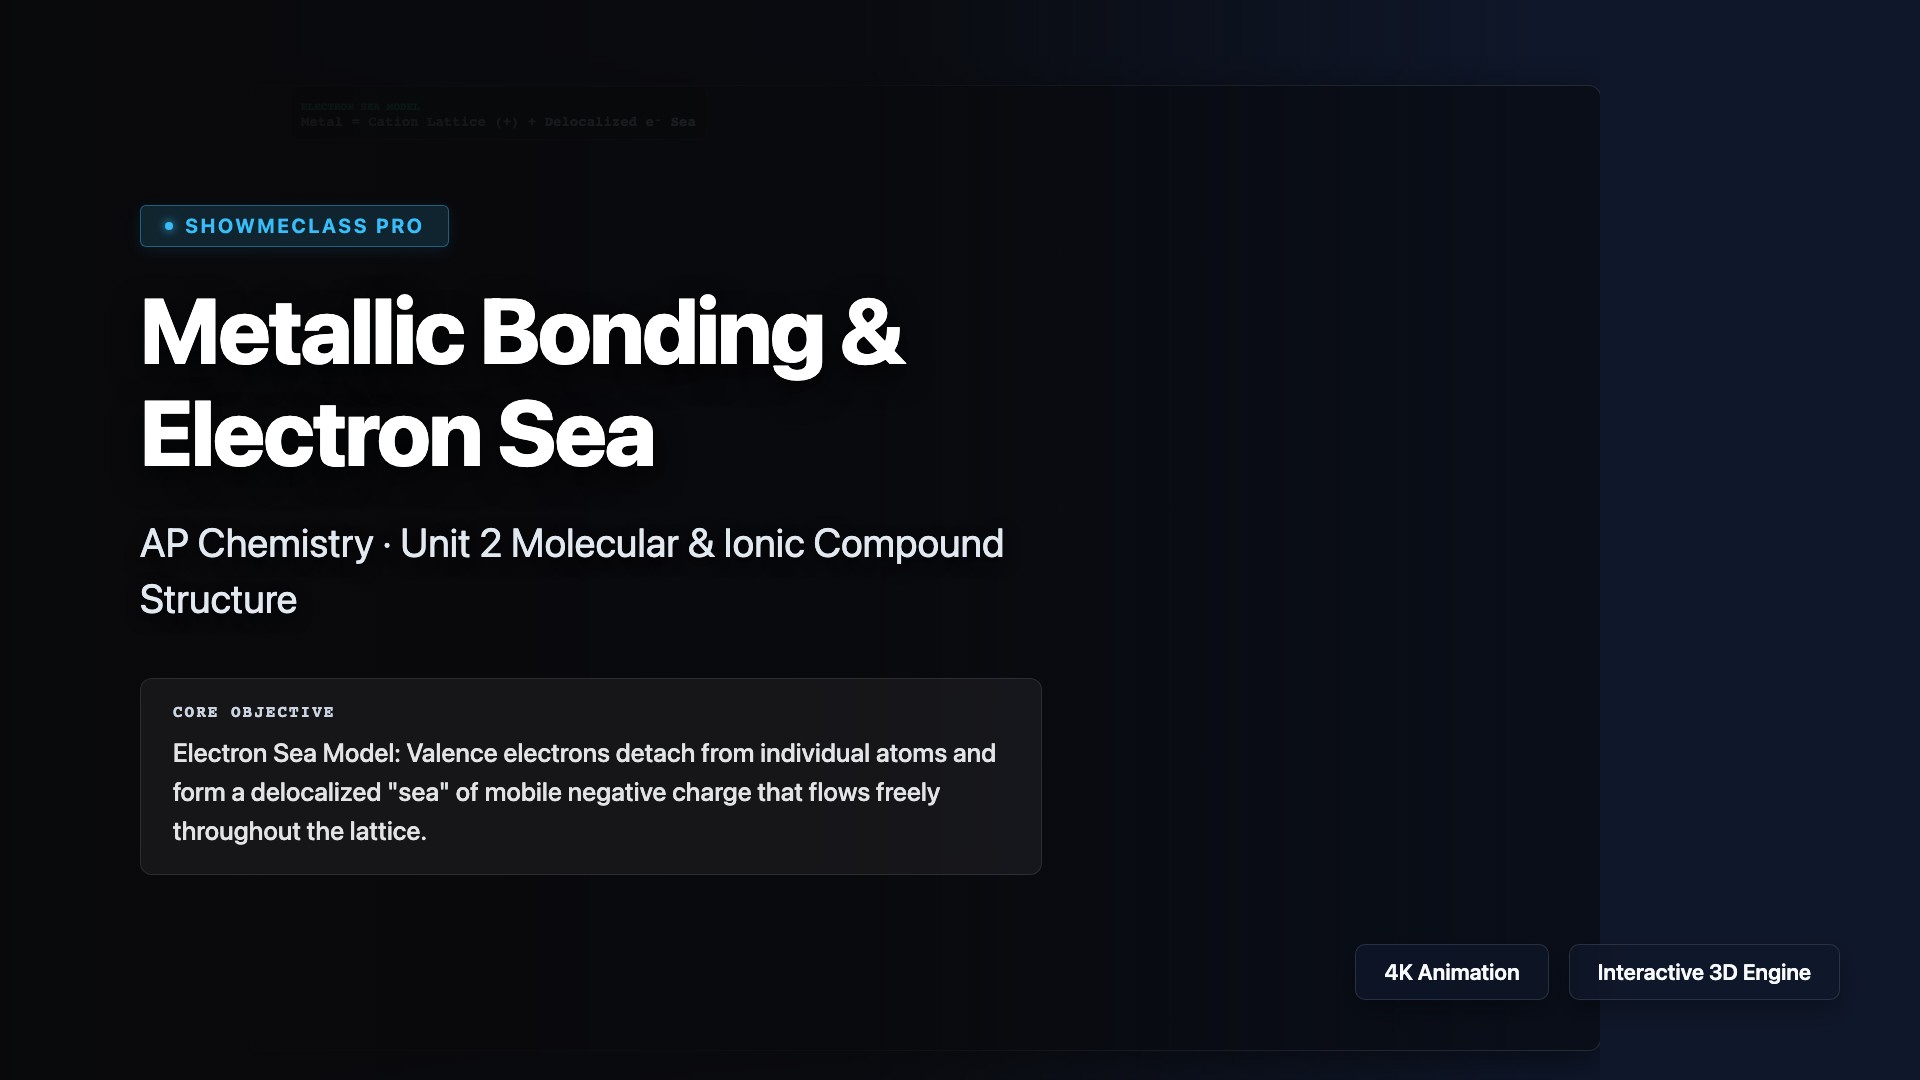
Metallic Bonding & Electron Sea Model
Animated electron sea model showing delocalized valence electrons flowing randomly through a vibrating cation lattice. Applying voltage reveals directional drift current emerging from thermal chaos, explaining metallic conductivity at the atomic level.
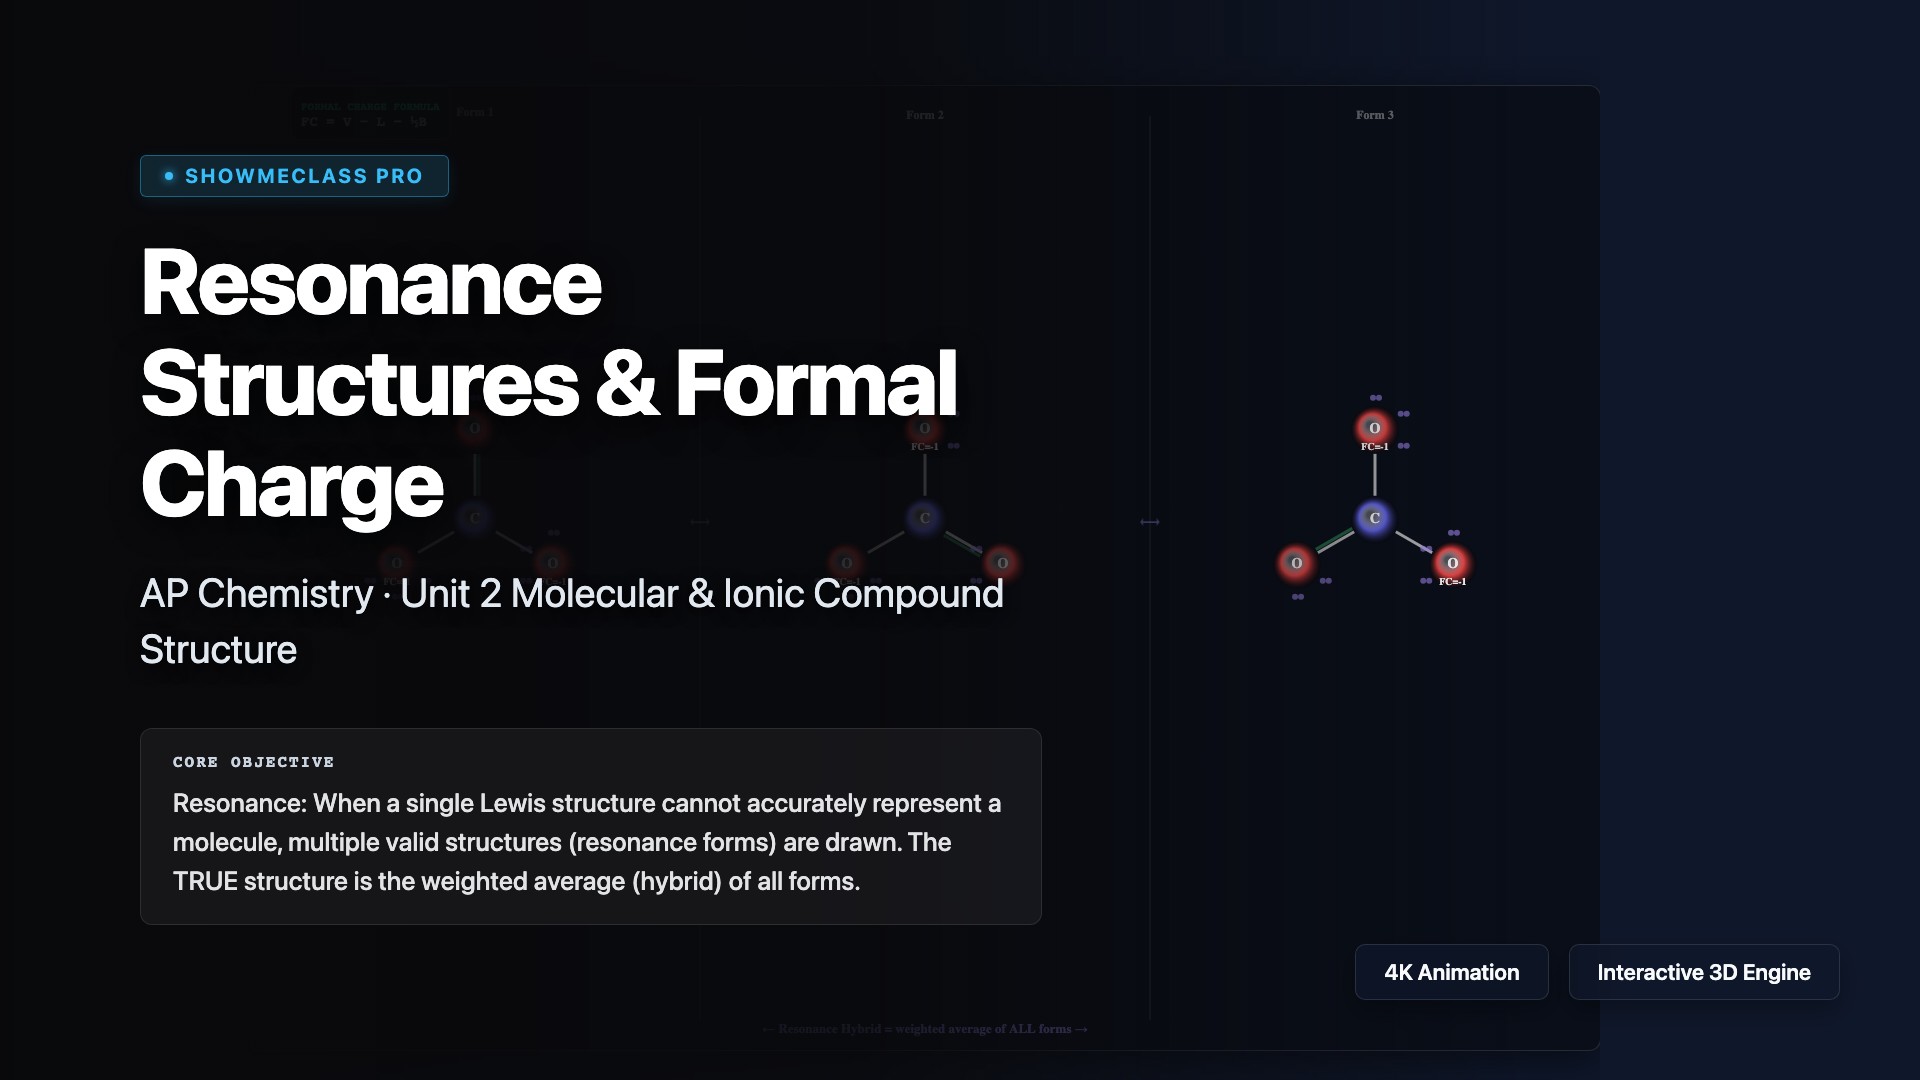
Resonance Structures & Formal Charge
Interactive resonance structure visualizer for CO₃²⁻, NO₃⁻, O₃, benzene, and SO₄²⁻. Displays formal charge calculations (FC = V − L − ½B), fractional bond orders, and electron delocalization across multiple equivalent resonance forms simultaneously.
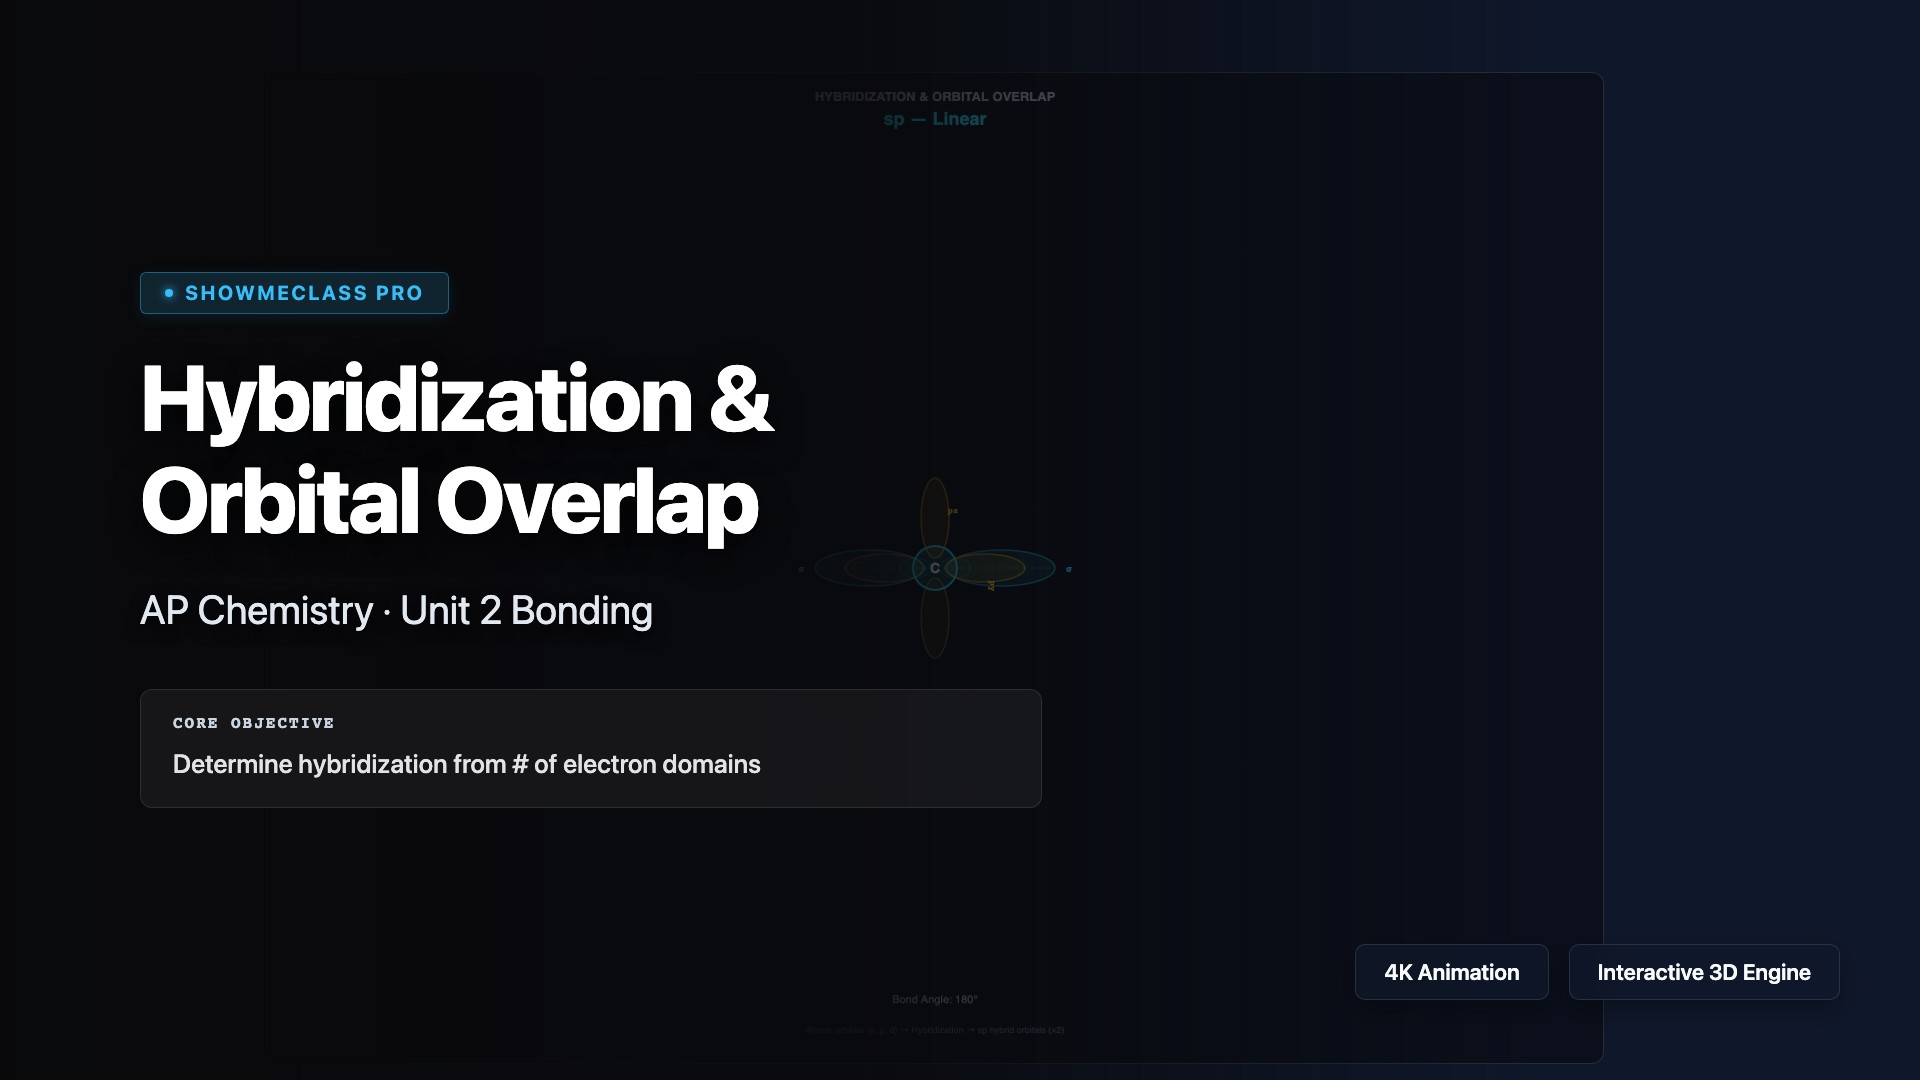
Hybridization & Orbital Overlap
Interactive visualization of sp, sp², sp³, sp³d, sp³d² hybridization with orbital lobe diagrams, sigma/pi bond distinction, bond angles, and molecular geometry examples. Select hybridization types to see electron domain arrangement and unhybridized p orbitals available for pi bonding.
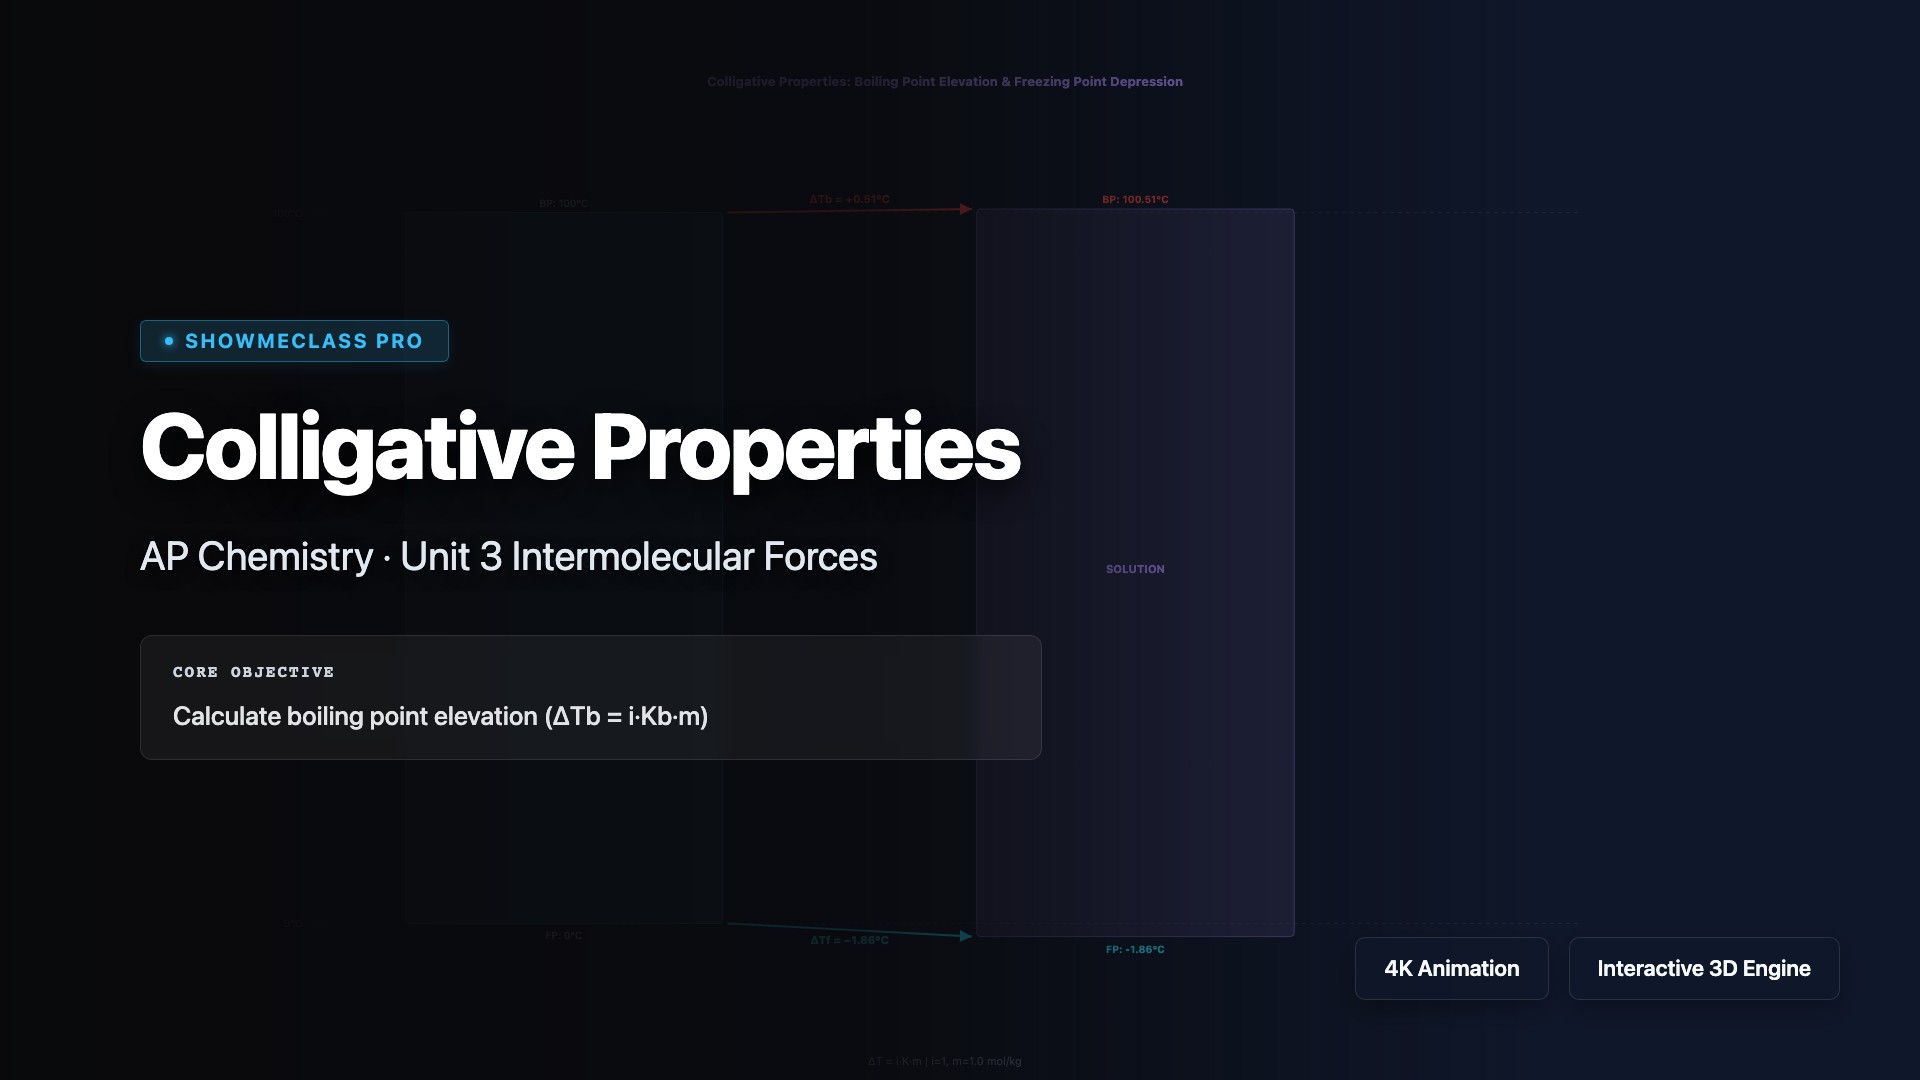
Colligative Properties Calculator
Calculate boiling point elevation (ΔTb = iKbm) and freezing point depression (ΔTf = iKfm) with interactive sliders. Visualize the temperature range expansion of solutions versus pure solvent. Adjustable van't Hoff factor for electrolytes and osmotic pressure calculation.
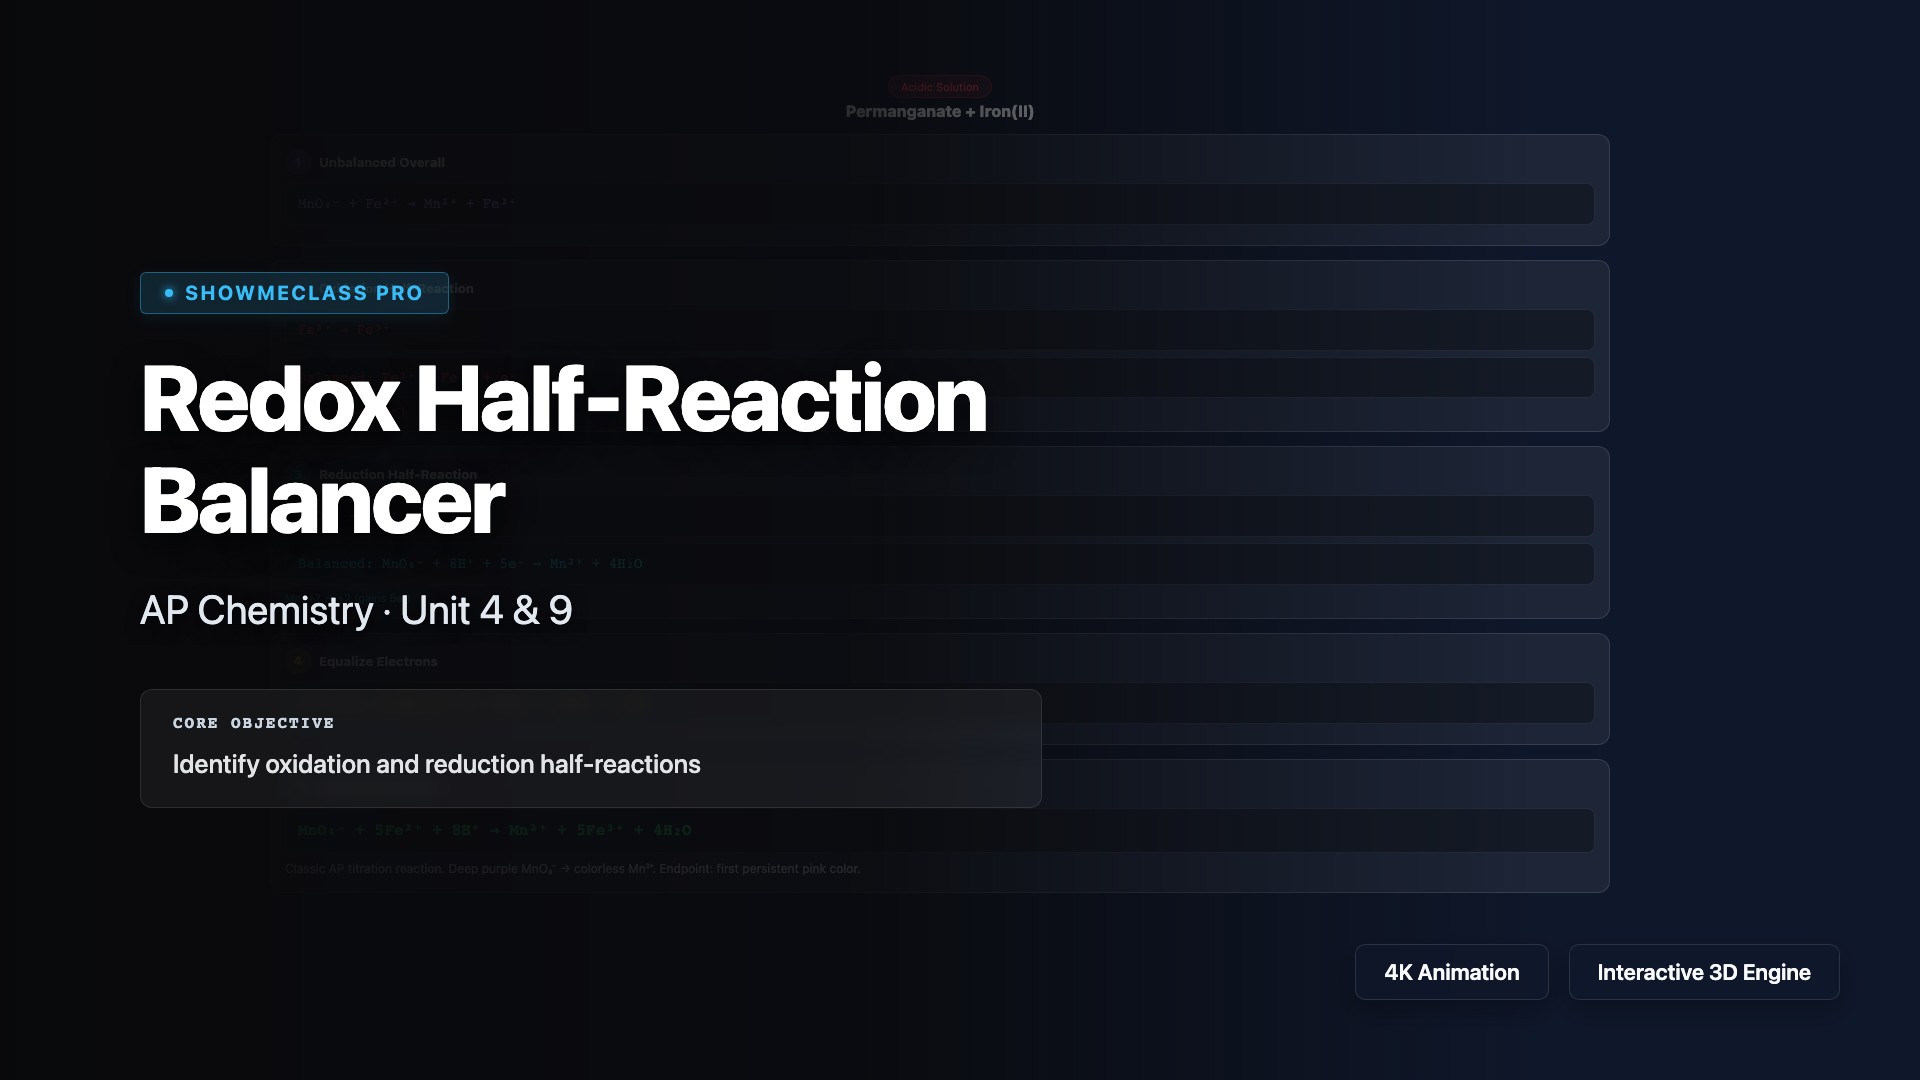
Redox Half-Reaction Balancer
Step-by-step balancing of redox half-reactions in acidic and basic solutions. Features 5 classic reactions (MnO₄⁻/Fe²⁺, Cr₂O₇²⁻/I⁻, Cu/NO₃⁻, Zn/MnO₄⁻, Sn²⁺/IO₃⁻) with oxidation state tracking, electron equalization, and detailed chemical explanations.
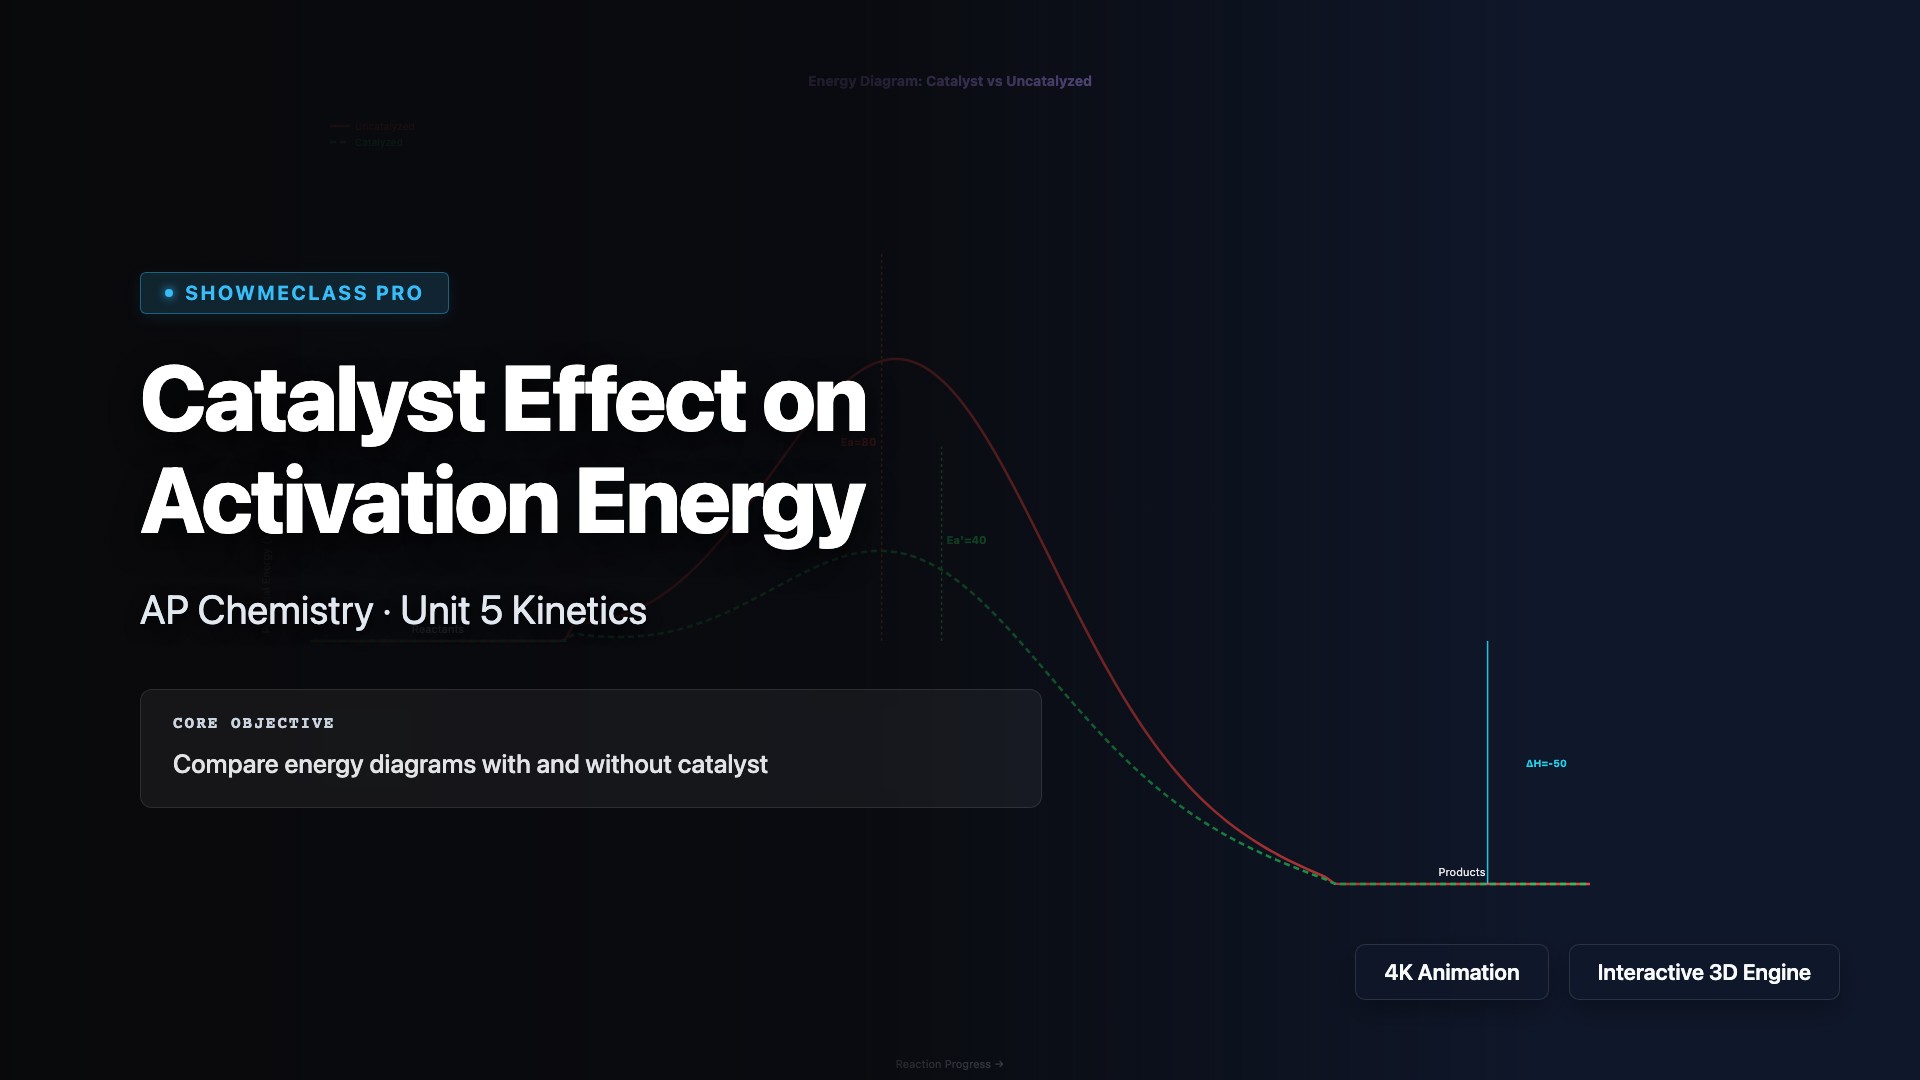
Catalyst Effect on Activation Energy
Interactive energy diagram comparing catalyzed vs uncatalyzed reaction pathways. Adjust activation energy, catalyzed Ea, and ΔH with real-time visualization. Calculates approximate speedup factor using Arrhenius equation. Covers homogeneous, heterogeneous, and enzyme catalysts.
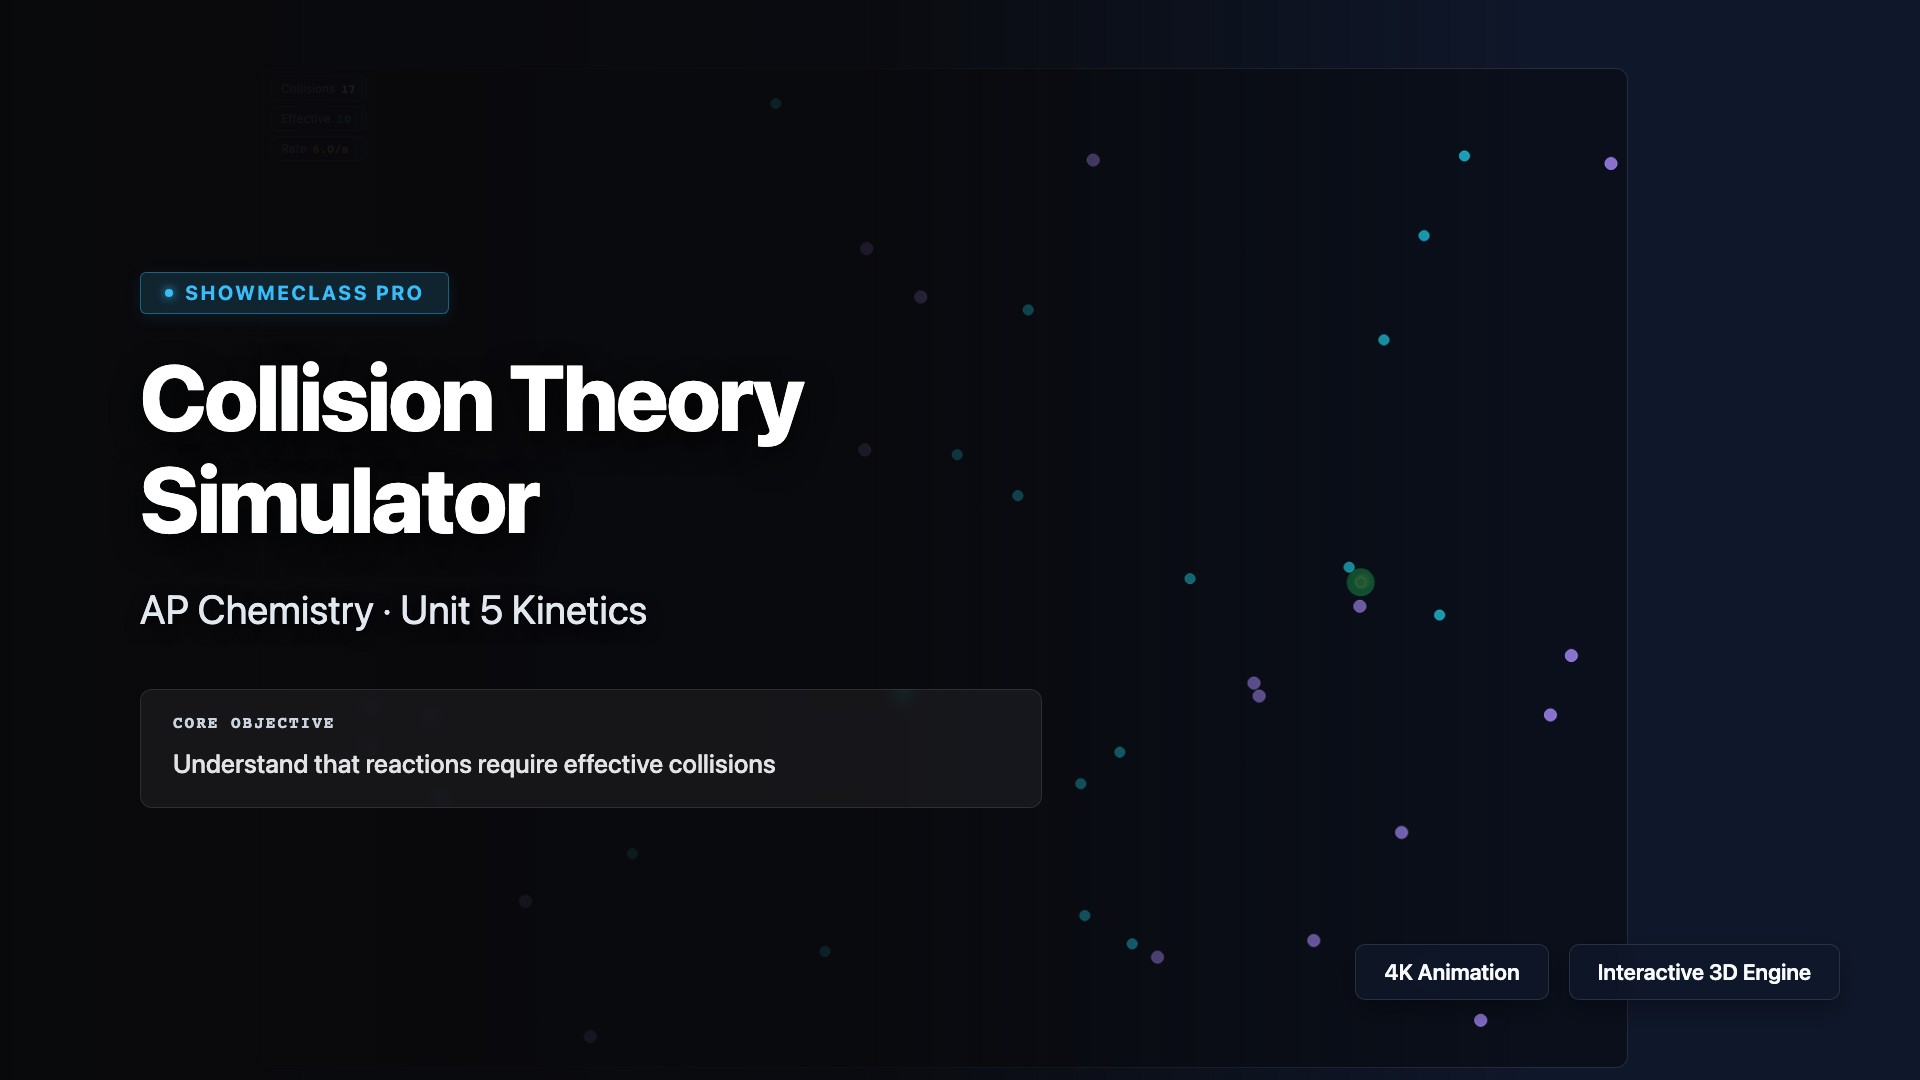
Collision Theory Particle Simulator
Animated particle simulation demonstrating collision theory. Particles of two types collide with visual feedback: green flashes for effective collisions (sufficient energy + correct orientation) and red flashes for ineffective ones. Adjustable temperature, particle count, and activation energy threshold.
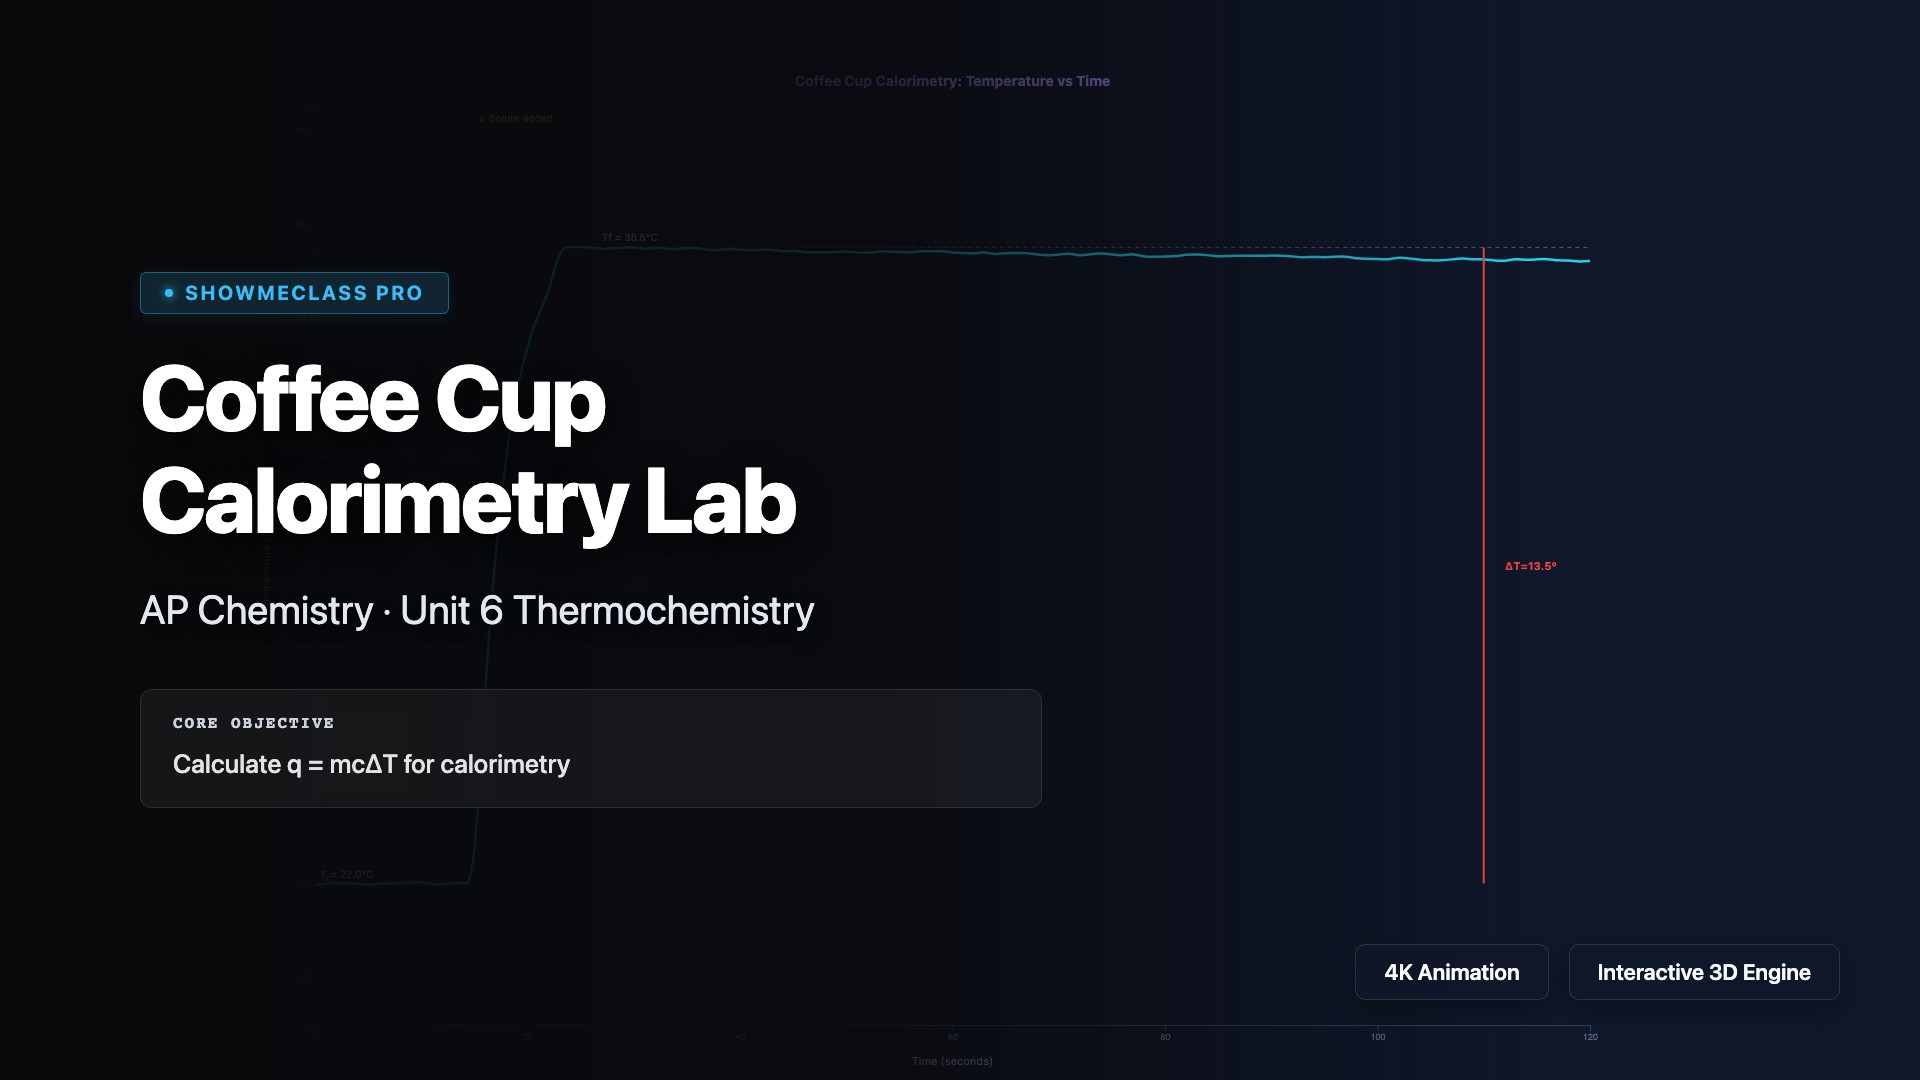
Coffee Cup Calorimetry Lab
Virtual coffee cup calorimetry lab with interactive temperature vs time graph. Calculate q=mcΔT, determine qrxn and ΔH from experimental data. Adjustable mass, initial/final temperature, and moles of solute. Automatically classifies reactions as exothermic or endothermic with step-by-step calculation display.
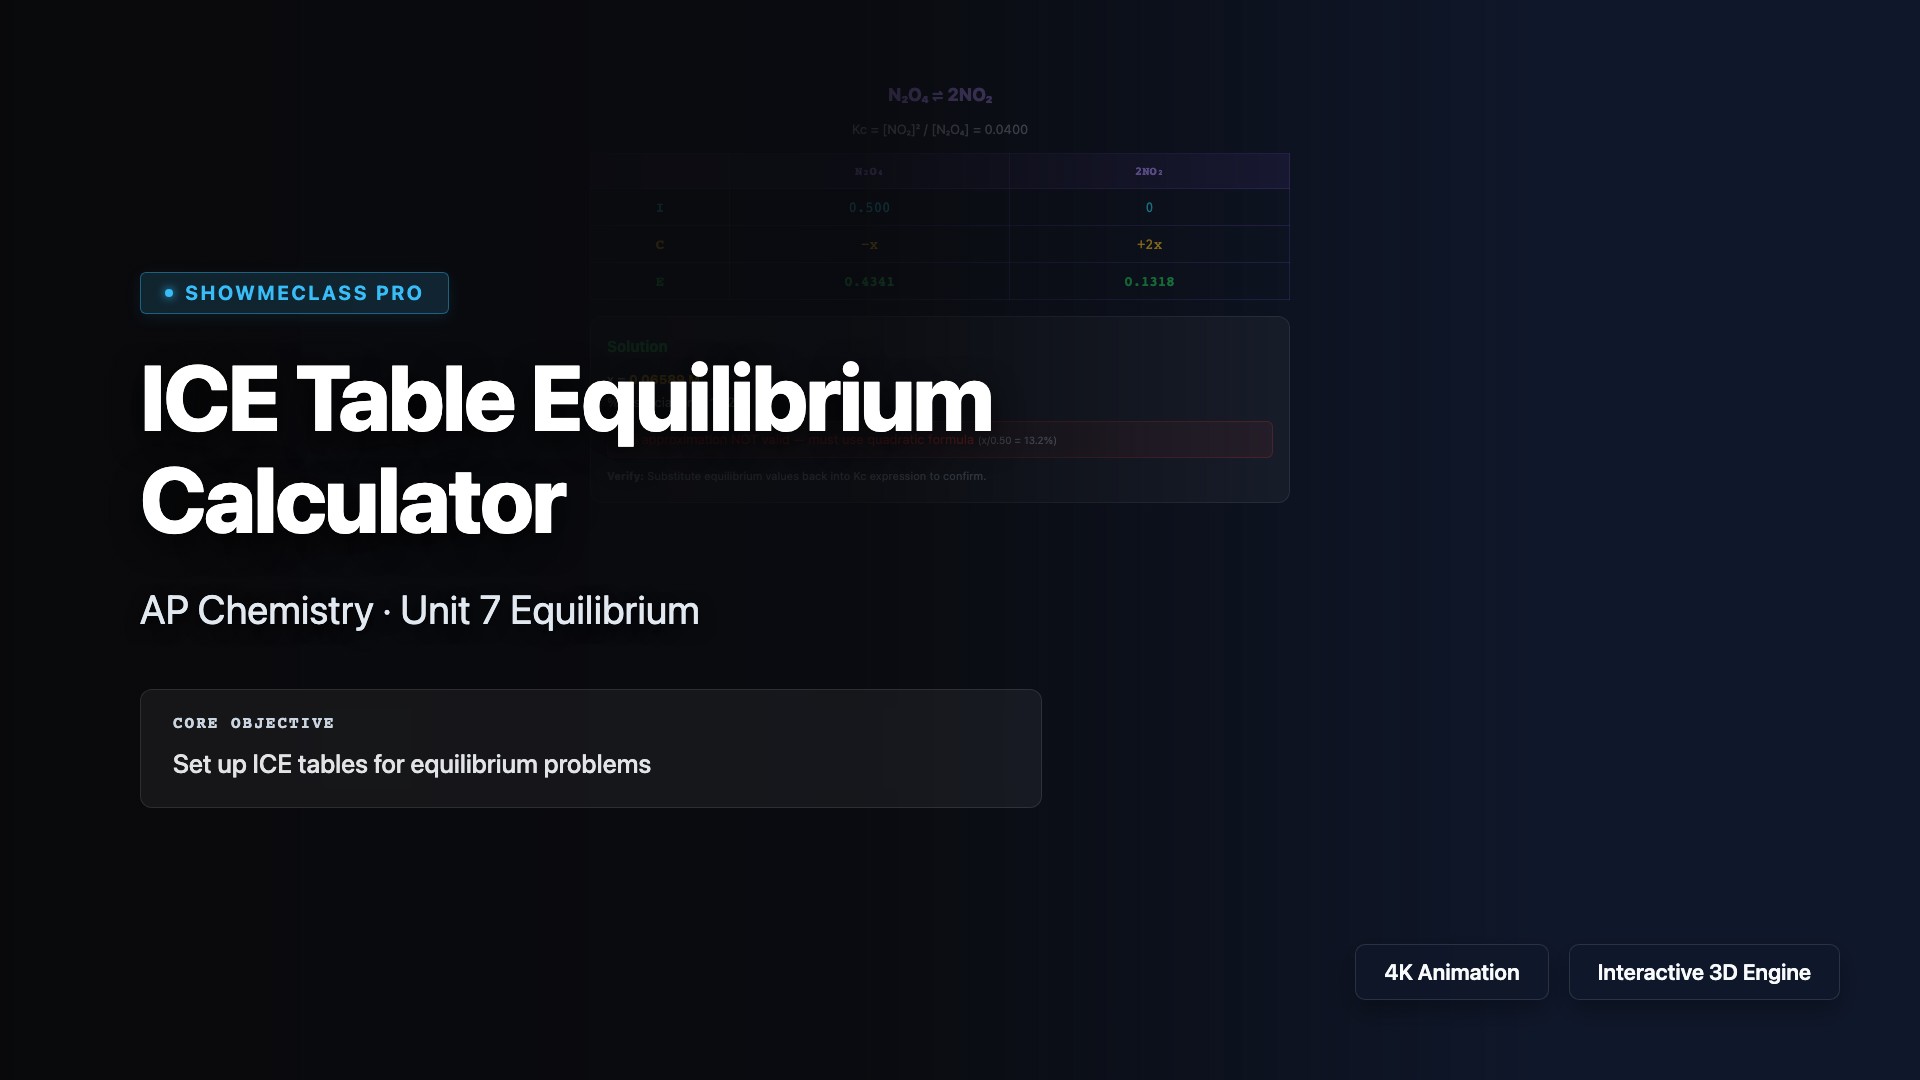
ICE Table Equilibrium Calculator
Step-by-step ICE table solver for 4 equilibrium reaction types (N₂O₄⇌2NO₂, H₂+I₂⇌2HI, PCl₅⇌PCl₃+Cl₂, CO+H₂O⇌CO₂+H₂). Adjustable Kc and initial concentration with automatic solving. Includes 5% approximation validity check and verification reminder.
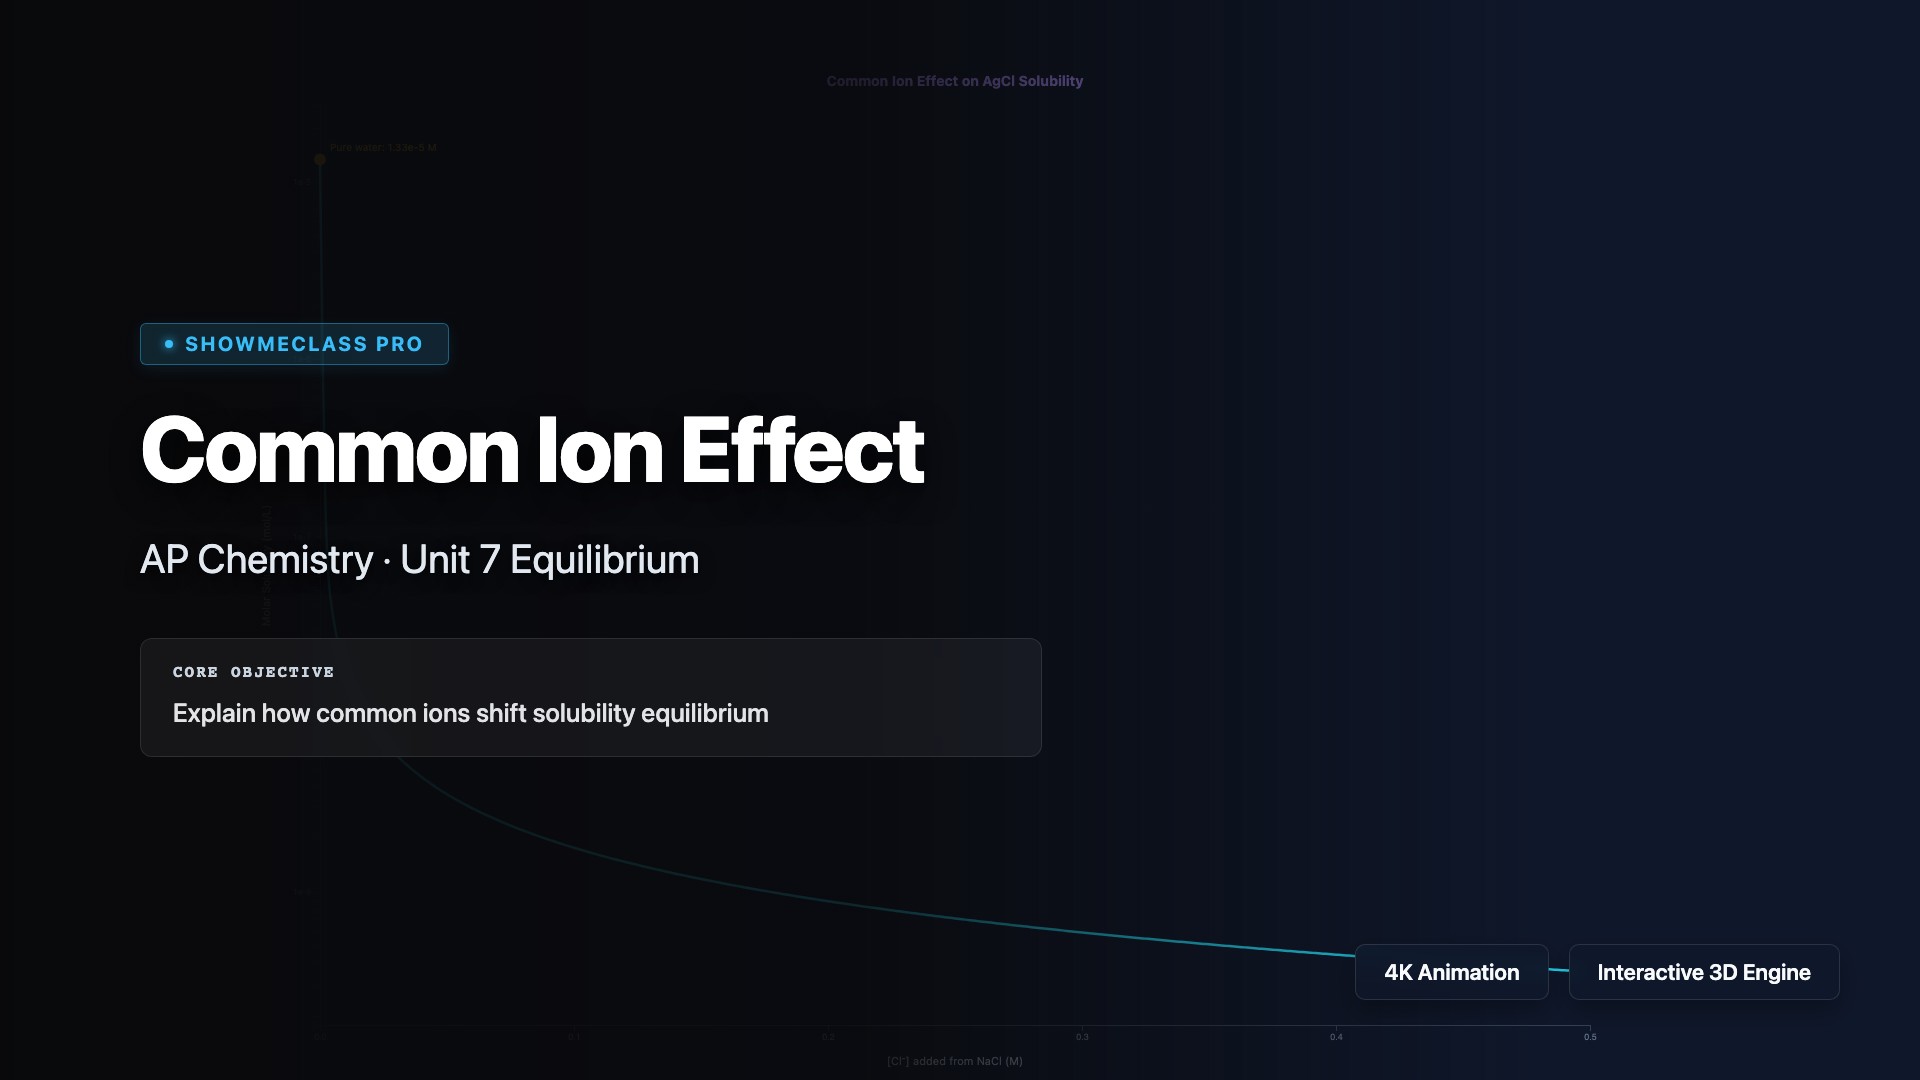
Common Ion Effect on Solubility
Interactive visualization of common ion effect on solubility for 4 salts (AgCl, PbCl₂, BaSO₄, CaF₂). Log-scale solubility vs common ion concentration graph with Le Chatelier's principle explanation. Shows dramatic solubility decrease with added common ion and percentage reduction calculation.
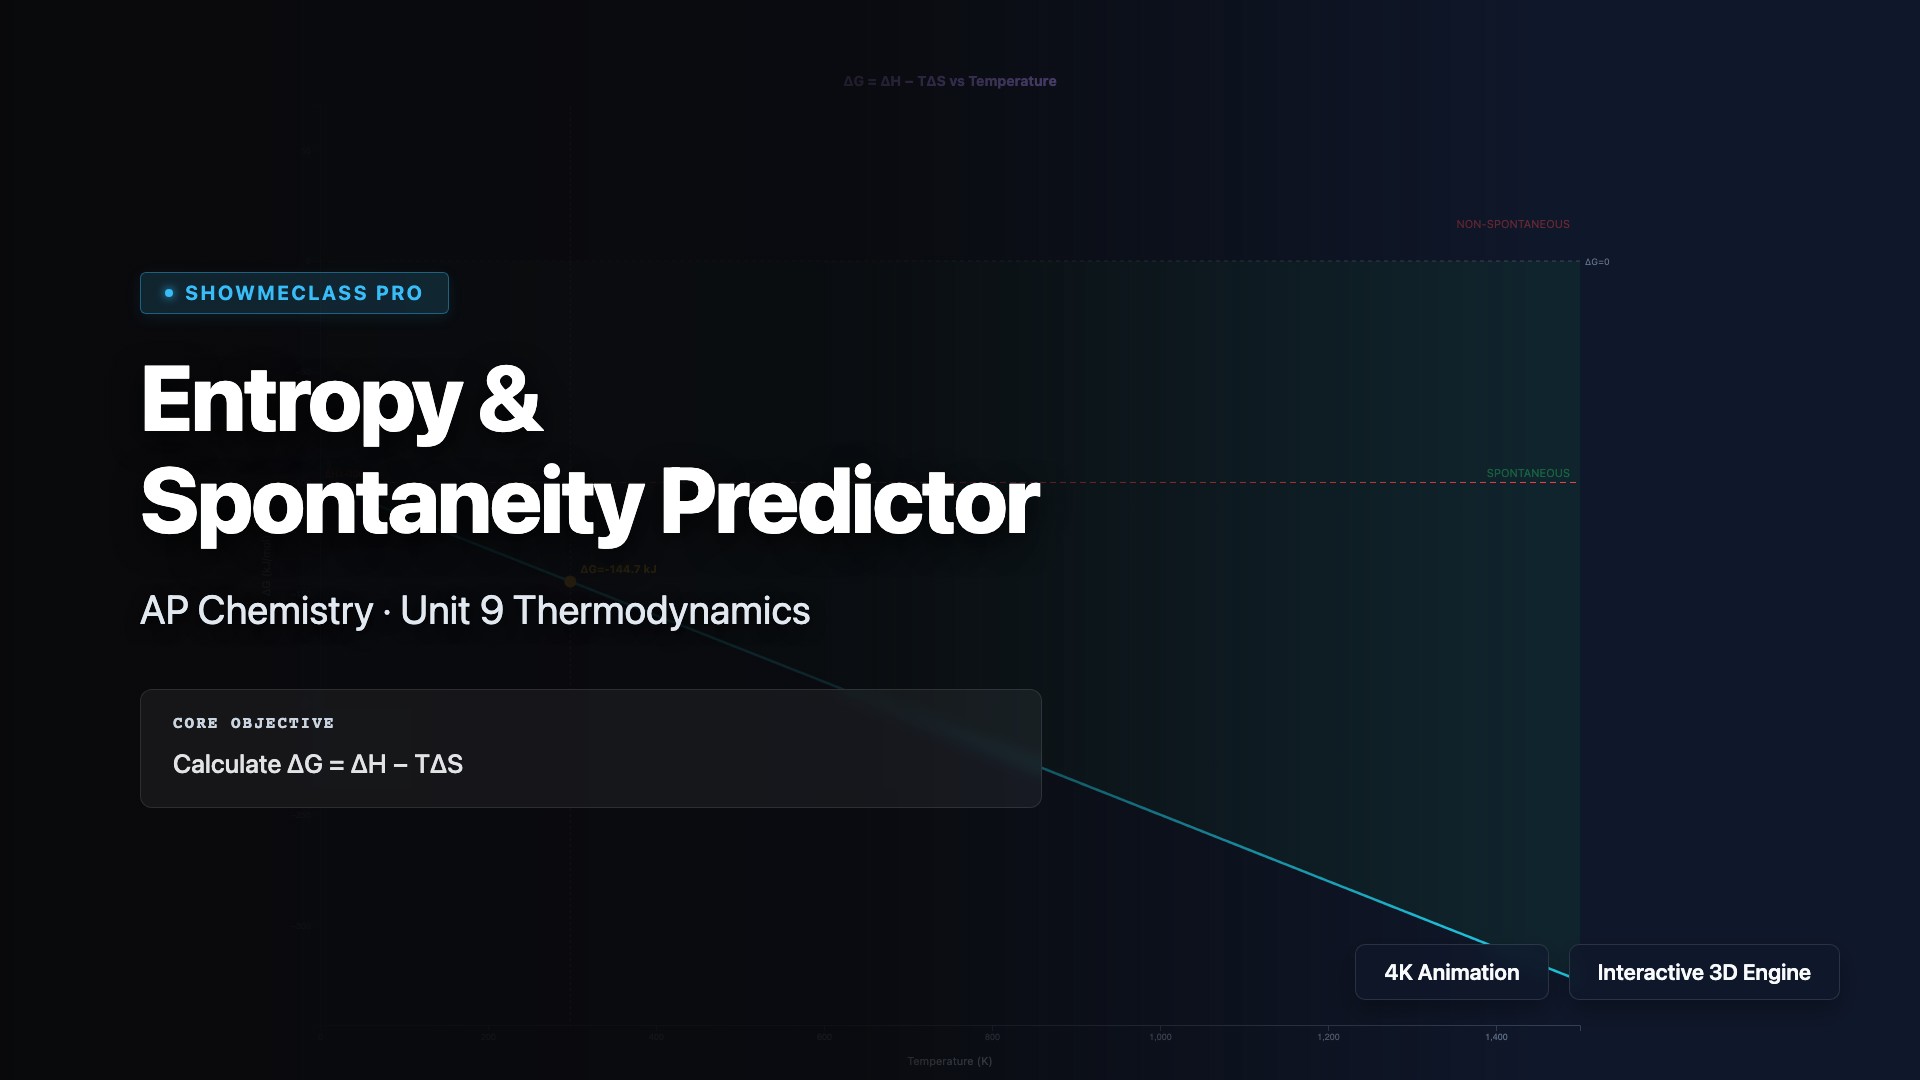
Entropy & Spontaneity Predictor
Interactive ΔG = ΔH − TΔS graph with adjustable enthalpy, entropy, and temperature. Visualizes Gibbs free energy vs temperature with spontaneous/non-spontaneous shading. Automatically determines crossover temperature and classifies into 4 ΔH/ΔS sign combinations with detailed explanations.