Showing 12 results
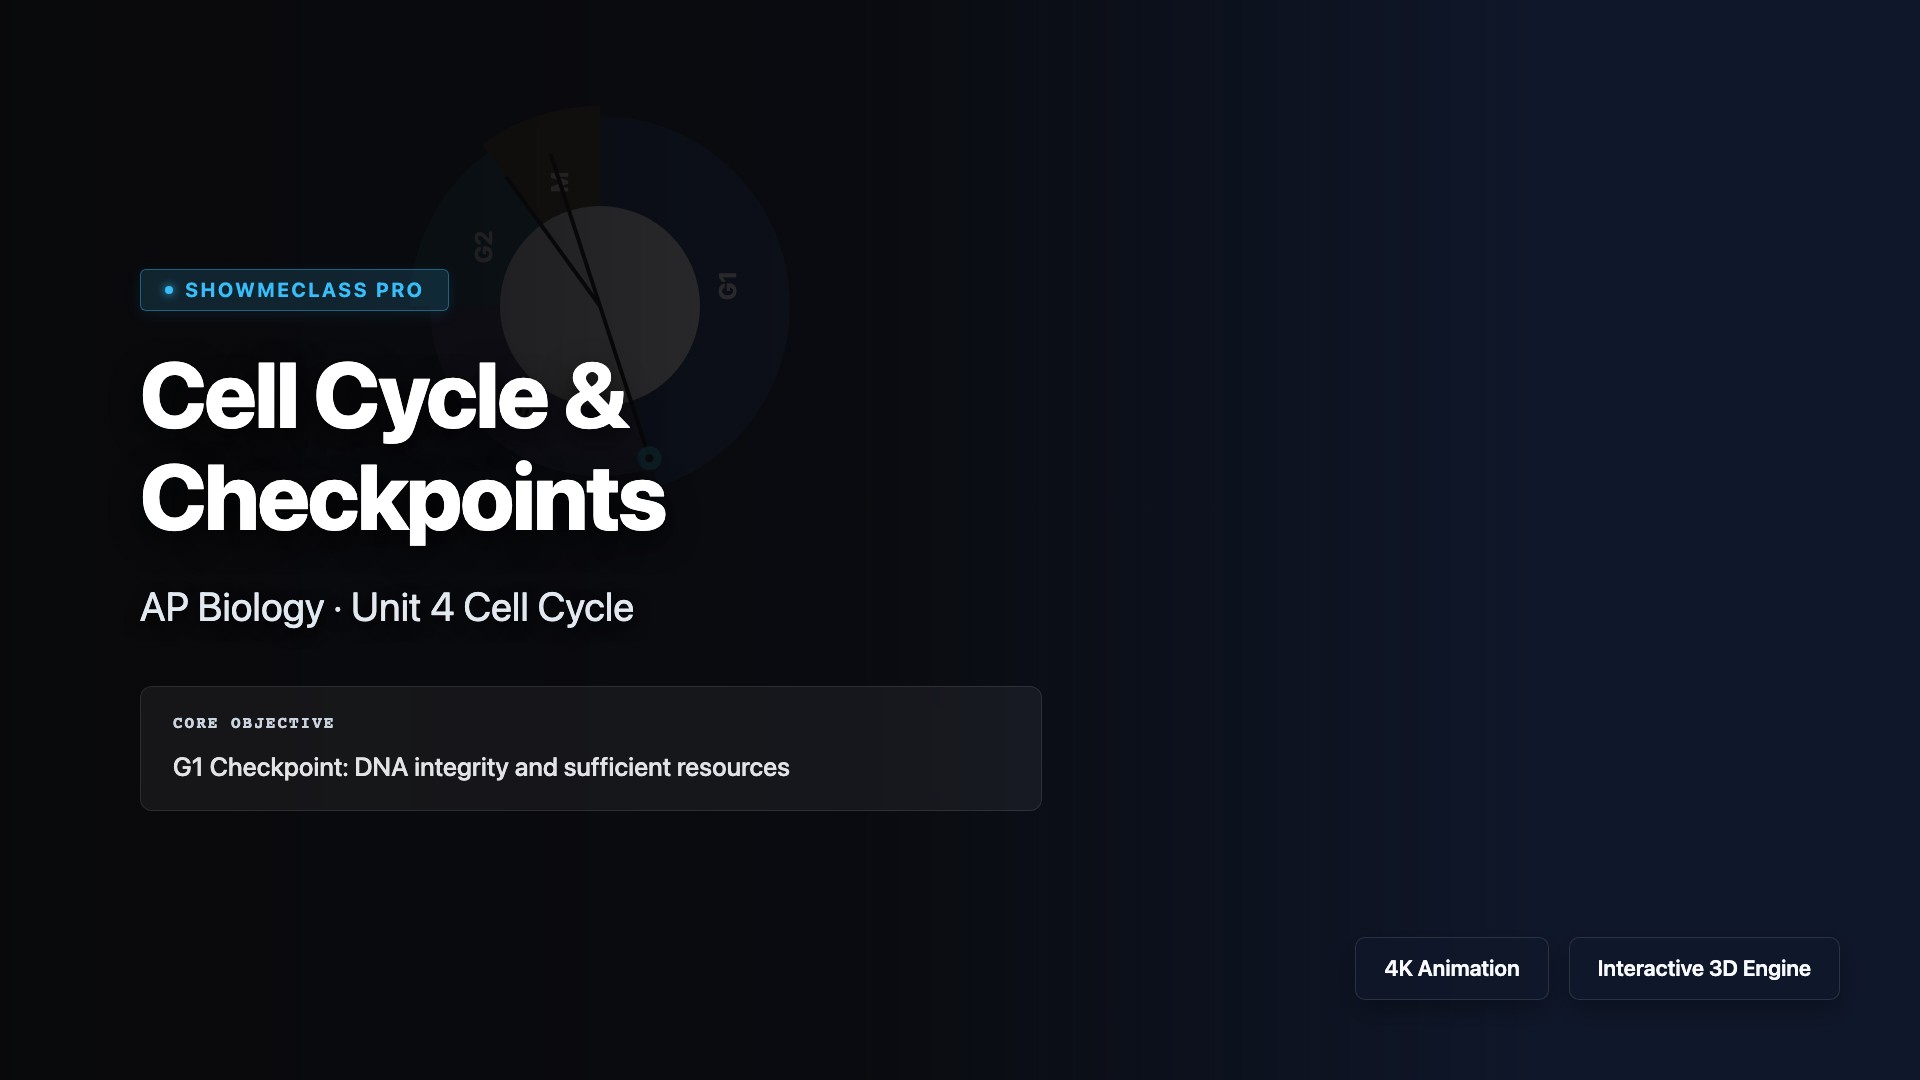
Cell Cycle & Checkpoints
Trace the cell cycle through Interphase and Mitosis. Mutate p53 tumor suppressors to bypass checkpoints, visualizing how unregulated division leads directly to cancer.

Non-Mendelian Genetics
Interactive Punnett Squares detailing Incomplete Dominance (Pink Flowers), Codominance (Roan Cattle), and Multiple Alleles (ABO Blood Types).
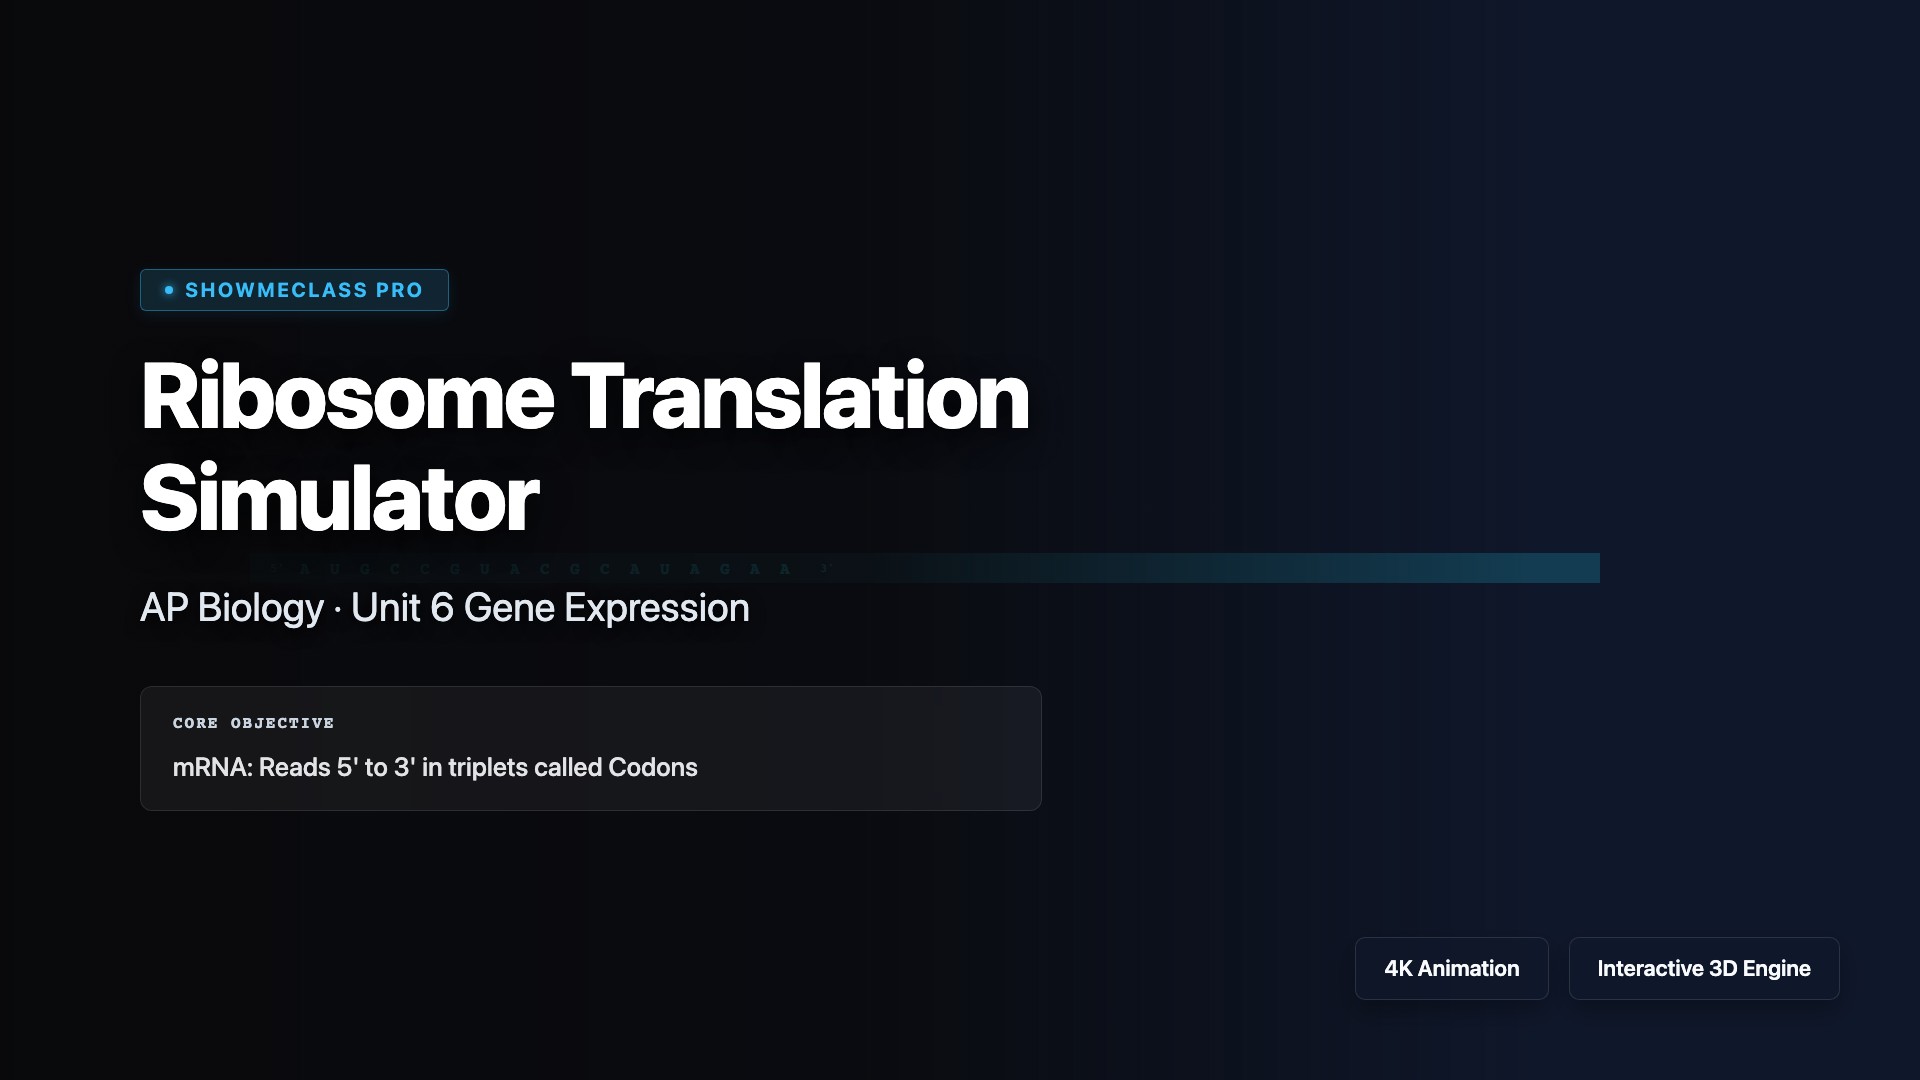
Ribosome Translation Simulator
Step through translation: Small/Large ribosomal subunit assembly, A/P/E site tRNA translocation, peptide bond formation, and termination at a STOP codon.
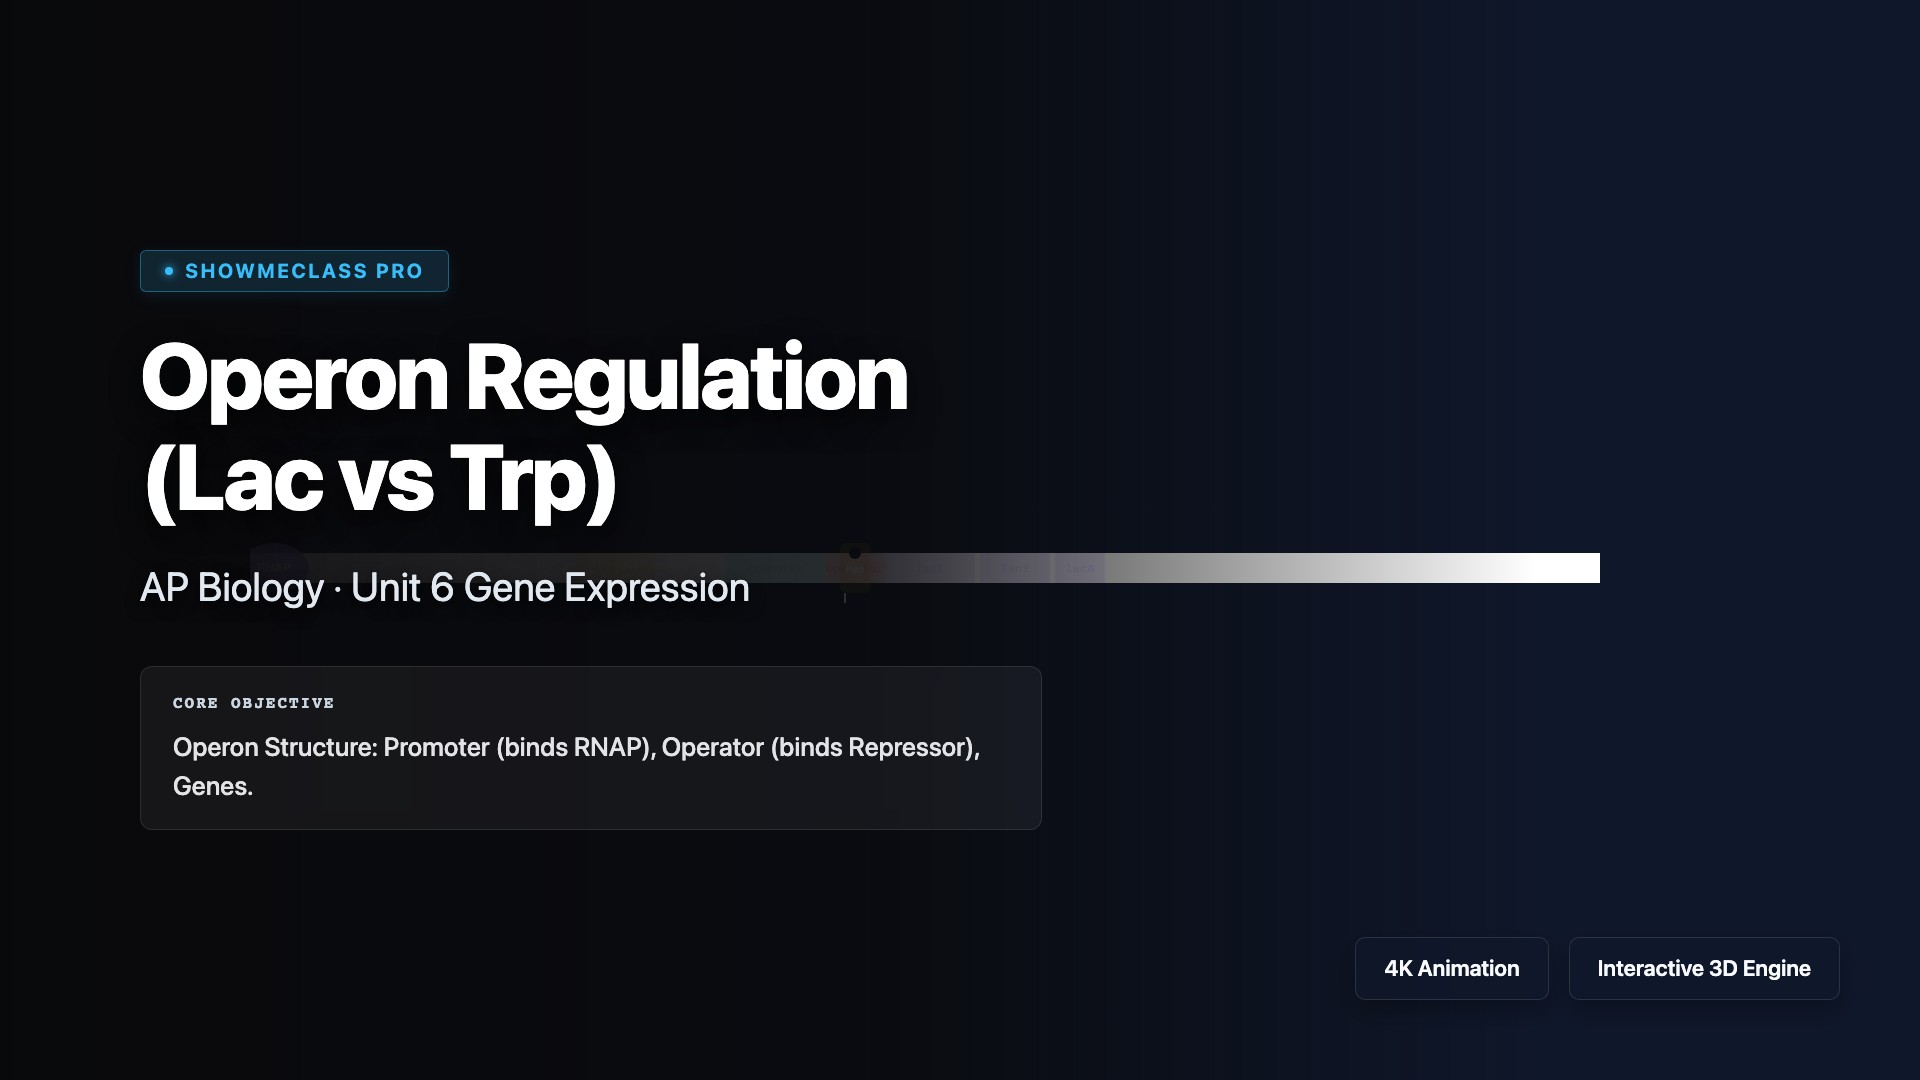
Operon Regulation (Lac vs Trp)
Compare Inducible (Lac) vs Repressible (Trp) bacterial operons. Toggle inducer/corepressor presence to observe immediate repressor conformational changes and RNAP blockage.

Speciation & Reproductive Isolation
Simulate populations diverging into distinct species by interrupting gene flow through Allopatric (Geographic River) or Sympatric (Polyploidy/Behavioral) isolating mechanisms.
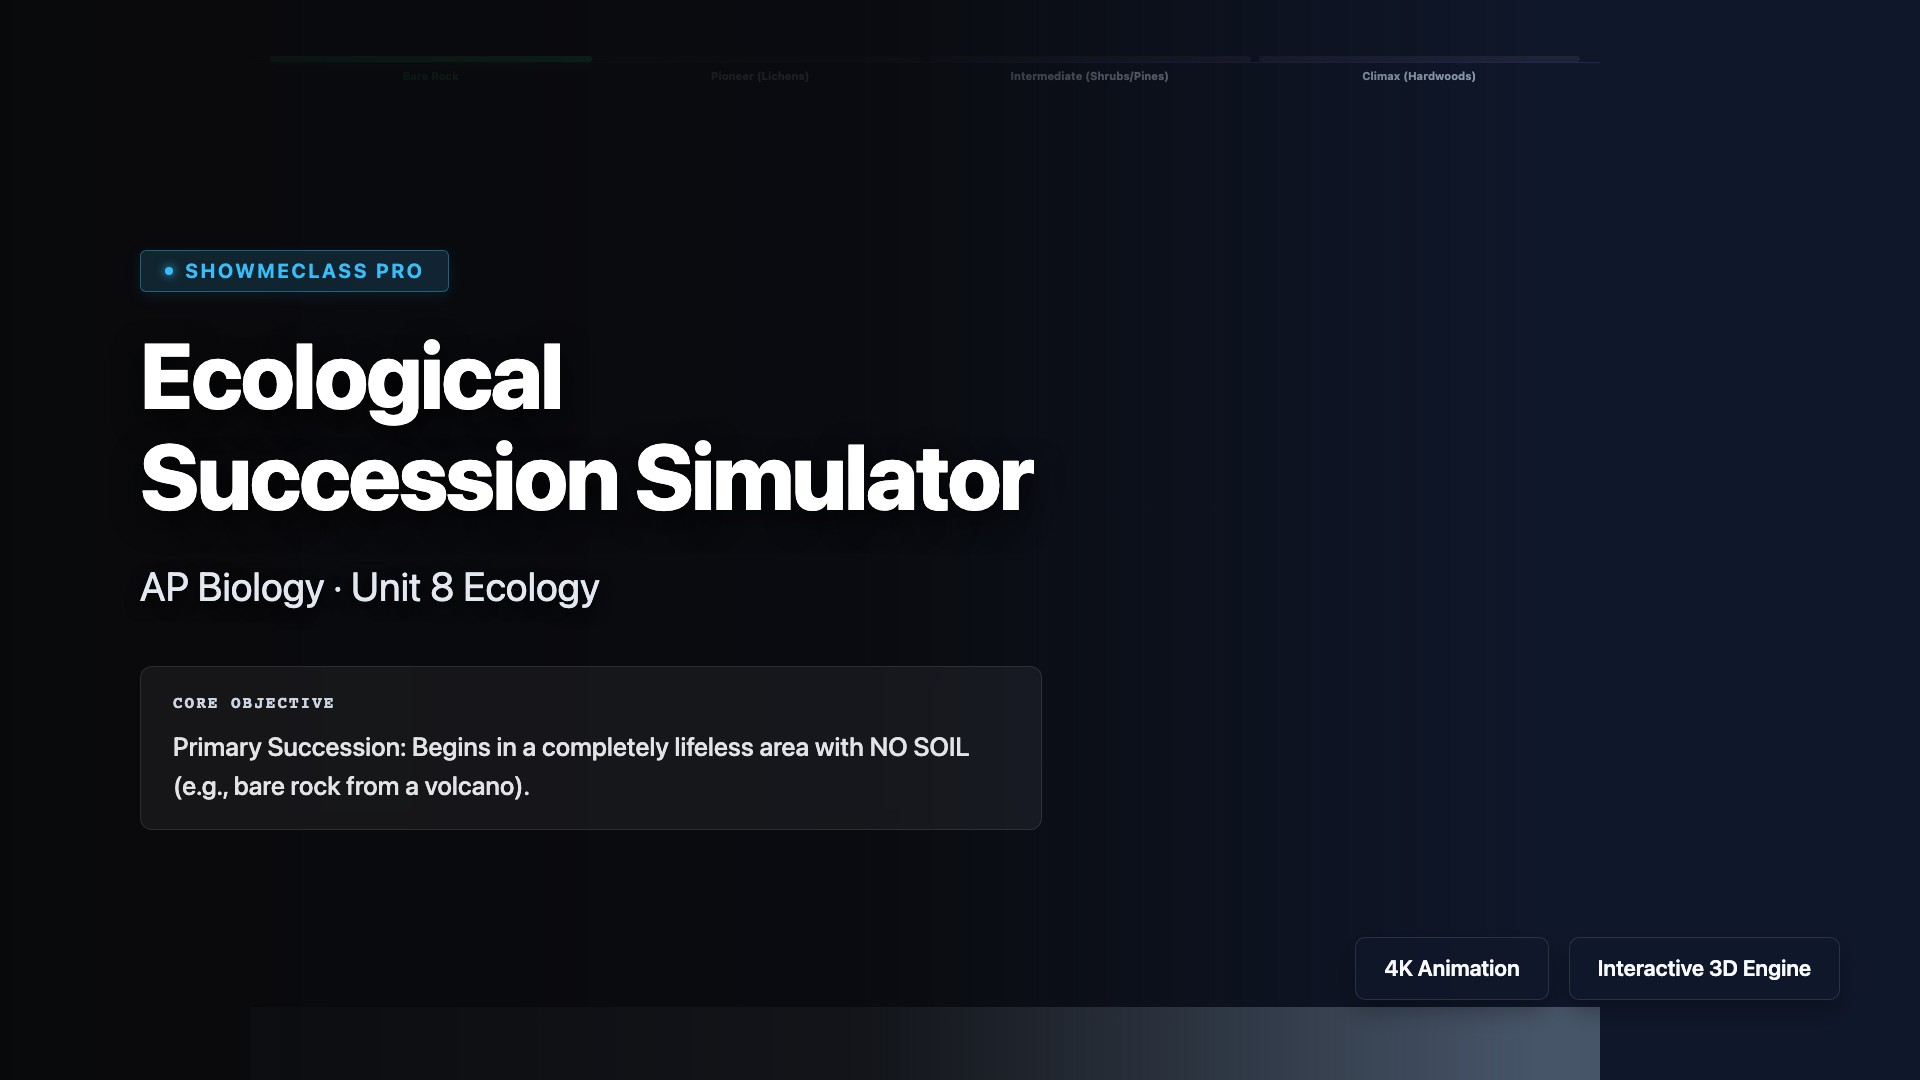
Ecological Succession Simulator
Advance a lifeless rocky landscape through Primary Succession using lichen pioneers. Trigger a catastrophic fire to demonstrate the much faster, soil-rich process of Secondary Succession.
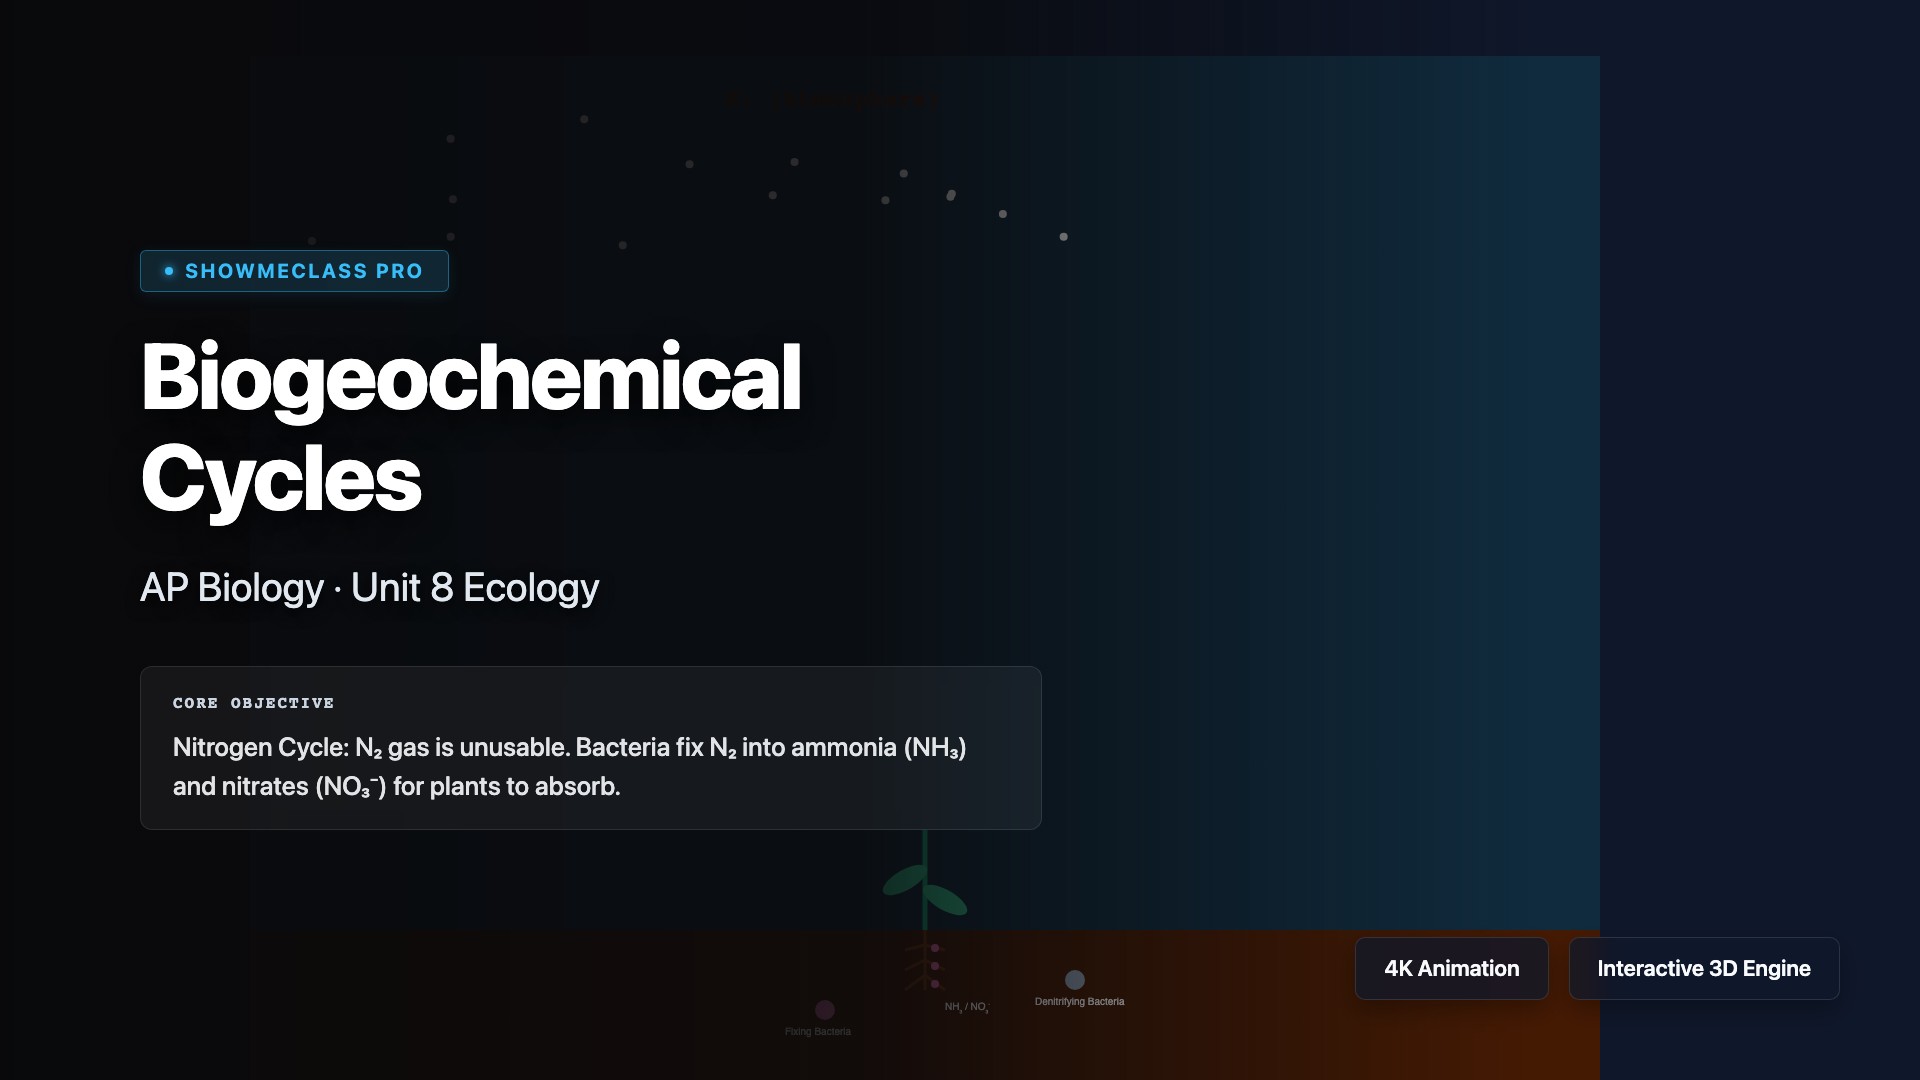
Biogeochemical Cycles (N & P)
Contrast the Nitrogen Cycle (relying entirely on root/soil bacteria to fix atmospheric N₂) against the Phosphorus Cycle (which lacks a gas phase and relies entirely on rock weathering).
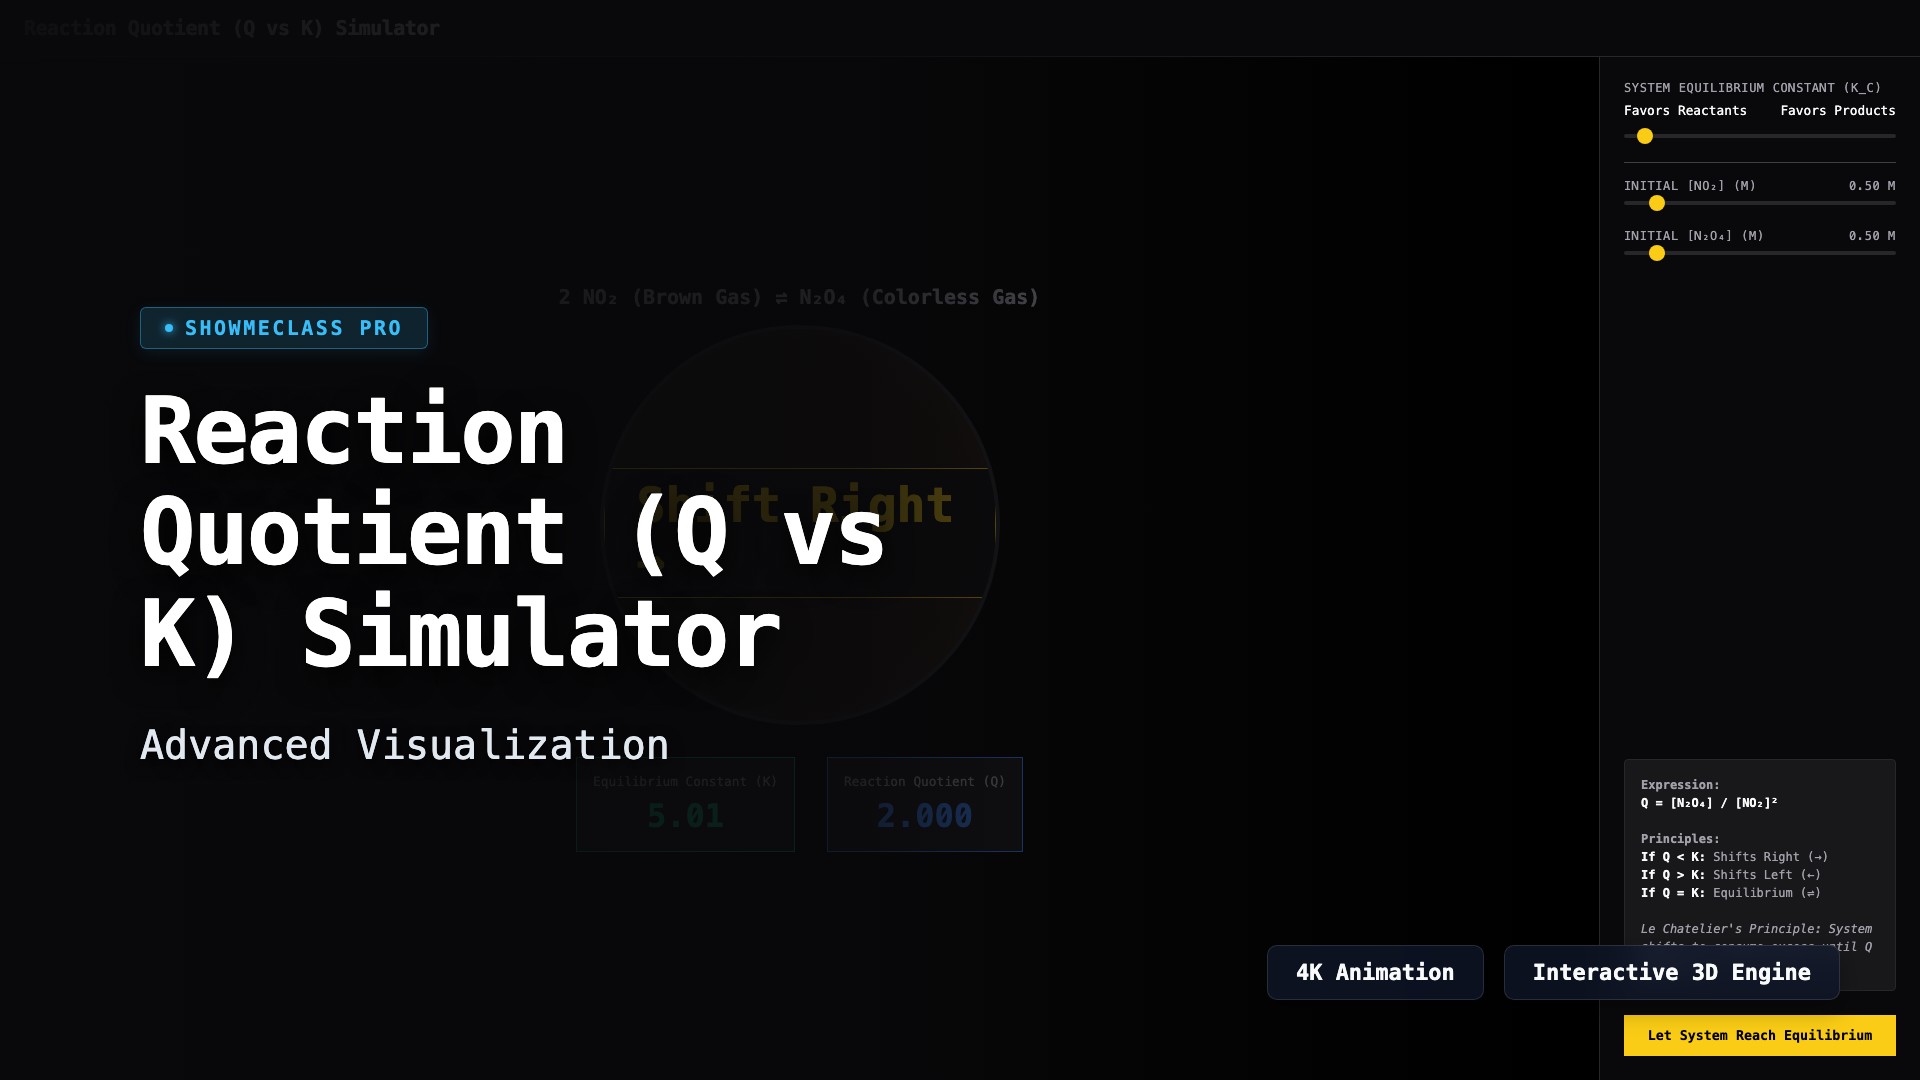
Reaction Quotient (Q vs K) Simulator
Determine the direction of equilibrium shifts using Le Chatelier's Principle. Visualize the theoretical NO2/N2O4 system and click to solve for roots to snap directly into theoretical dynamic equilibrium.
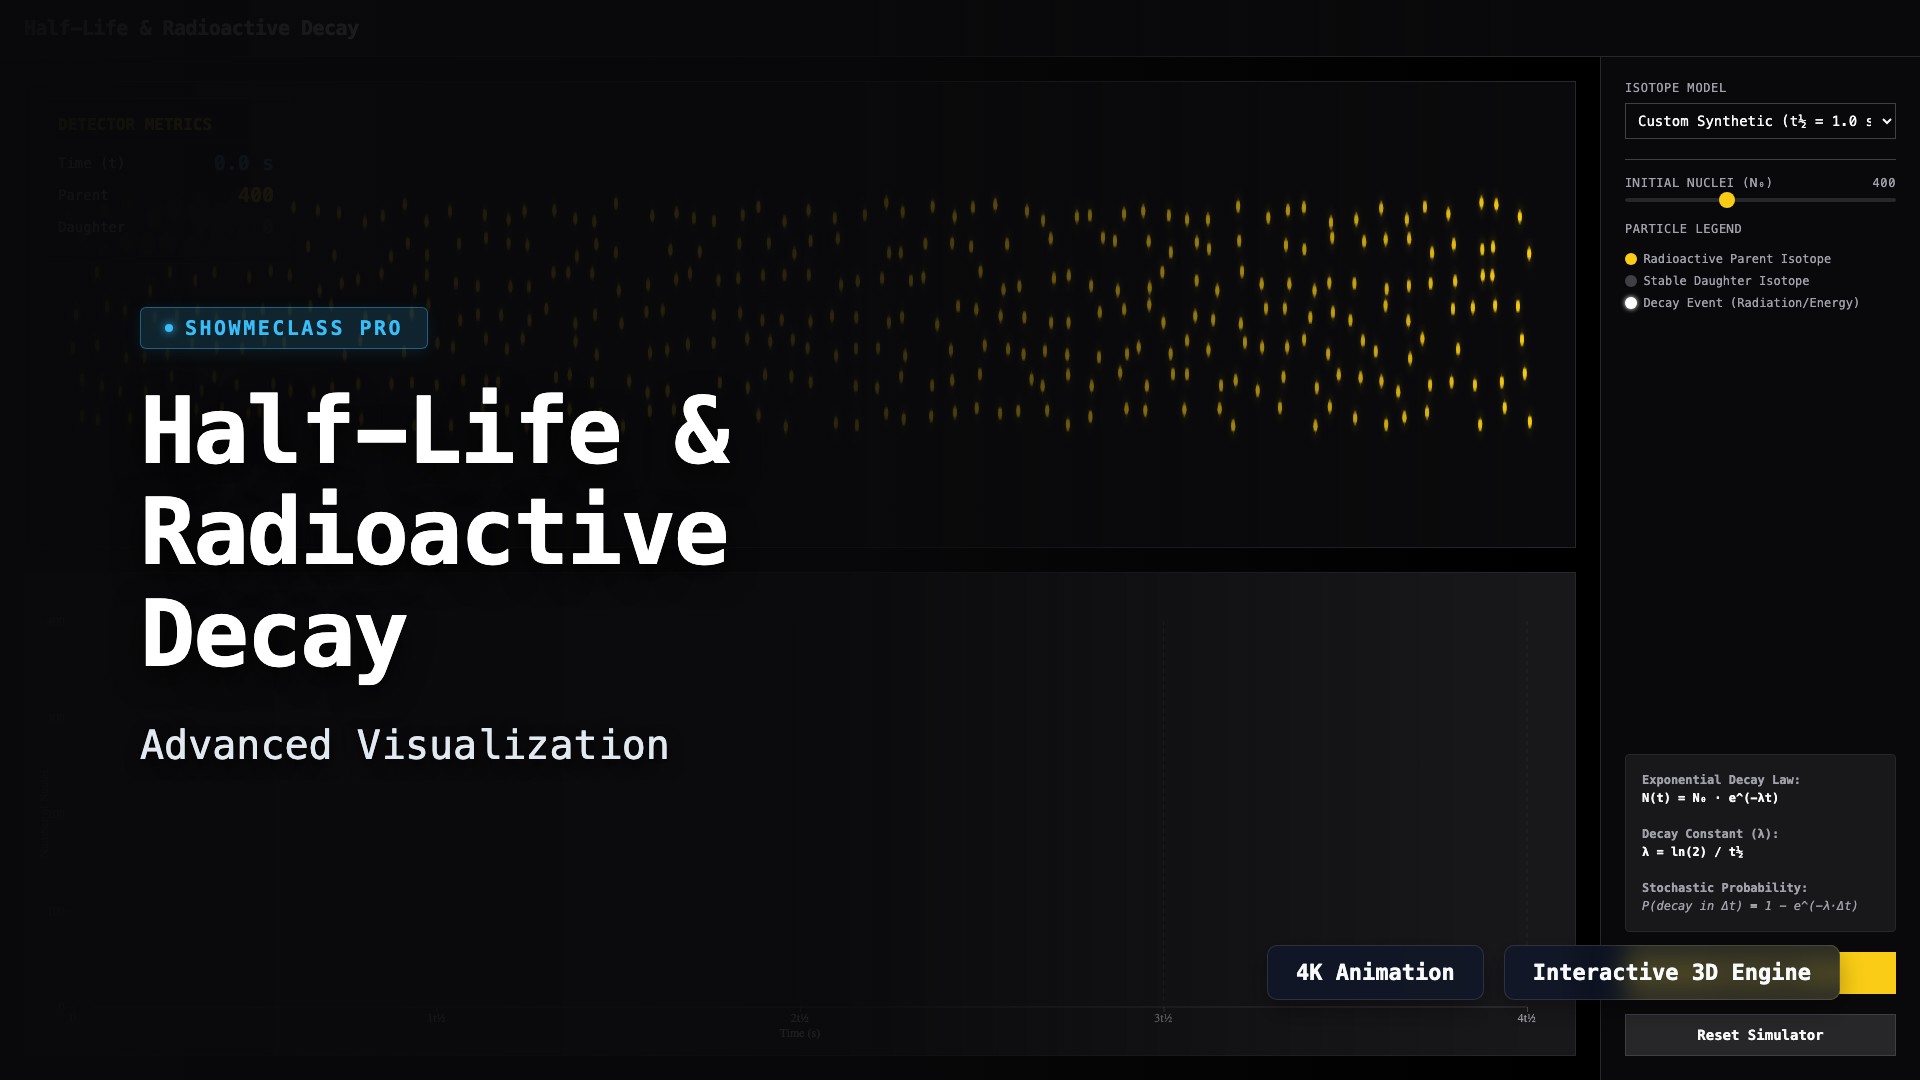
Half-Life & Radioactive Decay
Visualize stochastic exponential decay mapped against N(t) mathematical algorithms. Track Parent and Daughter isotope accumulation across customized half-lives in a real-time flashing particle engine.
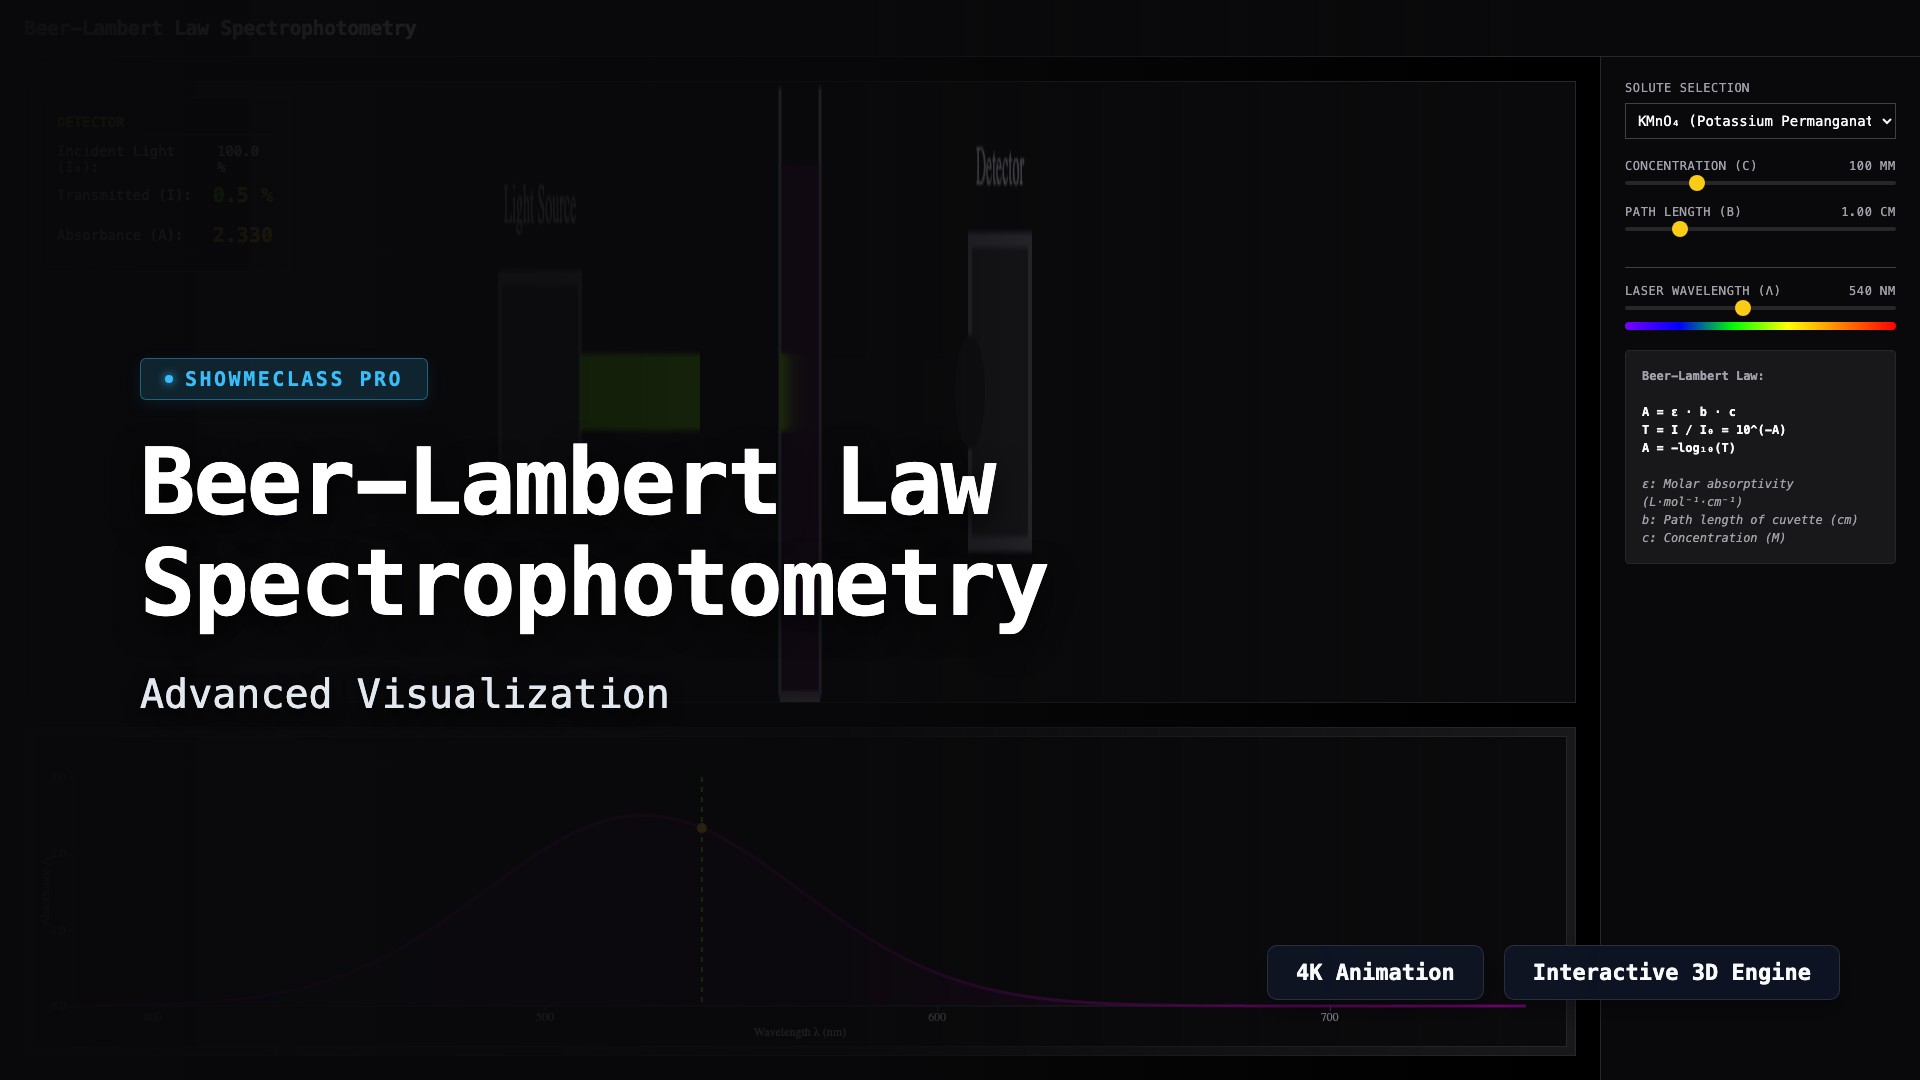
Beer-Lambert Law Spectrophotometry
Visualize the principles of spectrophotometry. Adjust wavelength, concentration, and cuvette path length to observe how light absorption changes dynamically according to the Beer-Lambert Law.
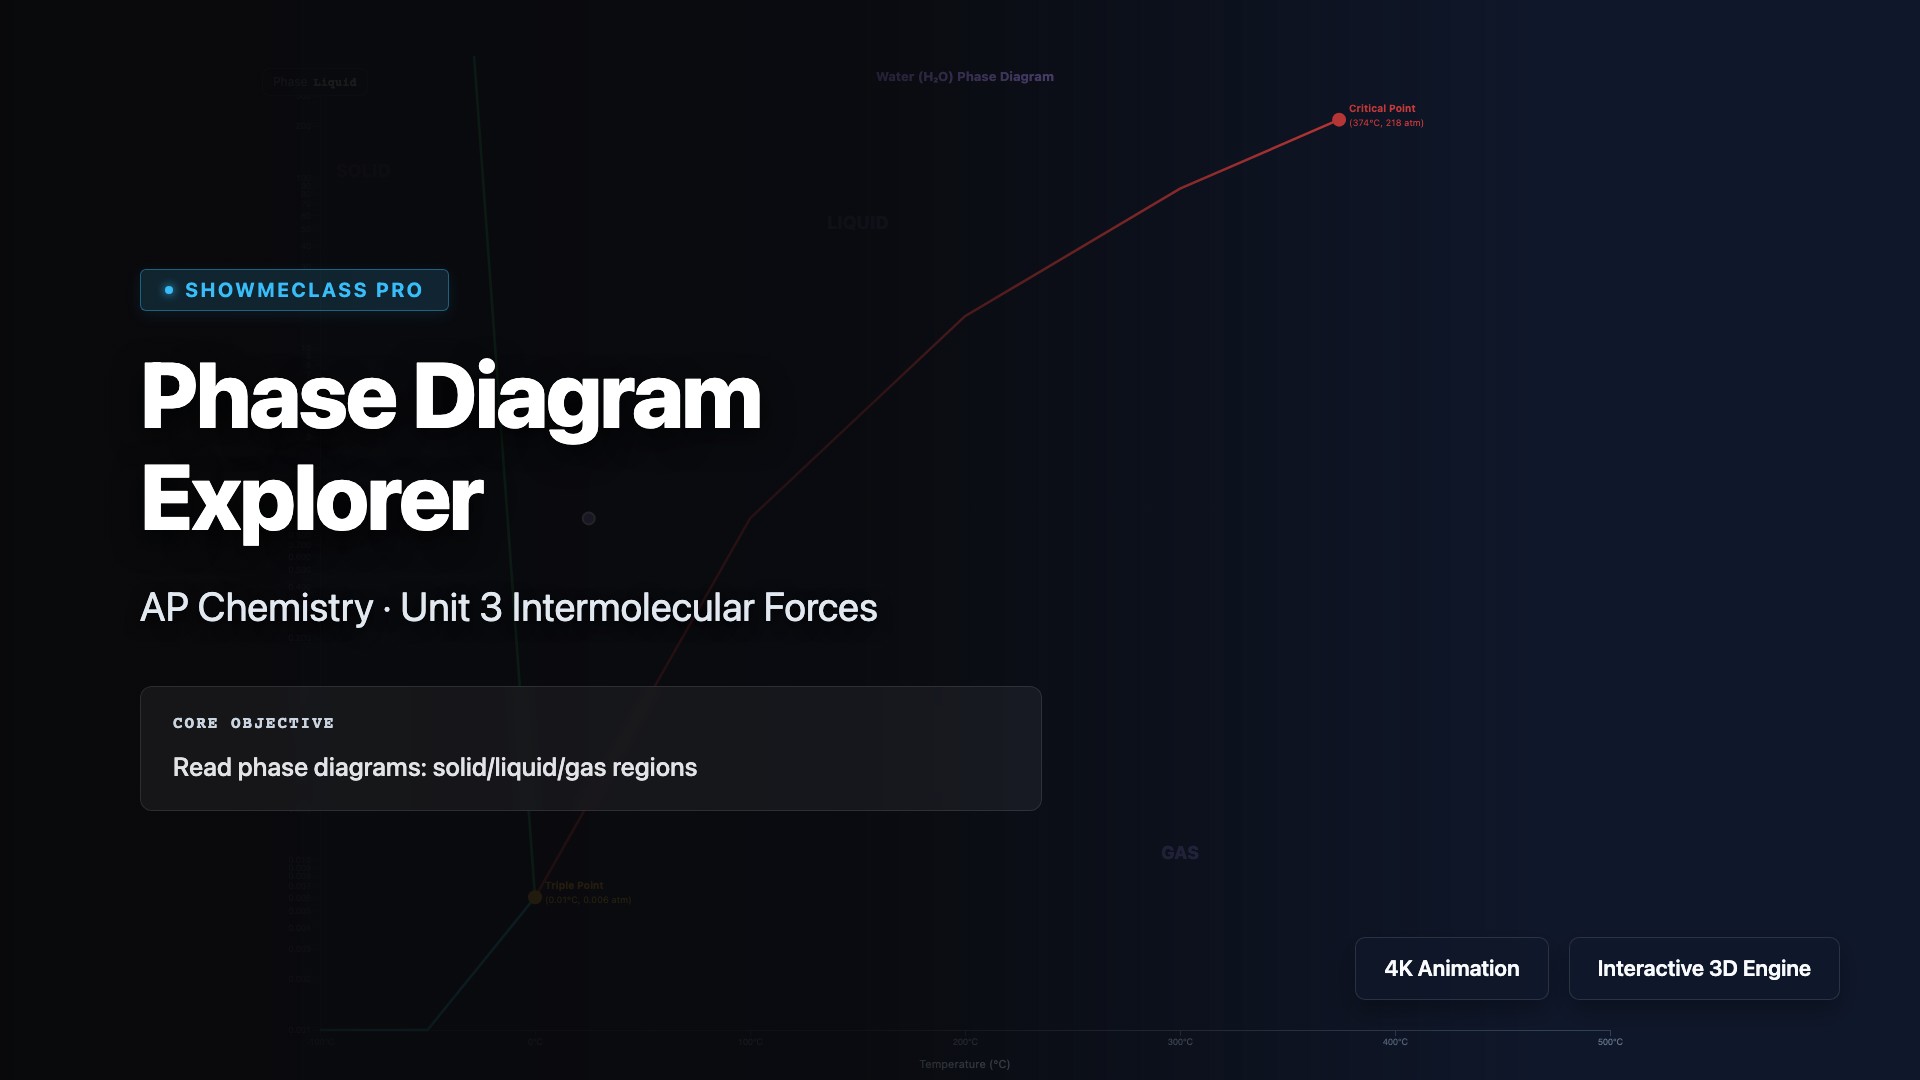
Phase Diagram Explorer
Interactive phase diagrams for H₂O and CO₂. Explore triple points, critical points, and supercritical fluid regions. Identify the phase at any T,P coordinate.

Price Controls & Surplus Visualizer
Impose brutal government administrative limits on the Free Market. Slide Price Ceilings (Rent Control) and Price Floors (Minimum Wage) across the equilibrium to instantly graphically calculate the resulting Shortage/Surplus and Deadweight Loss.