Showing 12 results

Doppler Effect 2D
Simulate sound wave propagation from a moving source. Calculate perceived frequencies for front and rear observers, and explore the Mach Cone (sonic boom) during supersonic flight.

Entropy in Heat Engines
Visualize the 2nd Law of Thermodynamics. Build reversible Carnot engines and irreversible real engines to track the exact entropy changes in the hot reservoir, cold reservoir, and the universe.

Chi-Square Goodness of Fit
Calculate and visualize deviations from expected categorical frequencies. Generates the exact right-skewed Chi-Square distribution and P-Value tail.
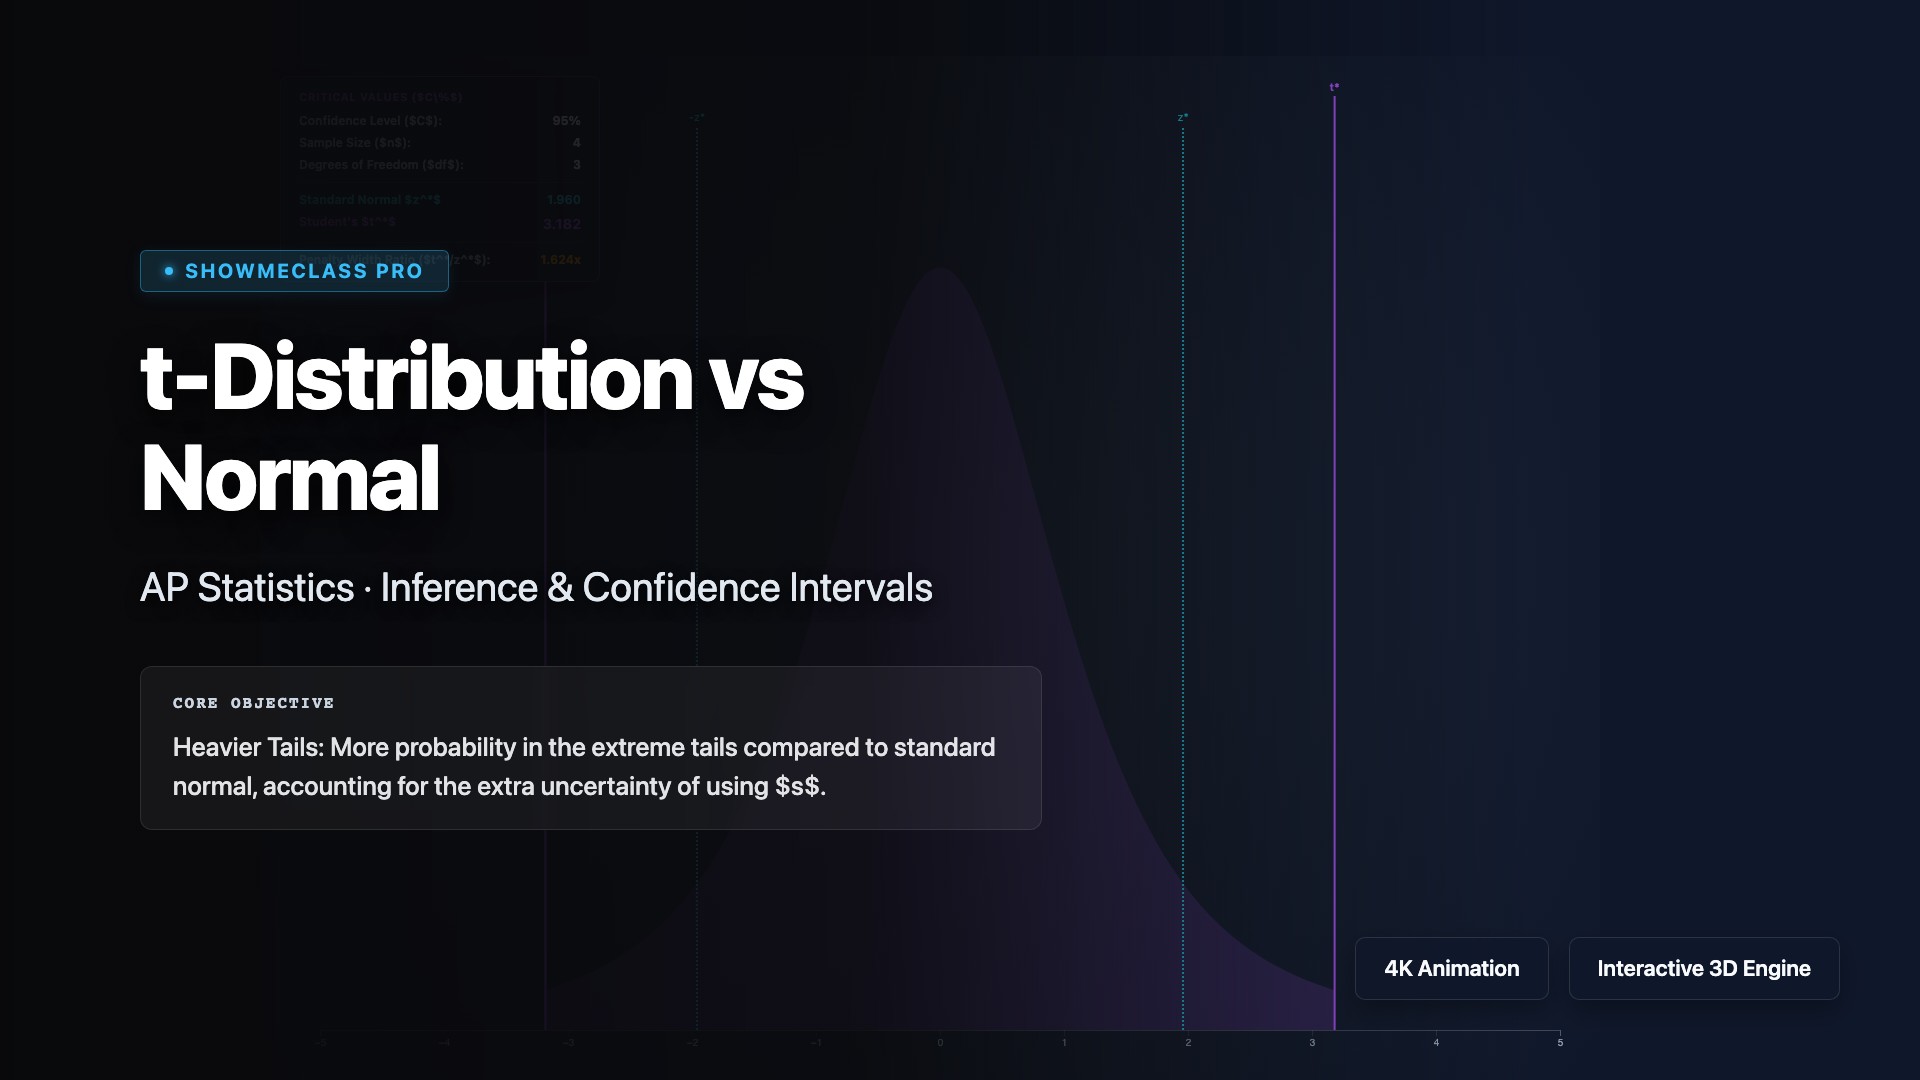
t-Distribution vs Normal
Examine the heavy-tailed Student's t-distribution. Increase degrees of freedom (df) to watch it perfectly converge into the standard normal z-distribution.

Sampling Distributions (CLT)
Struggle with the Central Limit Theorem? Draw 10,000 samples from highly skewed or bimodal parent populations and watch the perfect normal bell curve emerge.

Residual Plots
Evaluate the appropriateness of Least Squares Regression Lines (LSRL). Detect curvilinear patterns, heteroscedasticity, and influential outliers.
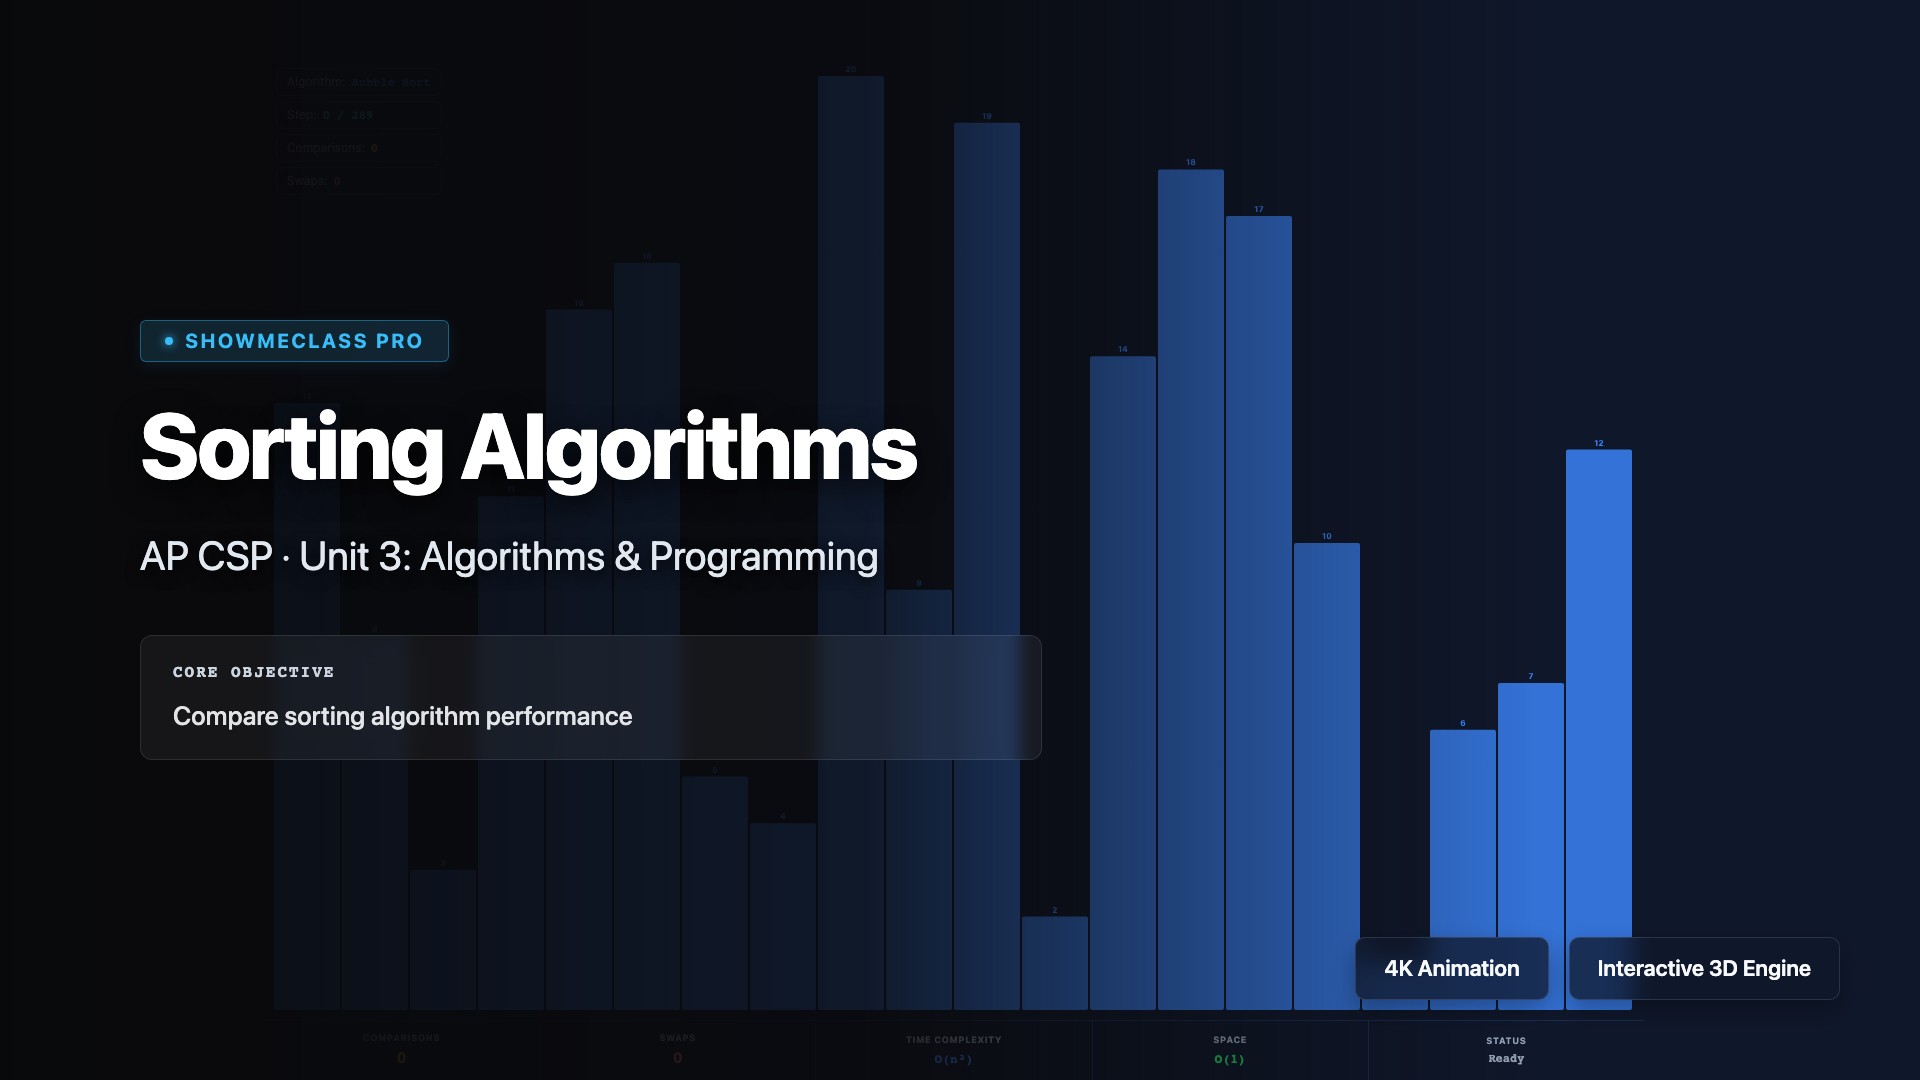
Sorting Algorithms O(N^2) vs O(N log N)
Visualize Selection, Insertion, and Merge sort line-by-line. Track memory accesses, array swaps, and Big-O efficiency in real time.

Array vs ArrayList Memory Resizing
Witness the internal array backing an ArrayList dynamically resize. Compare fixed memory bounds against O(N) copy operations when capacity is exceeded.

2D Array Traversal
Deconstruct nested loops covering Row-Major, Column-Major, and boundary tracing across a 2D integer matrix.

LRATC Envelope Curve
Understand firm costs in the Long Run. Slide targeted production scales to track how Short-Run Average Total Cost curves (SRATC) form the Returns to Scale envelope.

Foreign Exchange Market
Visualize currency Appreciation and Depreciation on the forex market. Shift Supply and Demand curves for US Dollars relative to the Euro based on dynamic global conditions.
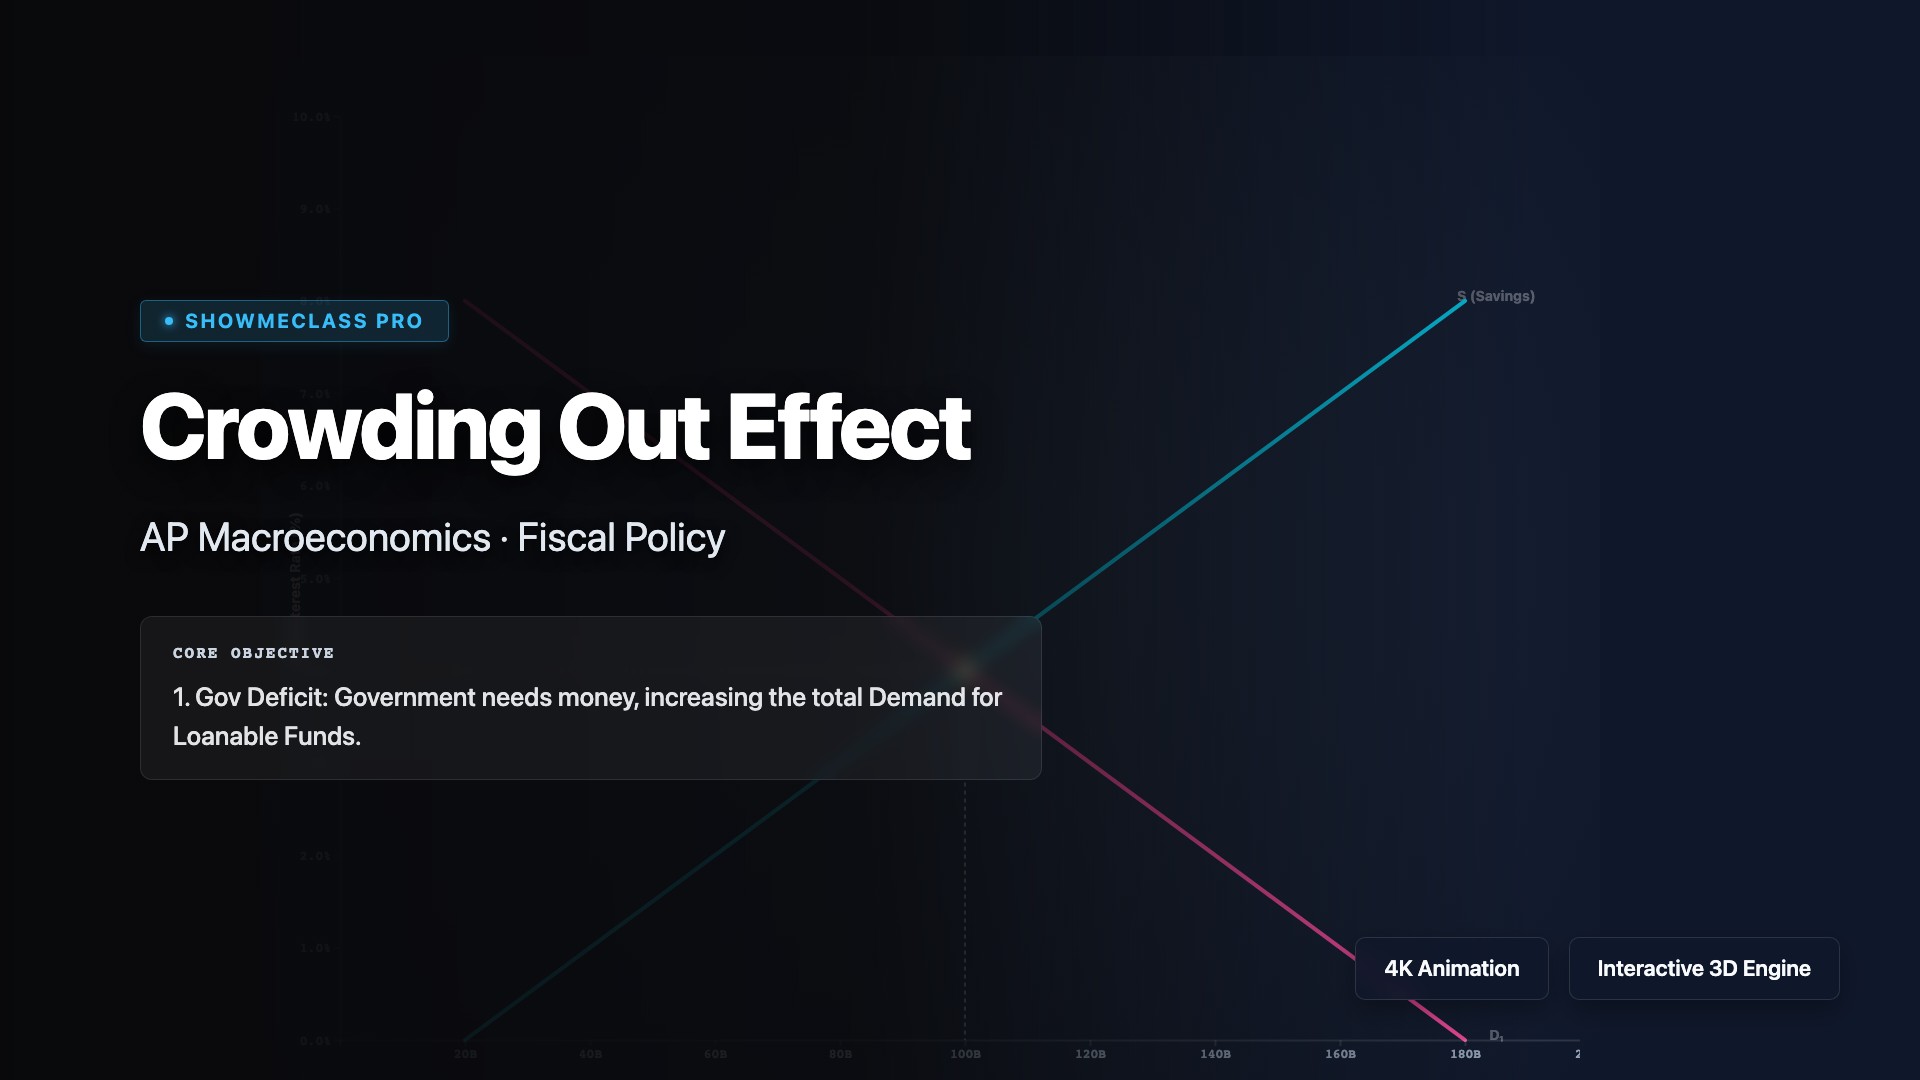
Crowding Out Effect
Observe how Government Deficit spending spikes Real Interest Rates in the Loanable Funds Market, inadvertently Crowding Out private business investment.