Showing 12 results
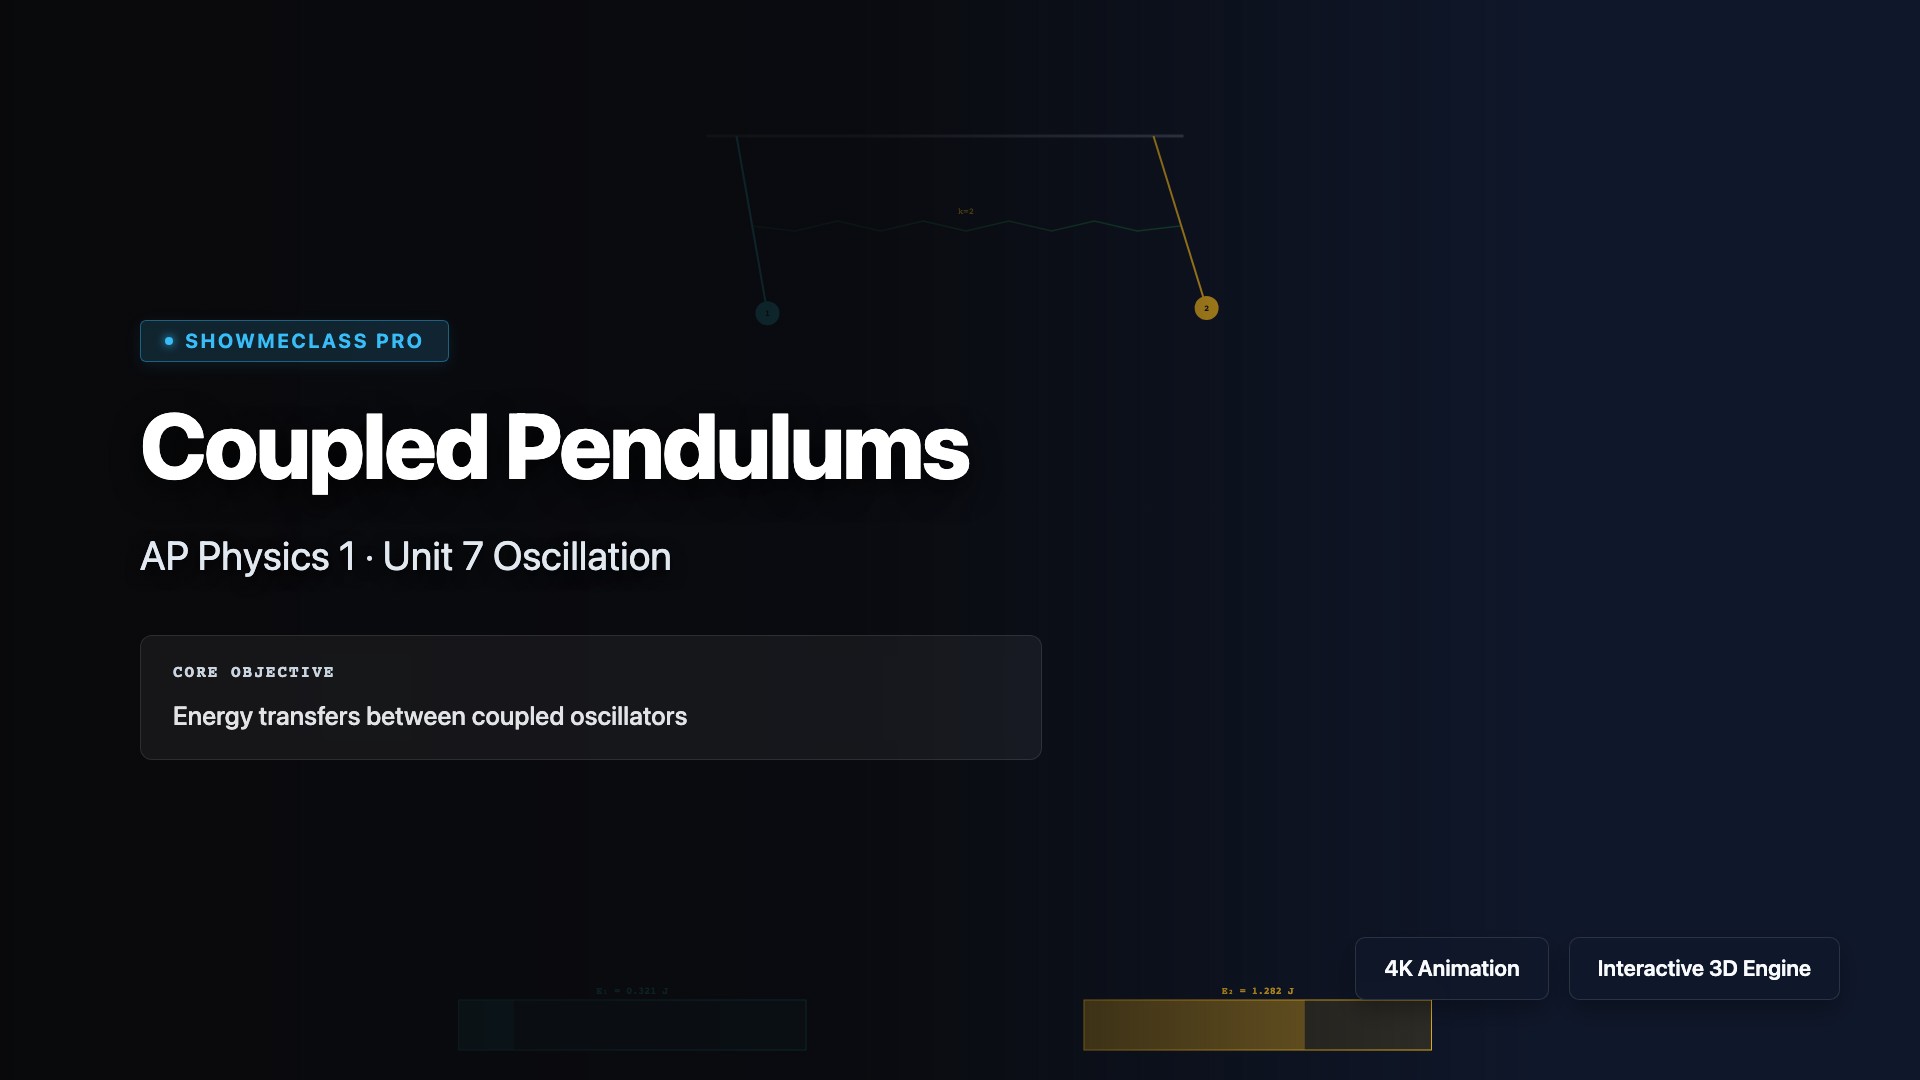
Coupled Pendulums & Energy Transfer
Two pendulums coupled by a spring exchange energy via beat oscillation. Adjust coupling strength to see faster/slower energy transfer between normal modes.
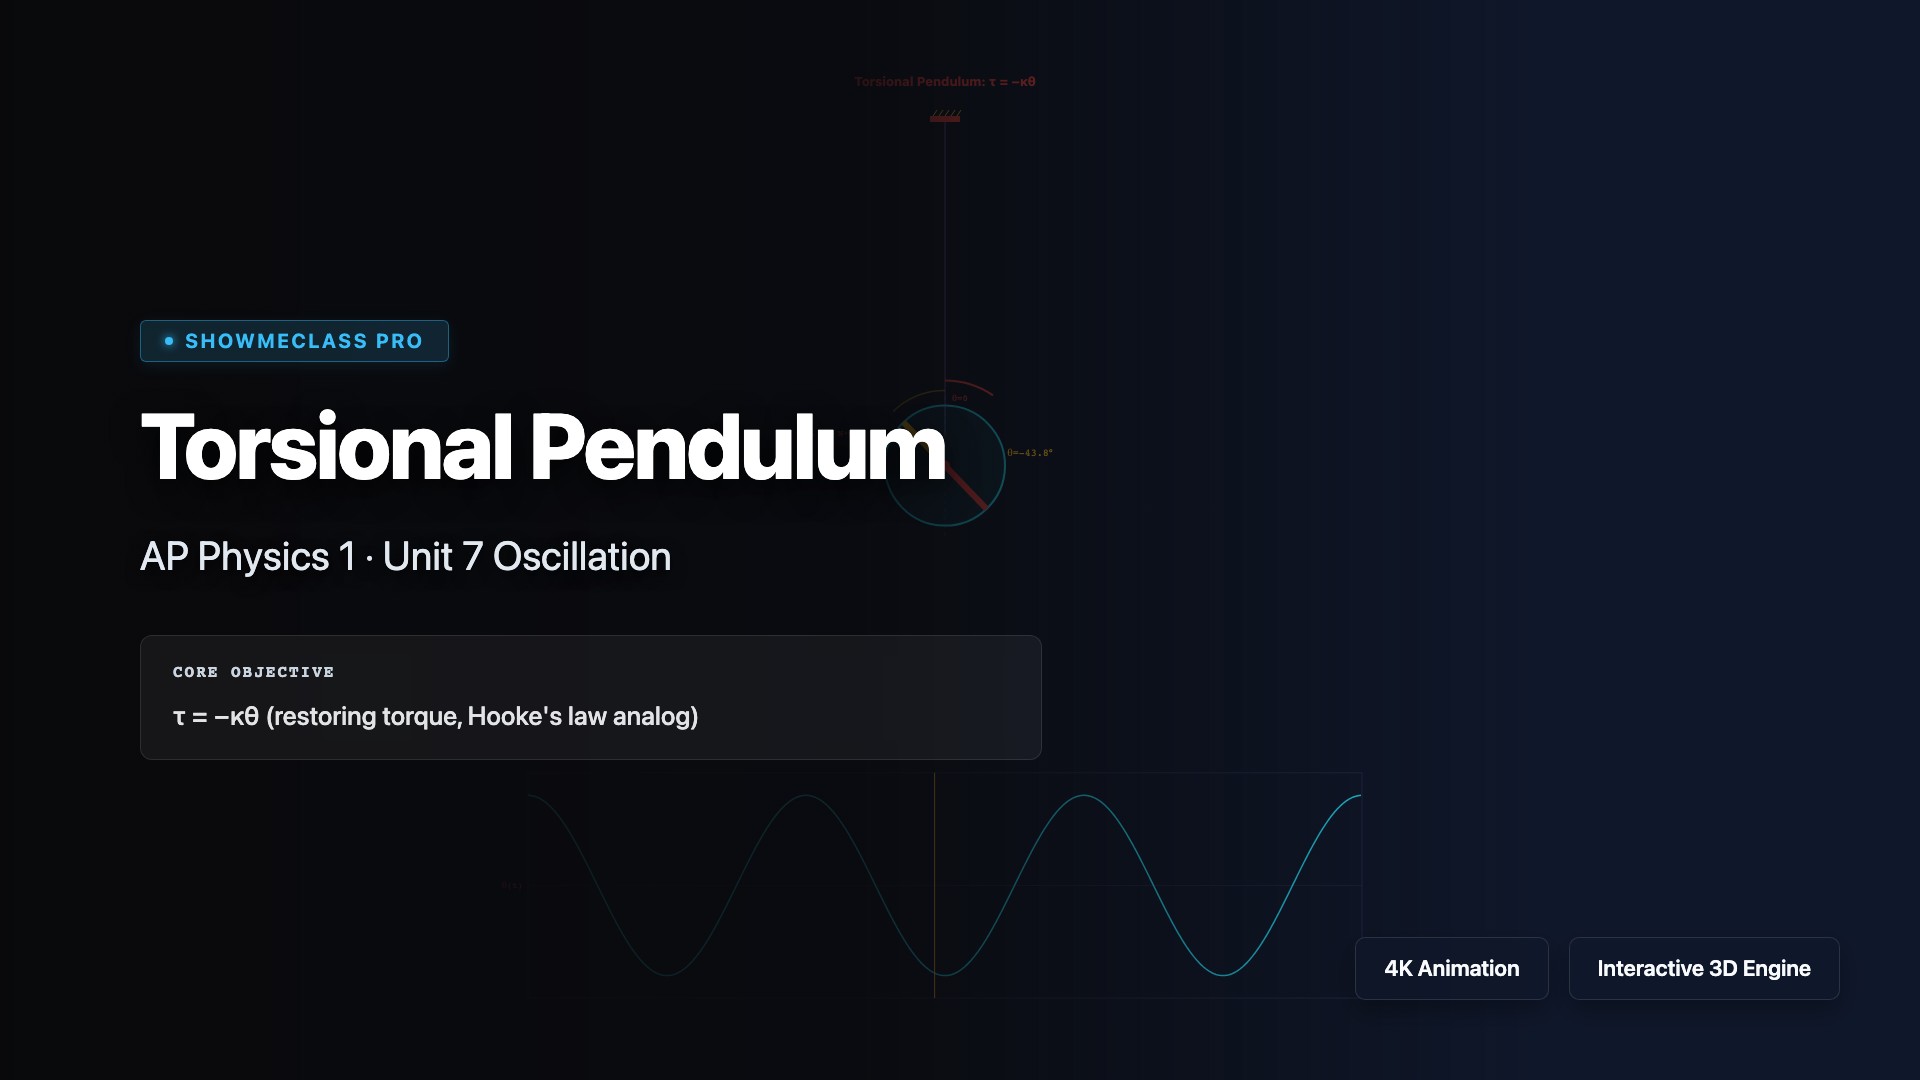
Torsional Pendulum
Rotating disk with τ = −κθ restoring torque. Angular SHM: T = 2π√(I/κ). Real-time θ(t) graph with adjustable torsion constant, moment of inertia, and damping.
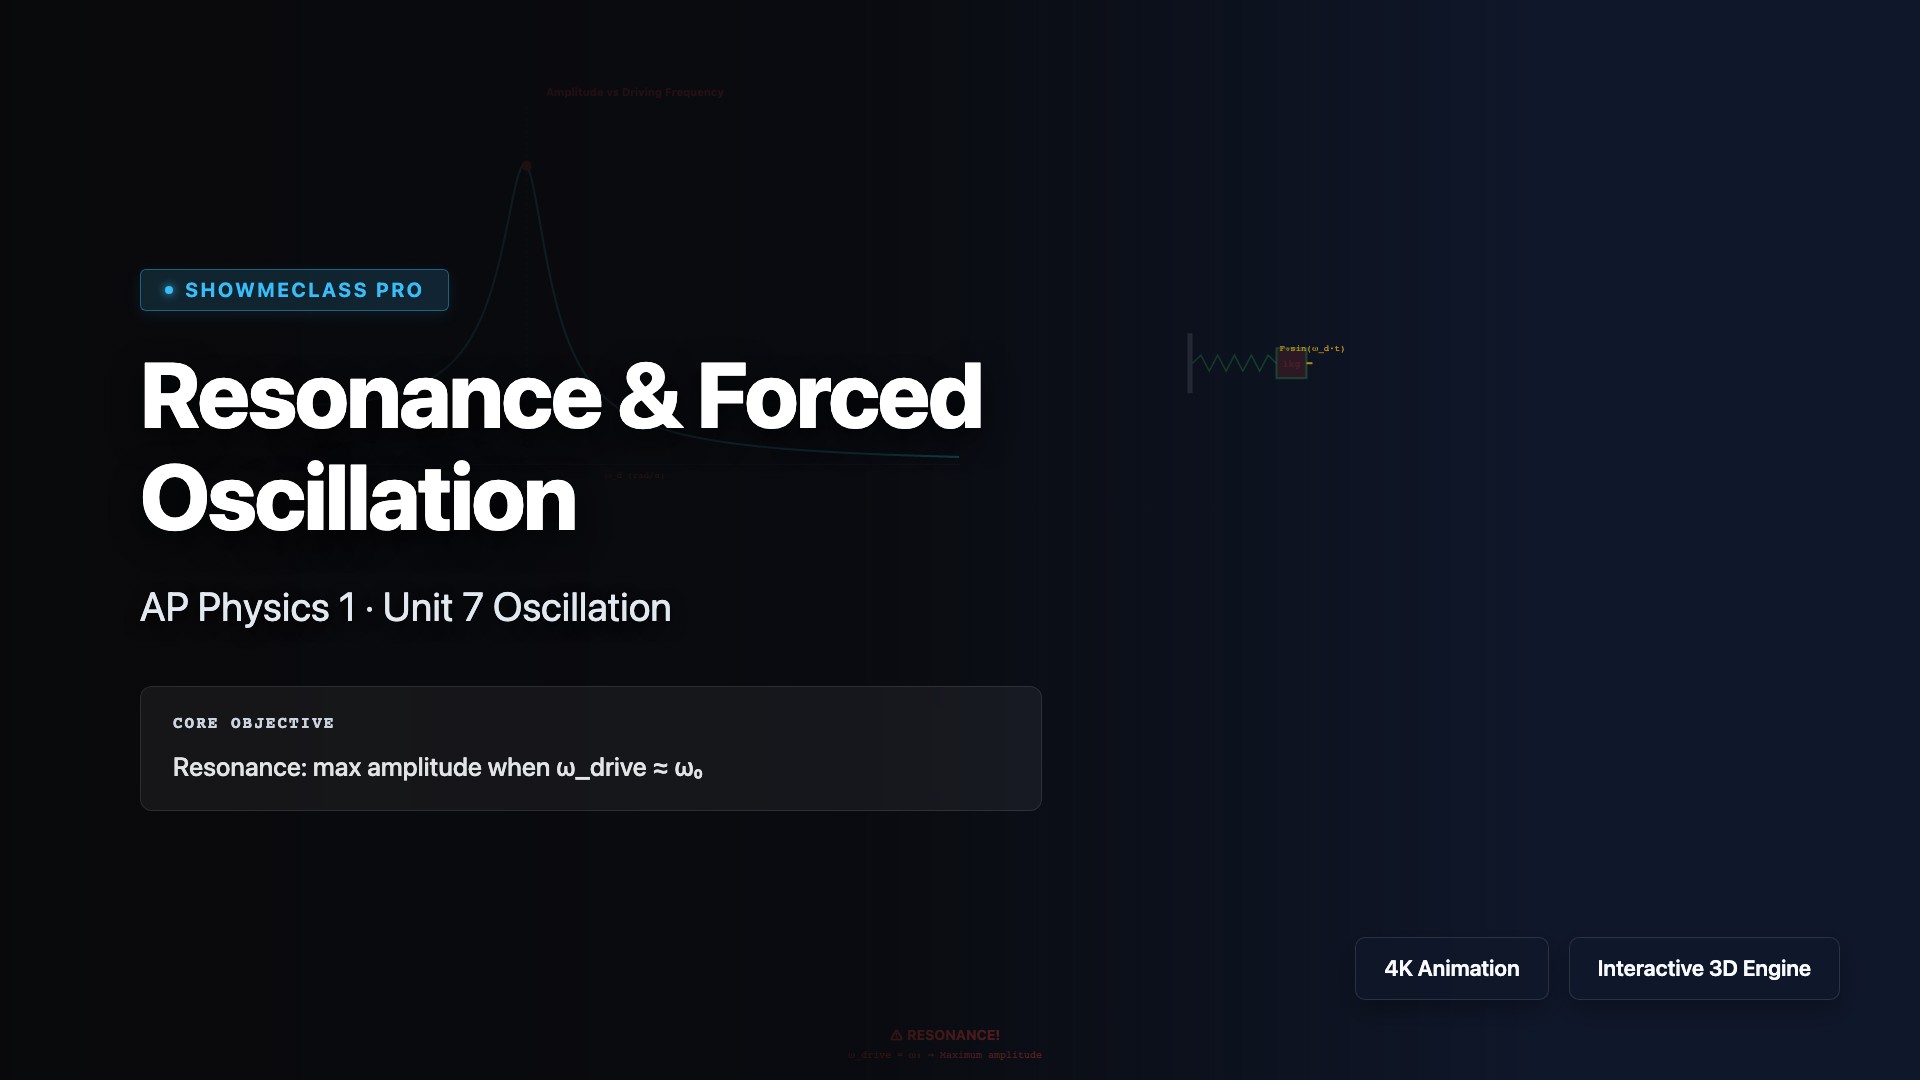
Resonance & Forced Oscillation
Amplitude vs driving frequency resonance curve. Maximum amplitude at ω_drive ≈ ω₀. Adjustable damping, spring constant, mass, and driving force.
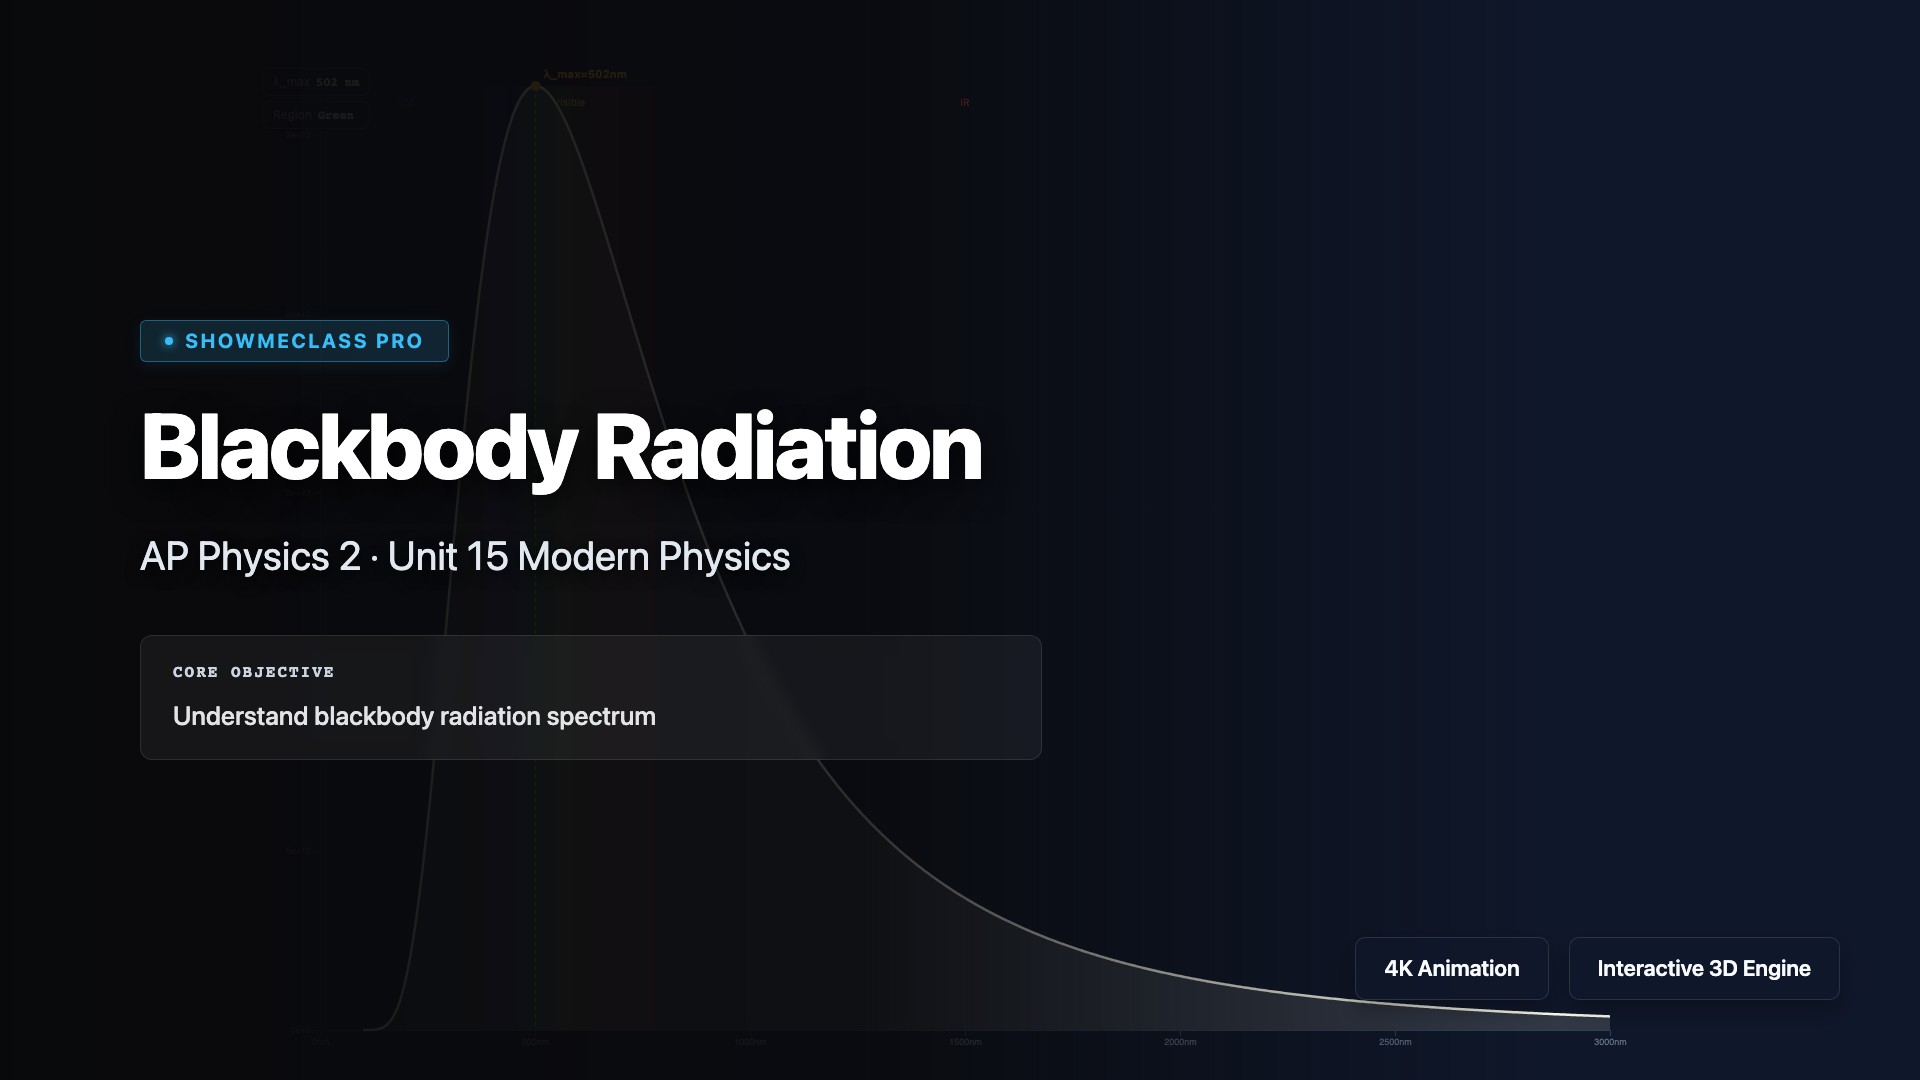
Blackbody Radiation & Wien's Law
Explore the Planck radiation spectrum with adjustable temperature. See Wien's displacement law locate the peak wavelength and compare star temperatures from red dwarf to blue giant.
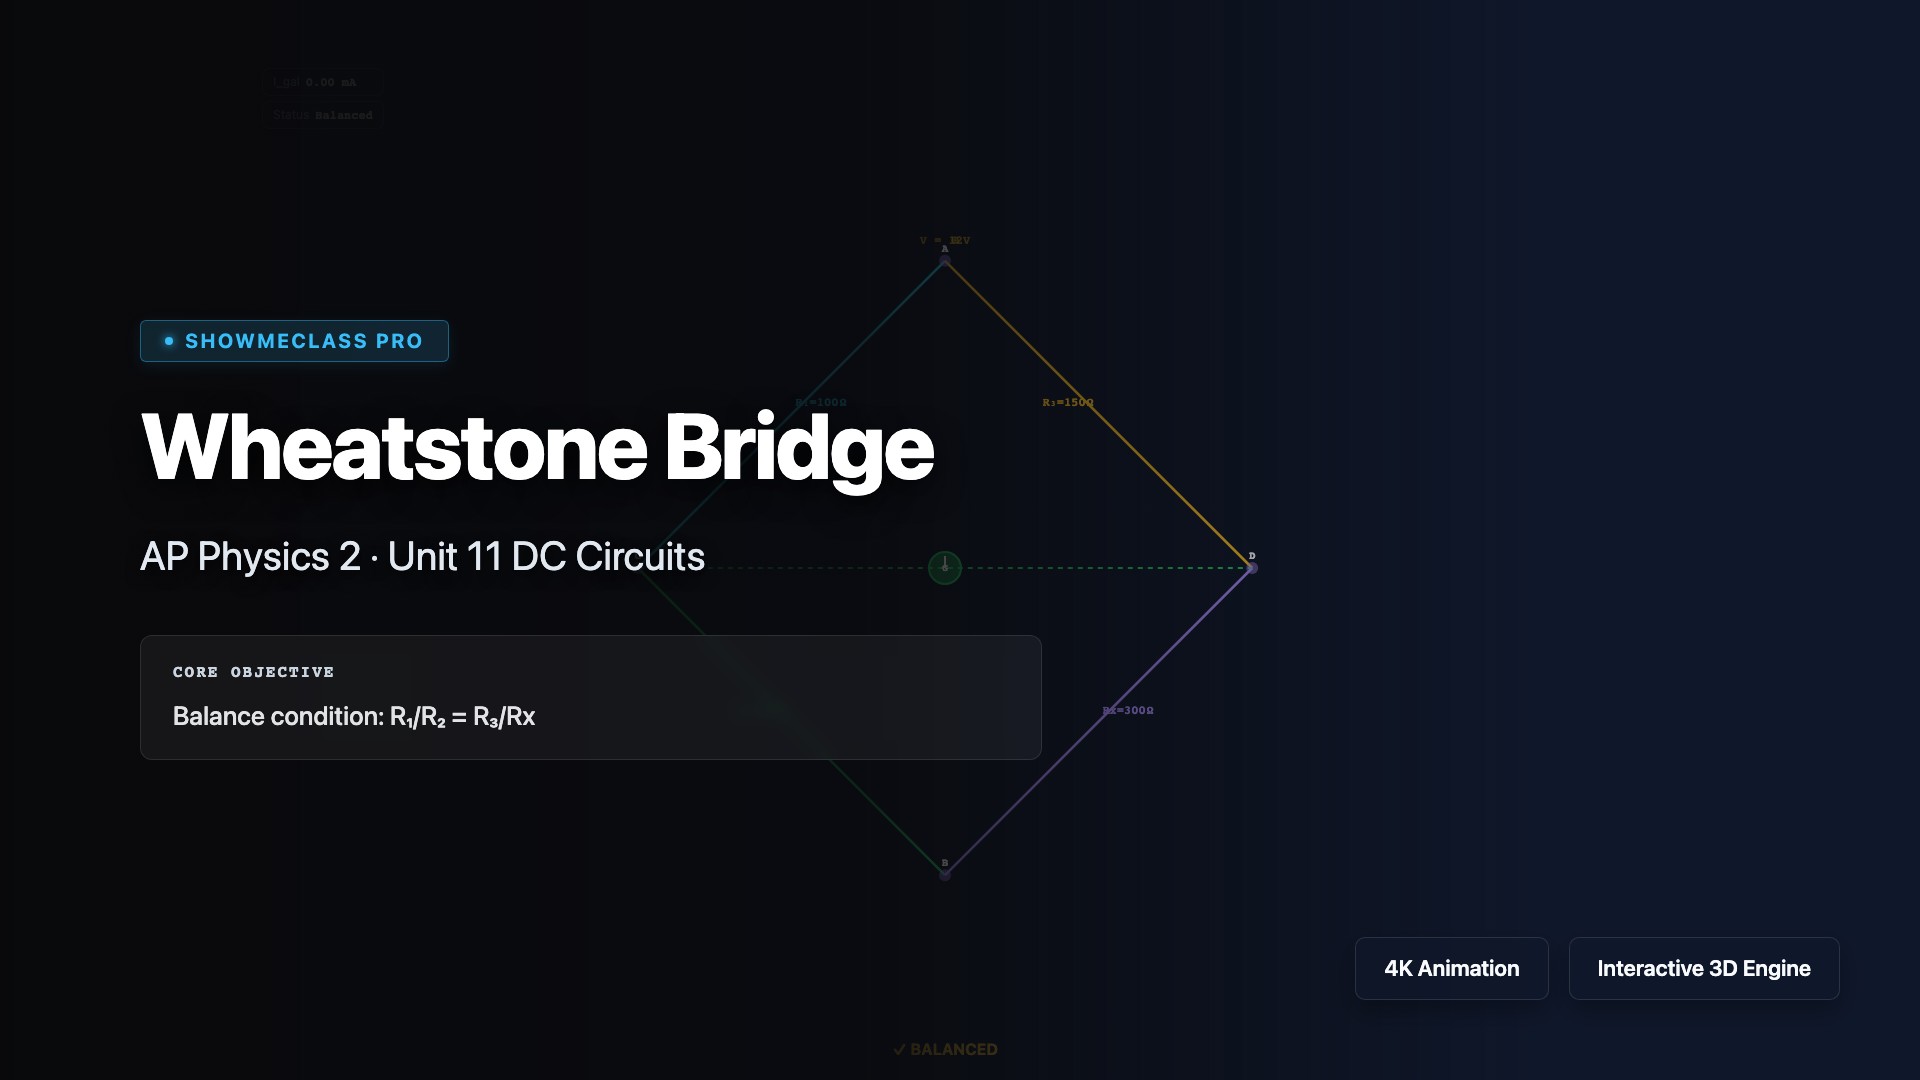
Wheatstone Bridge Balance
Adjust four resistors and voltage source to balance a Wheatstone bridge. Galvanometer needle shows current; R₁/R₂ = R₃/Rx condition for zero deflection.
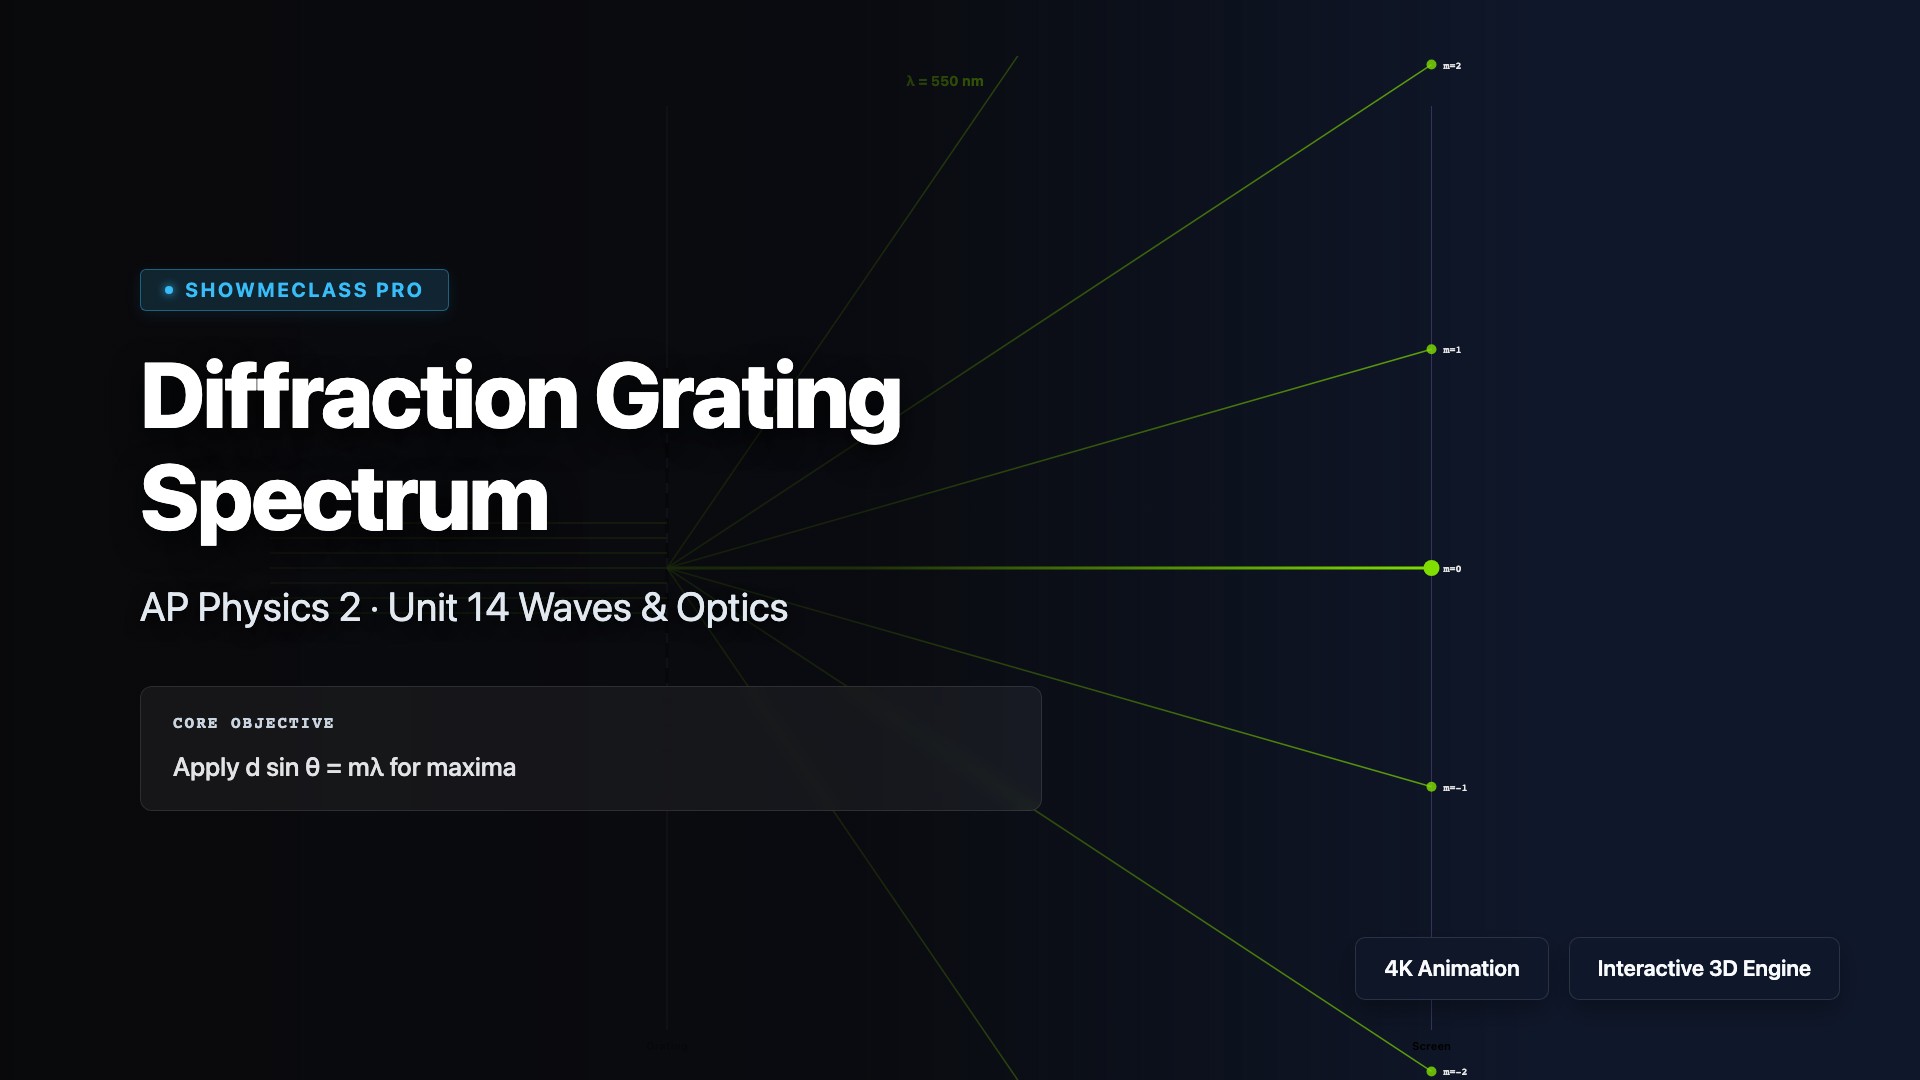
Diffraction Grating Spectrum
Visualize diffraction grating spectra with d sin θ = mλ. Adjust wavelength (color-coded), slit spacing, and max order to see angular positions of maxima.
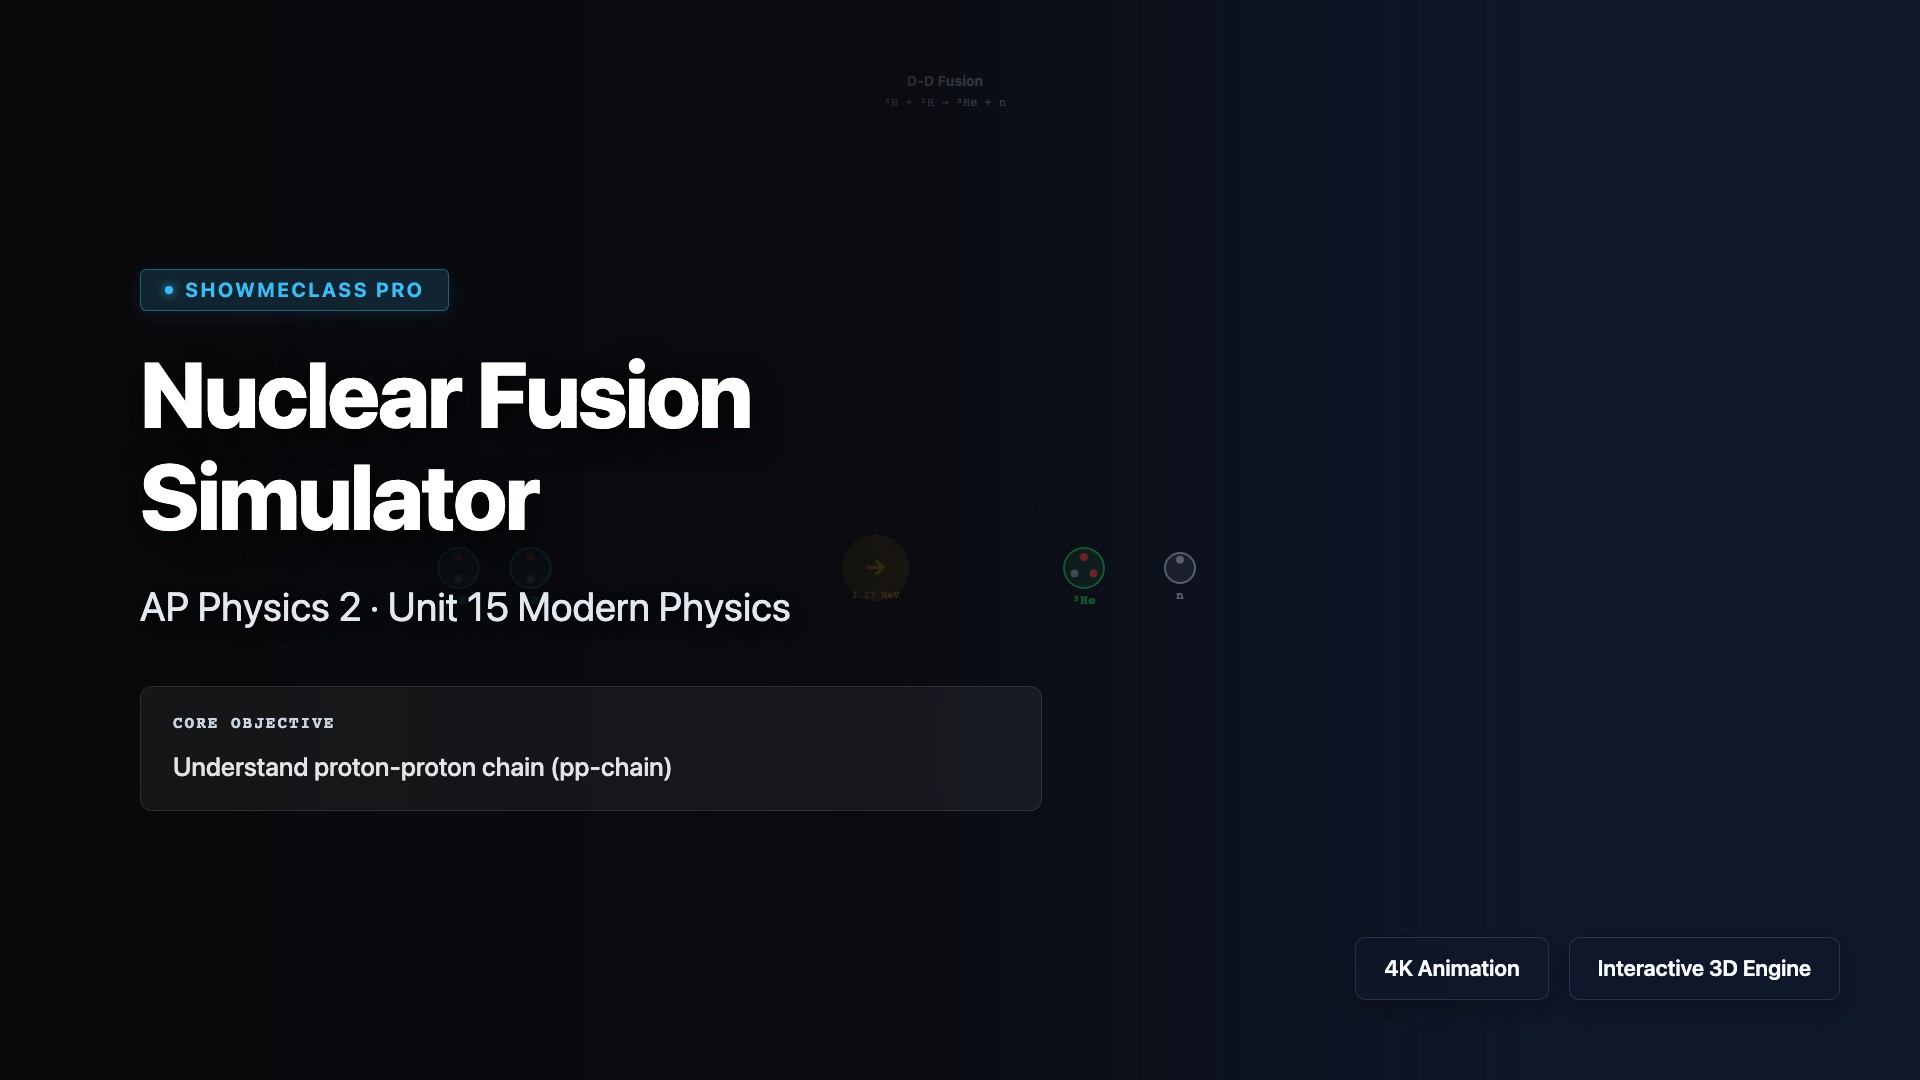
Nuclear Fusion Simulator
Animated D-D, D-T, and pp-chain fusion reactions. Shows nucleons, mass defect, energy release (MeV), and required temperature.
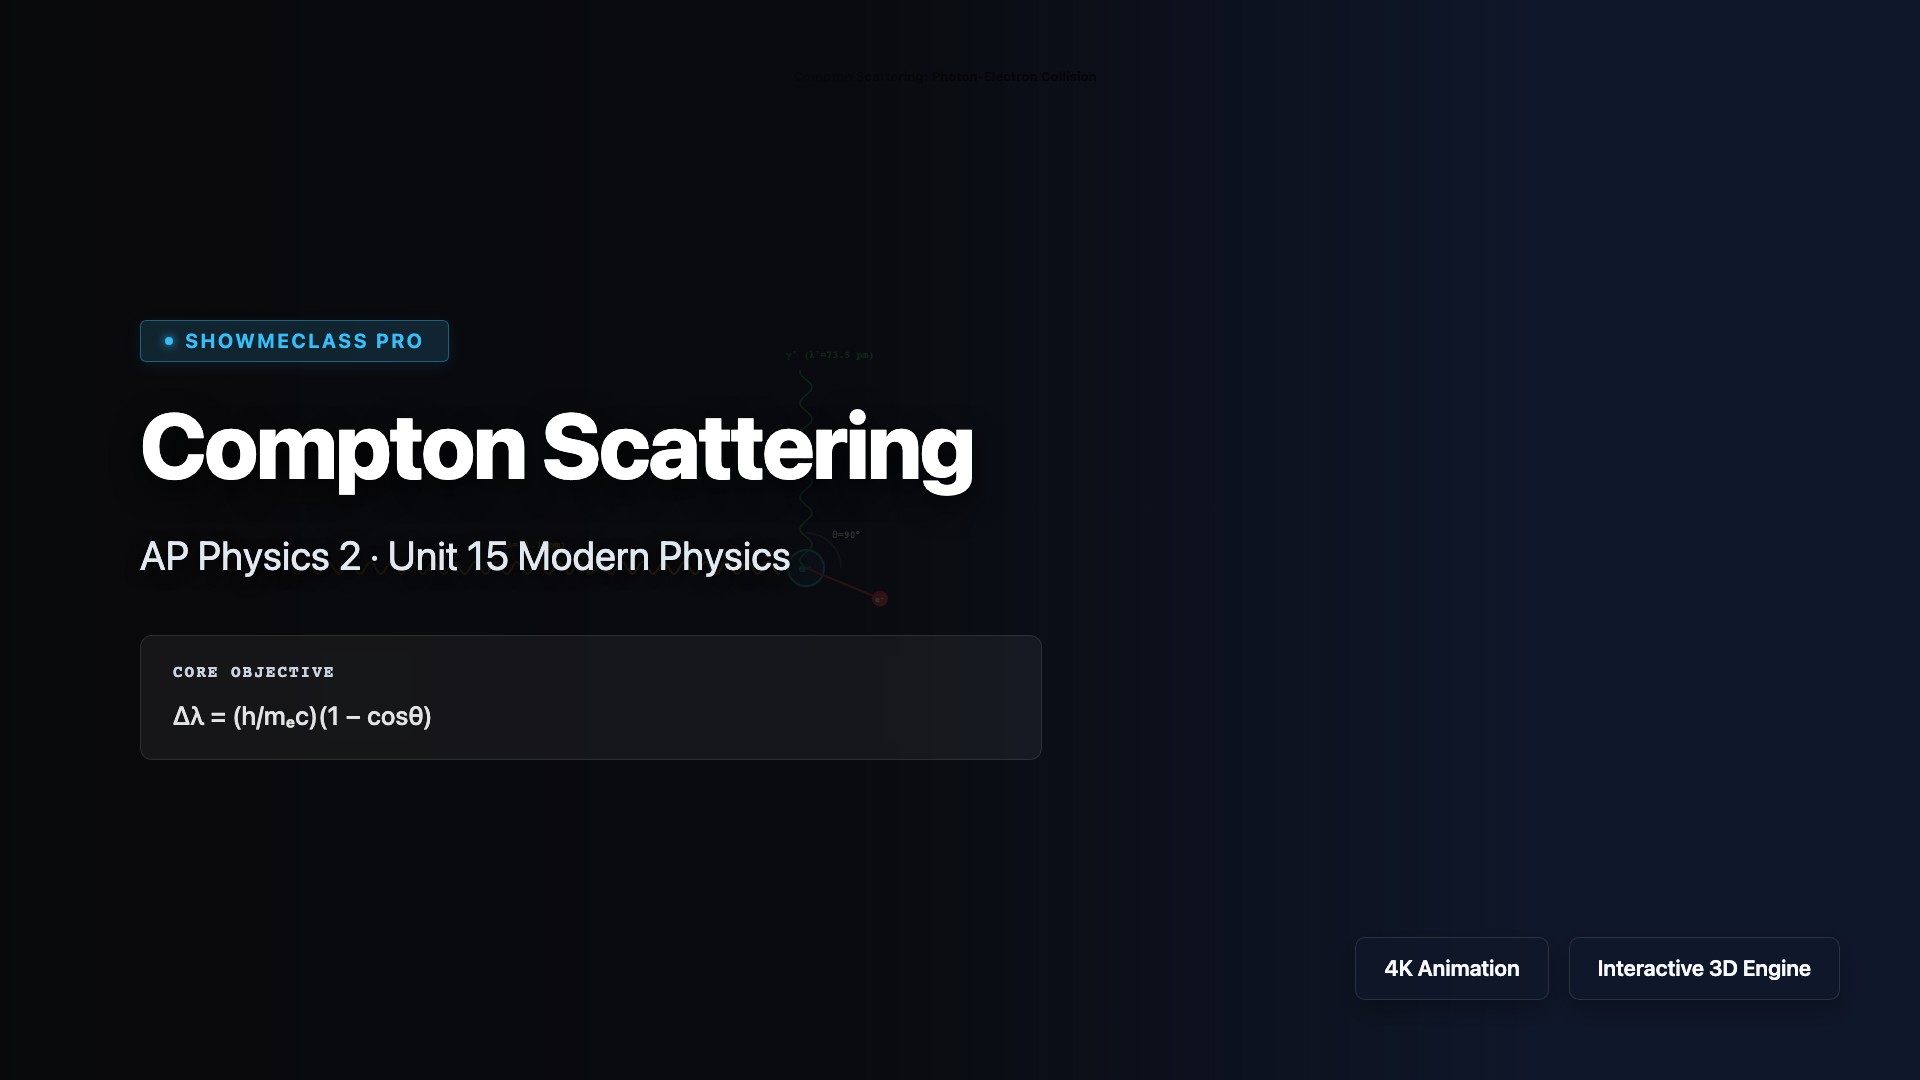
Compton Scattering Visualizer
Photon-electron collision with Δλ = λc(1−cosθ). Adjust angle and wavelength to see scattered photon, recoil electron, and energy transfer.
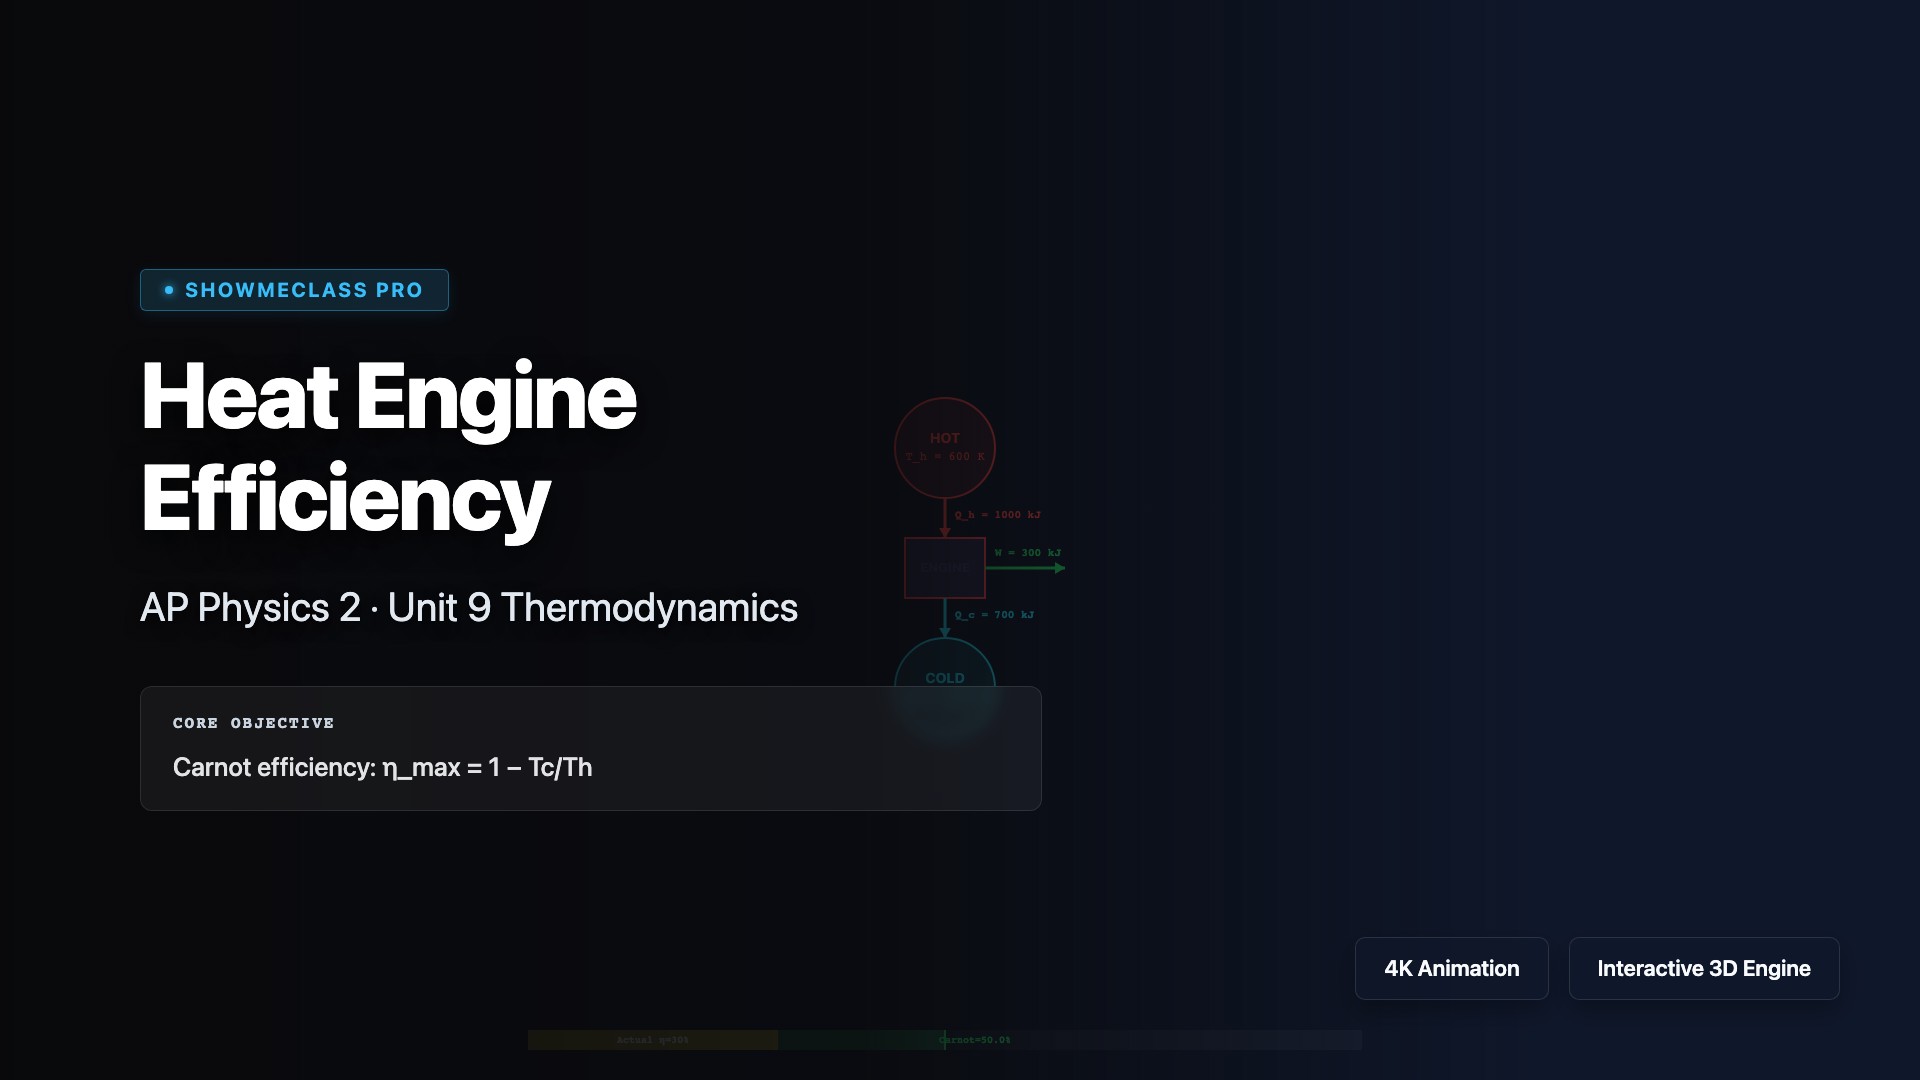
Heat Engine Efficiency Comparator
Carnot cycle efficiency diagram: η_max = 1−Tc/Th. Compare actual vs maximum efficiency with energy flow visualization. Impossibility warning when η > η_Carnot.
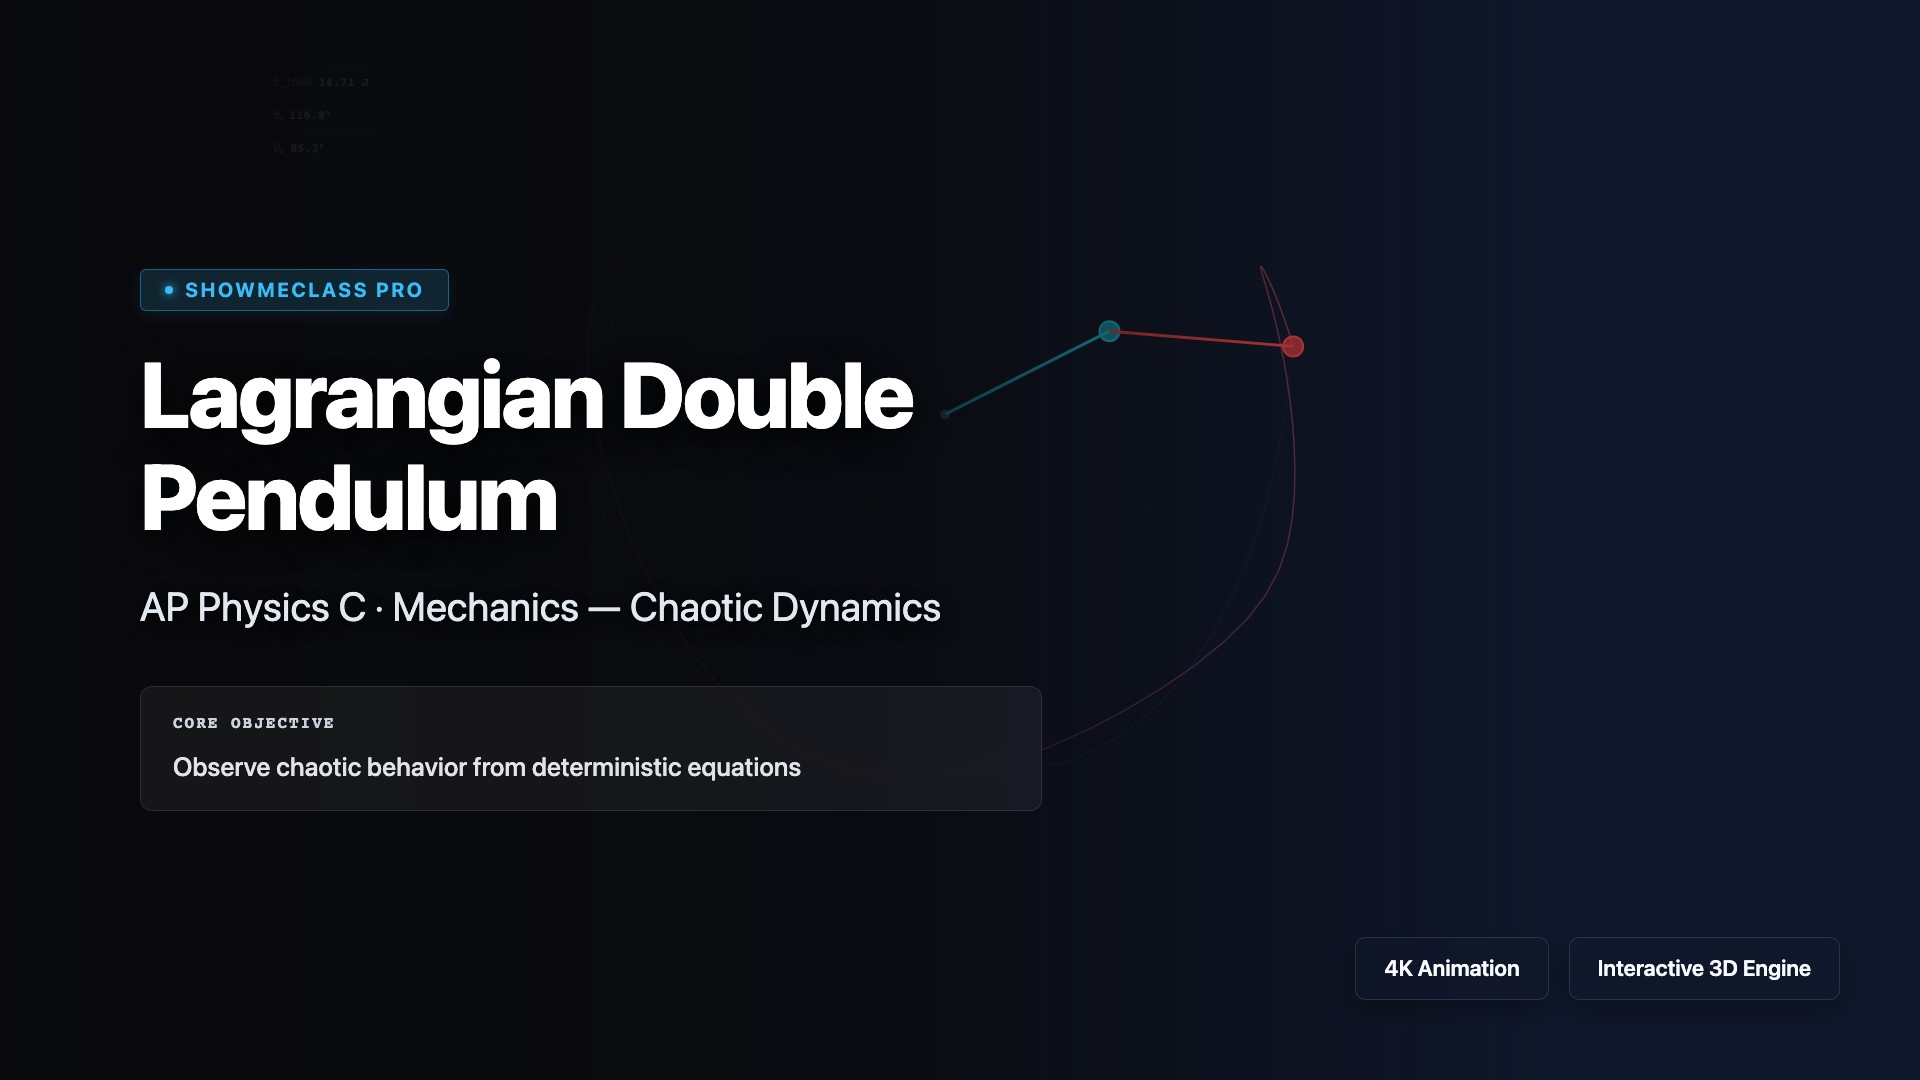
Lagrangian Double Pendulum
Simulate chaotic double pendulum motion using RK4 numerical integration of Lagrangian equations. Observe butterfly effect with adjustable initial angles, masses, and lengths.
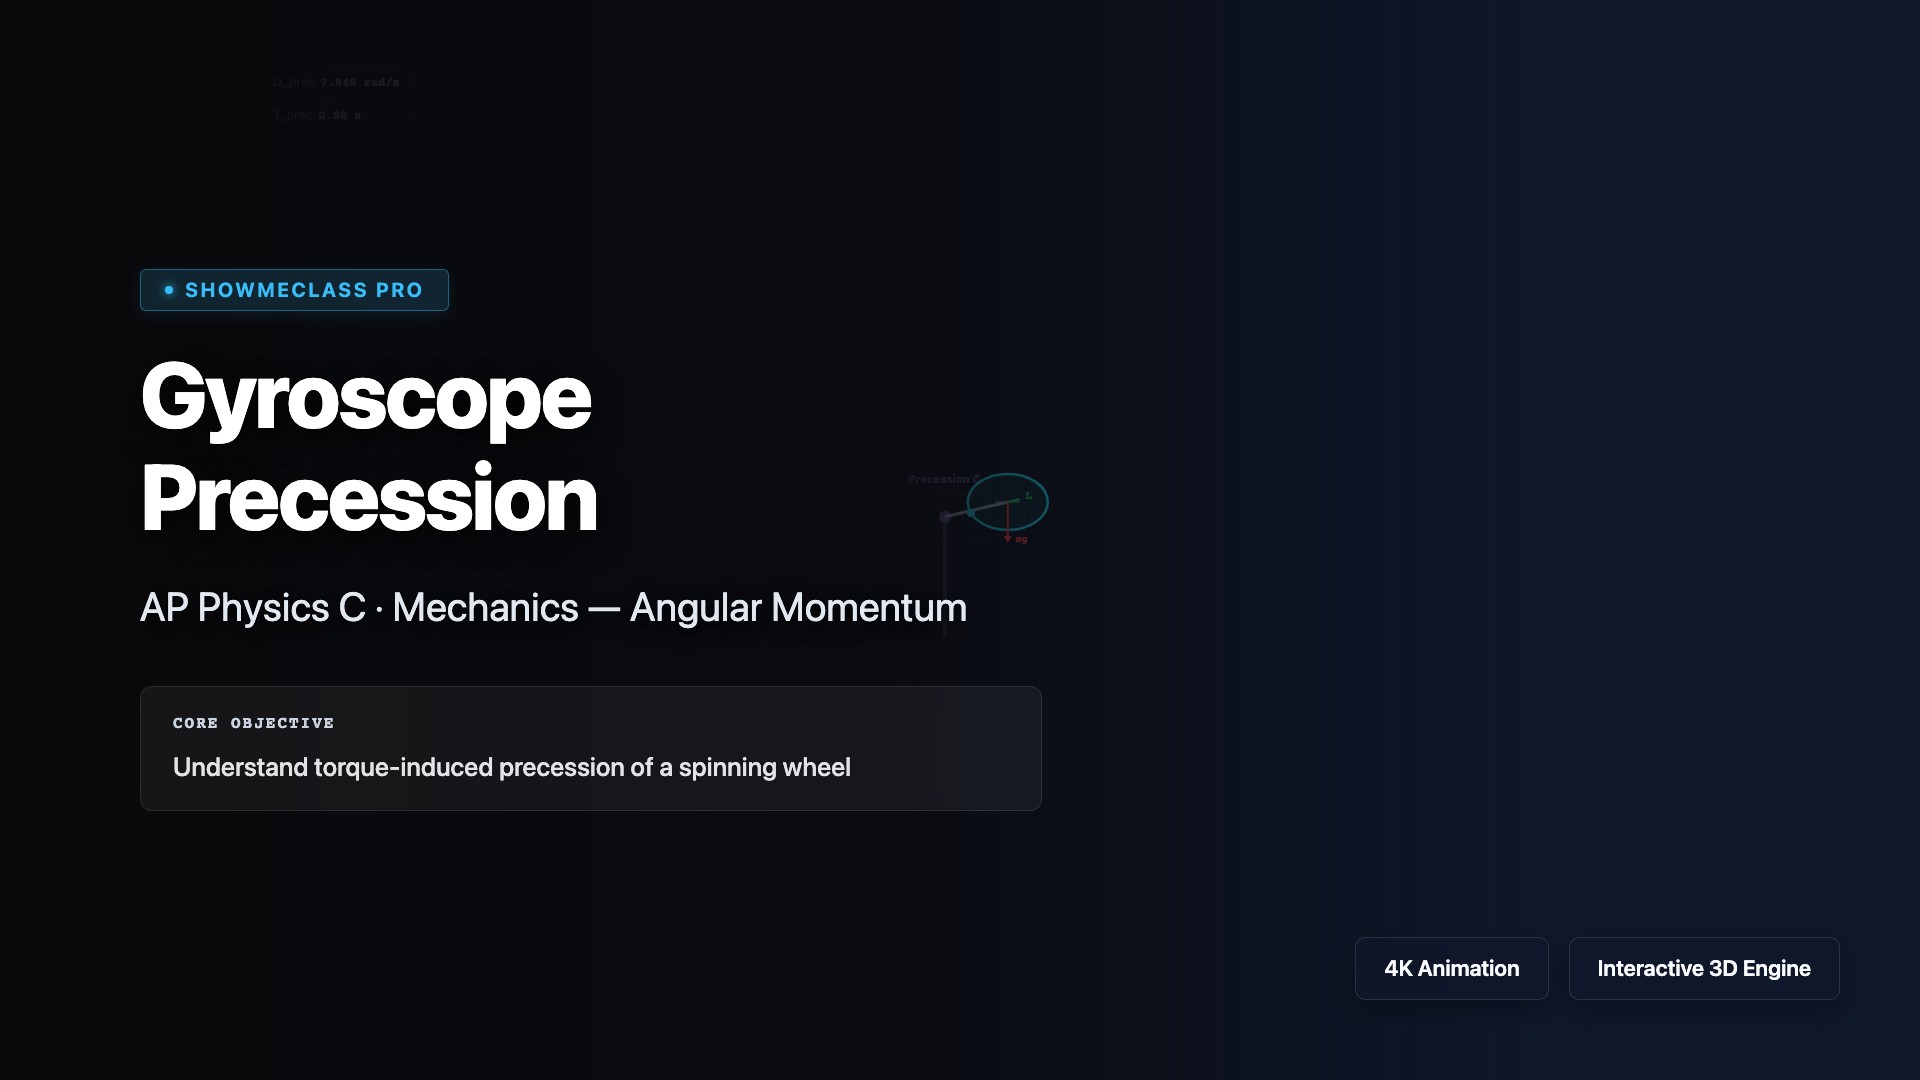
Gyroscope Precession
Visualize gyroscopic precession with adjustable spin speed, mass, arm length, and disk radius. See how Ω_prec = τ/(Iω) relates torque to angular momentum direction.
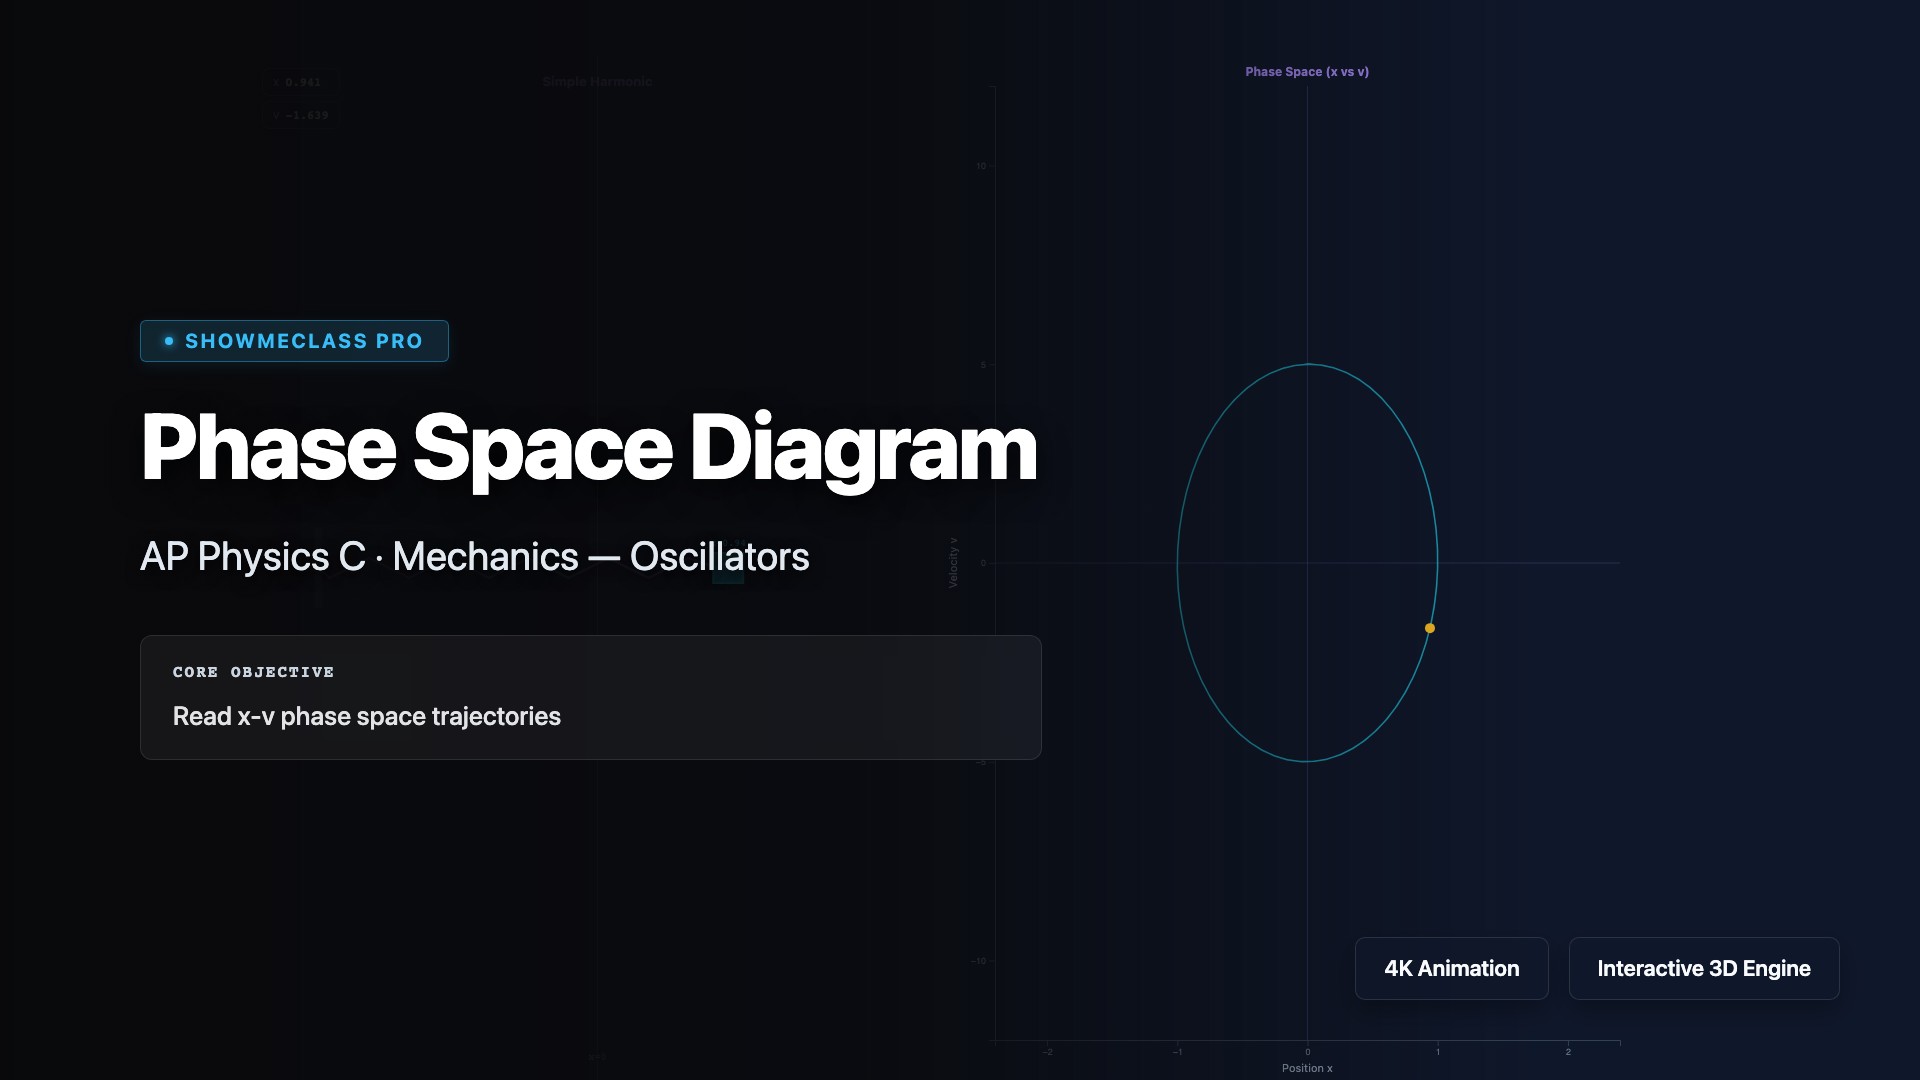
Phase Space Diagram (Oscillator)
Explore x-v phase space for SHM, underdamped, overdamped, and forced oscillators. Watch trajectories form ellipses, spirals, or limit cycles in real time.