Showing 12 results
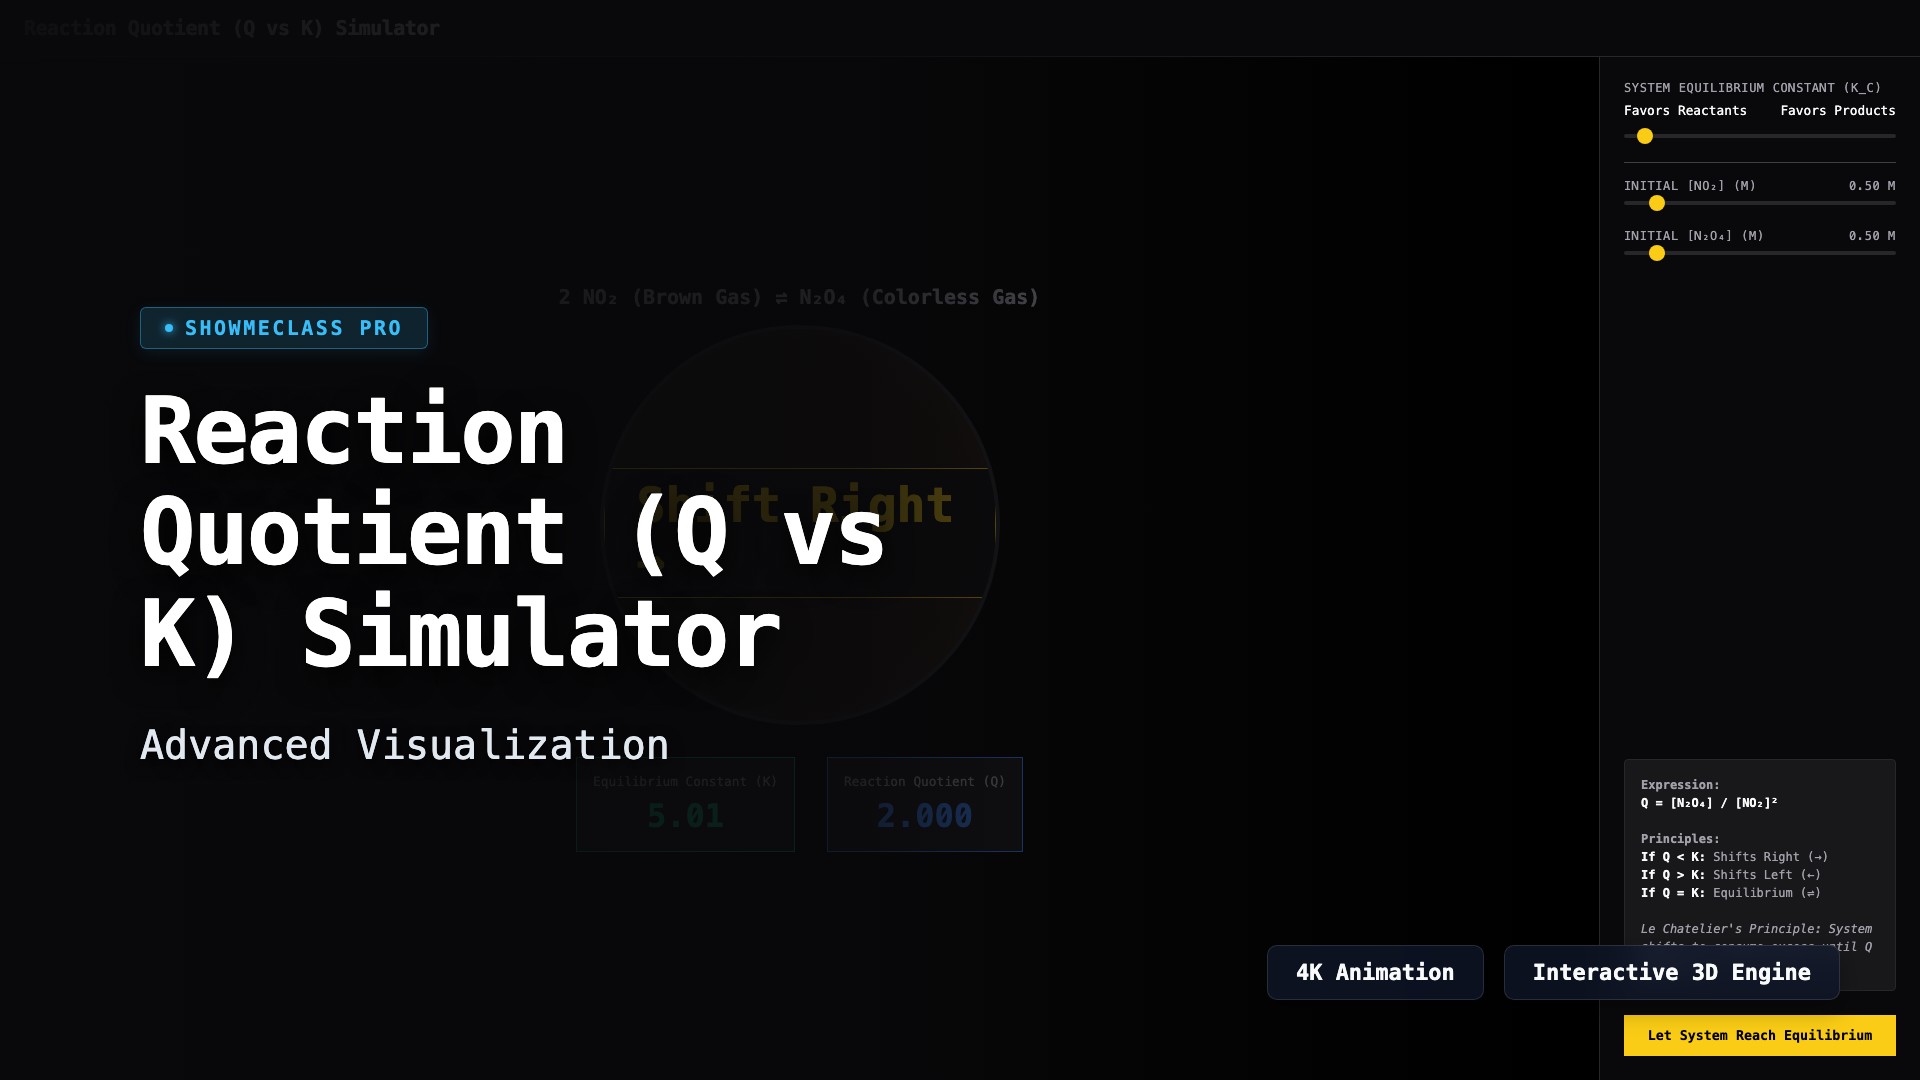
Reaction Quotient (Q vs K) Simulator
Determine the direction of equilibrium shifts using Le Chatelier's Principle. Visualize the theoretical NO2/N2O4 system and click to solve for roots to snap directly into theoretical dynamic equilibrium.
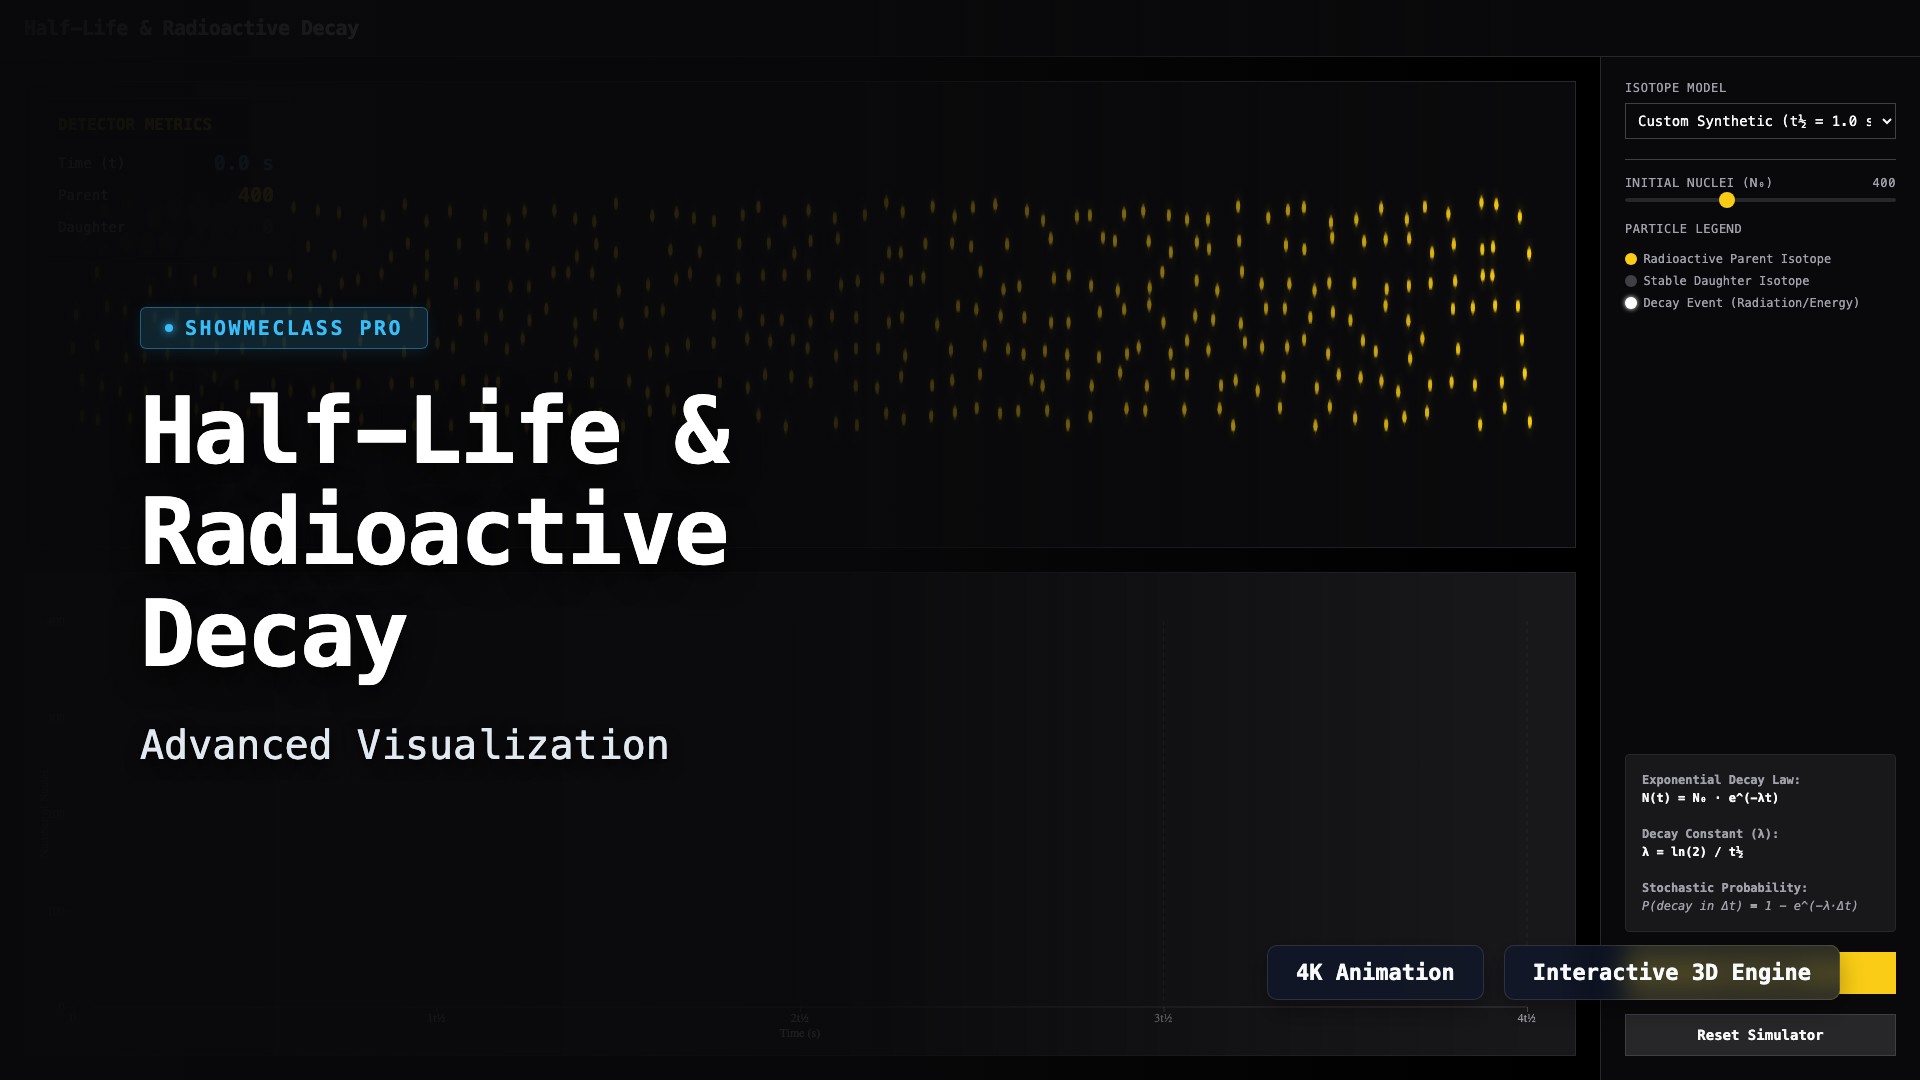
Half-Life & Radioactive Decay
Visualize stochastic exponential decay mapped against N(t) mathematical algorithms. Track Parent and Daughter isotope accumulation across customized half-lives in a real-time flashing particle engine.
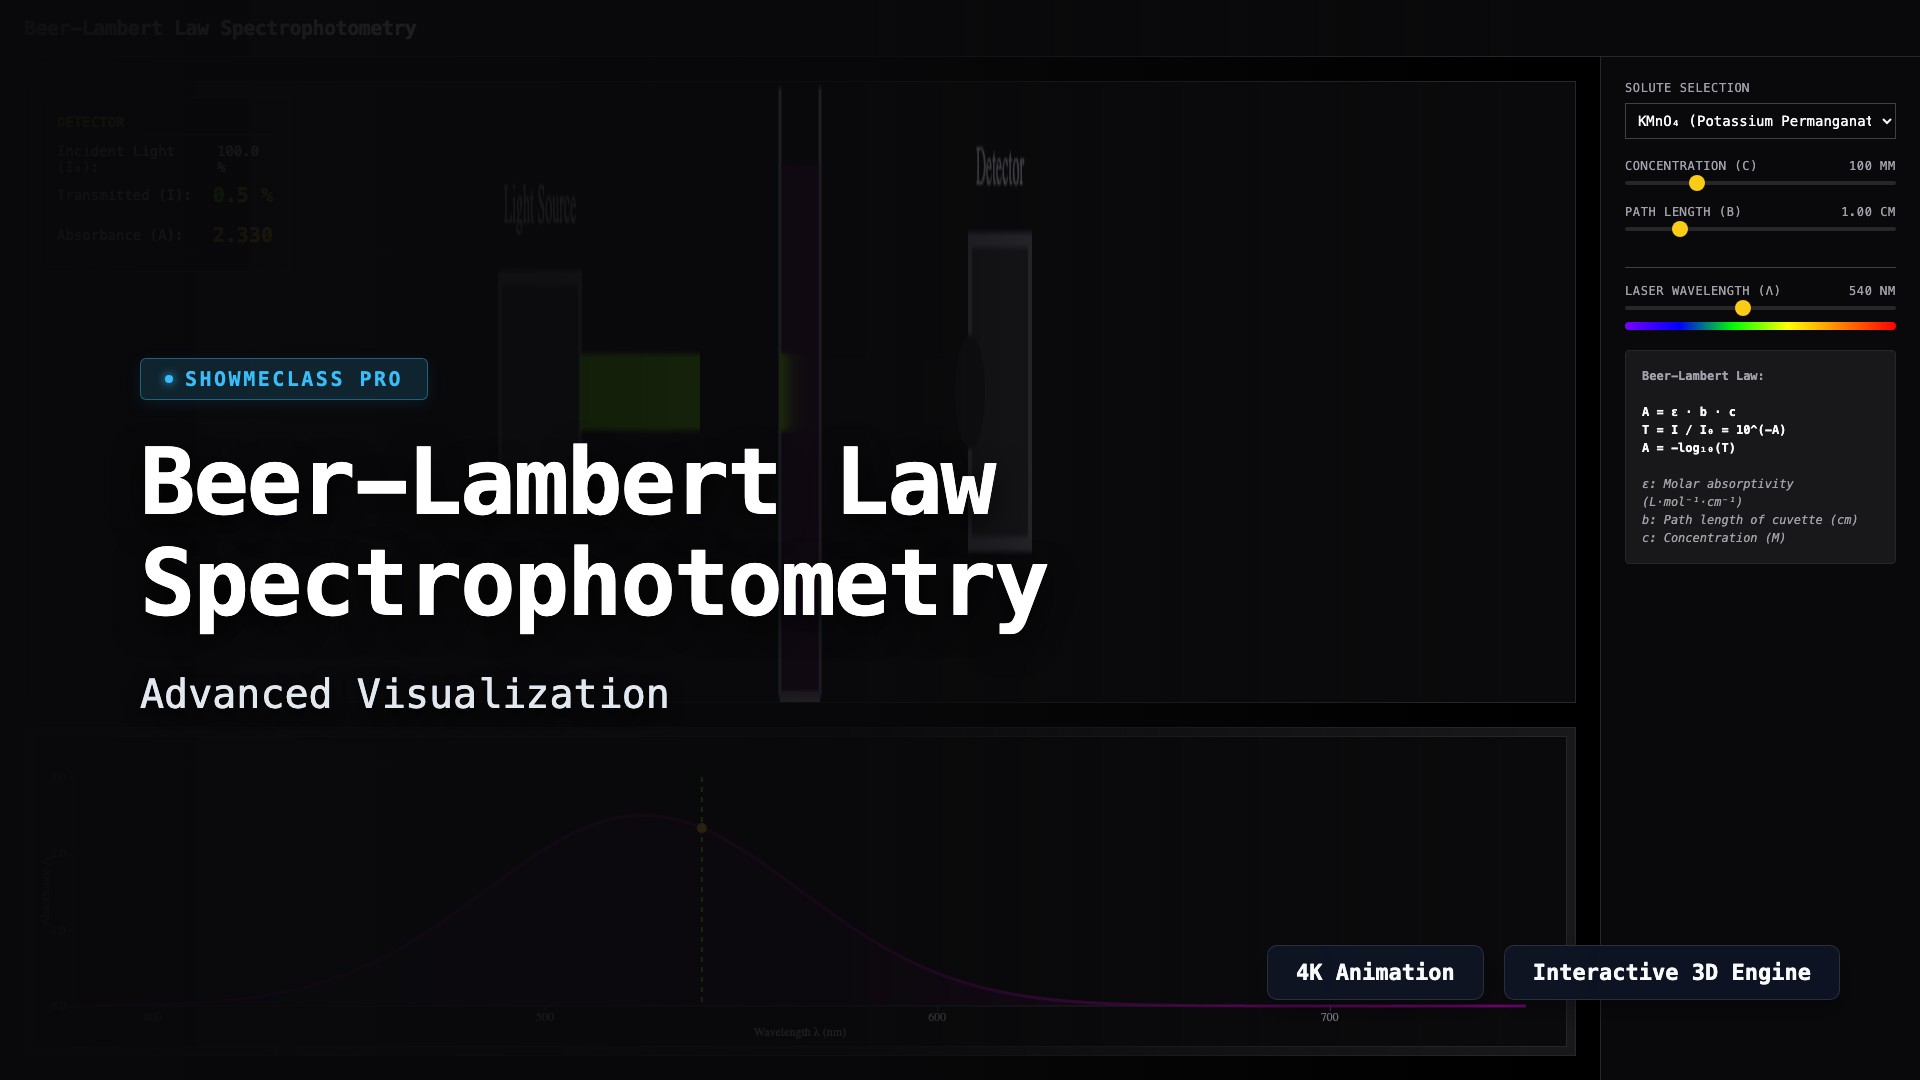
Beer-Lambert Law Spectrophotometry
Visualize the principles of spectrophotometry. Adjust wavelength, concentration, and cuvette path length to observe how light absorption changes dynamically according to the Beer-Lambert Law.
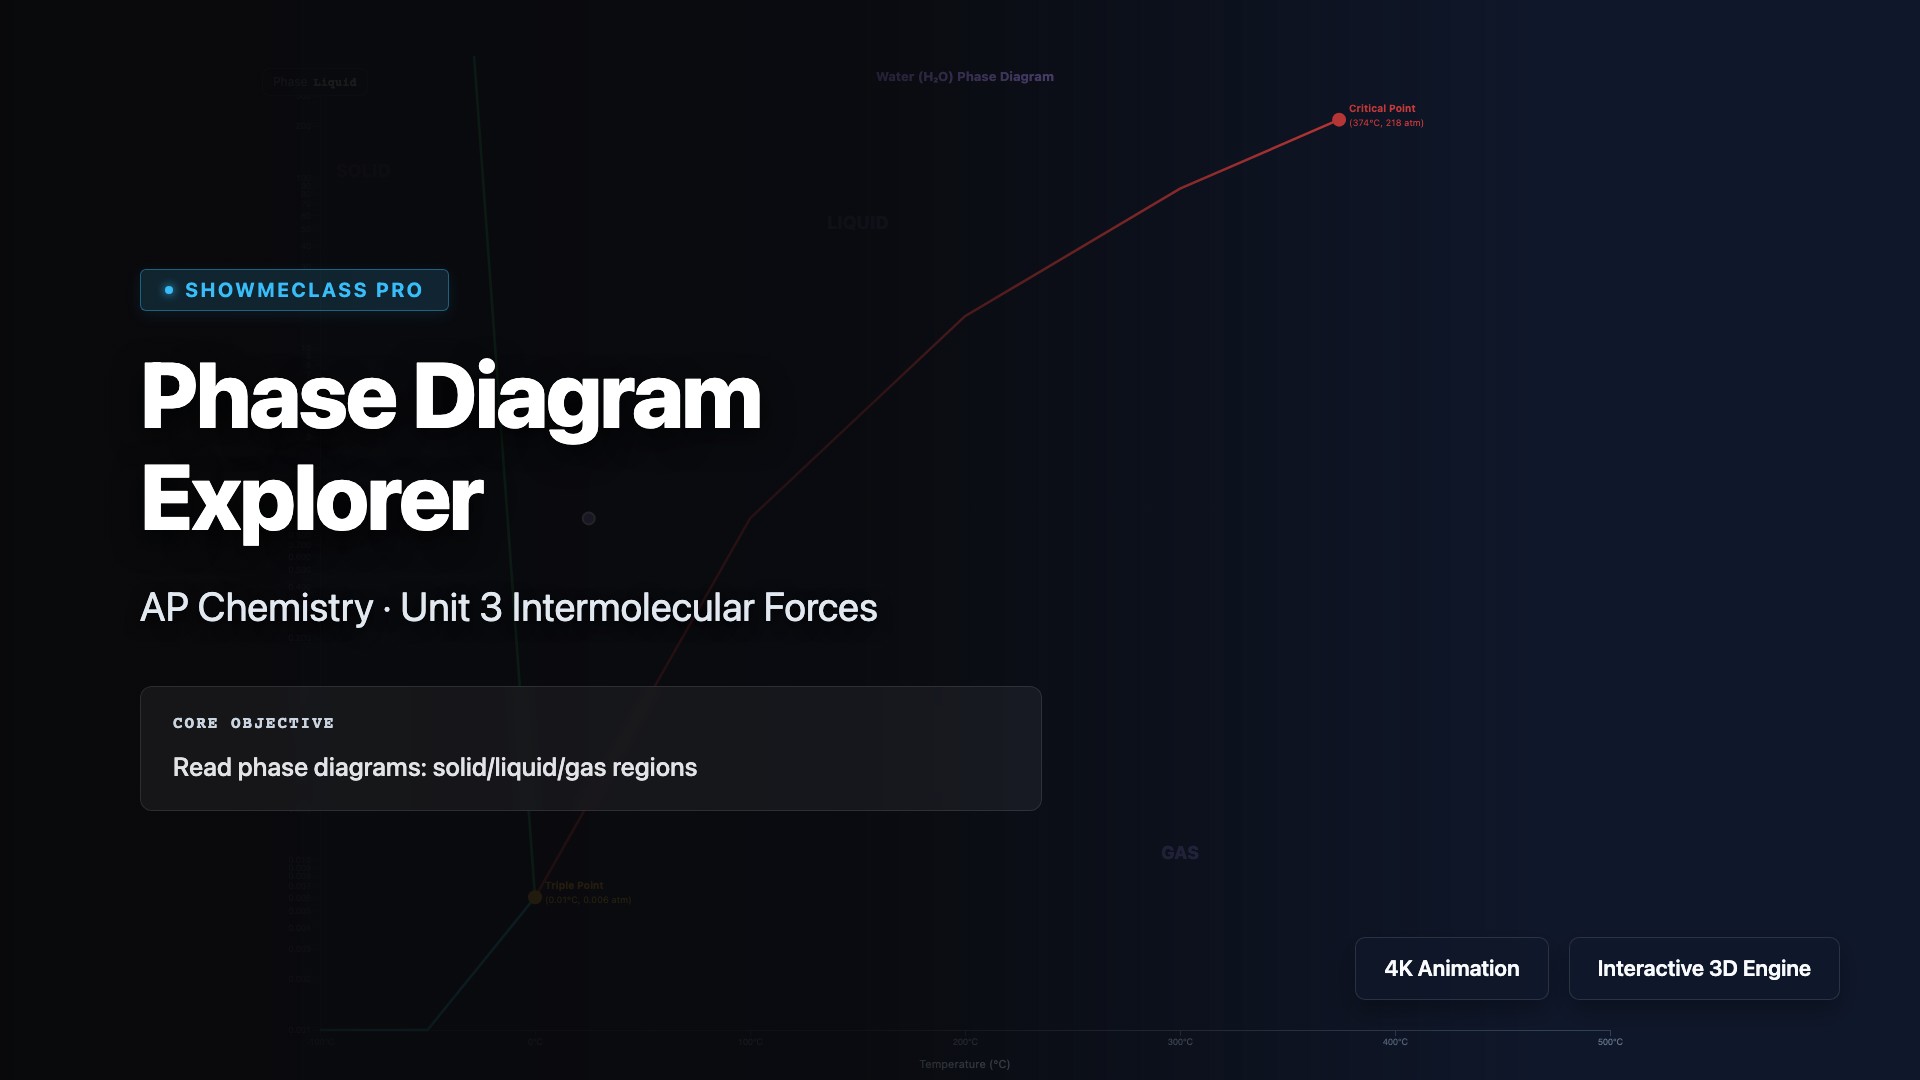
Phase Diagram Explorer
Interactive phase diagrams for H₂O and CO₂. Explore triple points, critical points, and supercritical fluid regions. Identify the phase at any T,P coordinate.

VSEPR Molecular Geometry
Explore 3D molecular geometries for common electron-domain configurations. Rotate and inspect tetrahedral, trigonal planar, linear, octahedral, and bent structures. Understand how lone pairs distort ideal bond angles.
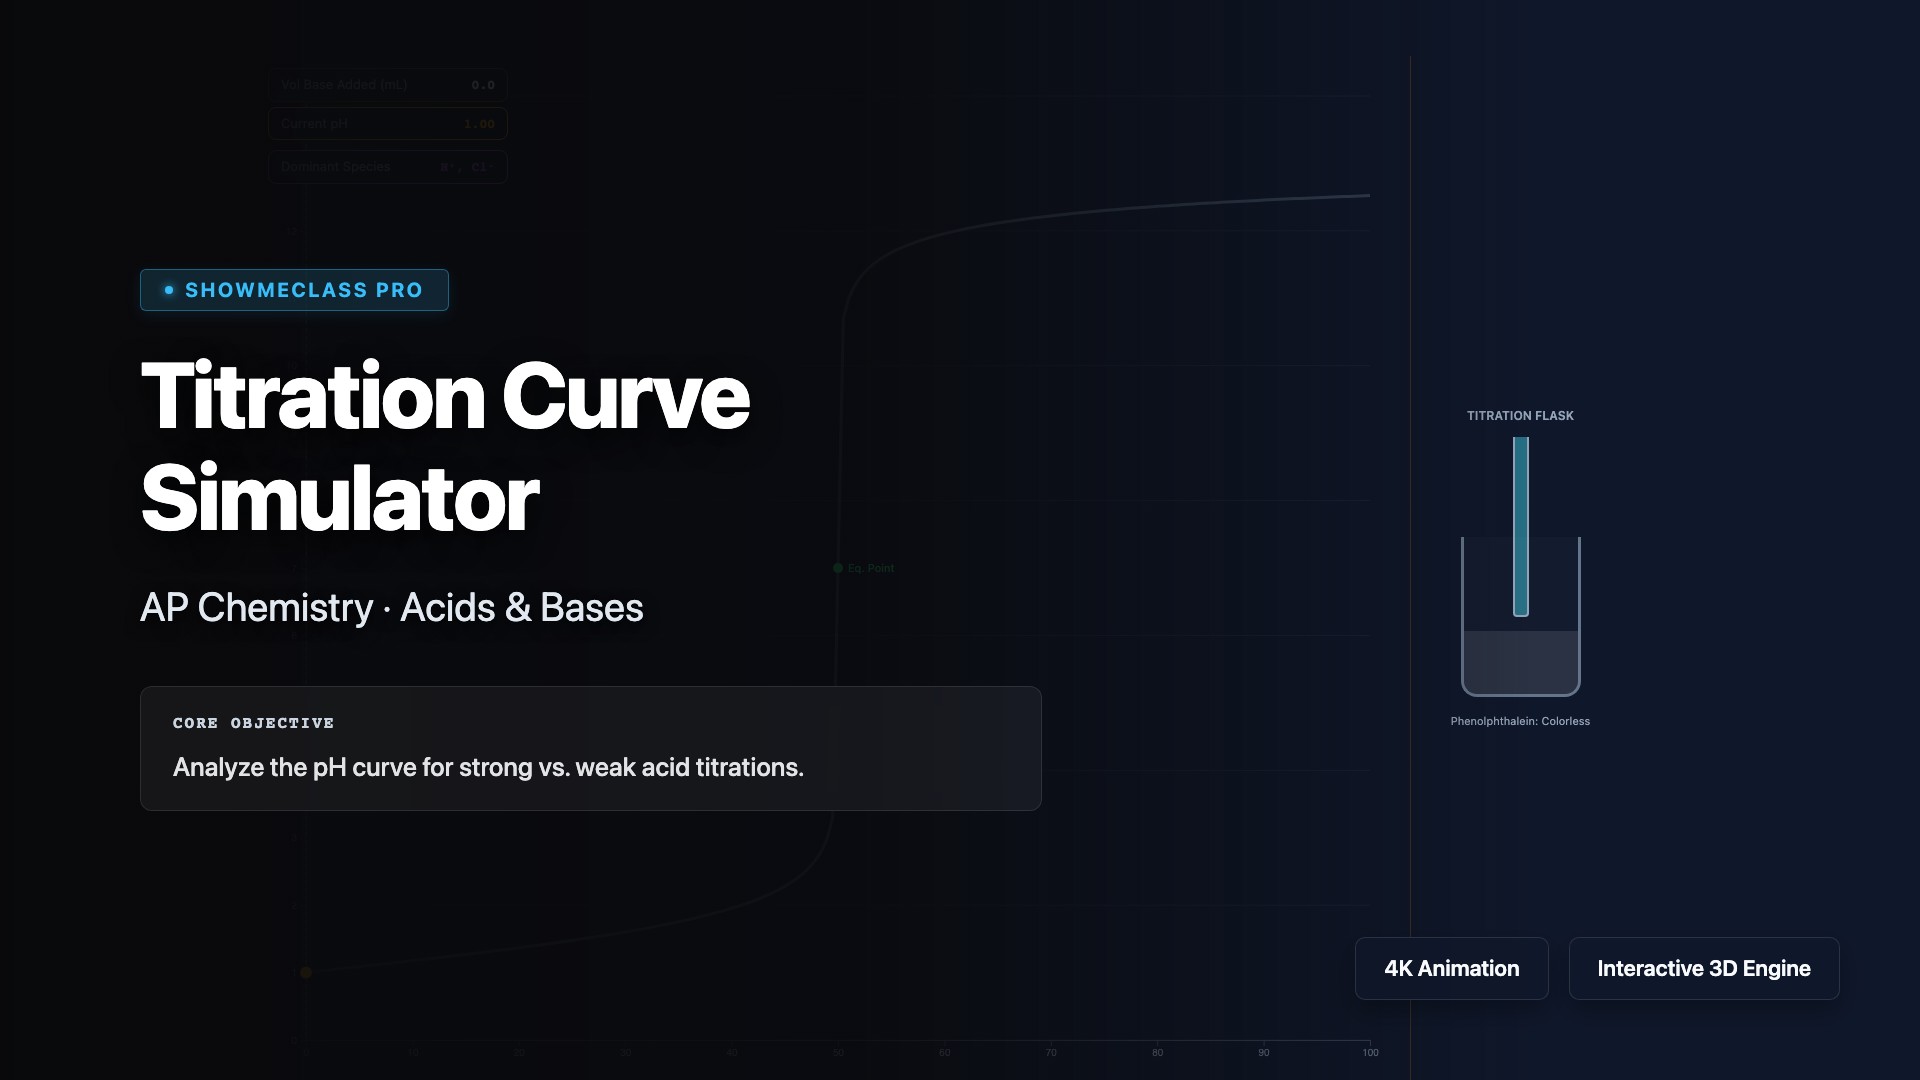
Titration Curve Simulator
Simulate acid-base titrations and analyze pH curves for strong-strong, weak-strong, and polyprotic titrations. Visualize how pH changes as titrant is added, identify equivalence points, buffer regions, and half-equivalence points where pH = pKa. Understand the Henderson-Hasselbalch equation, calculate buffer capacity, and select appropriate indicators based on their pKa values and the pH at equivalence.
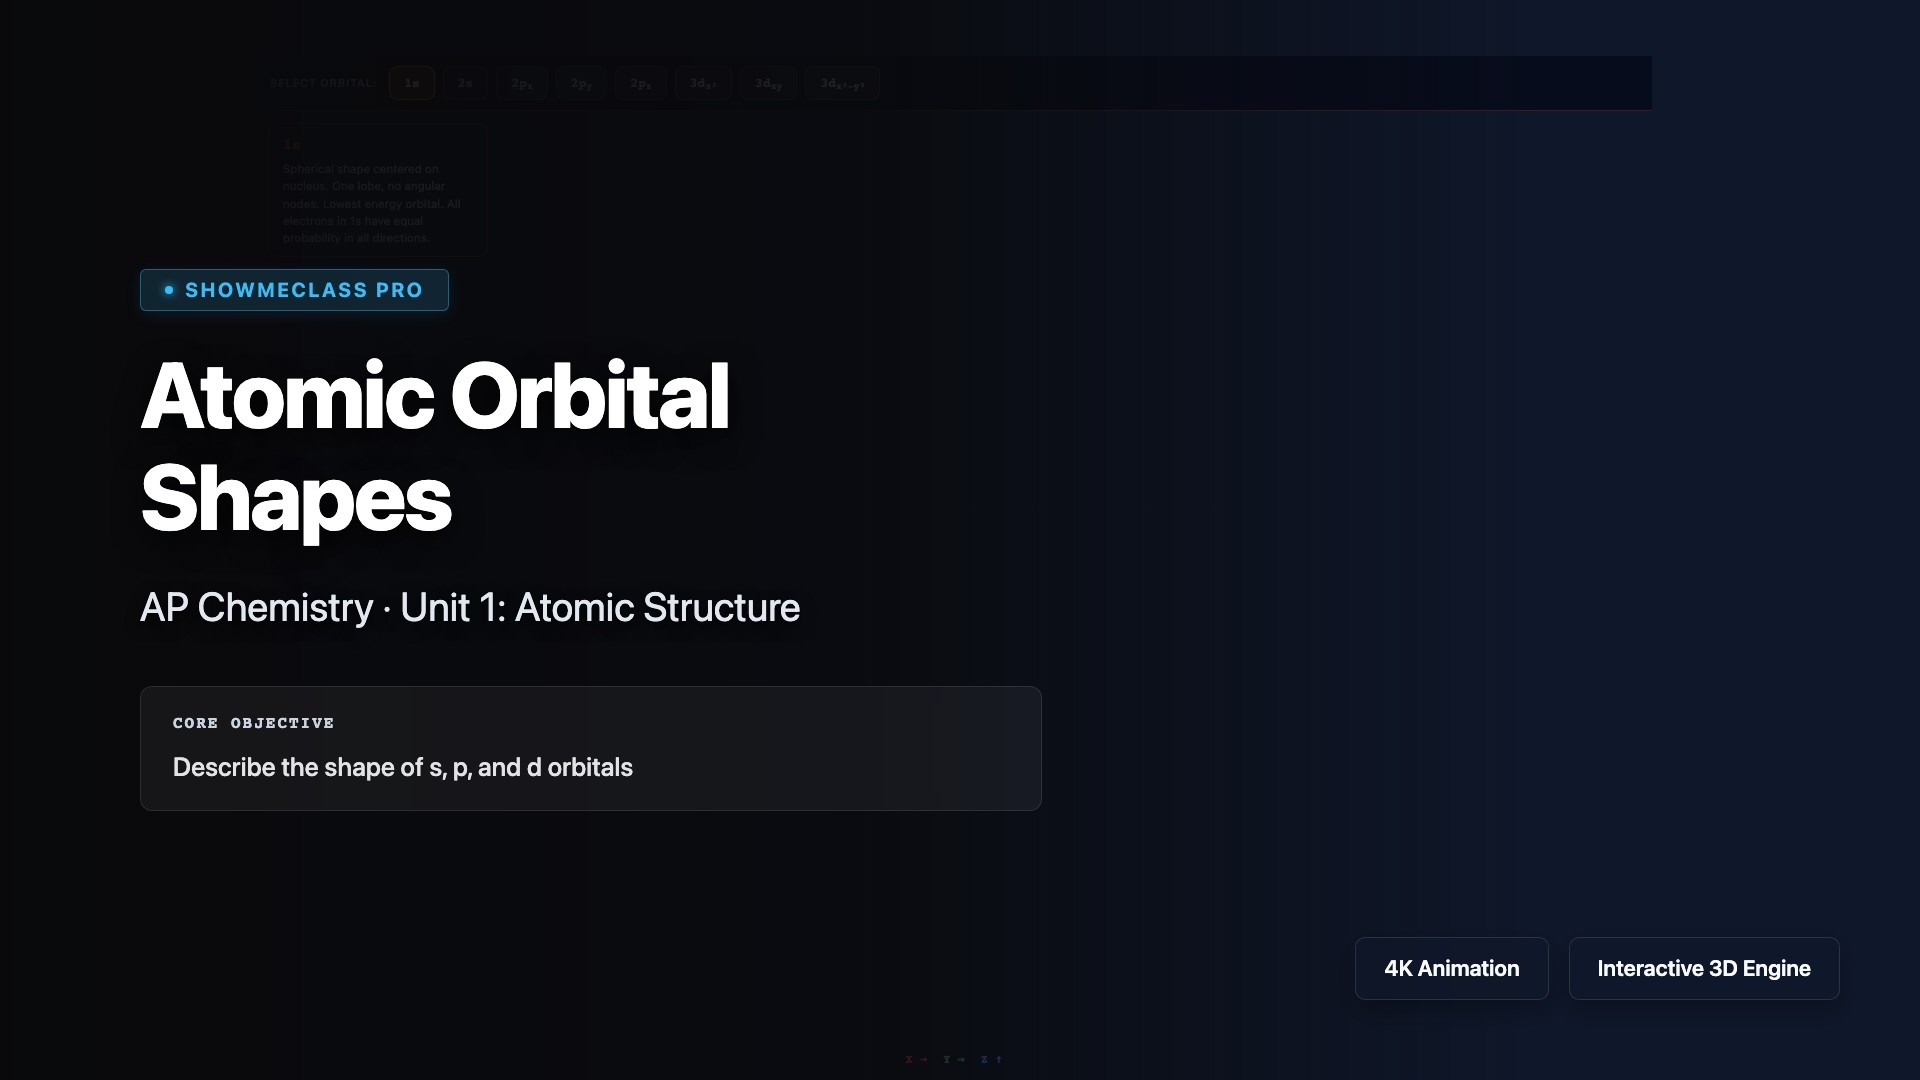
Atomic Orbital Shapes
Visualize the three-dimensional shapes of atomic orbitals (s, p, d, and f) that describe the probability distribution of electrons around the nucleus. Explore how quantum numbers (n, l, mₗ, mₛ) define orbital characteristics including energy level, shape, orientation, and electron spin. Understand the relationship between orbital shapes and chemical bonding, electron configuration, and the periodic table structure.
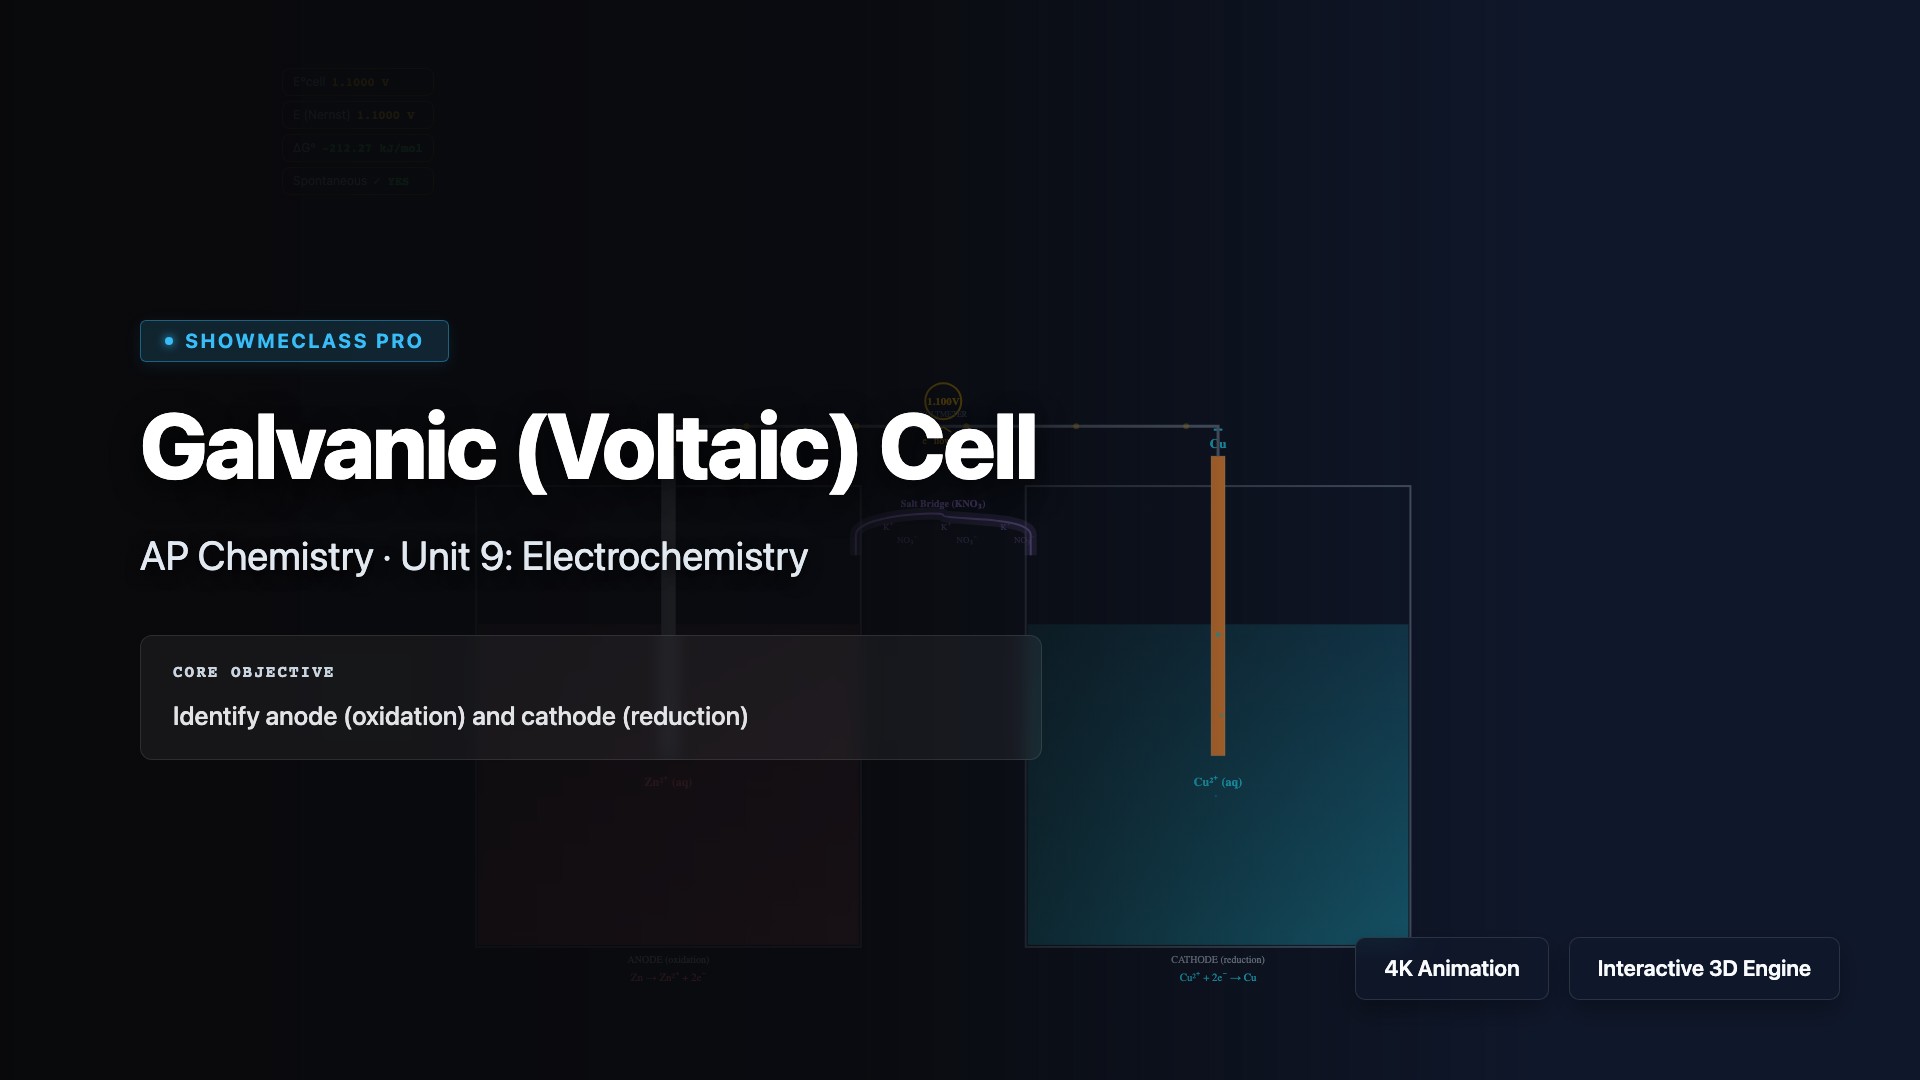
Galvanic (Voltaic) Cell
Explore galvanic (voltaic) cells that convert chemical energy into electrical energy through spontaneous redox reactions. Visualize electron flow from anode (oxidation) to cathode (reduction), ion movement through the salt bridge, and calculate cell potential using E°cell = E°cathode - E°anode. Understand the Nernst equation, concentration effects on voltage, and applications in batteries and fuel cells.
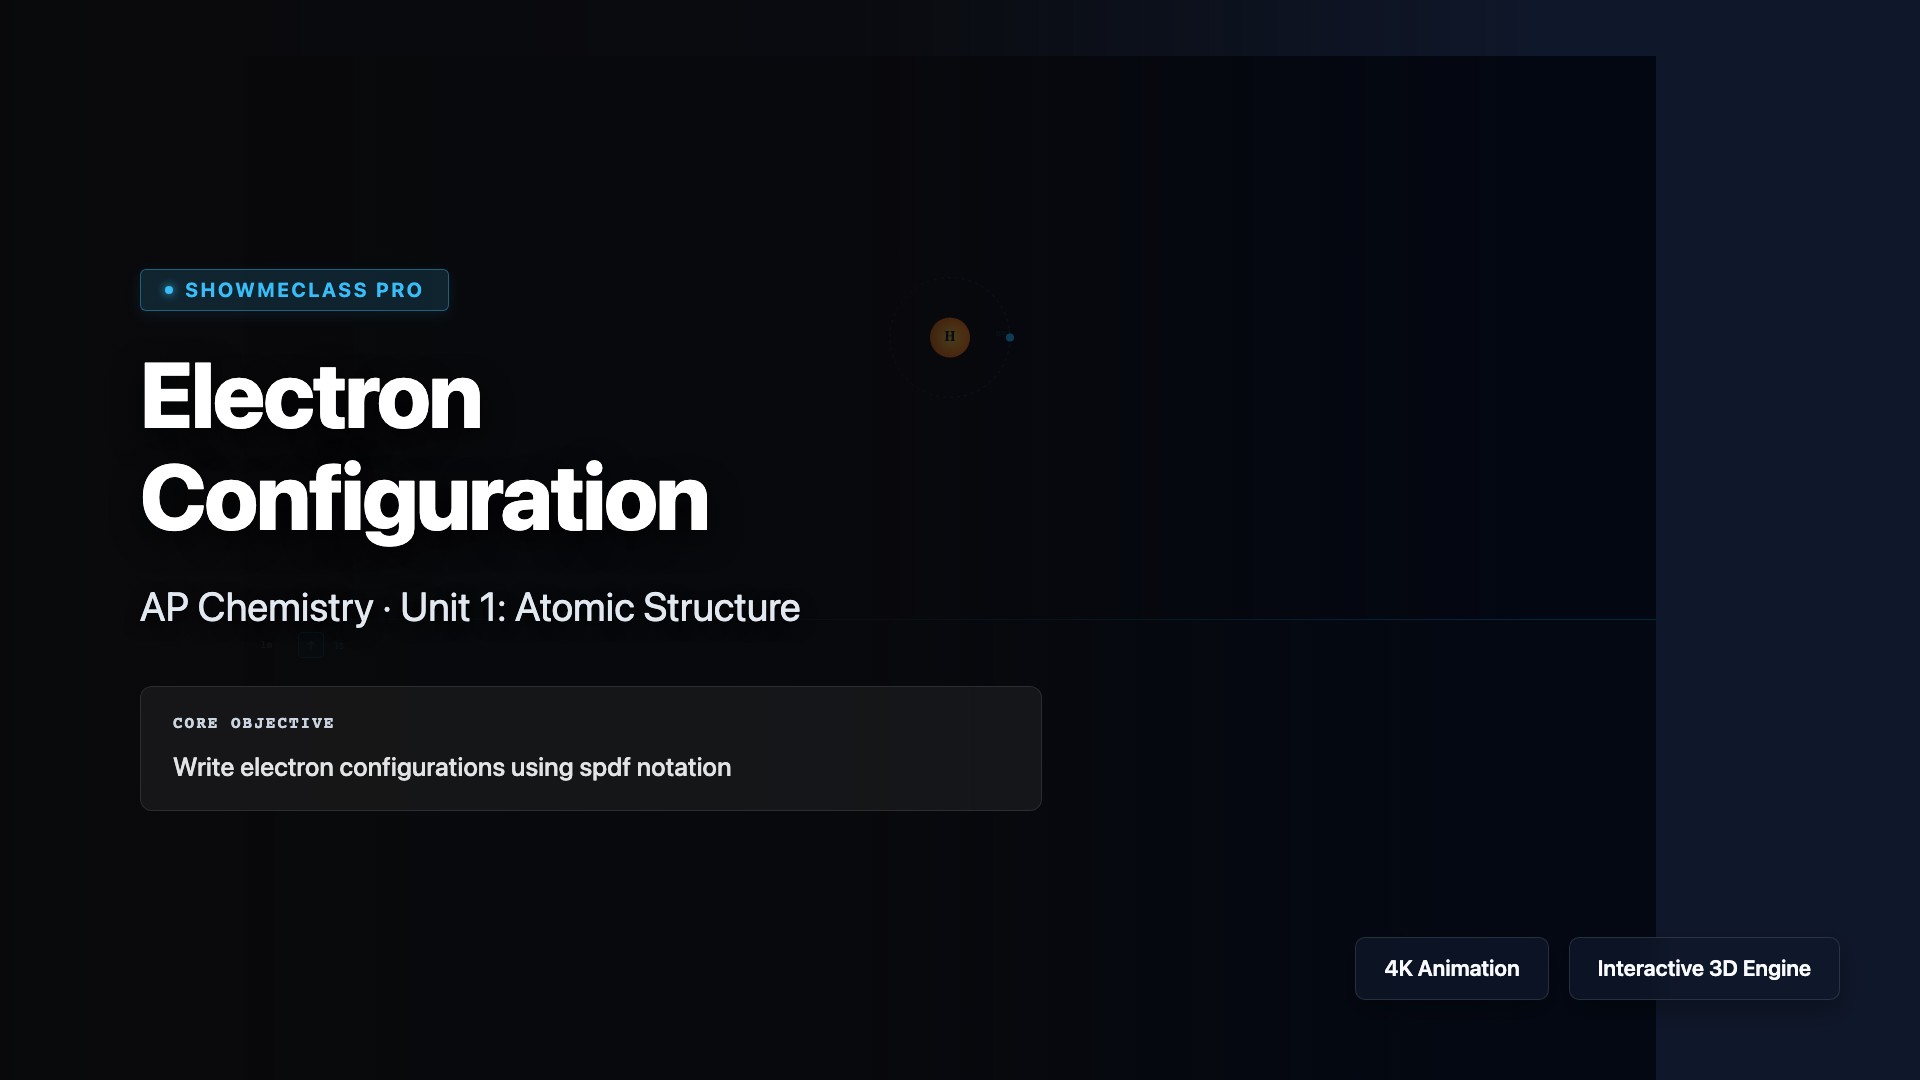
Electron Configuration
Build electron configurations for atoms and ions using the Aufbau principle, Hund's rule, and the Pauli exclusion principle. Visualize how electrons fill orbitals in order of increasing energy (1s, 2s, 2p, 3s, 3p, 4s, 3d...), understand noble gas notation shortcuts, and identify valence electrons. Explore exceptions like chromium and copper, and connect electron configuration to periodic trends and chemical reactivity.
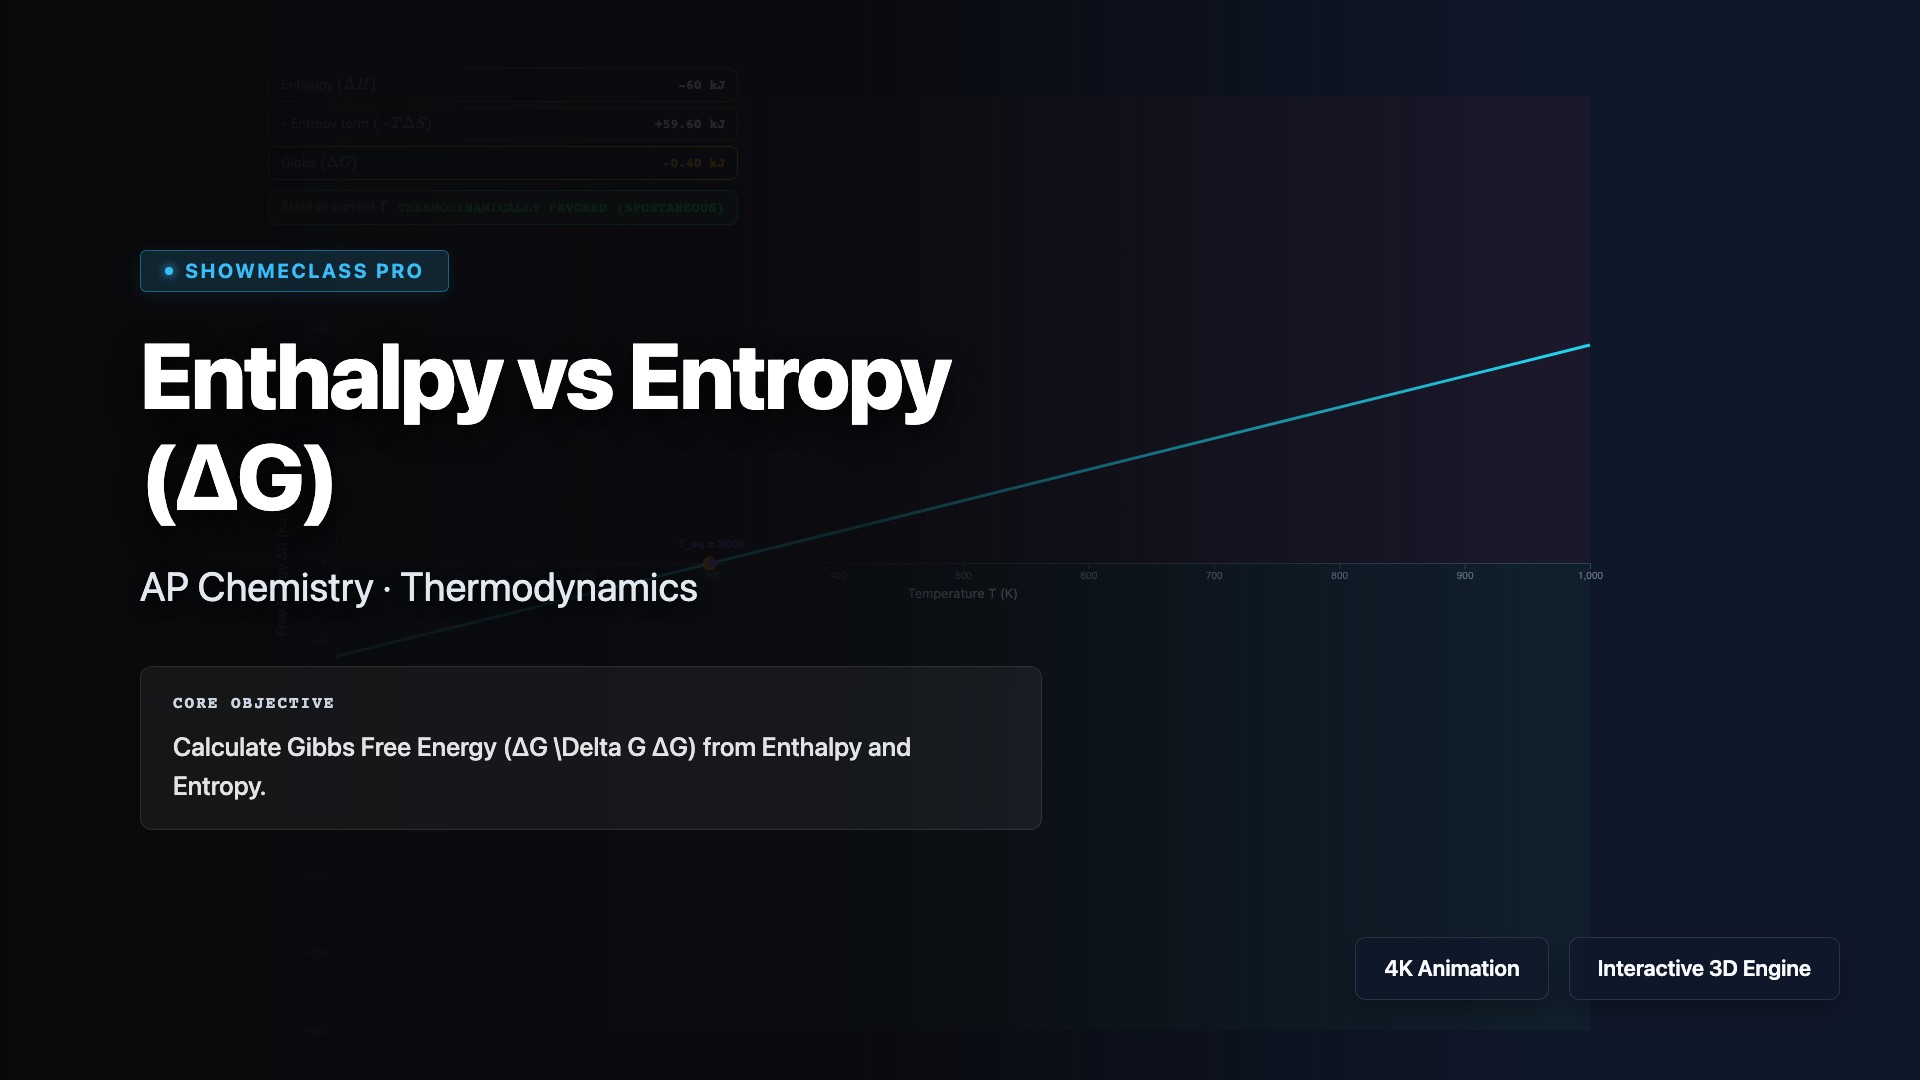
Enthalpy vs Entropy (ΔG)
Explore the relationship between enthalpy (ΔH), entropy (ΔS), and Gibbs free energy (ΔG) using the equation ΔG = ΔH - TΔS. Understand how temperature affects spontaneity: exothermic reactions with increasing entropy are always spontaneous, while endothermic reactions with decreasing entropy are never spontaneous. Visualize how ΔG < 0 indicates spontaneous processes, ΔG = 0 represents equilibrium, and ΔG > 0 means non-spontaneous reactions.
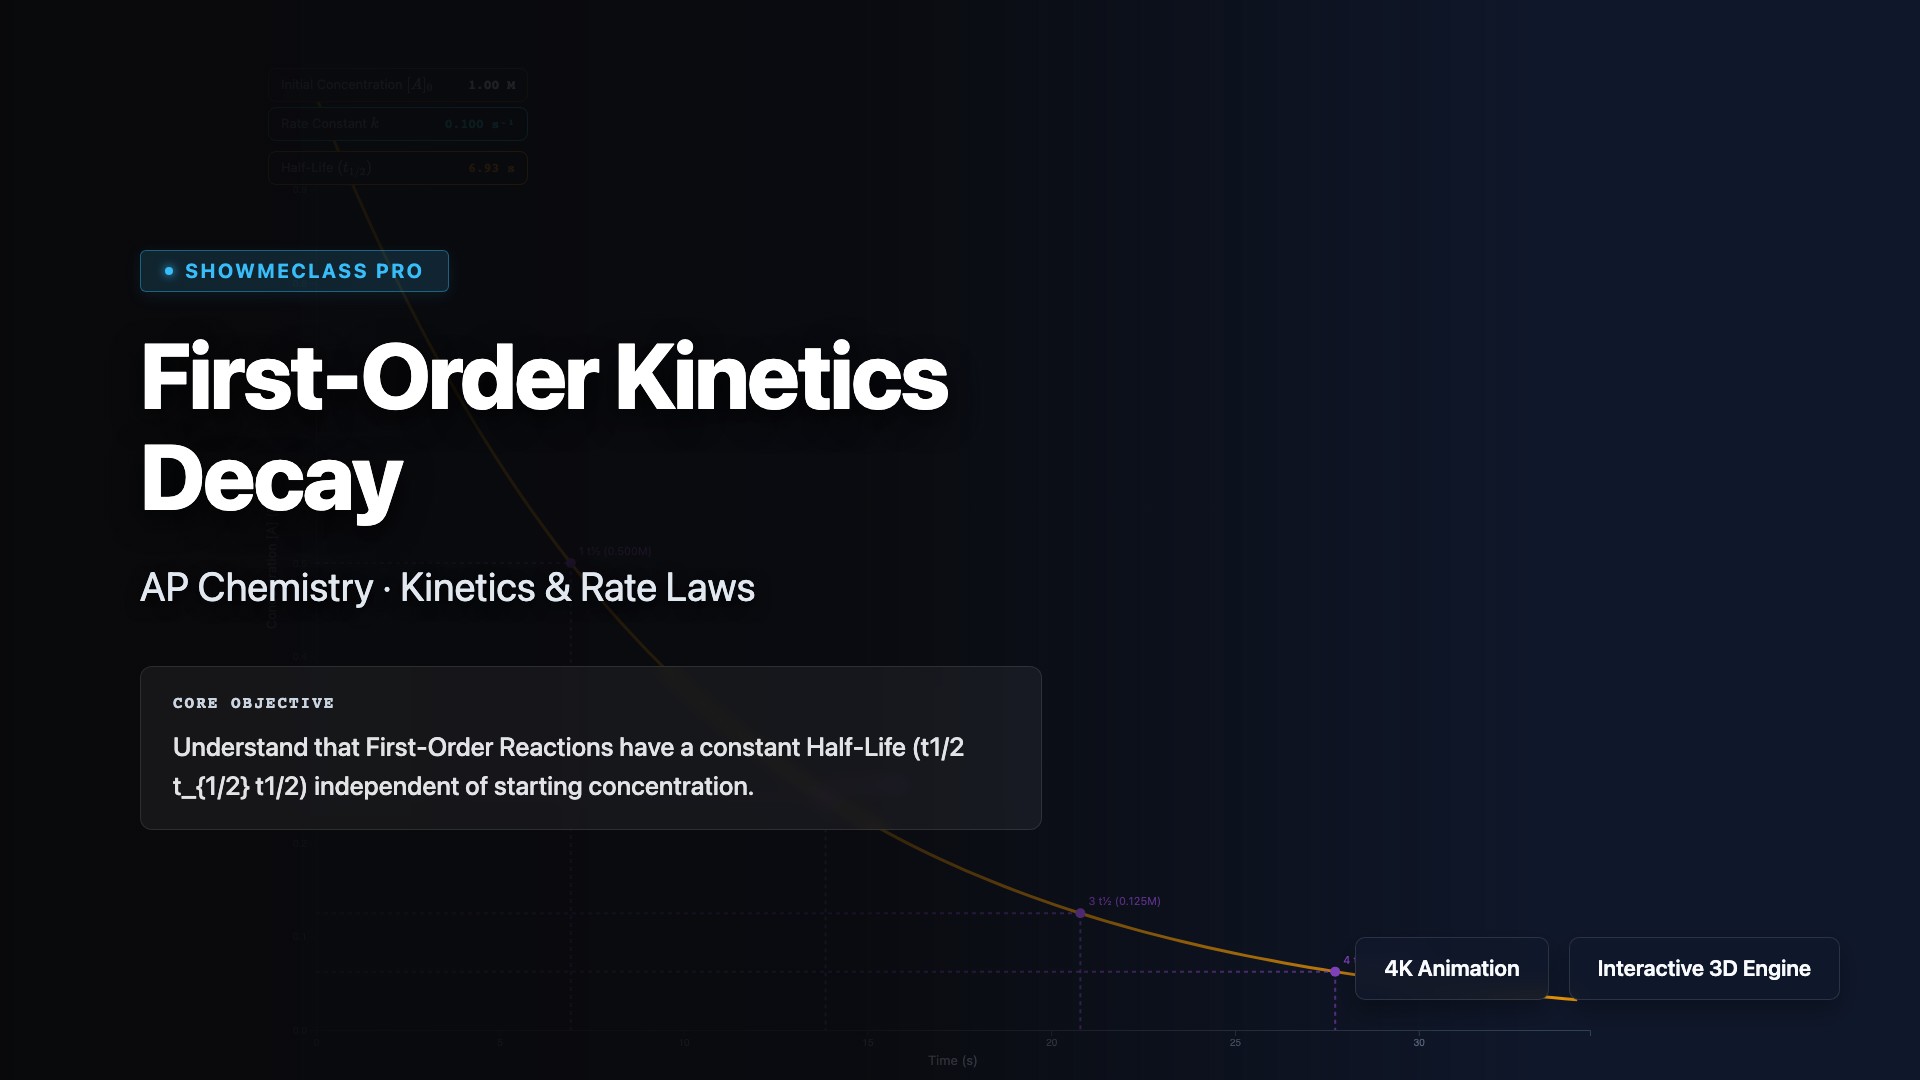
First-Order Kinetics Decay
Analyze first-order reactions where the rate depends linearly on one reactant concentration: rate = k[A]. Visualize exponential decay using the integrated rate law ln[A]t = ln[A]₀ - kt, and understand that first-order reactions have constant half-life t₁/₂ = 0.693/k independent of initial concentration. Explore applications in radioactive decay, drug metabolism, and chemical decomposition reactions.
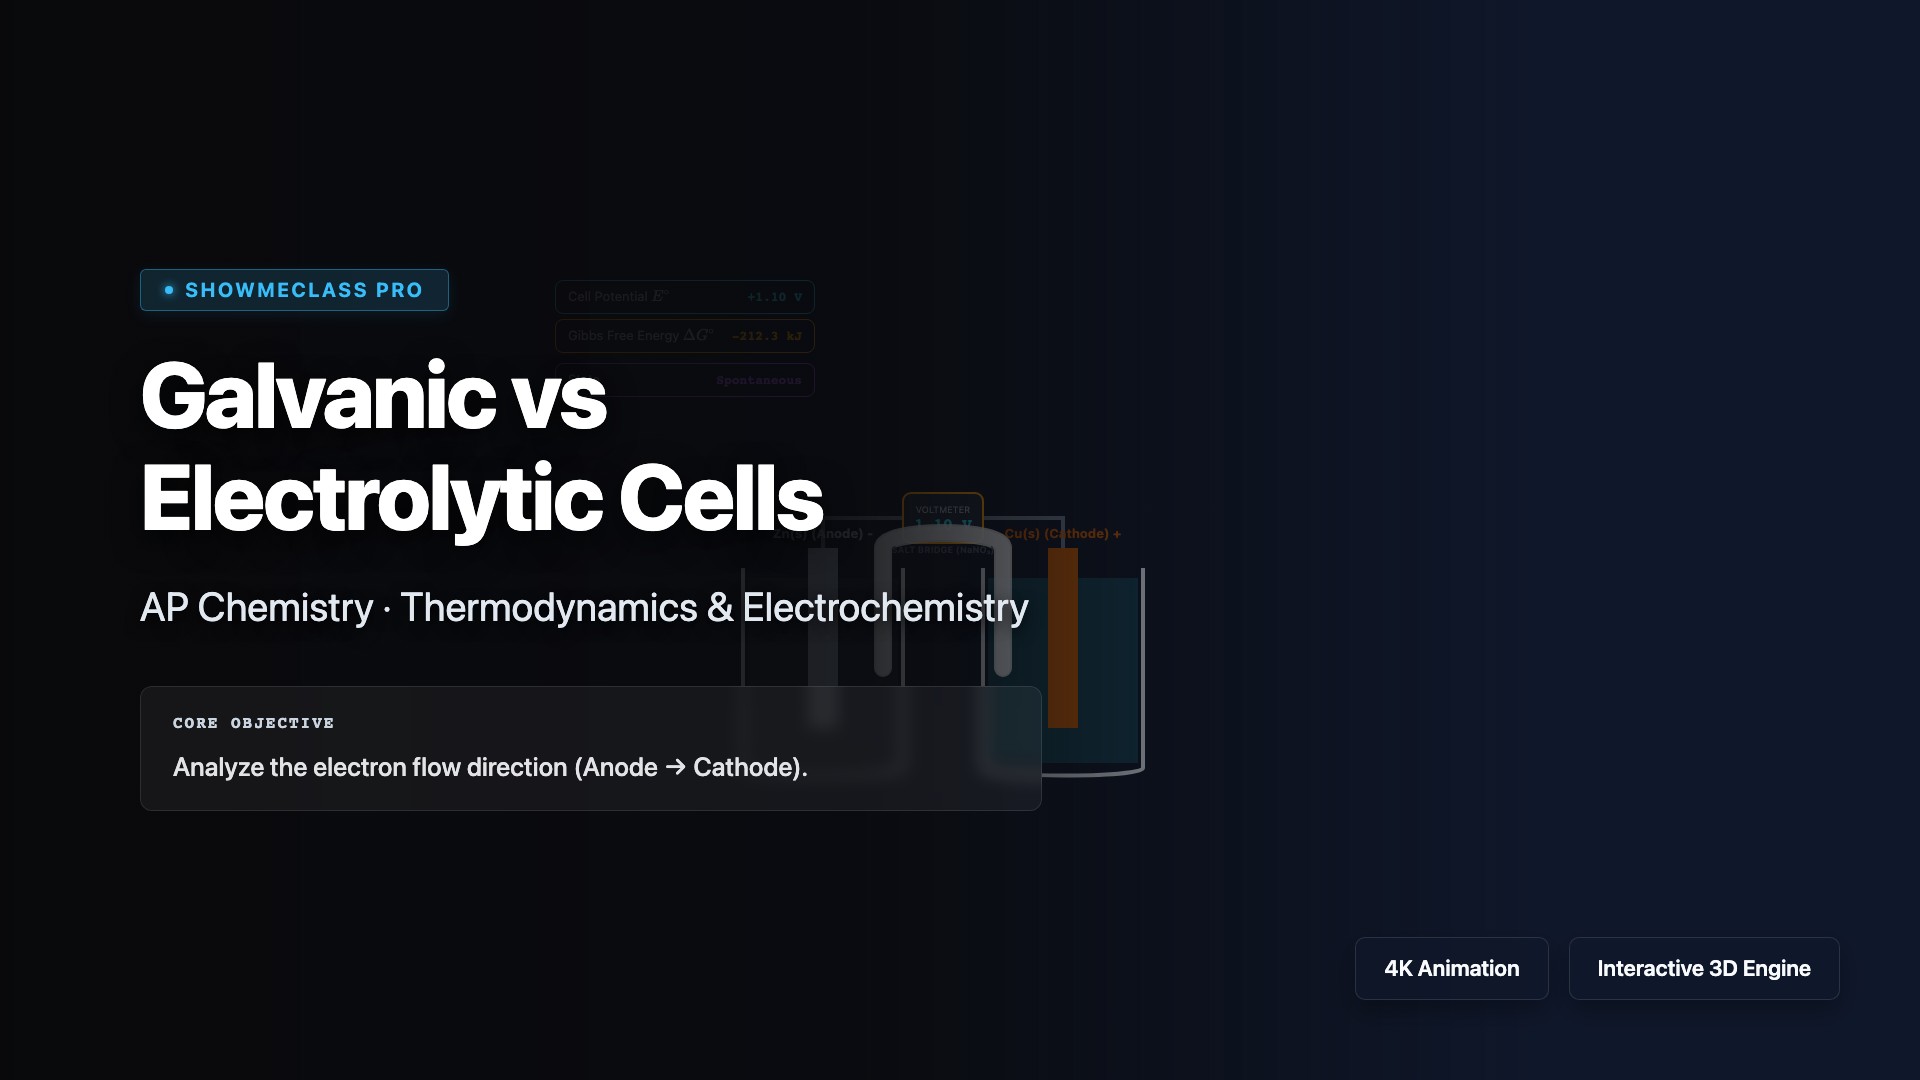
Galvanic vs Electrolytic Cells
Compare galvanic cells (spontaneous, ΔG < 0, generate electricity) with electrolytic cells (non-spontaneous, ΔG > 0, require external voltage). Visualize how galvanic cells convert chemical energy to electrical energy in batteries, while electrolytic cells use electrical energy to drive non-spontaneous reactions in electroplating, electrolysis, and metal purification. Understand electrode polarity differences and the role of external power sources.