Showing 12 results

Center of Mass Finder
Place and drag masses on a 2D canvas to calculate the center of mass in real time. Visualize how mass distribution affects the balance point of a system of particles.
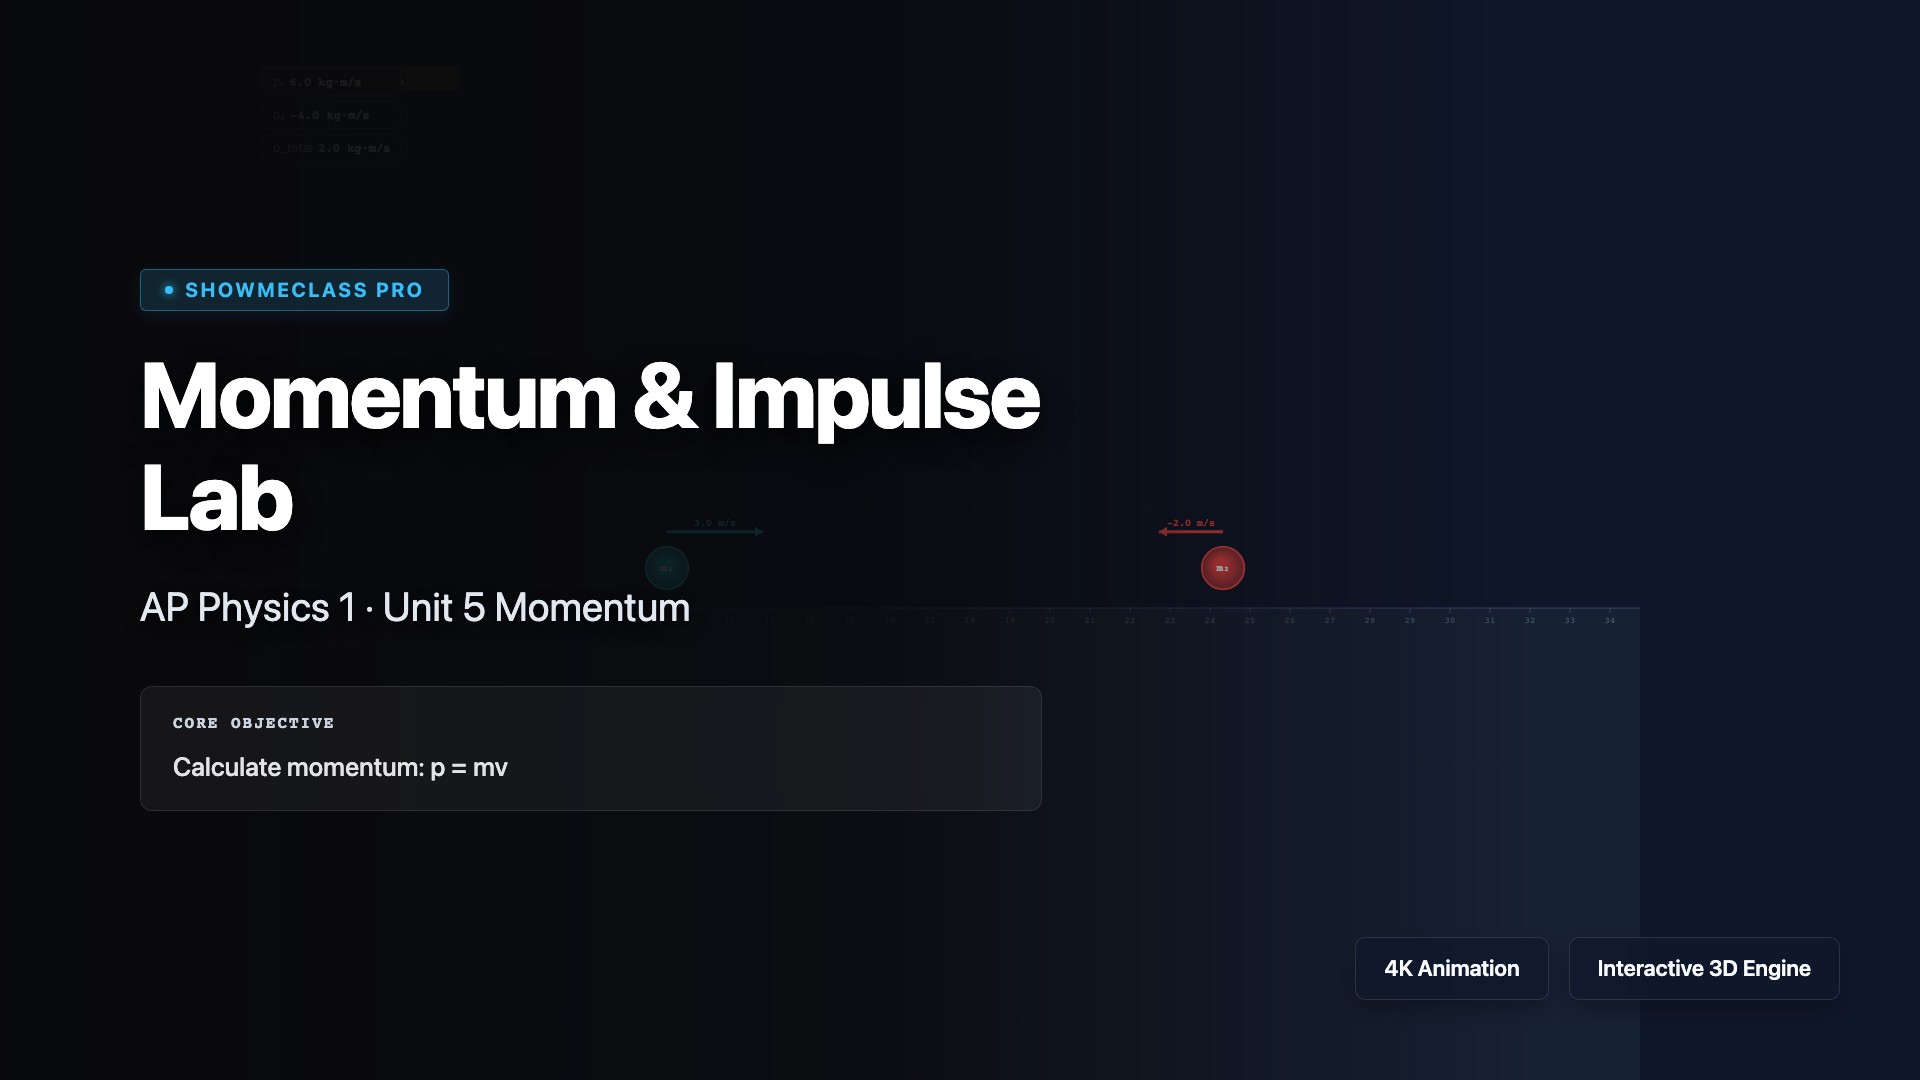
Momentum & Impulse Lab
Simulate elastic and perfectly inelastic collisions. Adjust masses and velocities to verify conservation of momentum and compare kinetic energy before and after impact.
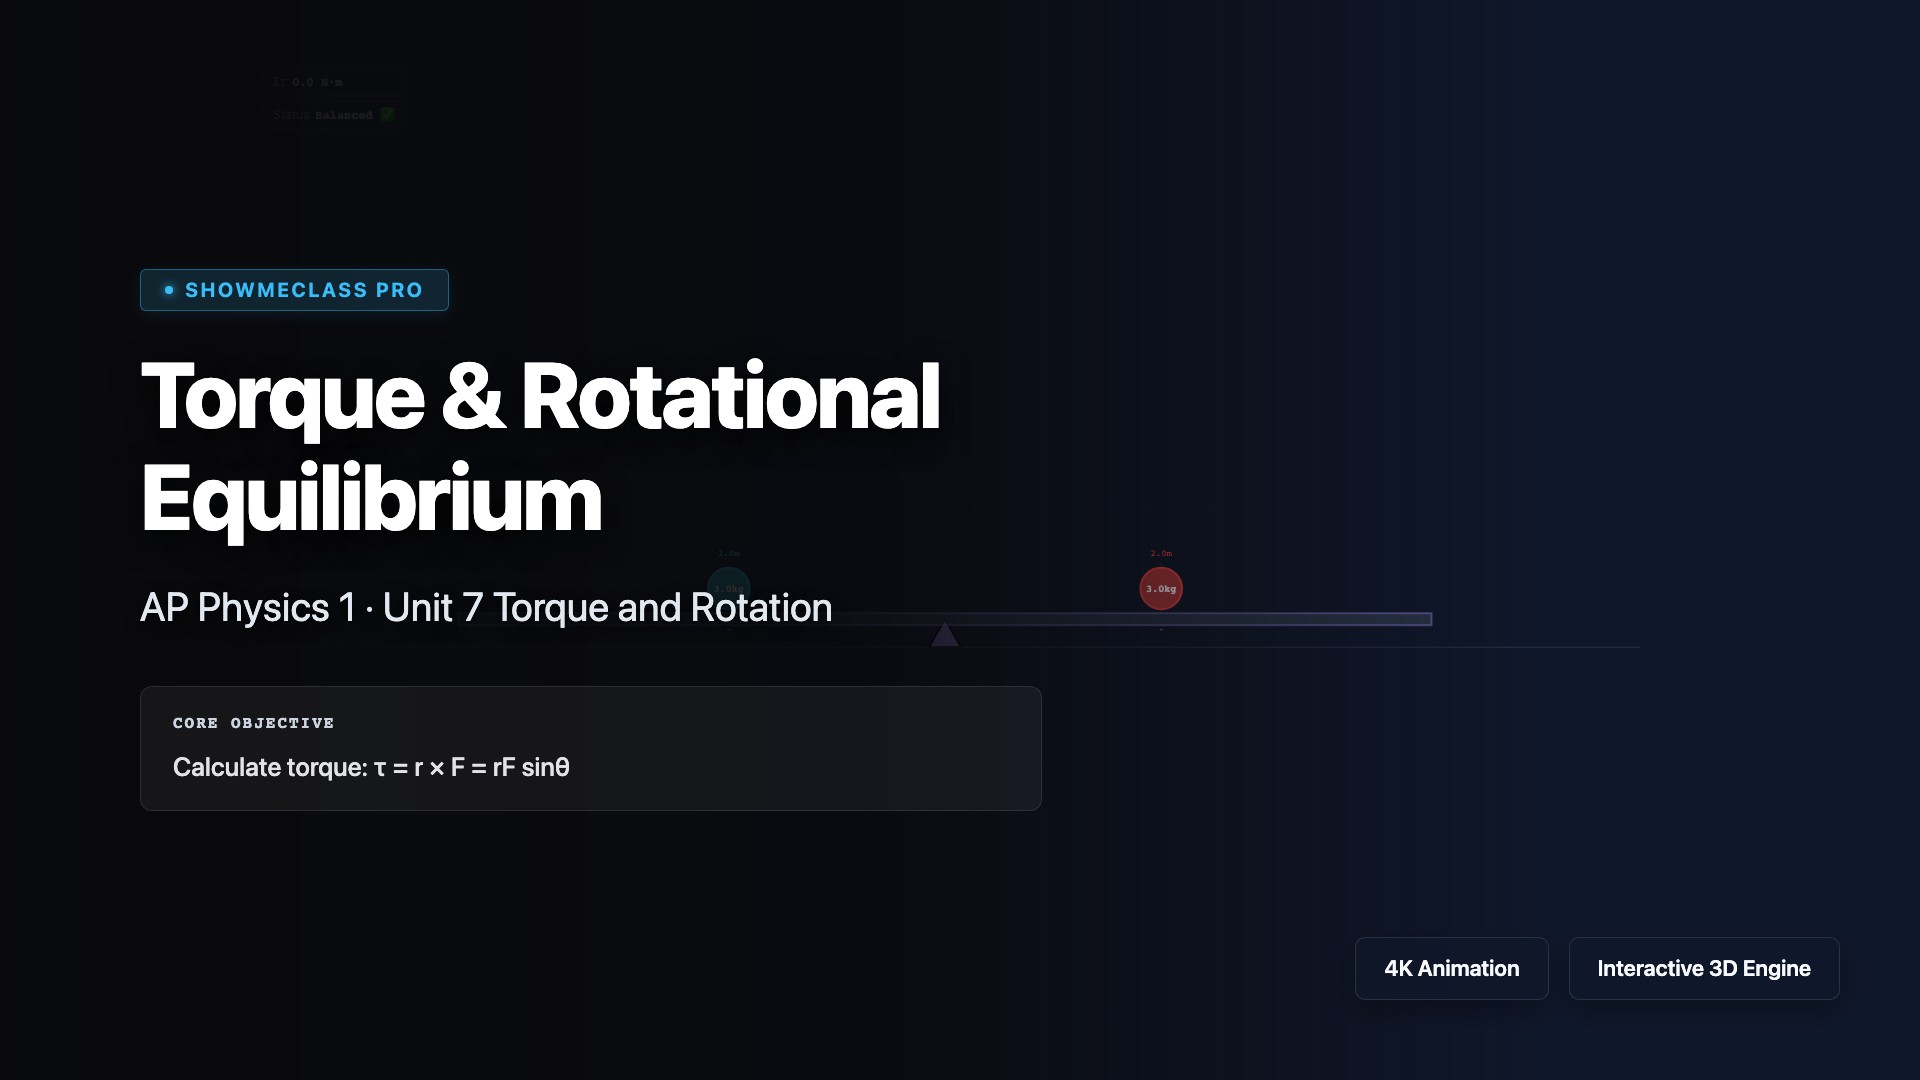
Torque & Rotational Equilibrium
Balance a beam by adjusting masses, distances, and pivot point. Visualize clockwise and counterclockwise torques and observe rotational equilibrium conditions in real time.
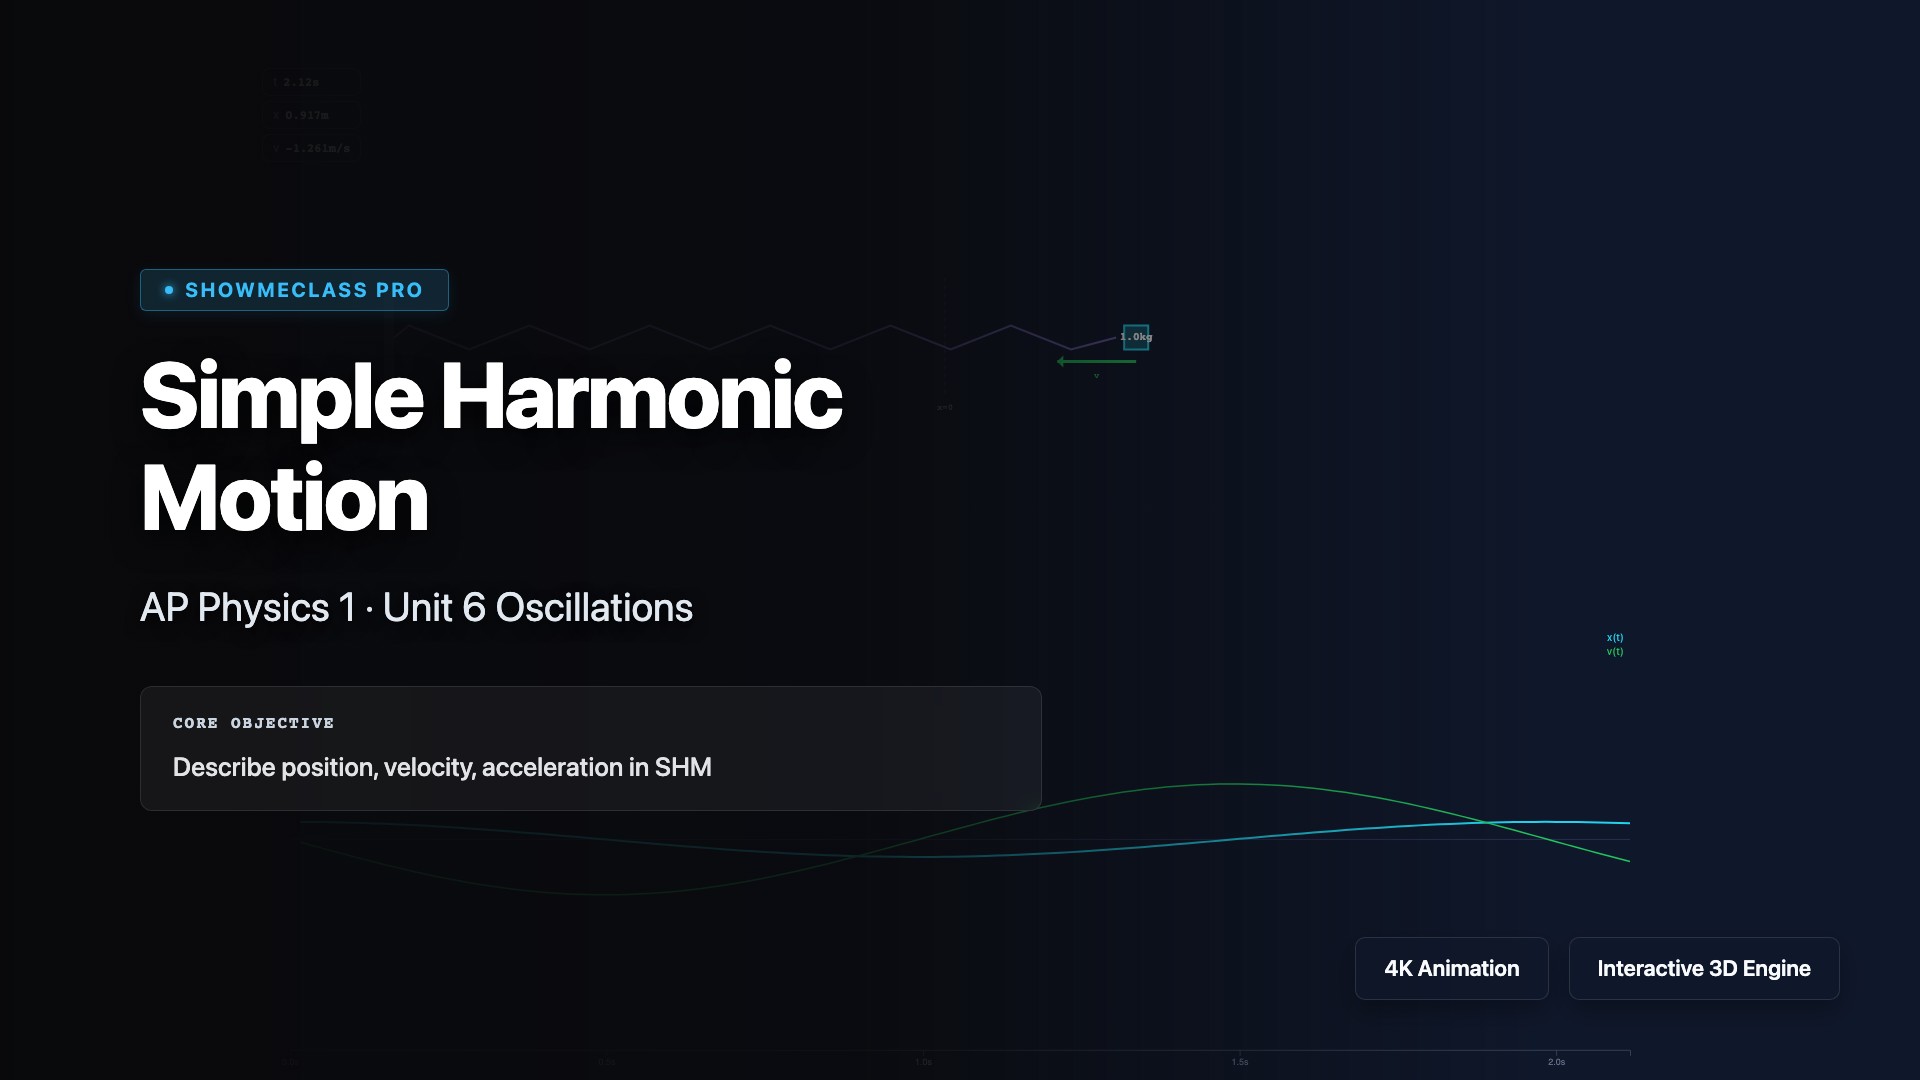
Simple Harmonic Motion Explorer
Animate a spring-mass system in SHM with real-time x(t), v(t), a(t) graphs. Adjust amplitude, mass, and spring constant to see how period, frequency, and energy change.
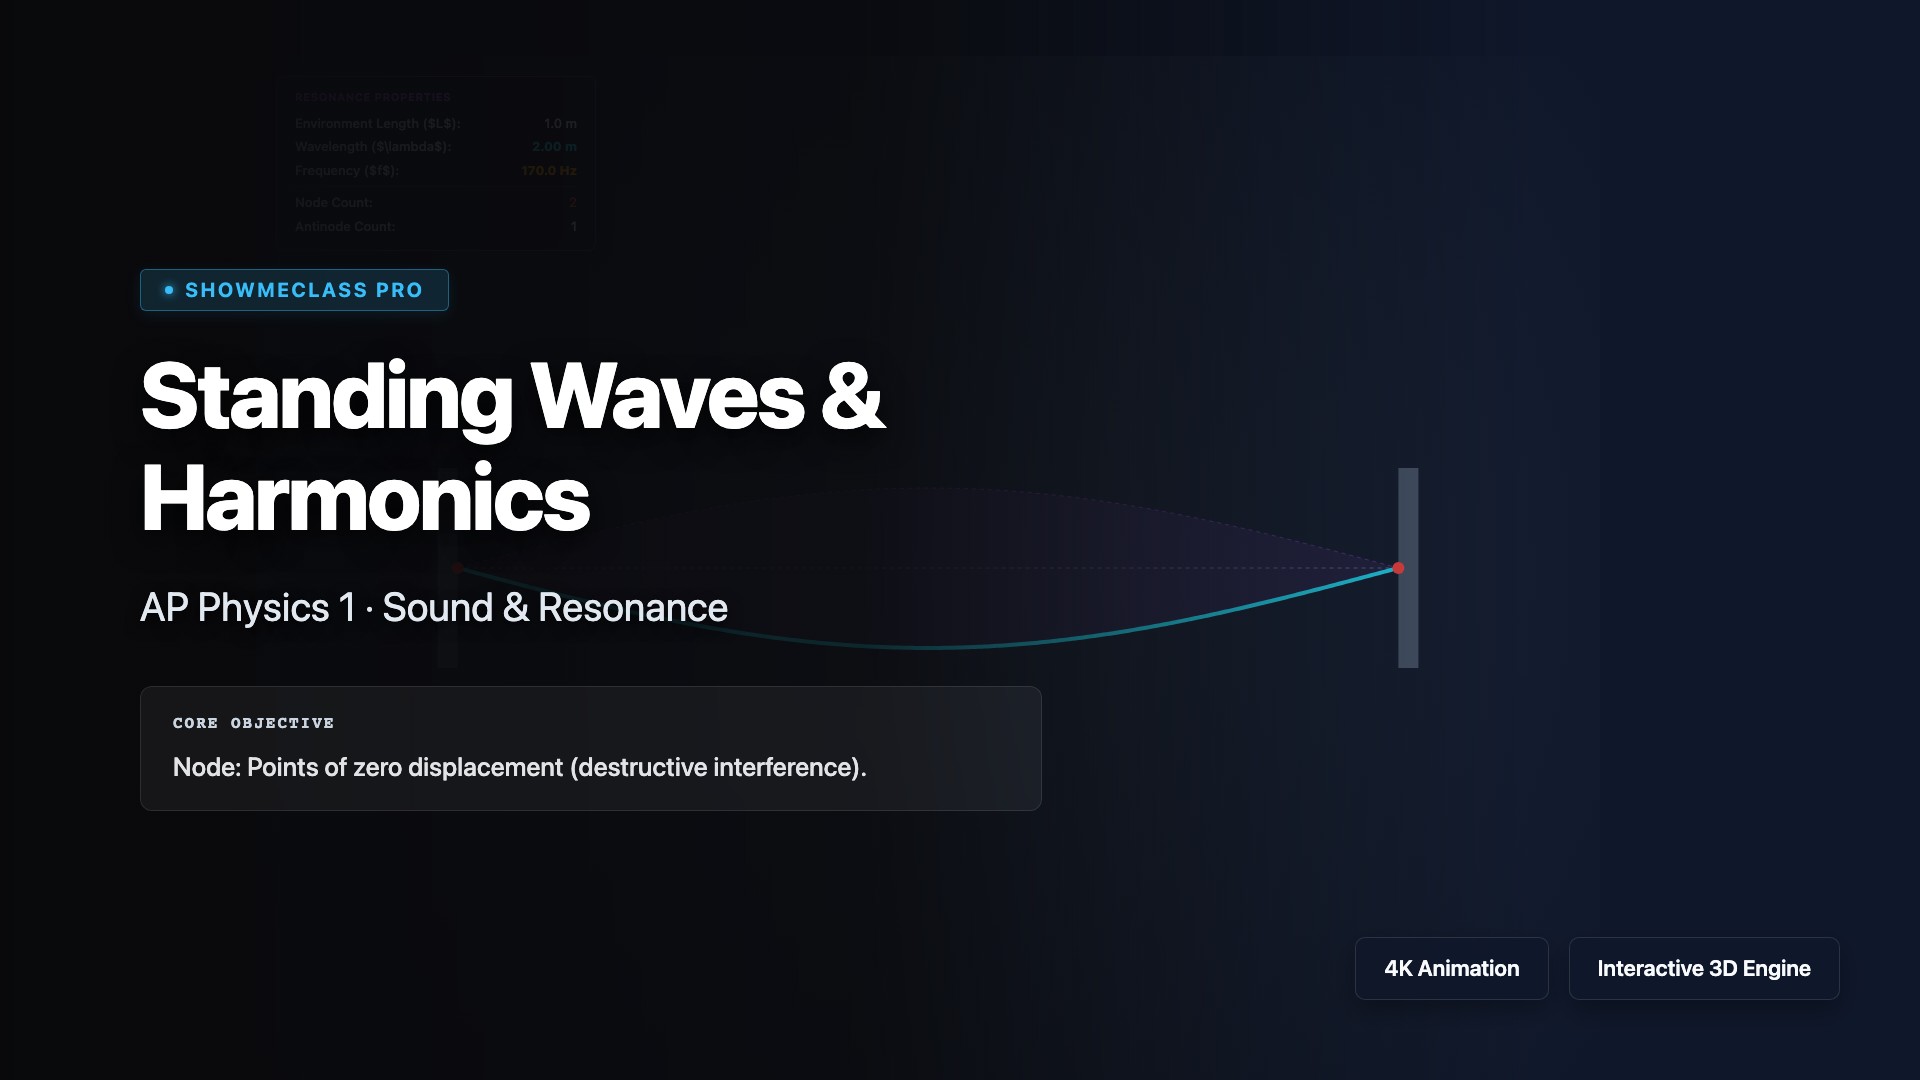
Standing Waves Generator
Visualize standing wave harmonics on a fixed string. Adjust harmonic number, amplitude, and wave speed to see nodes, antinodes, wavelength, and frequency in real time.
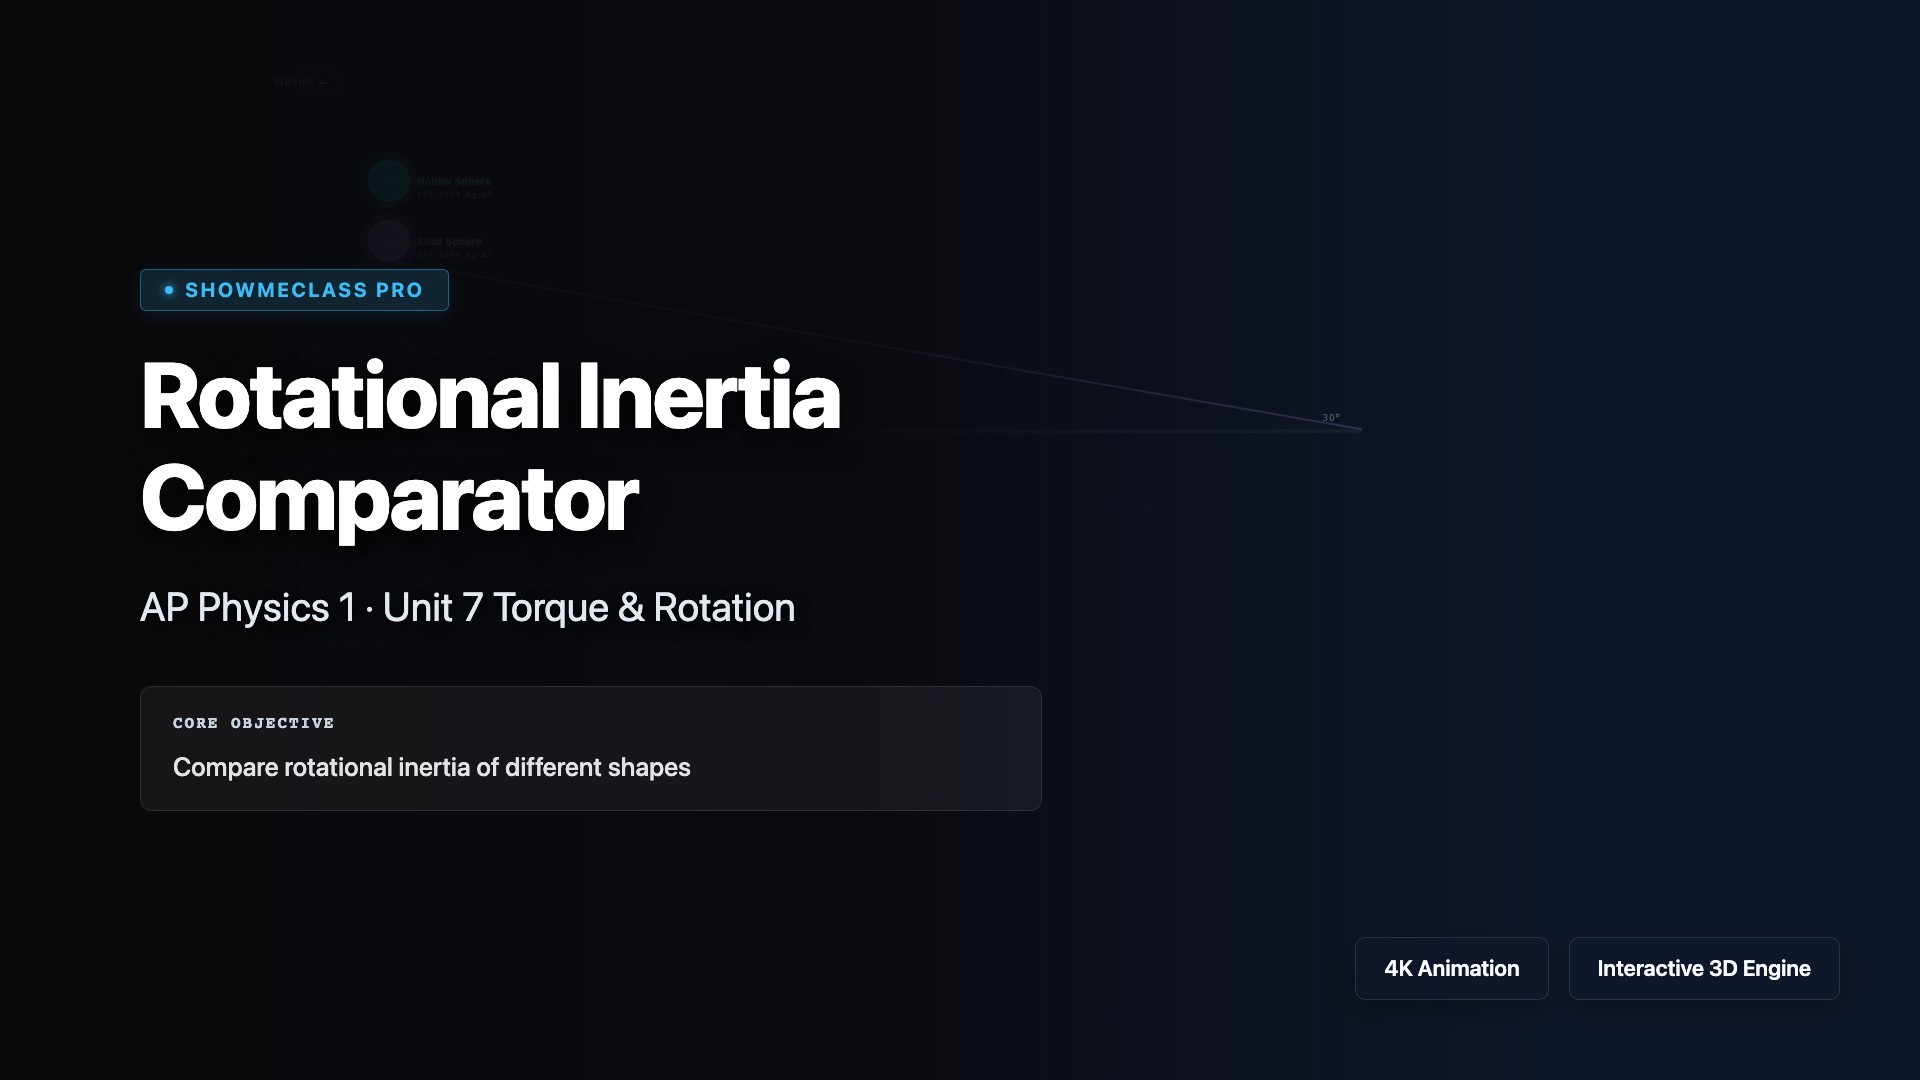
Rotational Inertia Comparator
Race shapes down a ramp to see which arrives first. Compare rotational inertia of solid/hollow spheres, cylinders, and rods. Understand how I/(mR²) determines rolling acceleration.
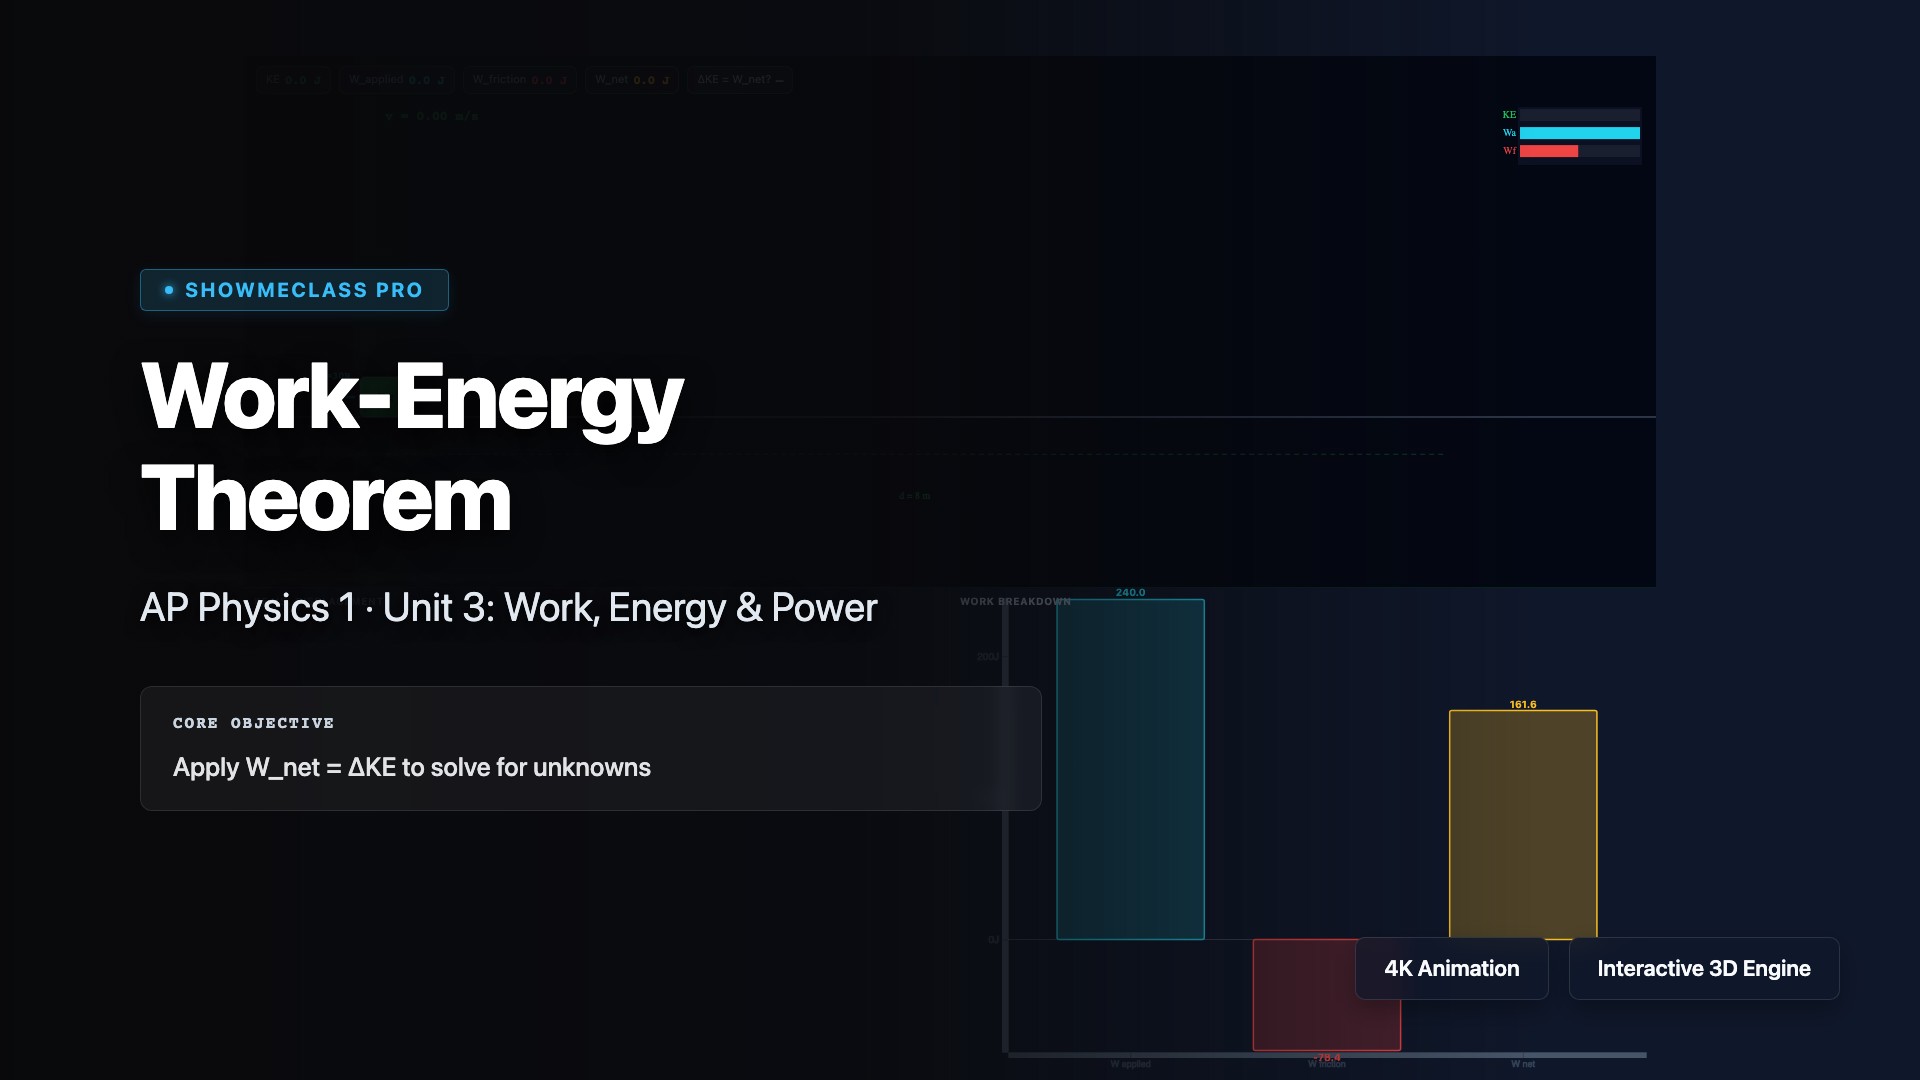
Work-Energy Theorem Lab
Push a block with adjustable force, mass, friction, and angle to verify W_net = ΔKE. Track kinetic energy, work by each force, and total net work with real-time graphs.

Circular Motion & Centripetal Force
Animate uniform circular motion with real-time velocity, acceleration, and force vectors. Adjust speed, radius, and mass to see how centripetal acceleration a_c = v²/r changes.
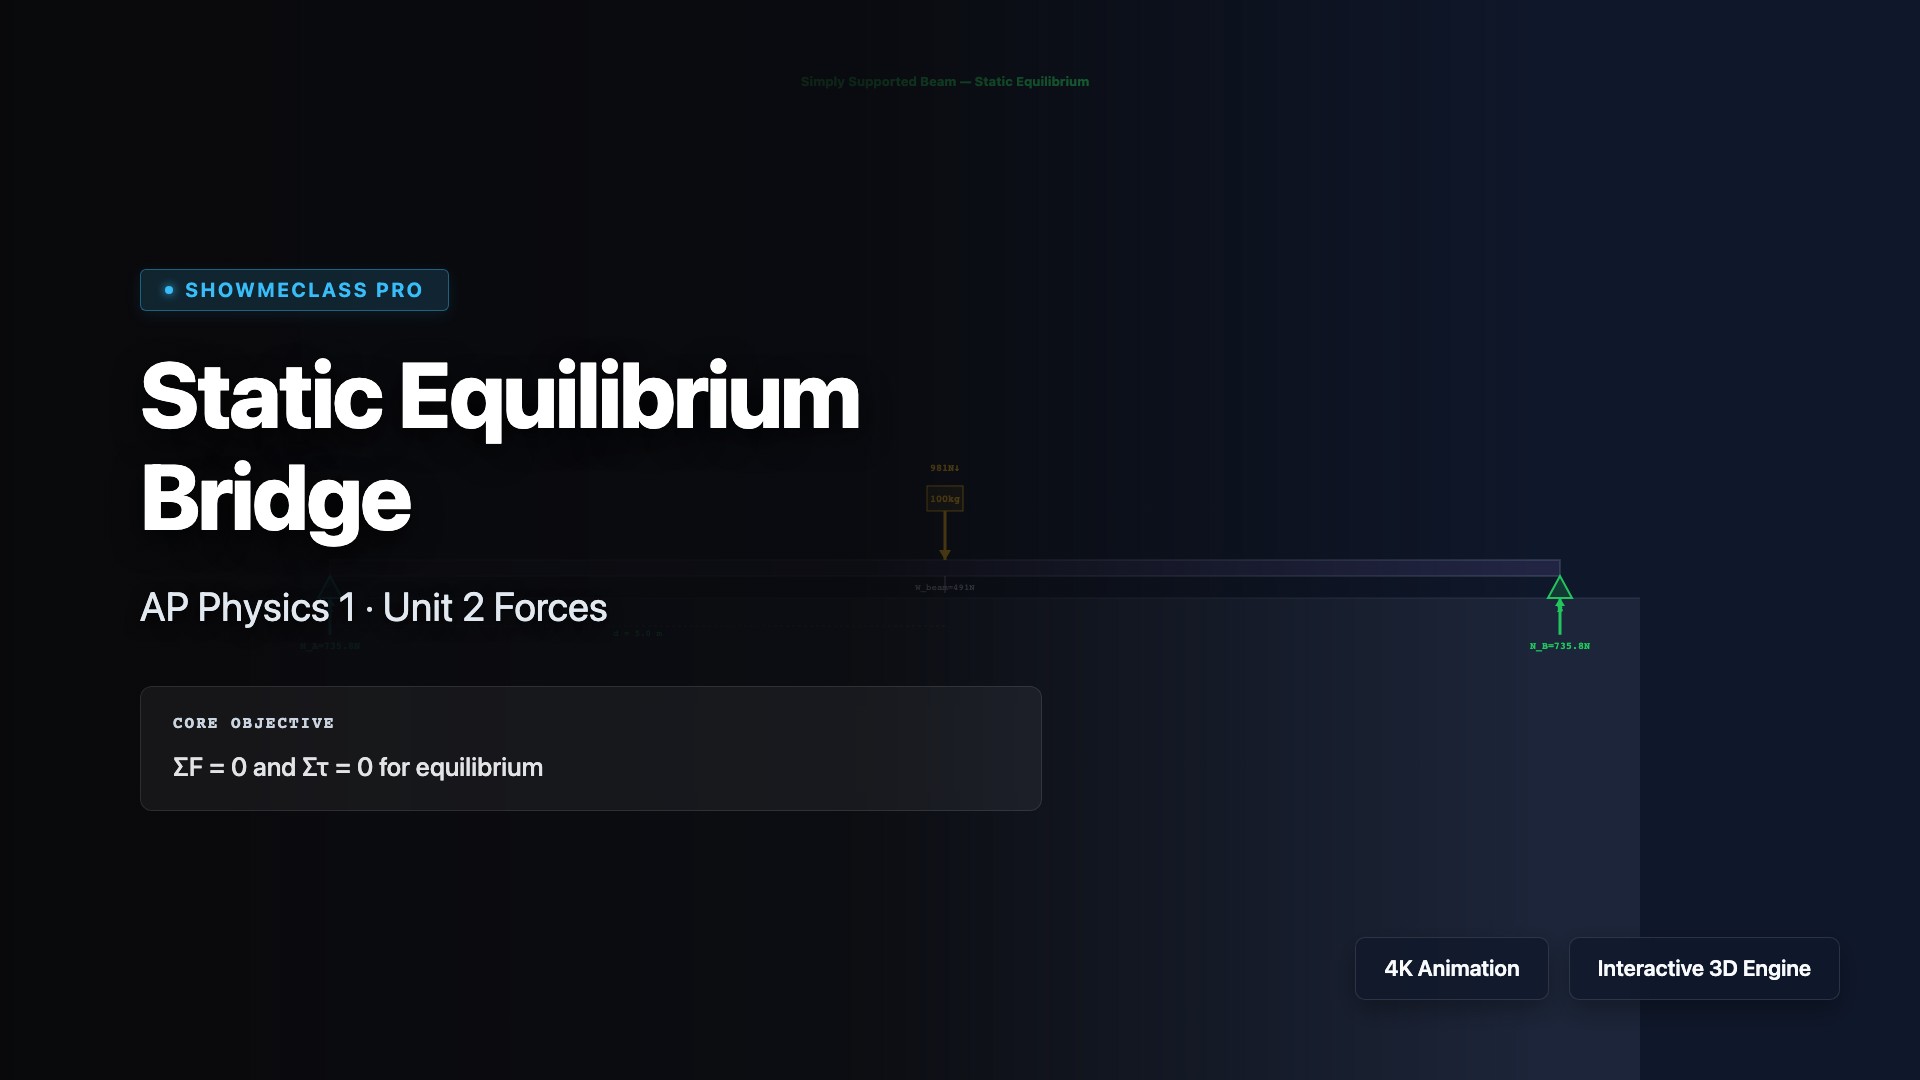
Static Equilibrium Bridge Builder
Analyze a simply supported beam with movable load. Calculate support reactions NA and NB using ΣF=0 and Στ=0 equilibrium conditions.
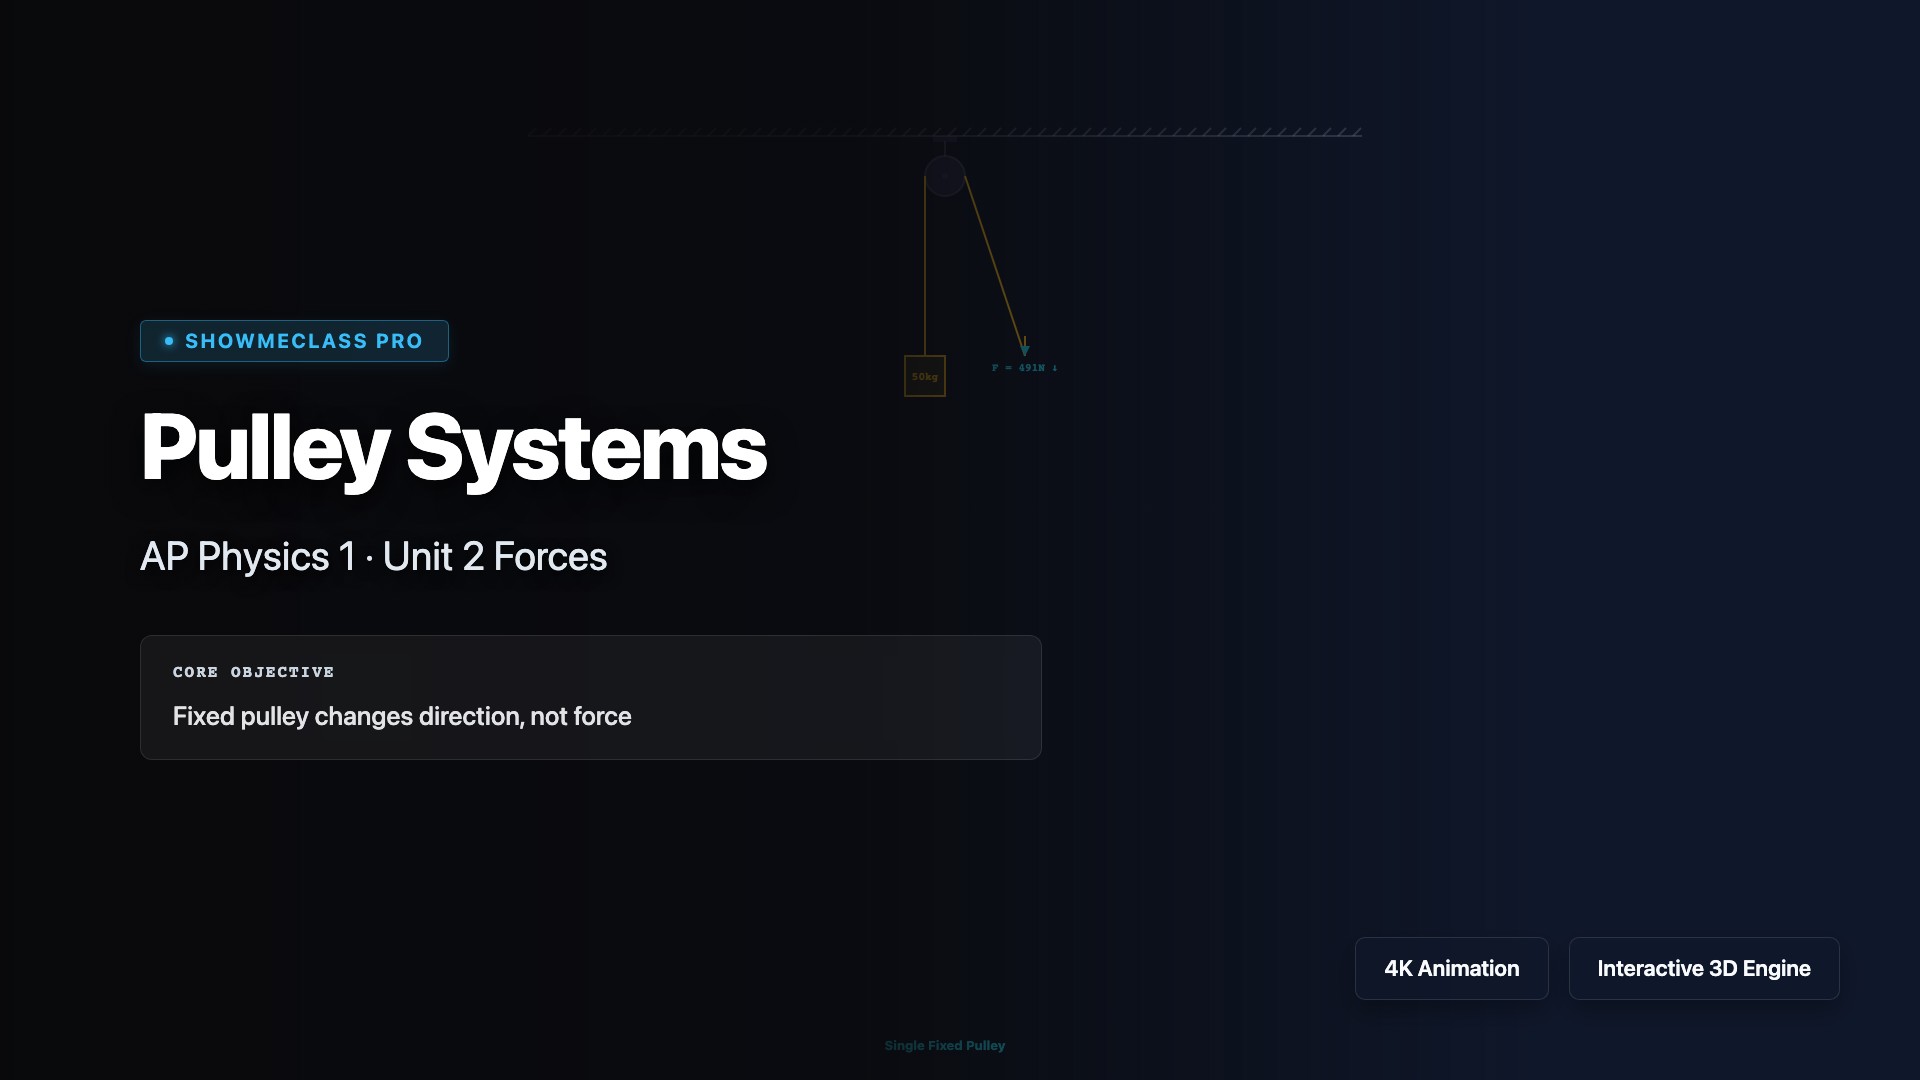
Pulley Systems & Mechanical Advantage
Compare 4 pulley configurations: single fixed, single movable, compound, and block & tackle. See how mechanical advantage trades force for distance.
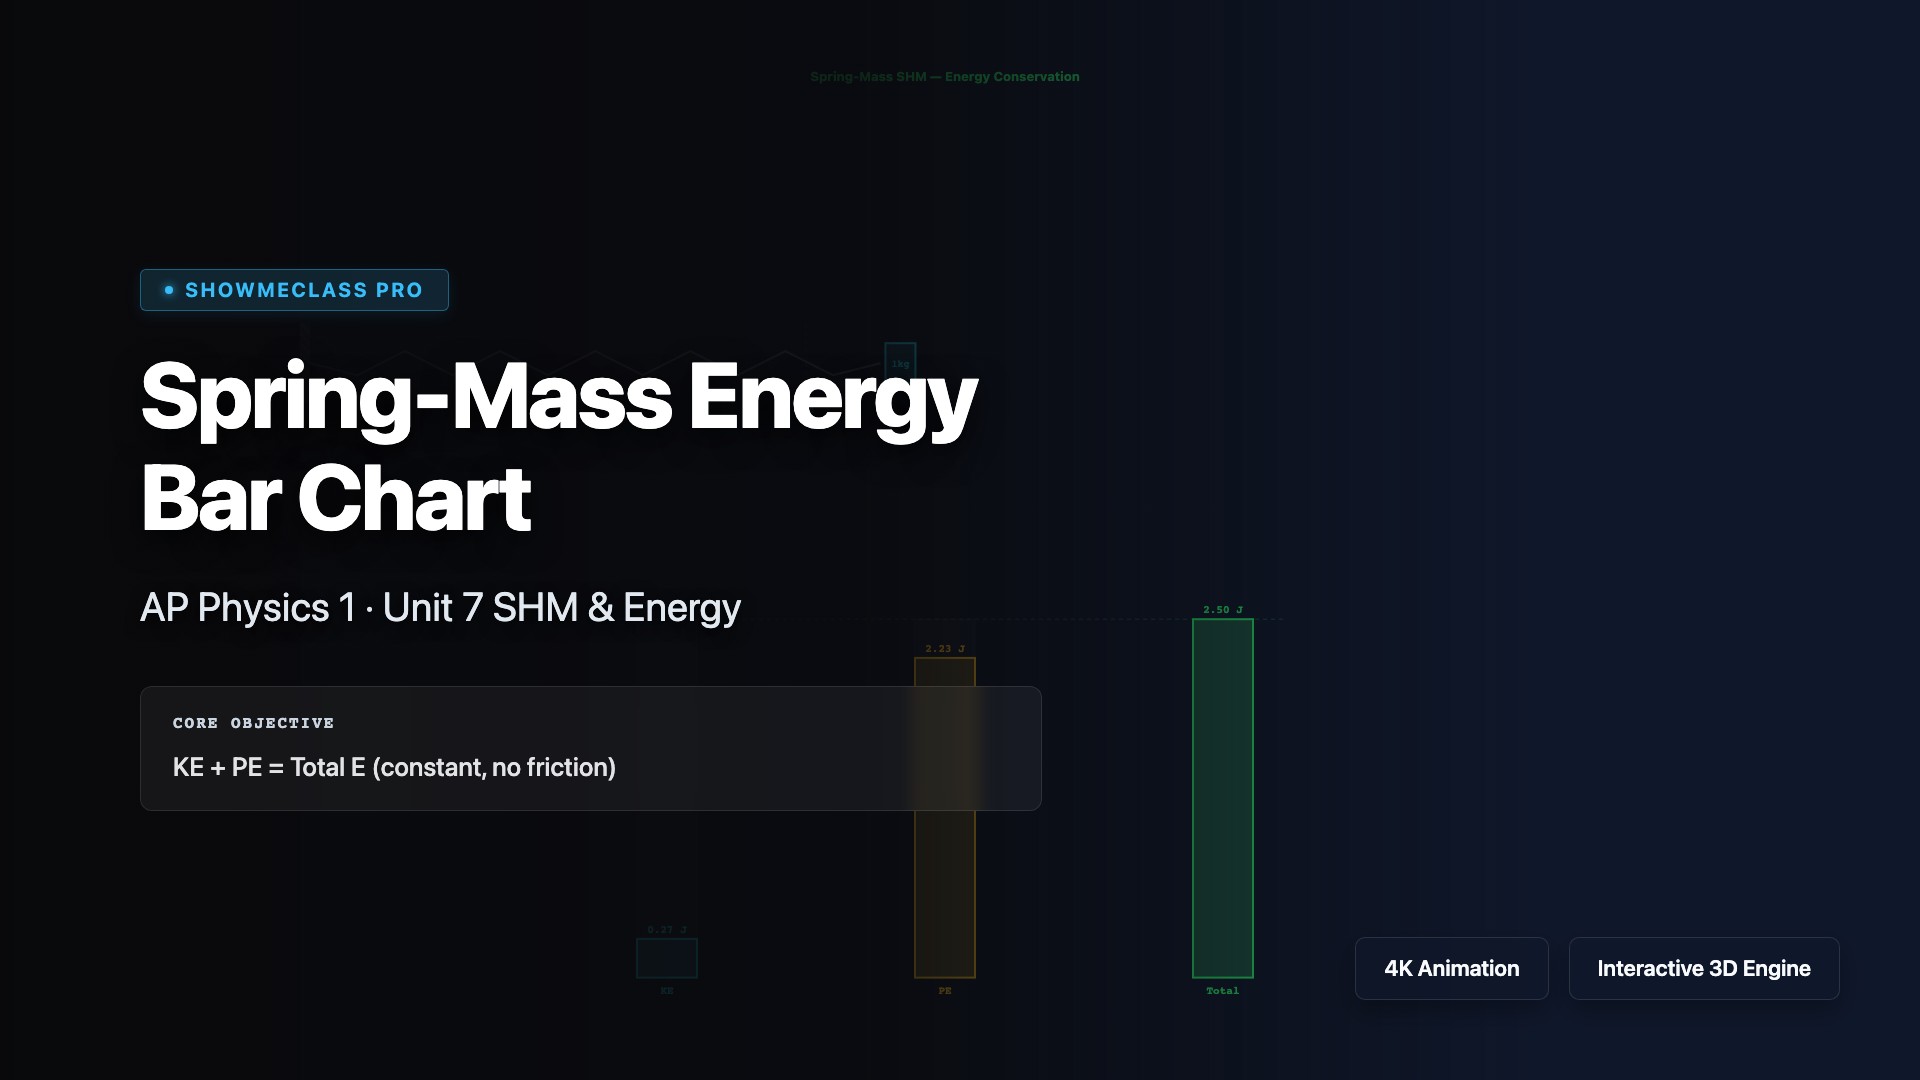
Spring-Mass Energy Bar Chart
Animated spring-mass SHM with real-time KE/PE/Total energy bar chart. PE = ½kx², KE = ½mv². Optional damping shows energy loss.
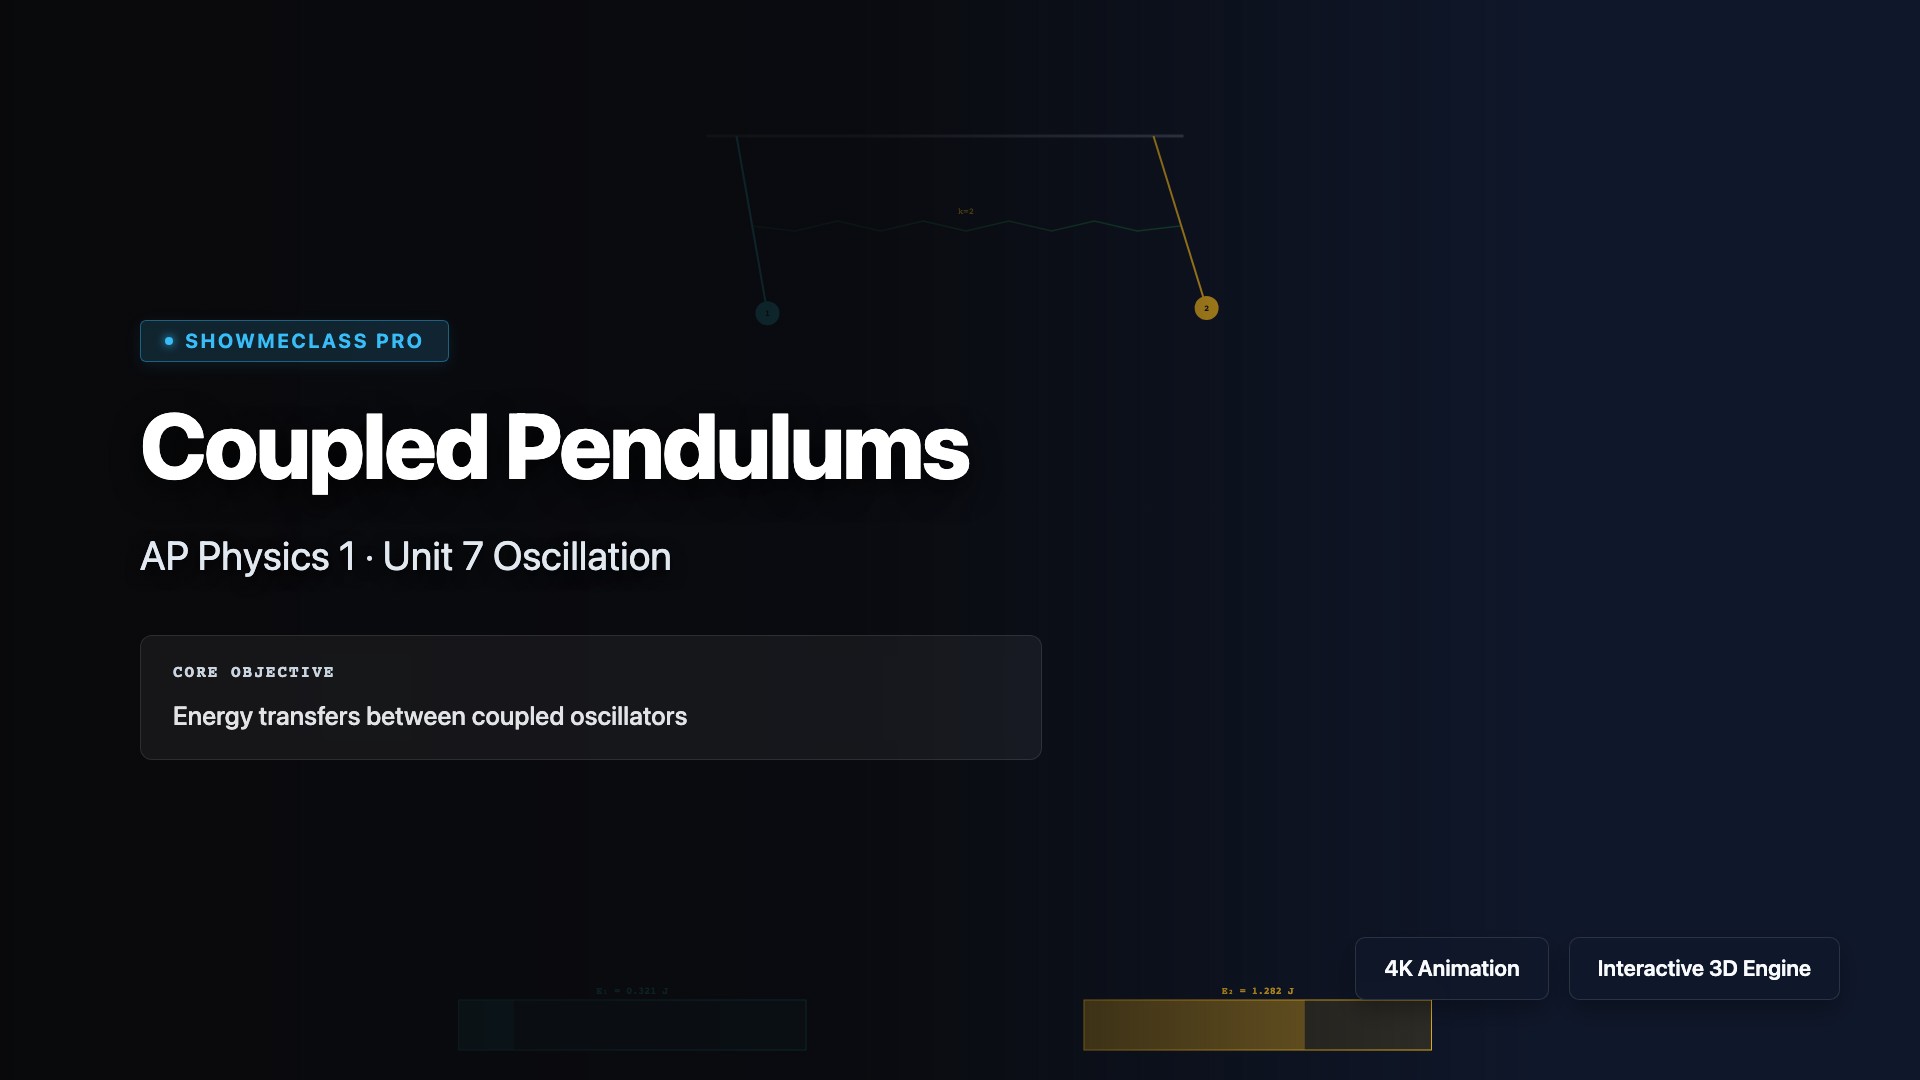
Coupled Pendulums & Energy Transfer
Two pendulums coupled by a spring exchange energy via beat oscillation. Adjust coupling strength to see faster/slower energy transfer between normal modes.