
Showing 12 results
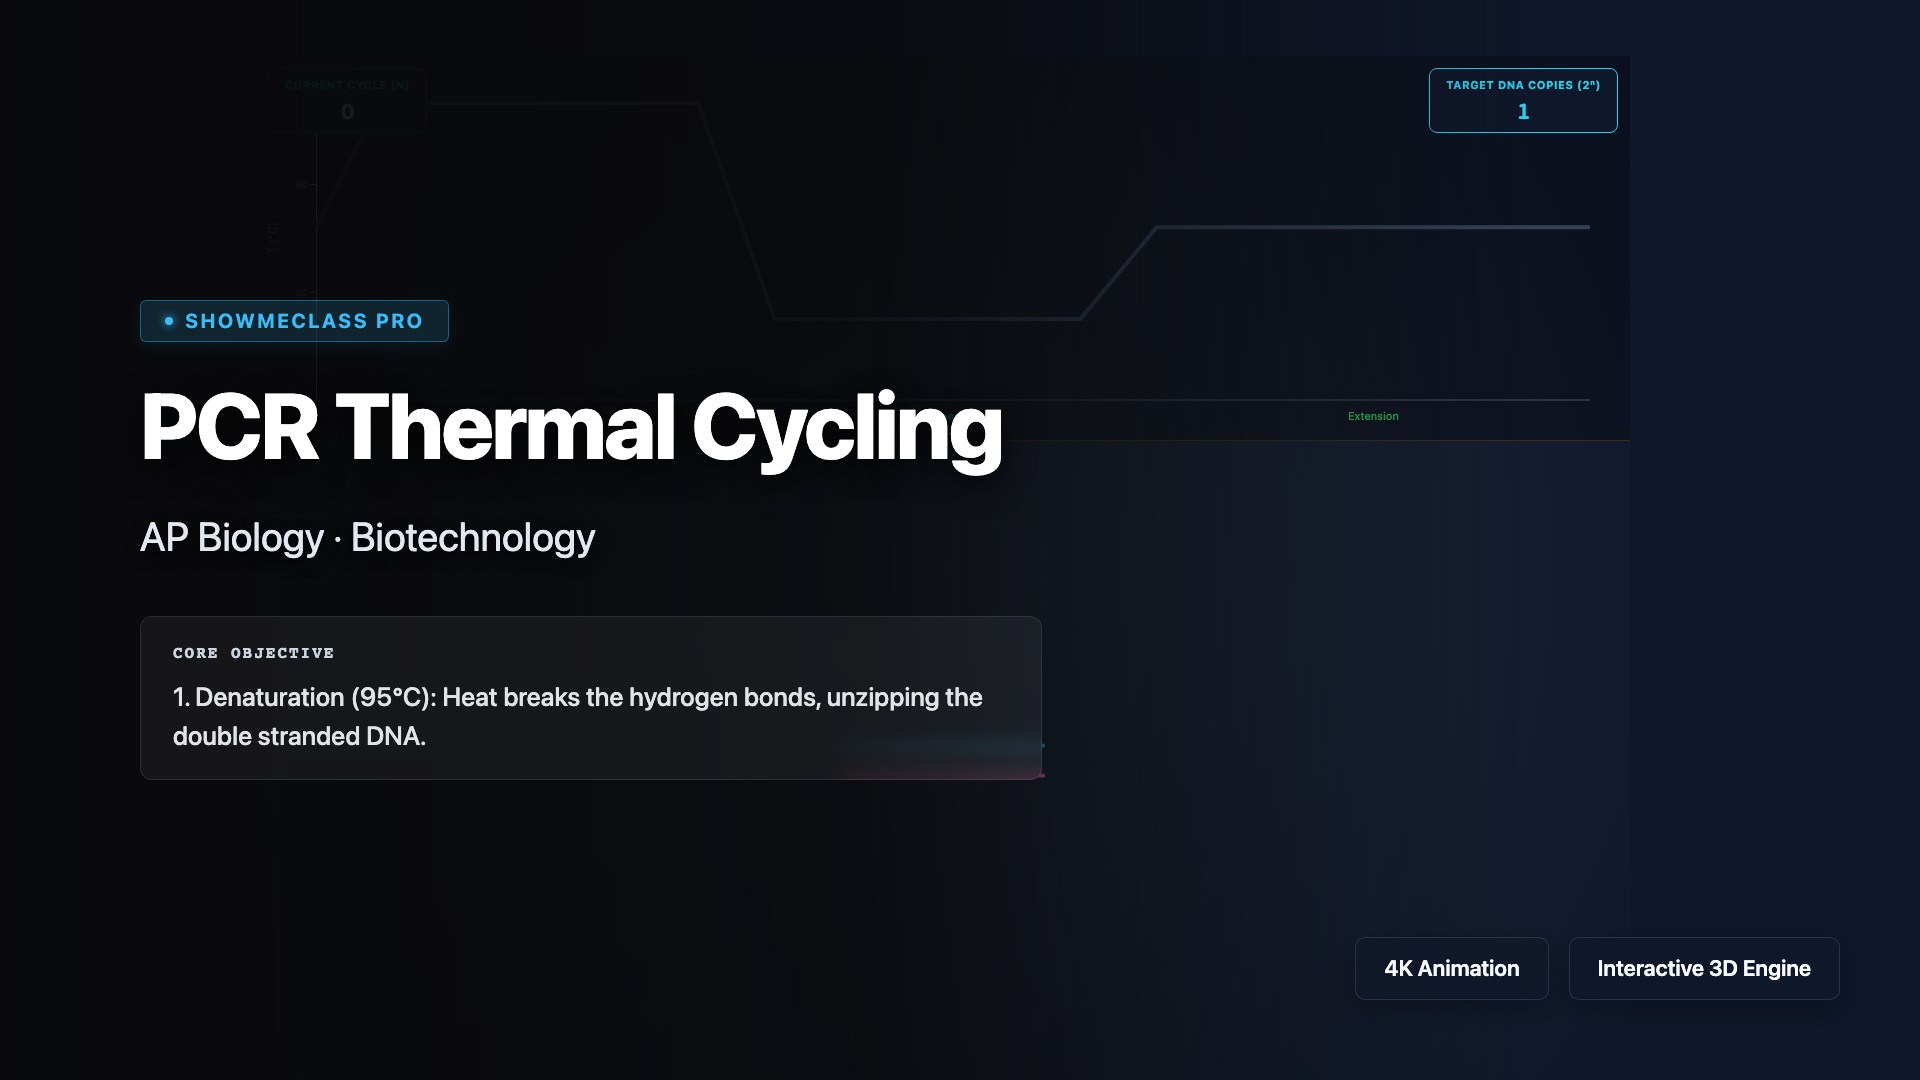
PCR Thermal Cycling
Simulate the polymerase chain reaction (PCR) technique that exponentially amplifies specific DNA sequences through repeated thermal cycling. Visualize the three temperature-dependent steps: denaturation (95°C separates DNA strands), annealing (55°C allows primers to bind), and extension (72°C enables Taq polymerase to synthesize new strands). Understand how PCR enables DNA cloning, forensics, medical diagnostics, and genetic research.
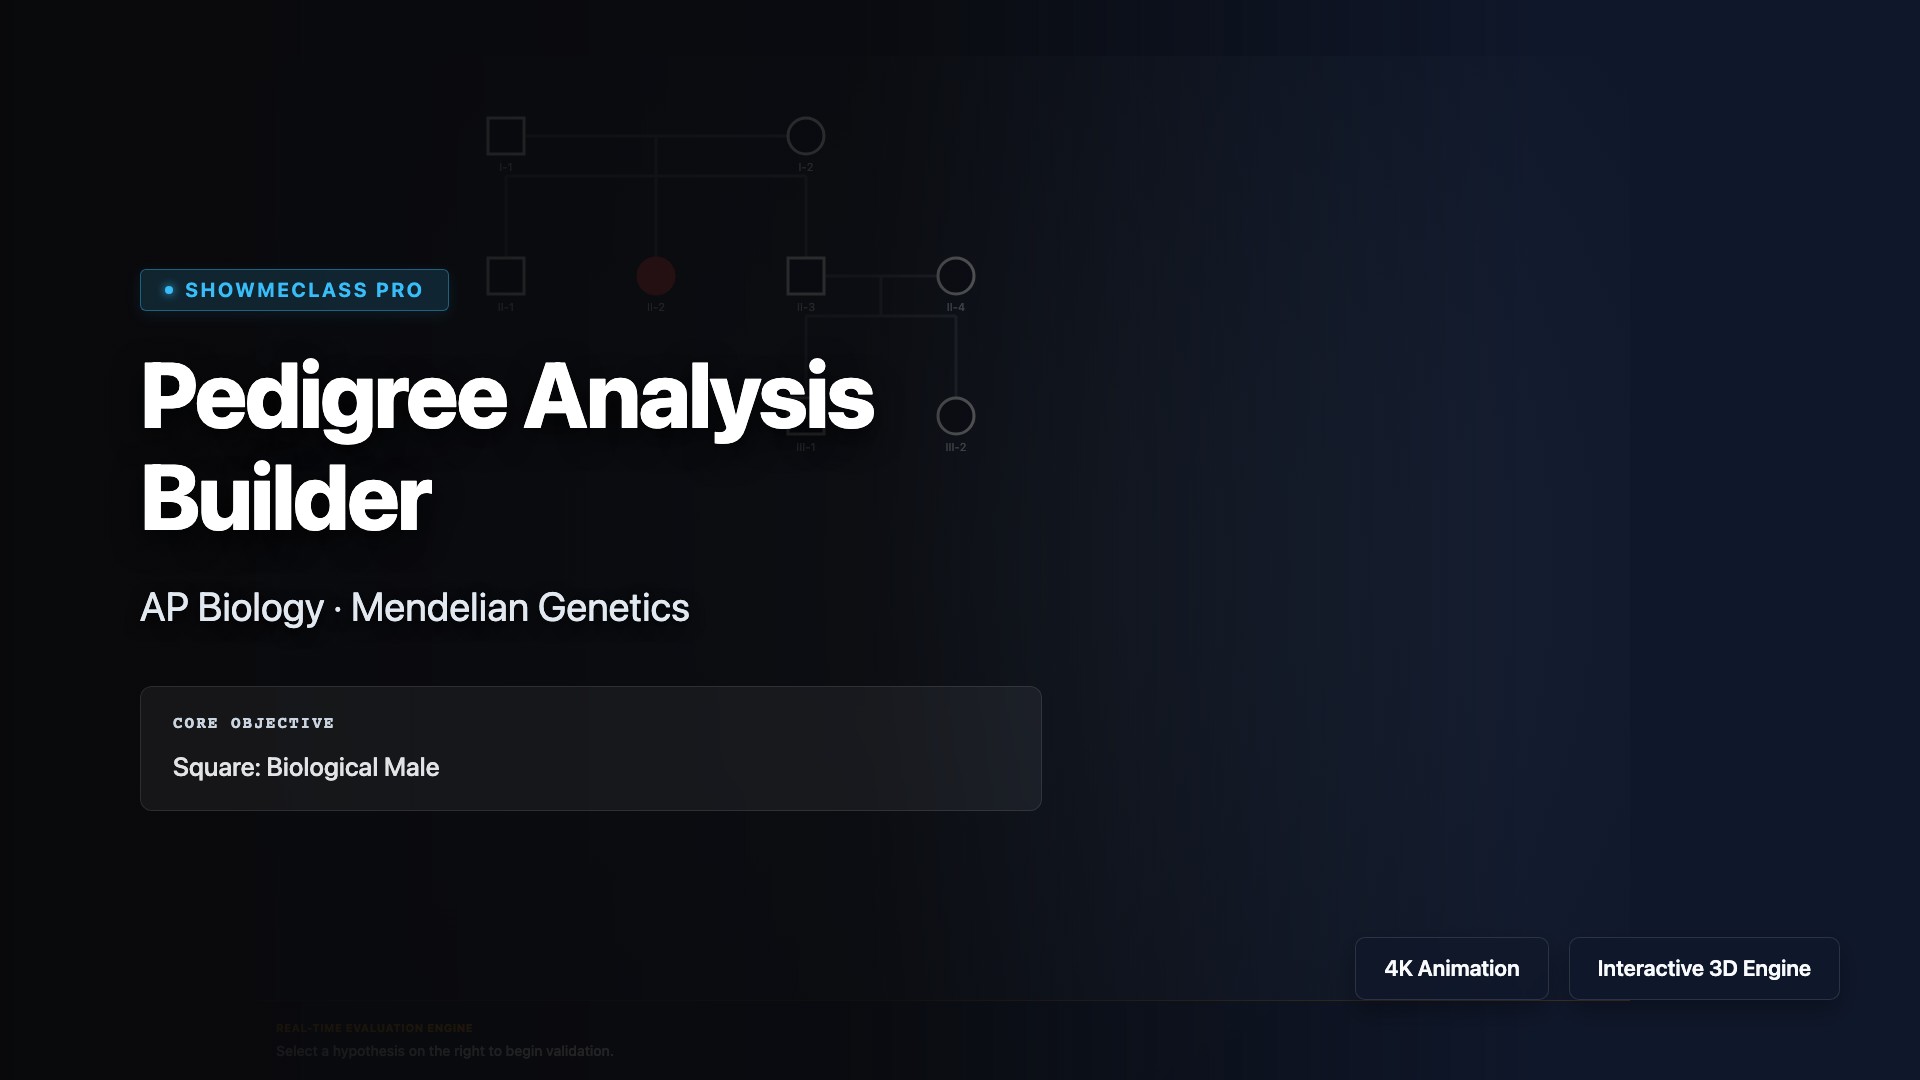
Pedigree Analysis Builder
Build and analyze pedigrees to trace inheritance patterns of genetic traits through family trees. Learn to identify autosomal dominant, autosomal recessive, X-linked recessive, and X-linked dominant inheritance patterns by examining affected individuals across generations. Practice determining genotypes, calculating probabilities, and distinguishing between different modes of inheritance using standard pedigree symbols.
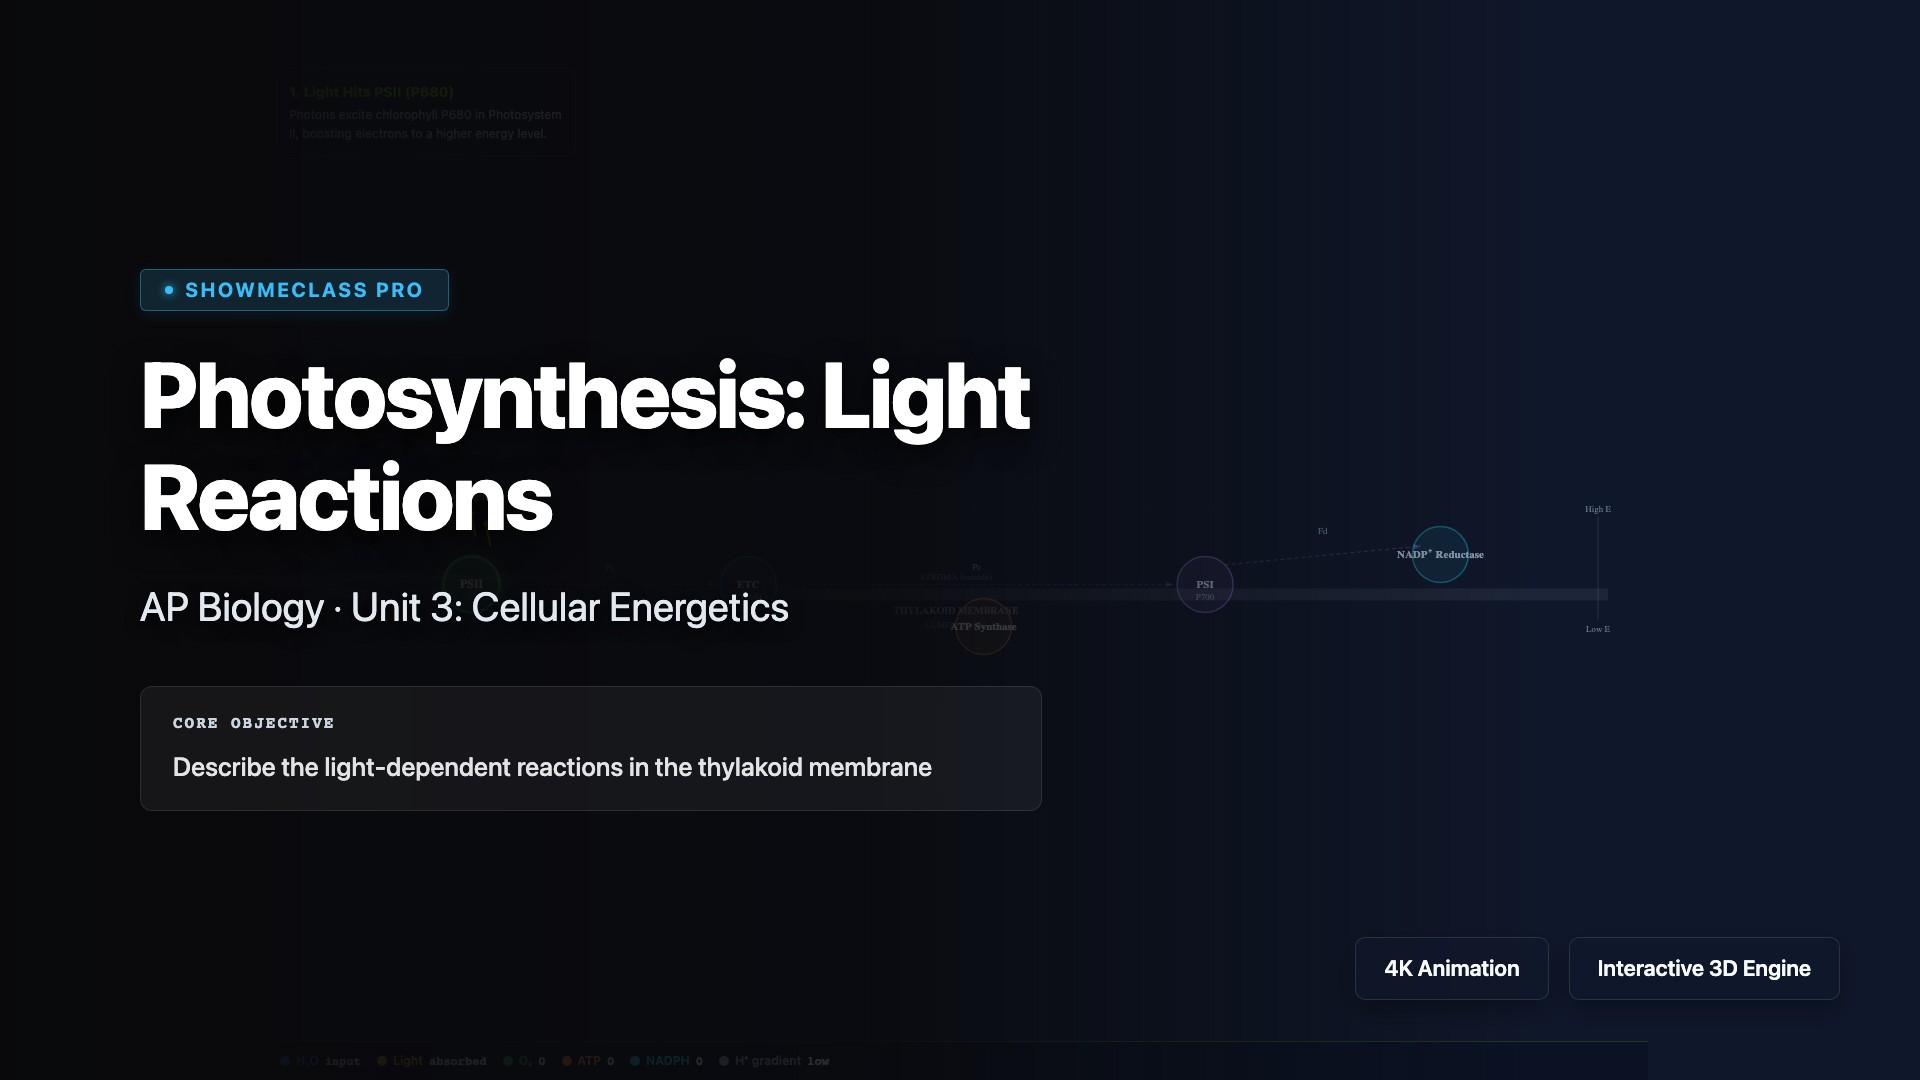
Photosynthesis: Light Reactions
Explore the light-dependent reactions of photosynthesis occurring in the thylakoid membranes of chloroplasts. Visualize how photosystems II and I capture light energy to drive electron transport, generate ATP via chemiosmosis, and produce NADPH. Understand photolysis of water, the Z-scheme electron flow, and how these products power the Calvin cycle to fix carbon dioxide into glucose.
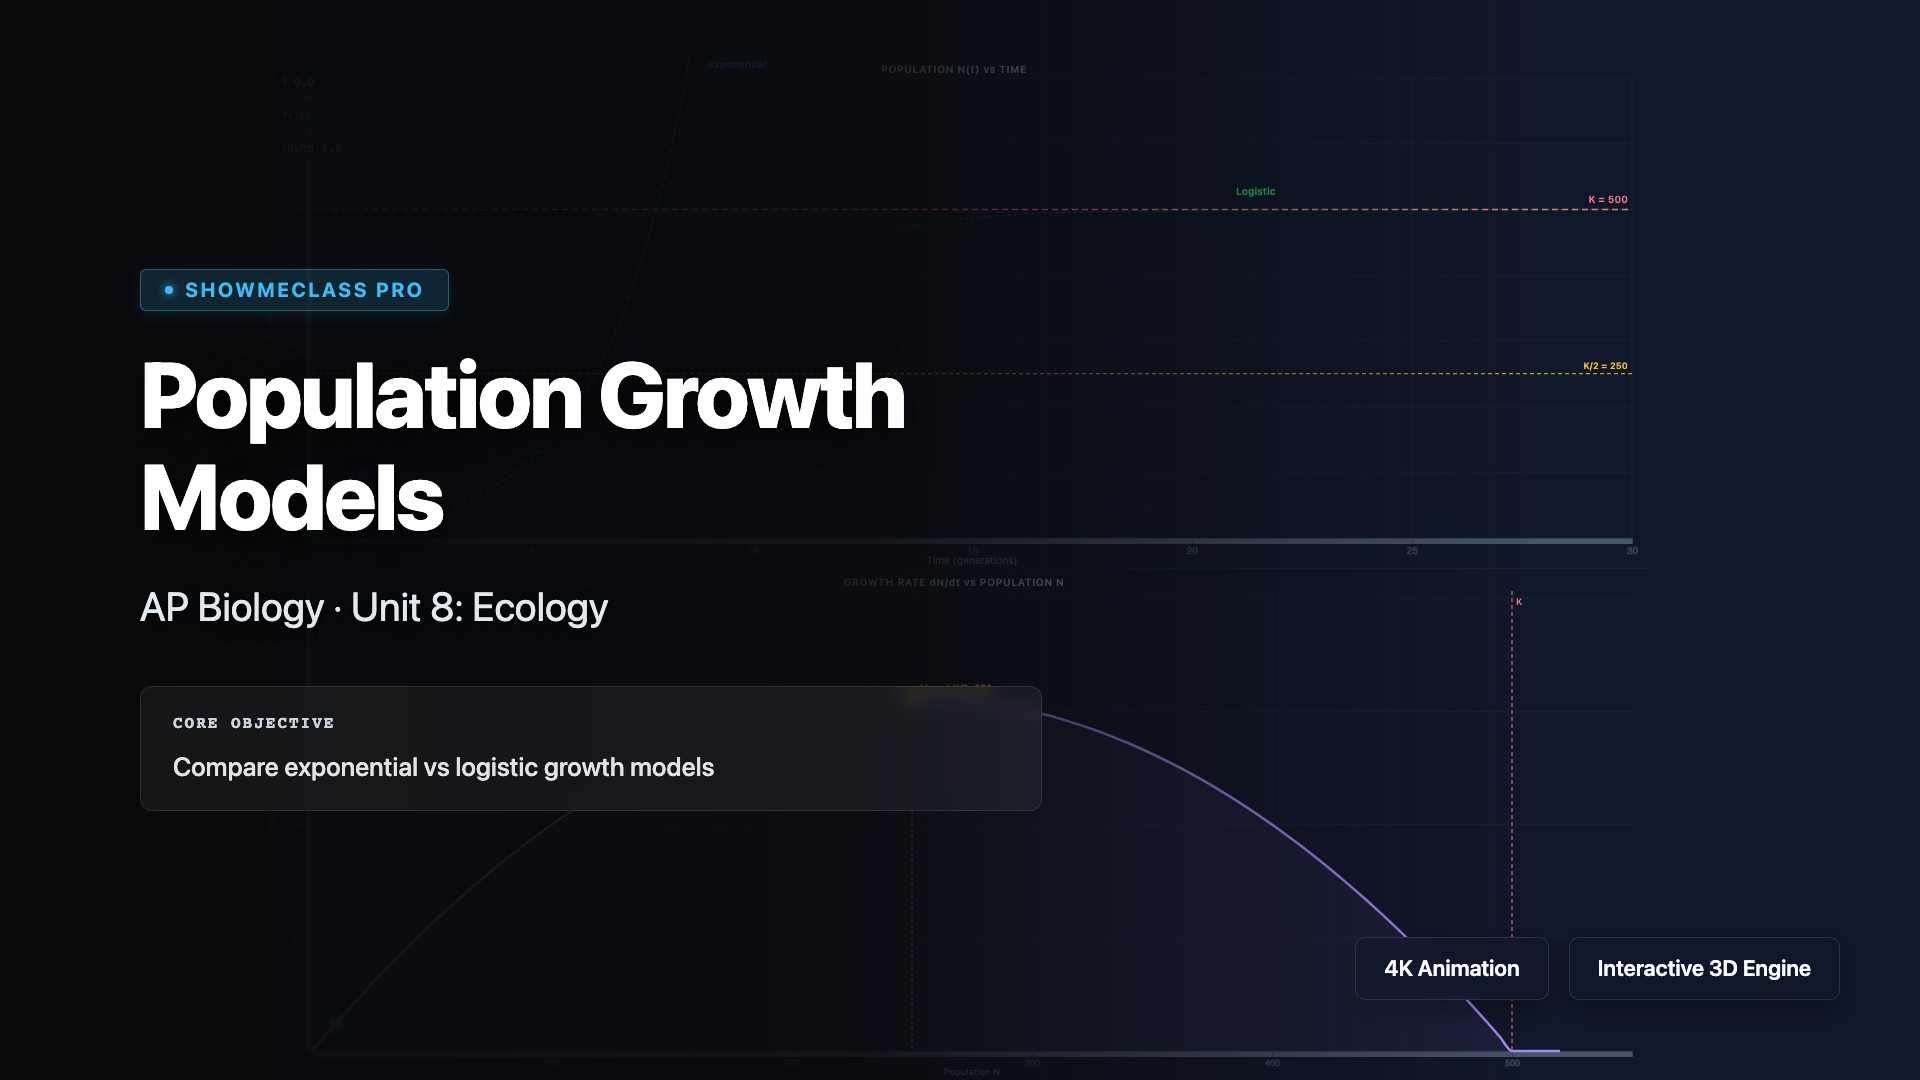
Population Growth Models
Compare exponential and logistic population growth models to understand how populations change over time. Visualize the J-shaped curve of exponential growth (unlimited resources) versus the S-shaped curve of logistic growth (limited by carrying capacity). Explore how density-dependent and density-independent factors regulate population size, and calculate growth rates using the equations dN/dt = rN and dN/dt = rN(K-N)/K.
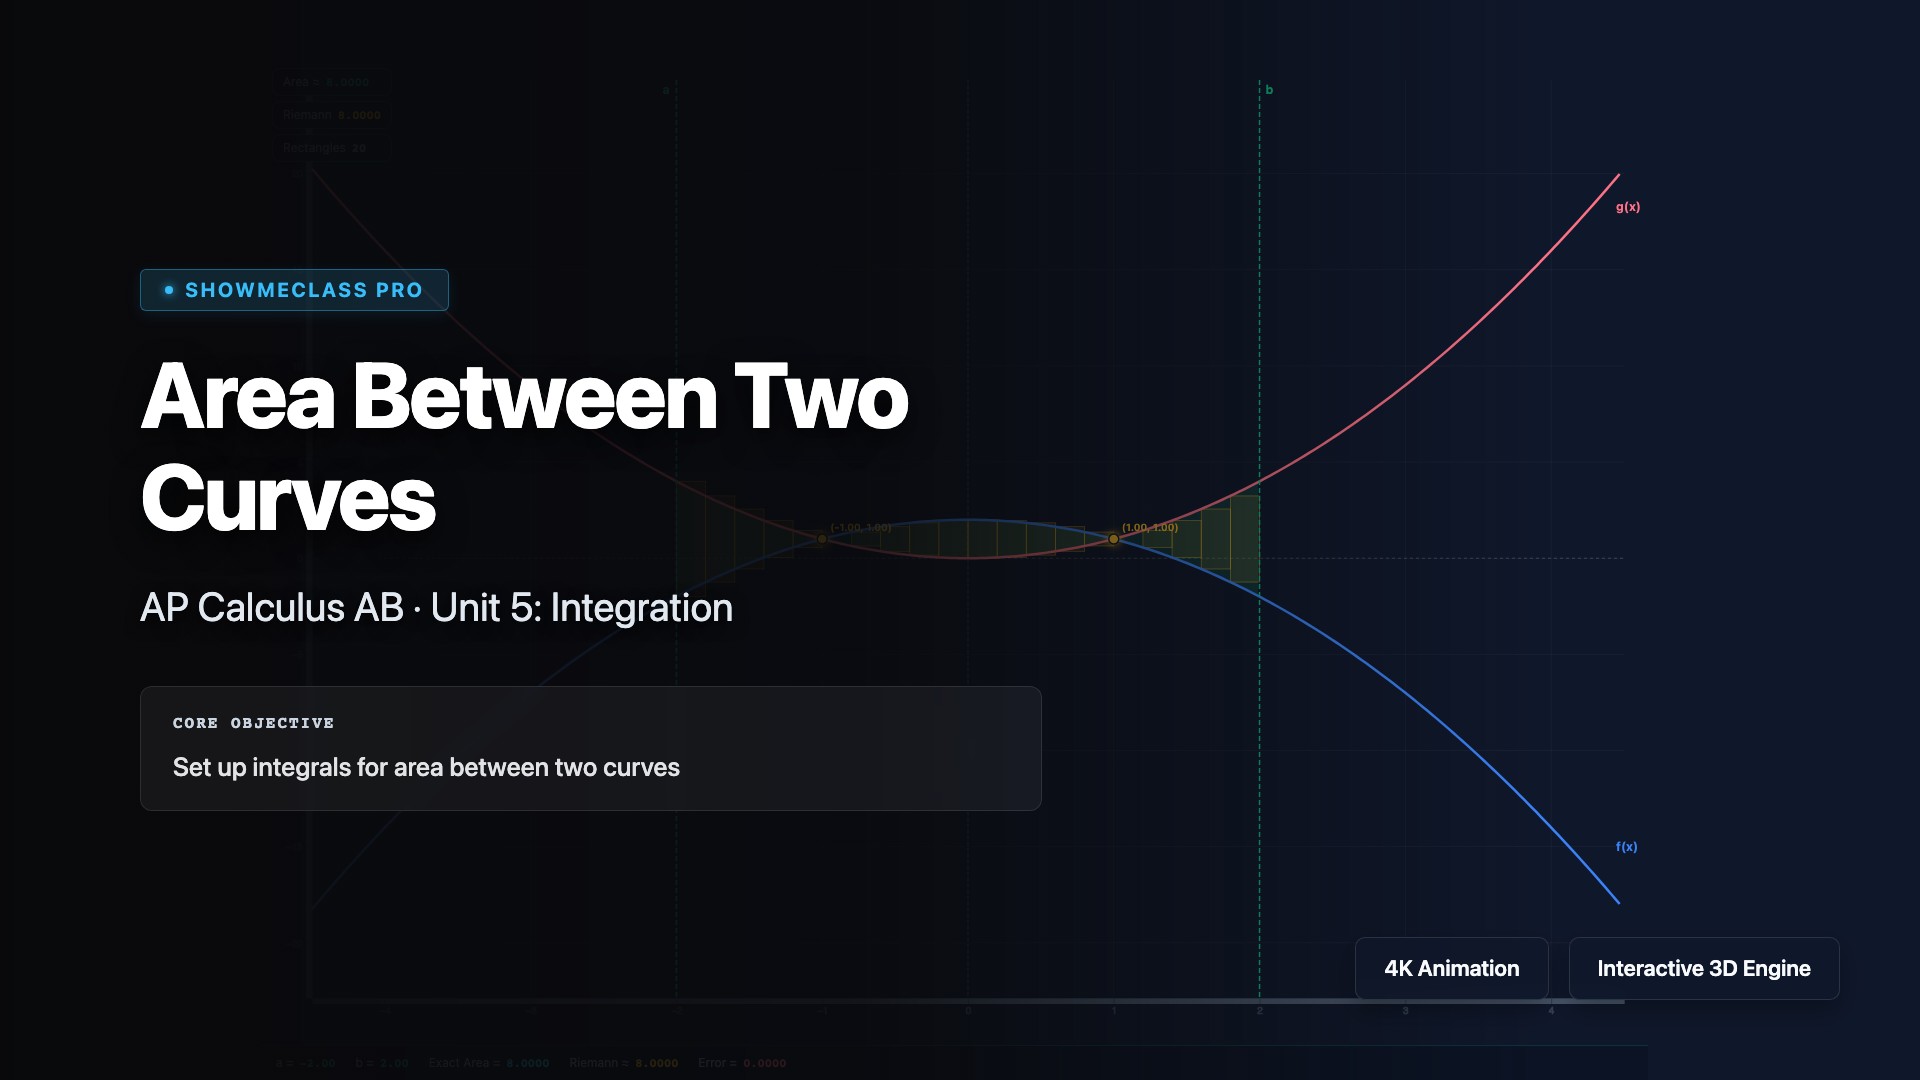
Area Between Two Curves
Visualize and calculate the area between two curves using definite integrals. Explore how to find intersection points, determine which function is on top, and set up the integral ∫[a to b] (f(x) - g(x))dx. Practice with vertical and horizontal slicing methods, and understand applications in physics, economics, and geometry where finding regions between curves is essential.
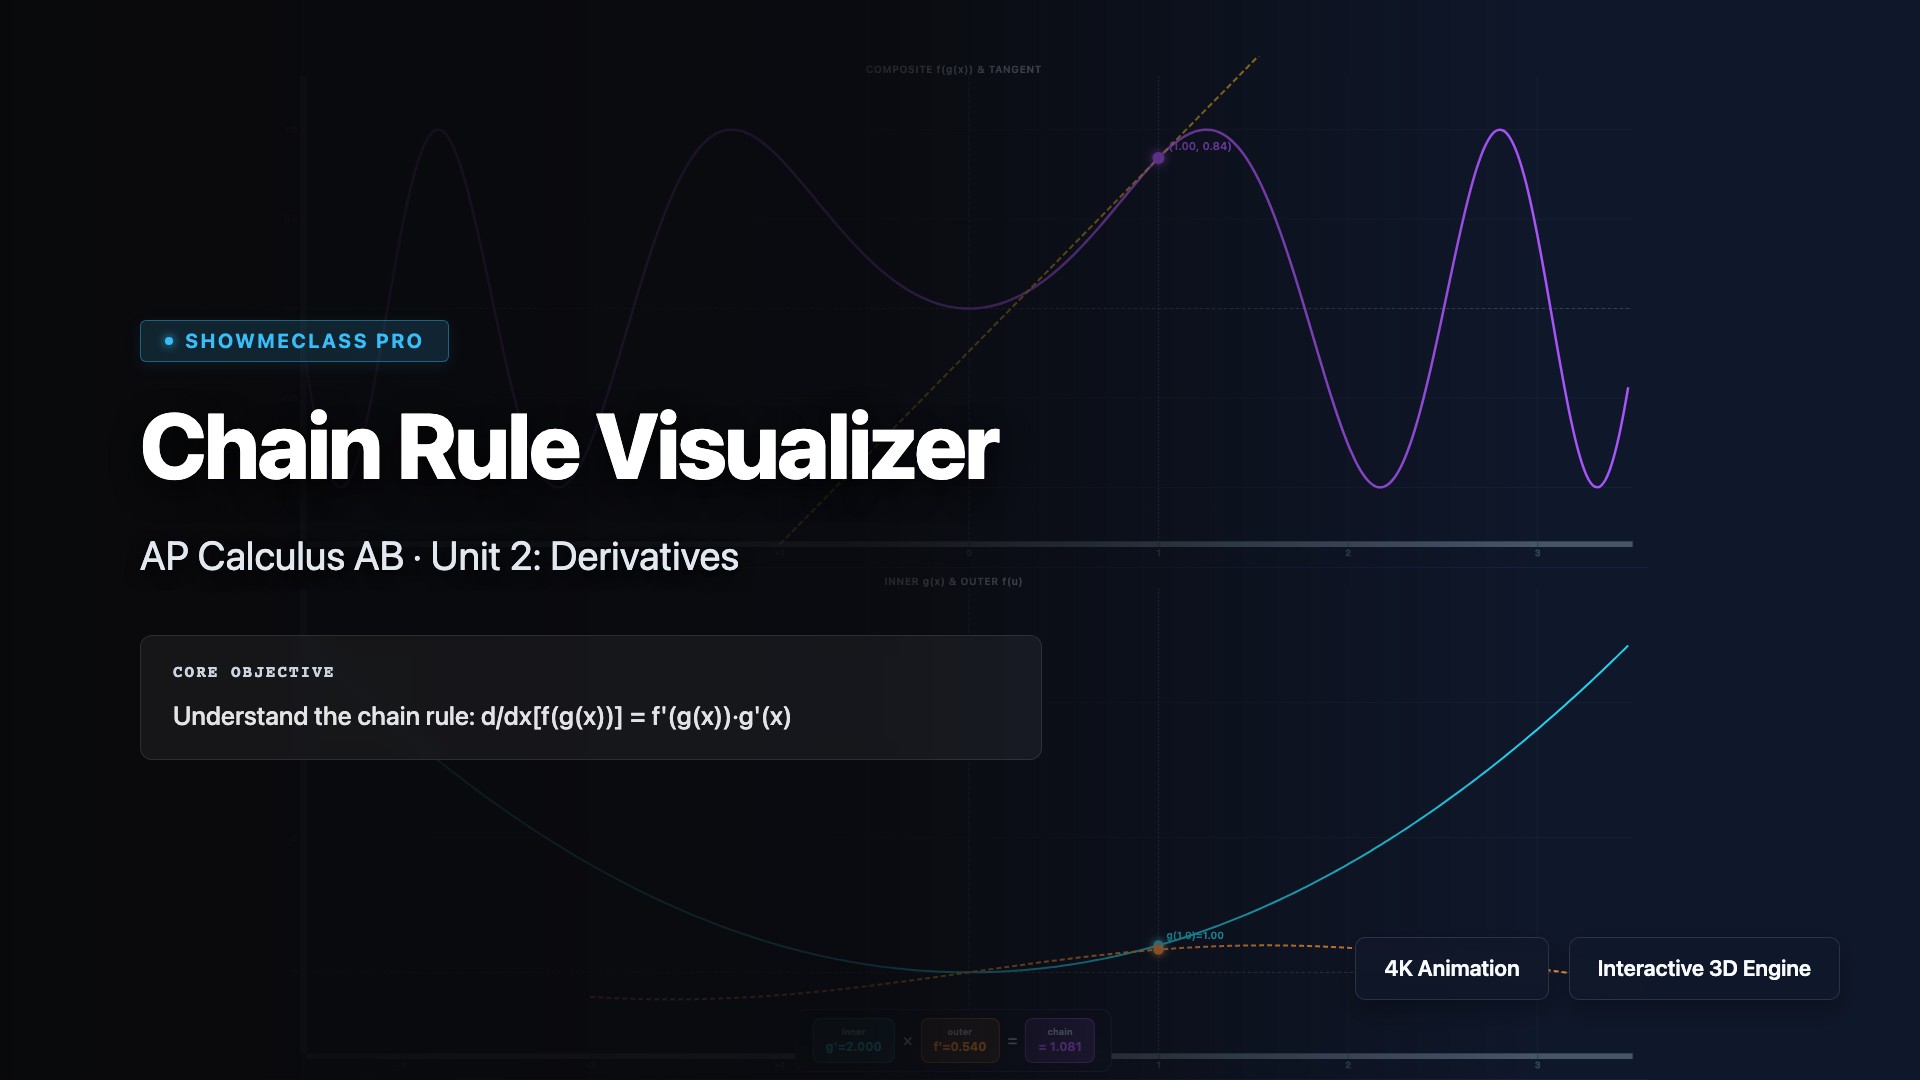
Chain Rule Visualizer
Visualize the chain rule for differentiating composite functions, one of the most powerful differentiation techniques in calculus. Explore how d/dx[f(g(x))] = f'(g(x)) · g'(x) by decomposing nested functions into outer and inner components. Practice identifying composite functions, applying the chain rule step-by-step, and understanding how rates of change multiply through function composition.
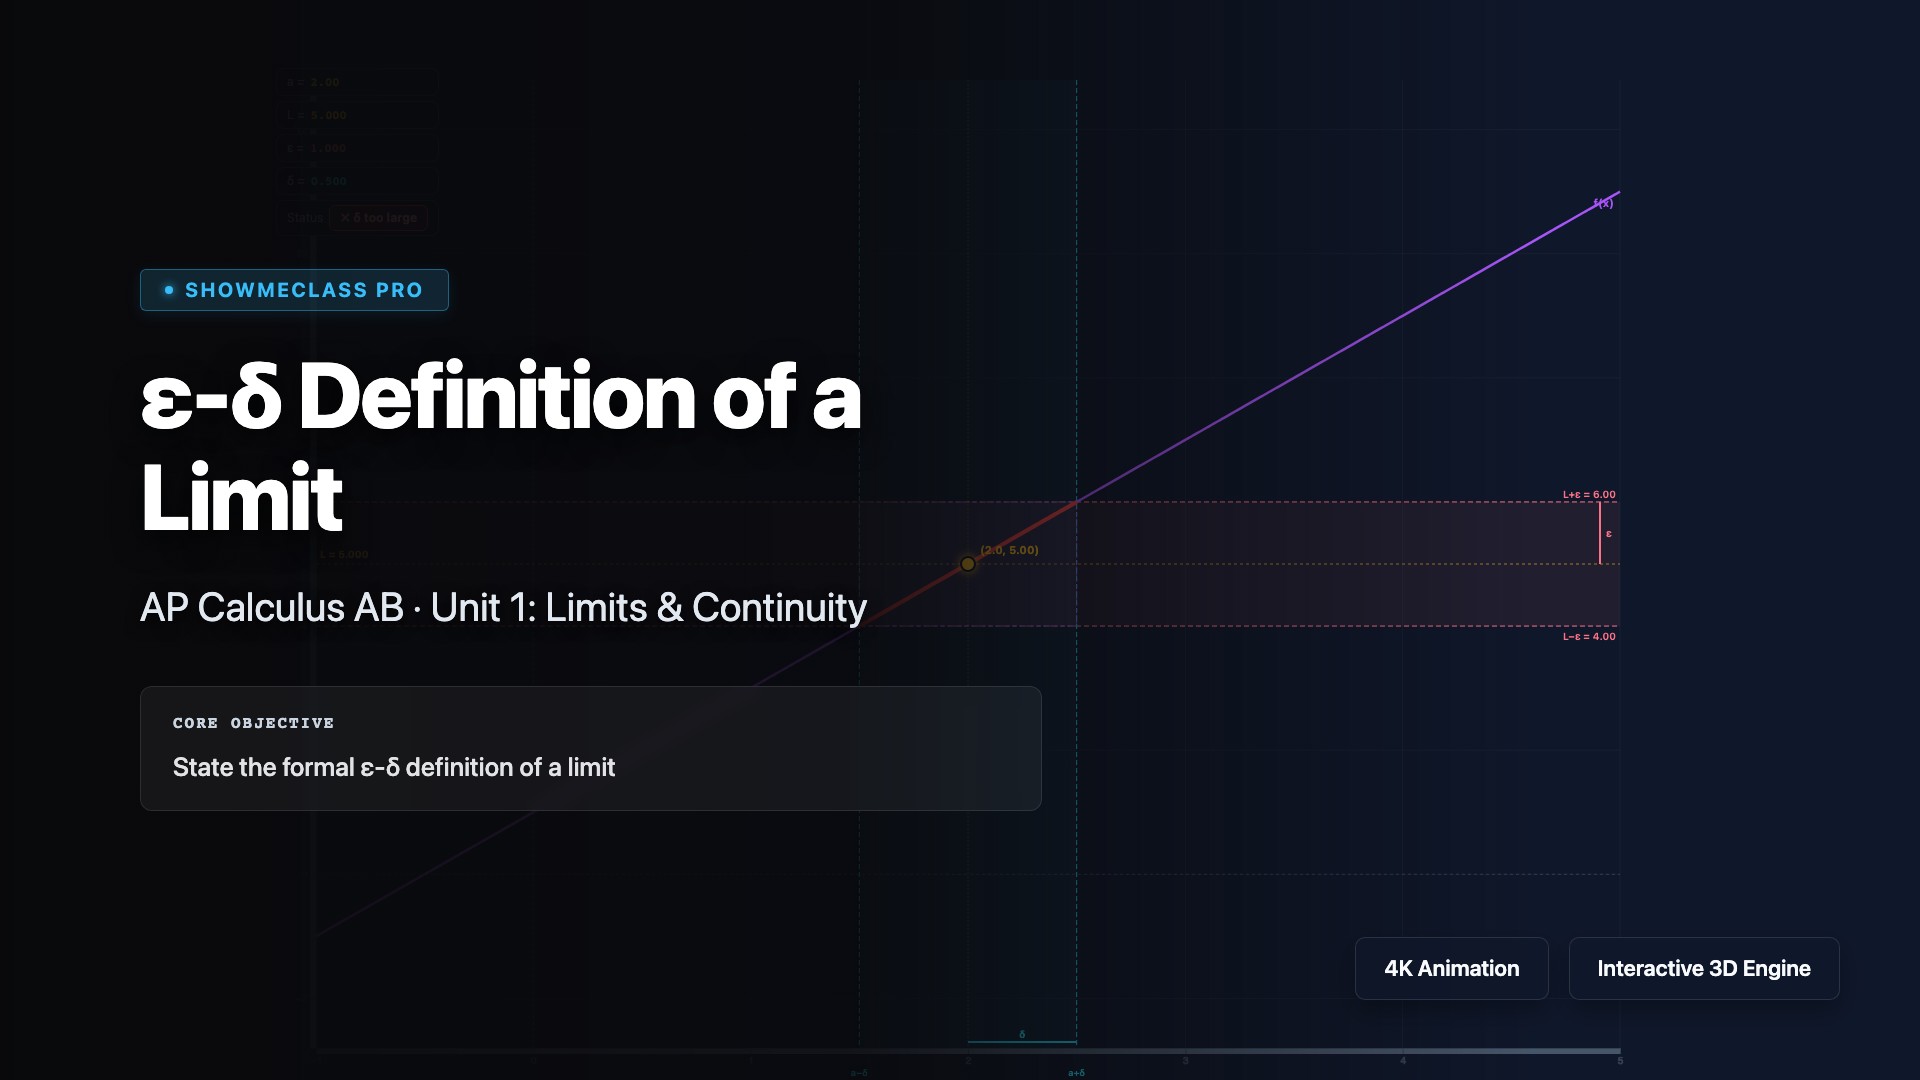
ε-δ Definition of a Limit
Explore the rigorous epsilon-delta (ε-δ) definition of a limit, the formal foundation of calculus. Visualize how for every ε > 0, there exists a δ > 0 such that if 0 < |x - c| < δ, then |f(x) - L| < ε. Understand how this definition precisely captures the intuitive notion that f(x) approaches L as x approaches c, and practice constructing epsilon-delta proofs.
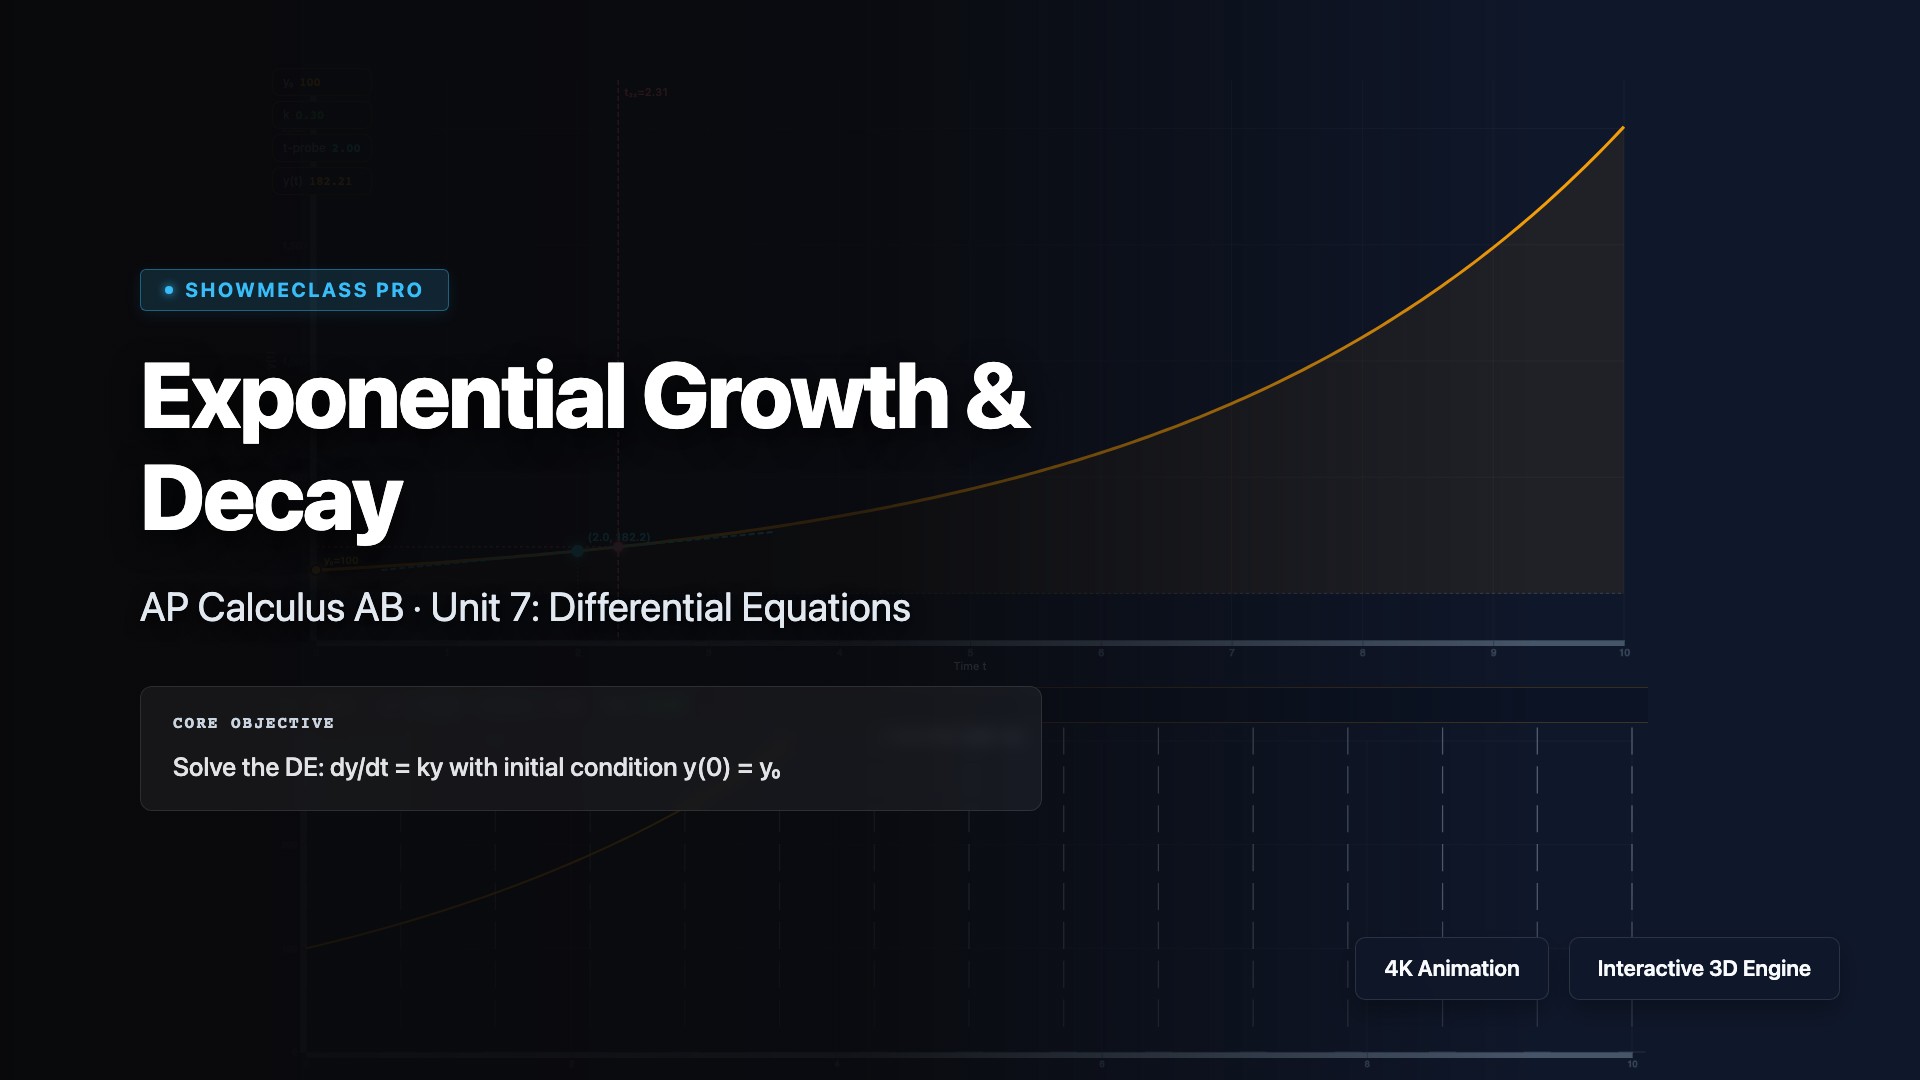
Exponential Growth & Decay
Model exponential growth and decay processes using differential equations of the form dy/dt = ky. Explore how the solution y = y₀e^(kt) describes phenomena like population growth, radioactive decay, compound interest, and Newton's law of cooling. Understand the significance of the growth constant k, half-life, and doubling time in real-world applications across biology, physics, and finance.
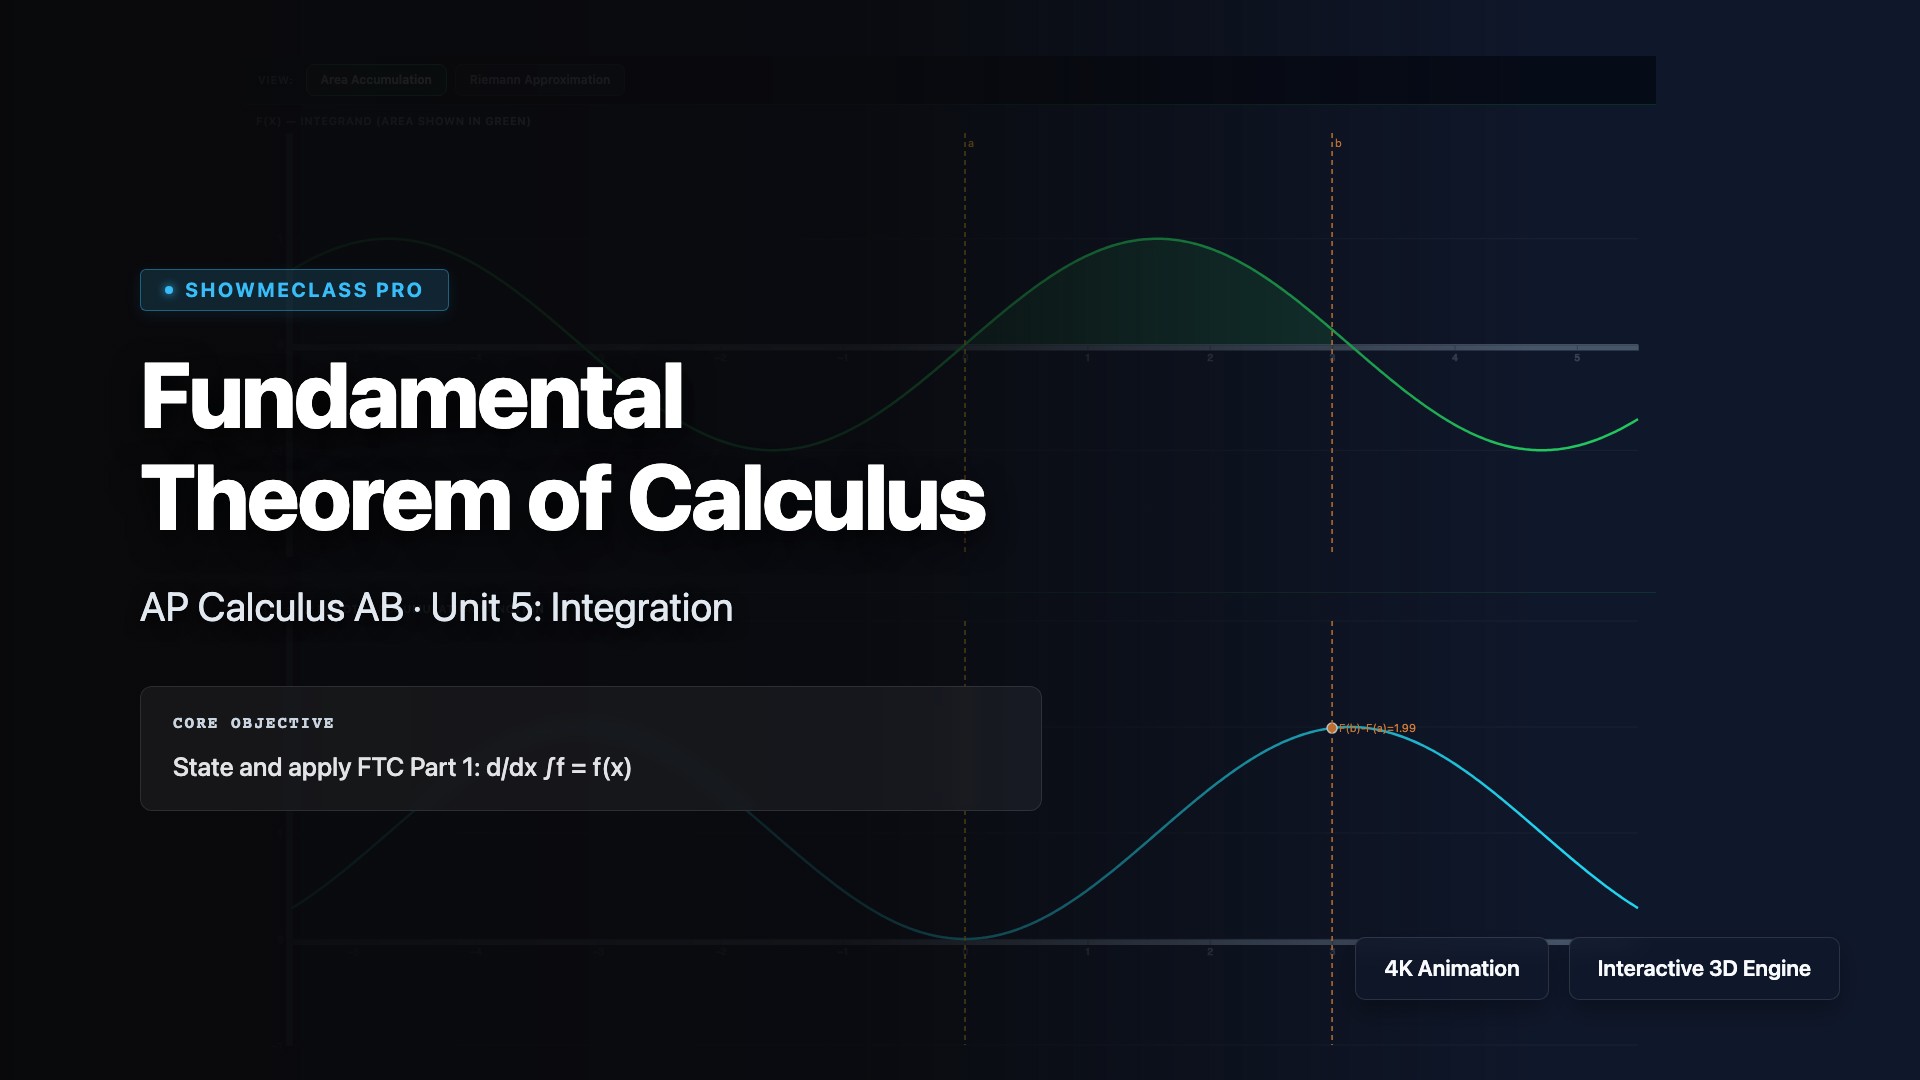
Fundamental Theorem of Calculus
Explore the Fundamental Theorem of Calculus, which connects differentiation and integration as inverse operations. Visualize Part 1: if F(x) = ∫[a to x] f(t)dt, then F'(x) = f(x), and Part 2: ∫[a to b] f(x)dx = F(b) - F(a) where F is any antiderivative of f. Understand how this theorem enables efficient calculation of definite integrals and reveals the deep relationship between rates of change and accumulation.
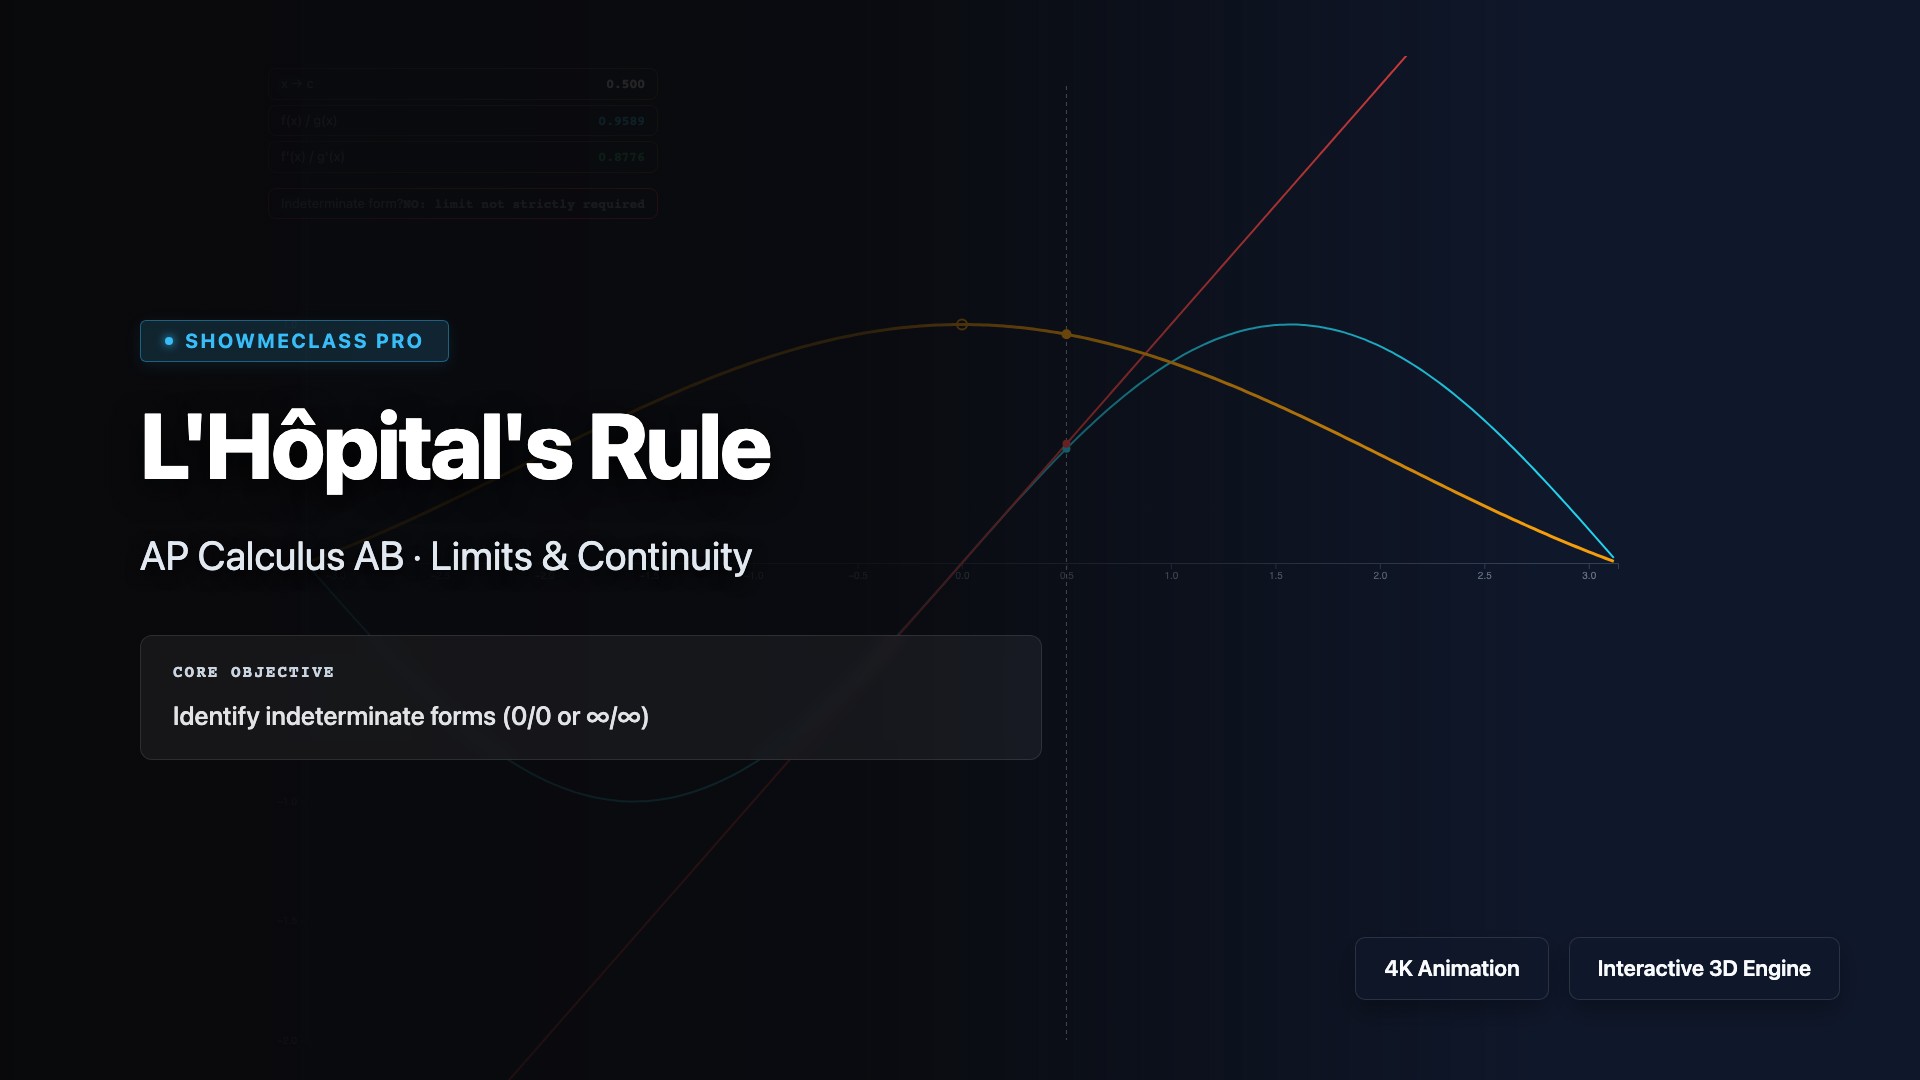
L'Hôpital's Rule
Apply L'Hôpital's Rule to evaluate indeterminate forms like 0/0 and ∞/∞ by taking derivatives of the numerator and denominator. Visualize how lim[x→c] f(x)/g(x) = lim[x→c] f'(x)/g'(x) when the original limit produces an indeterminate form. Practice identifying when to apply the rule, handling repeated applications, and recognizing other indeterminate forms like 0·∞, ∞-∞, 0⁰, 1^∞, and ∞⁰.
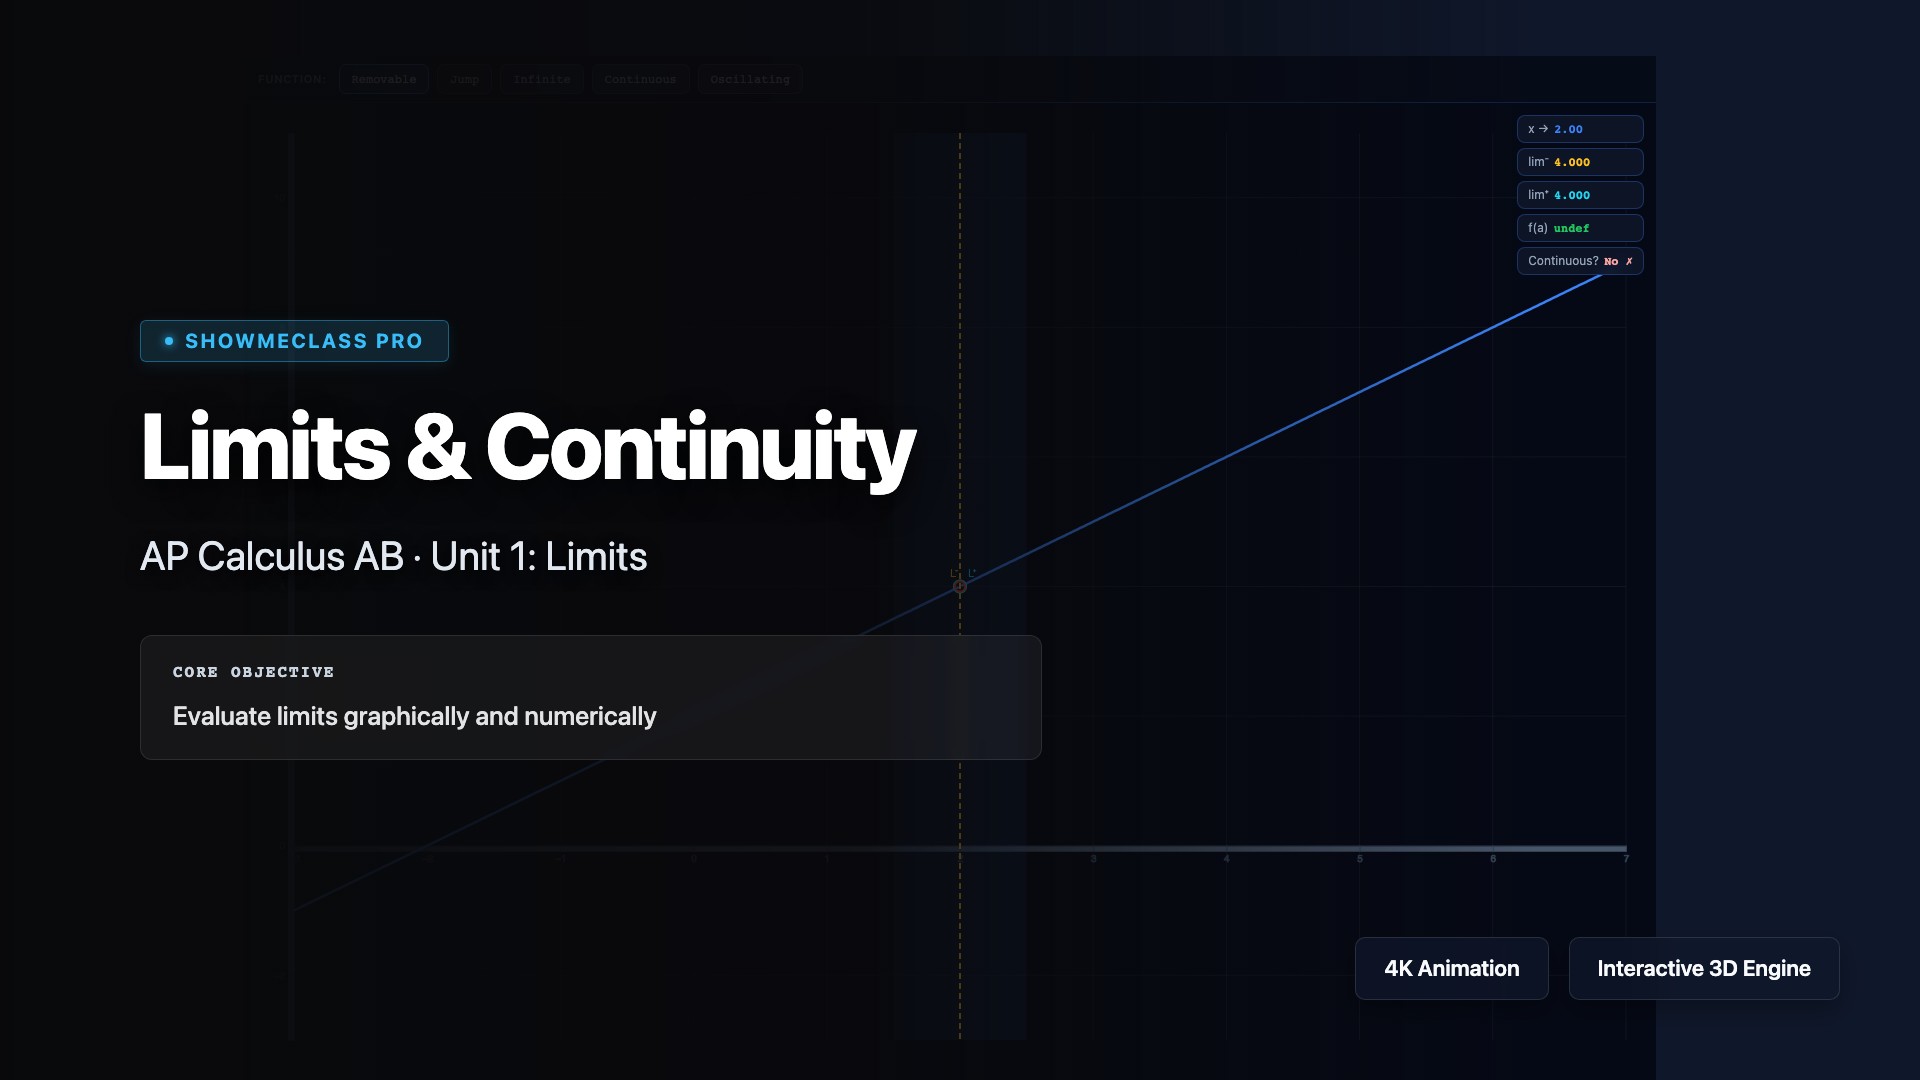
Limits & Continuity
Explore the foundational concepts of limits and continuity that underpin all of calculus. Visualize one-sided limits, two-sided limits, and limits at infinity. Understand the three conditions for continuity at a point: f(c) is defined, lim[x→c] f(x) exists, and lim[x→c] f(x) = f(c). Practice identifying discontinuities (removable, jump, and infinite) and applying limit laws to evaluate complex expressions.
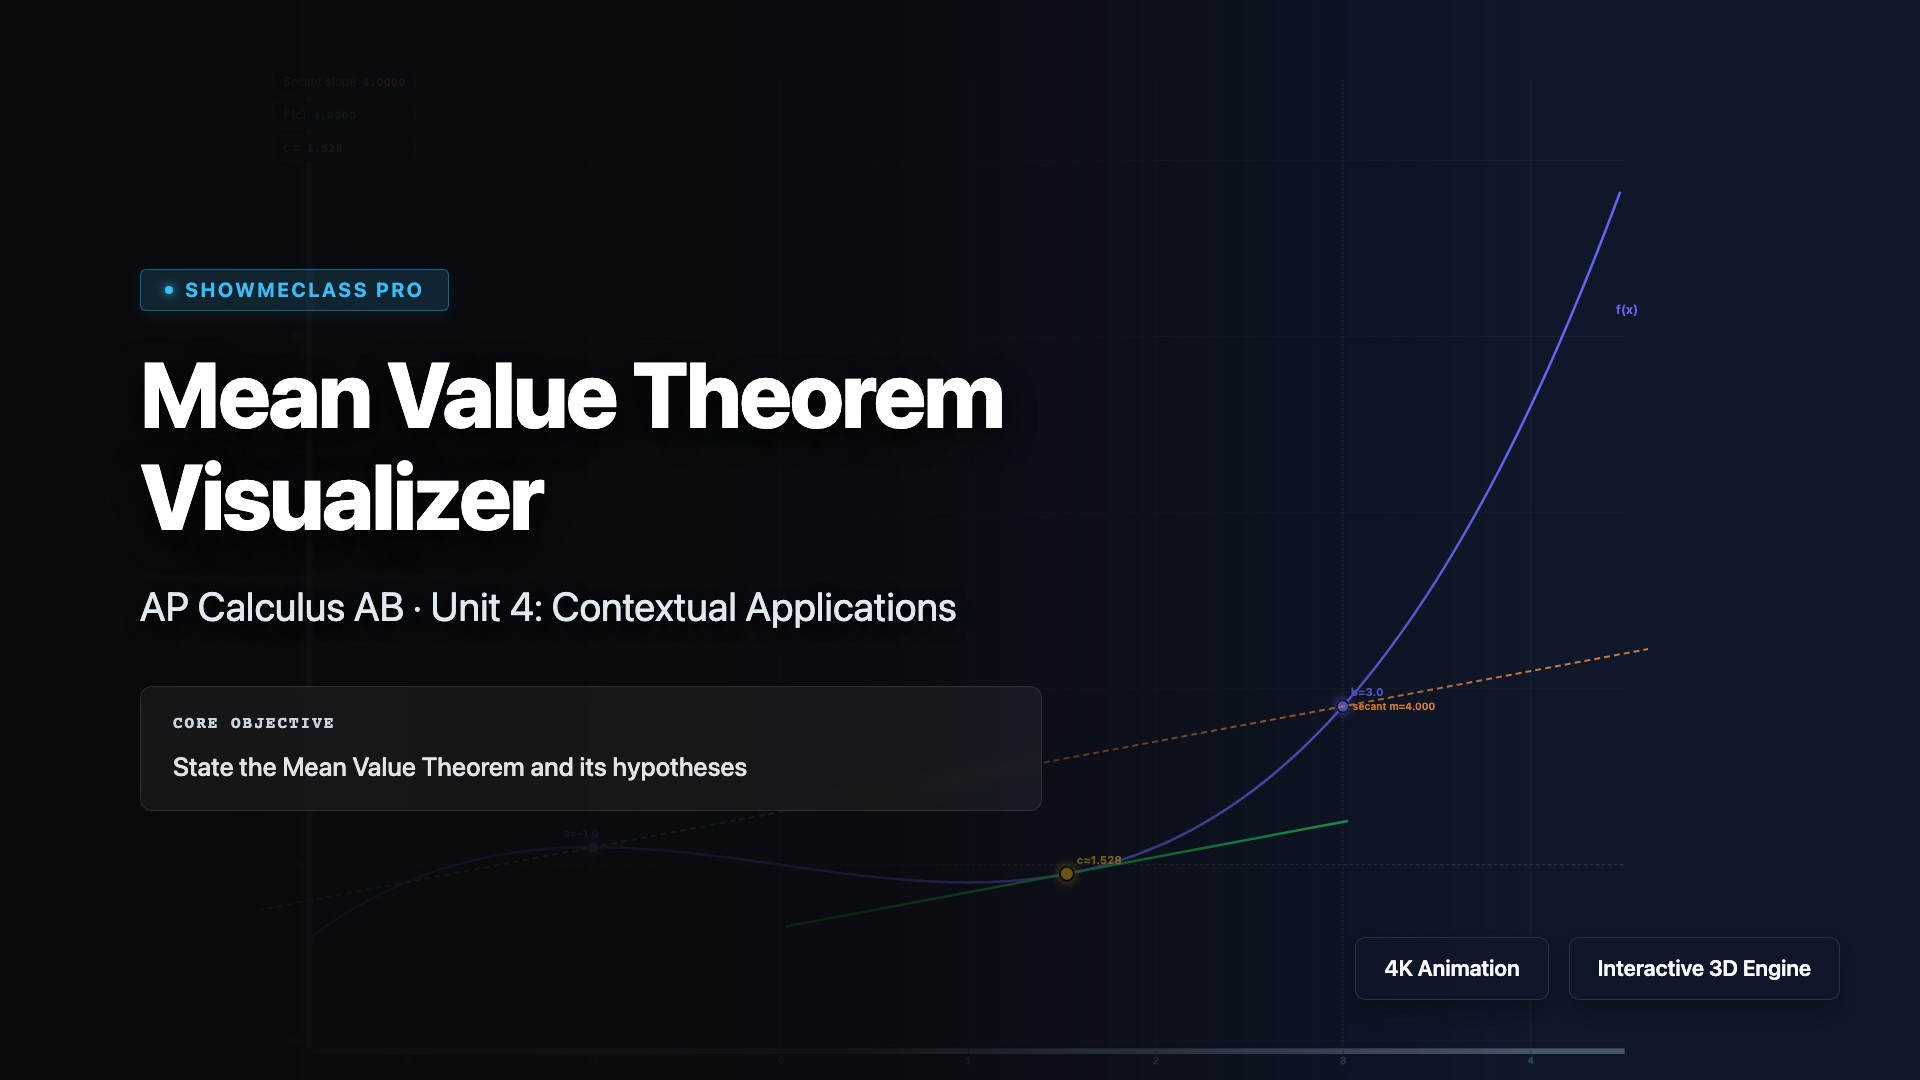
Mean Value Theorem Visualizer
Visualize the Mean Value Theorem (MVT), which guarantees that for a continuous and differentiable function on [a,b], there exists at least one point c where f'(c) = (f(b)-f(a))/(b-a). Explore how the instantaneous rate of change equals the average rate of change at some interior point. Understand MVT's applications in proving inequalities, analyzing motion, and establishing fundamental results like the constant difference theorem.