Showing 12 results
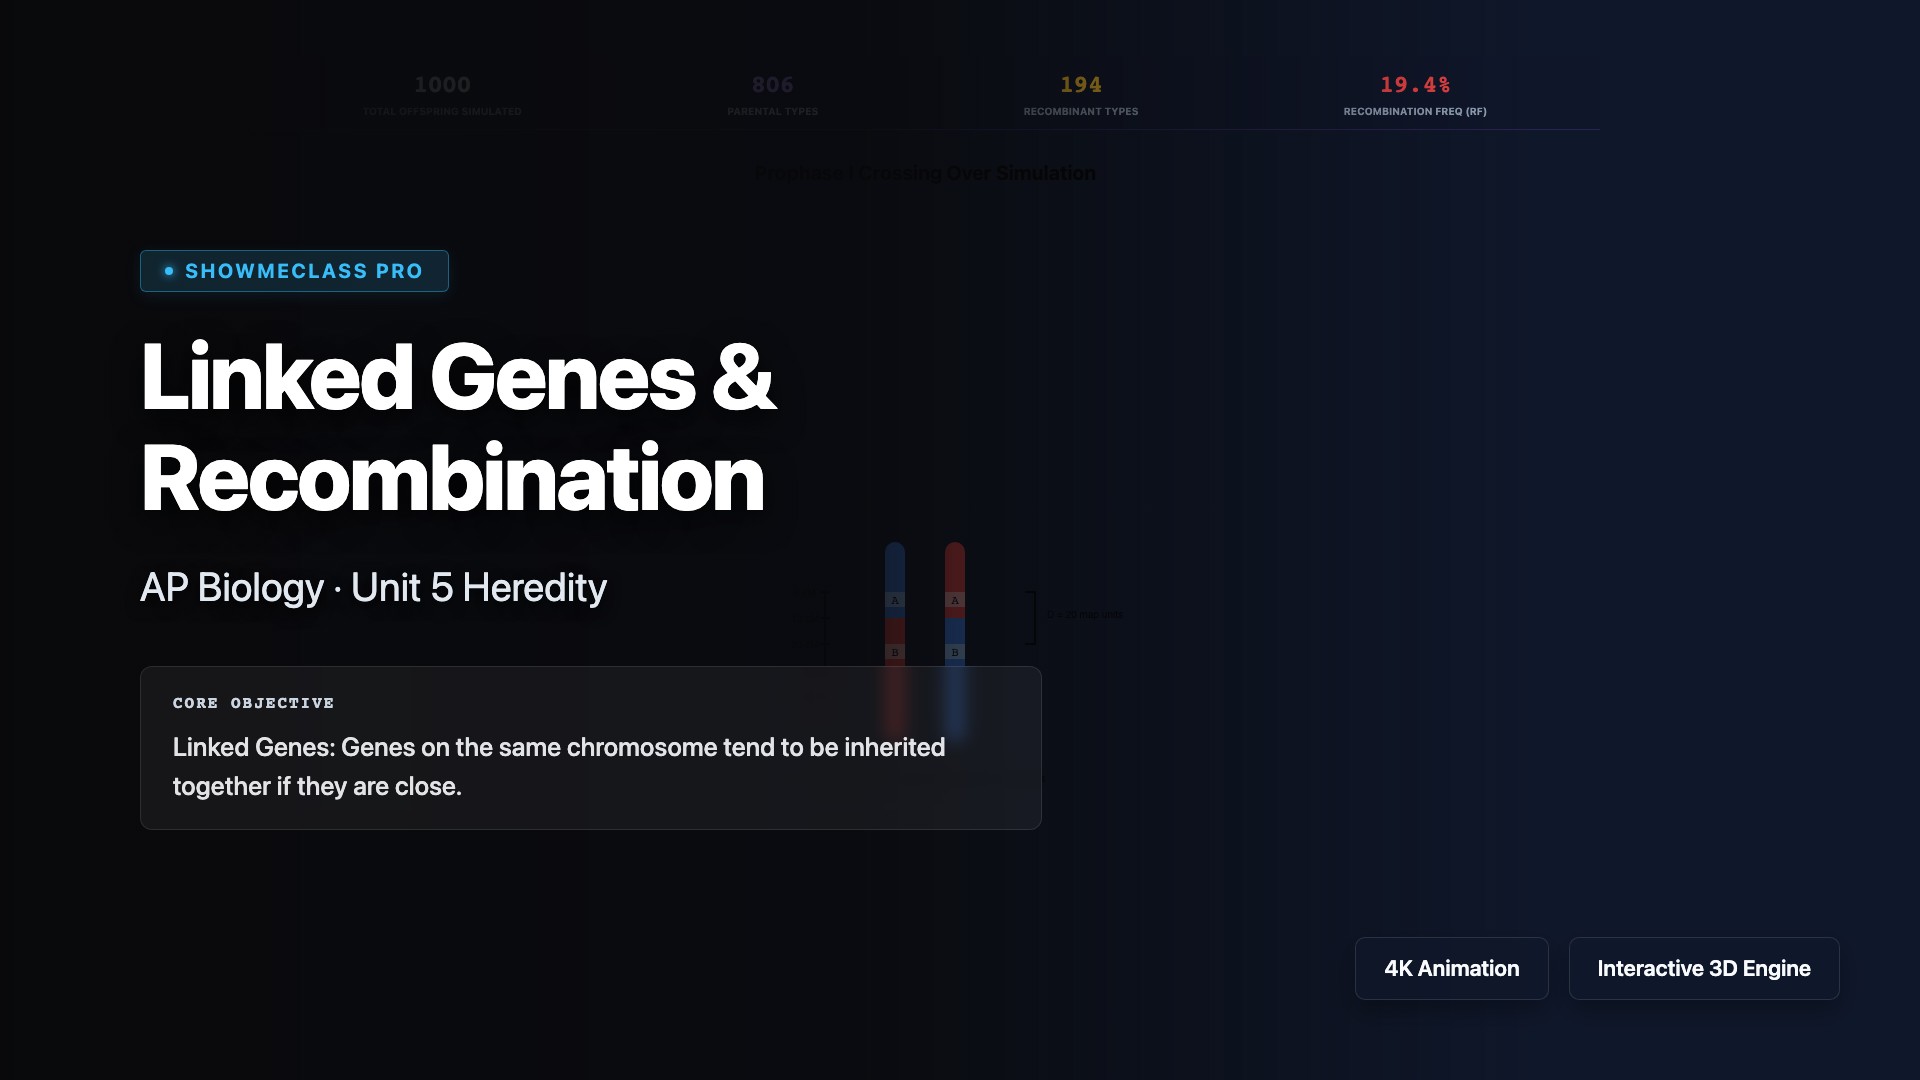
Linked Genes & Recombination
Adjust the physical map units between two genes to observe the dynamic probability of Prophase I crossing over and mathematically predict offspring Recombination Frequency.
Ribosome Translation Simulator
Step through translation: Small/Large ribosomal subunit assembly, A/P/E site tRNA translocation, peptide bond formation, and termination at a STOP codon.
Operon Regulation (Lac vs Trp)
Compare Inducible (Lac) vs Repressible (Trp) bacterial operons. Toggle inducer/corepressor presence to observe immediate repressor conformational changes and RNAP blockage.
Epigenetic Regulation
Visualize how DNA Methylation tightly coils chromatin (turning genes OFF) and Histone Acetylation loosens chromatin (turning genes ON), bypassing the underlying DNA sequence.
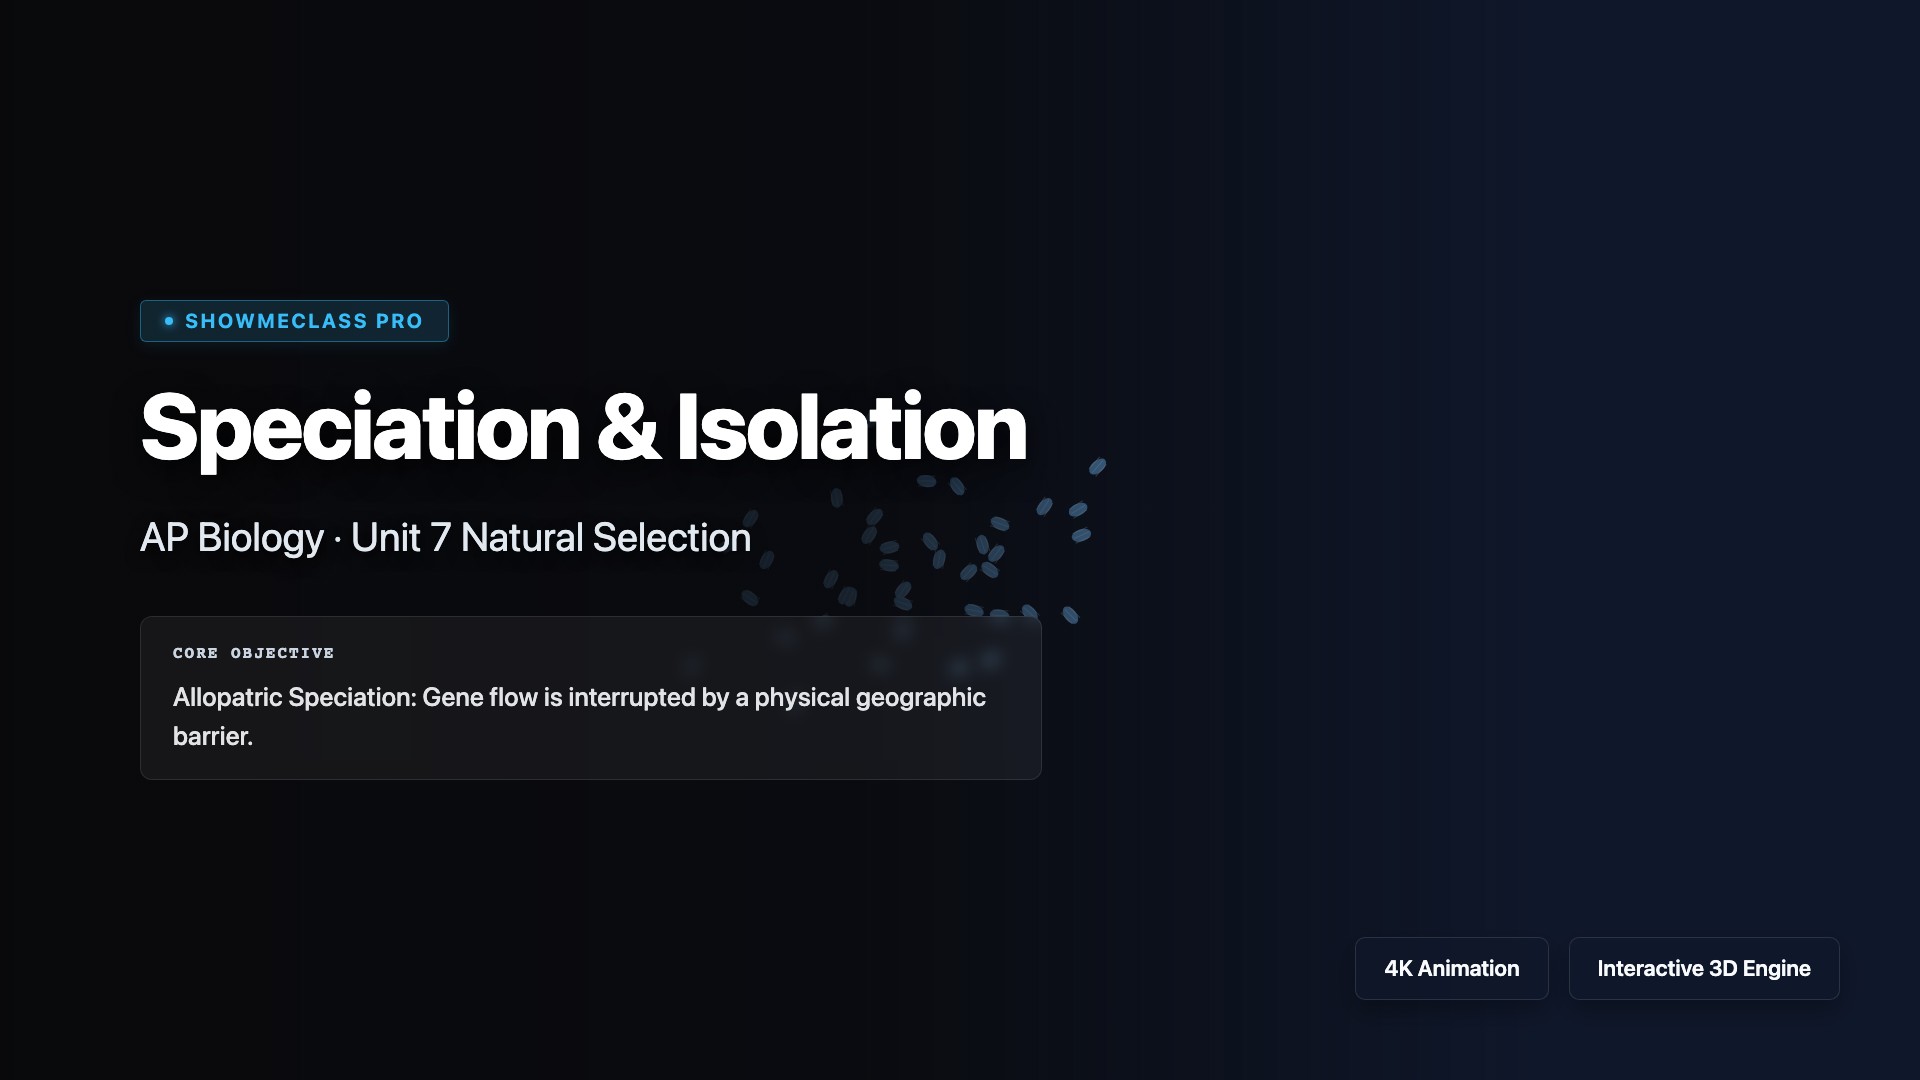
Speciation & Reproductive Isolation
Simulate populations diverging into distinct species by interrupting gene flow through Allopatric (Geographic River) or Sympatric (Polyploidy/Behavioral) isolating mechanisms.
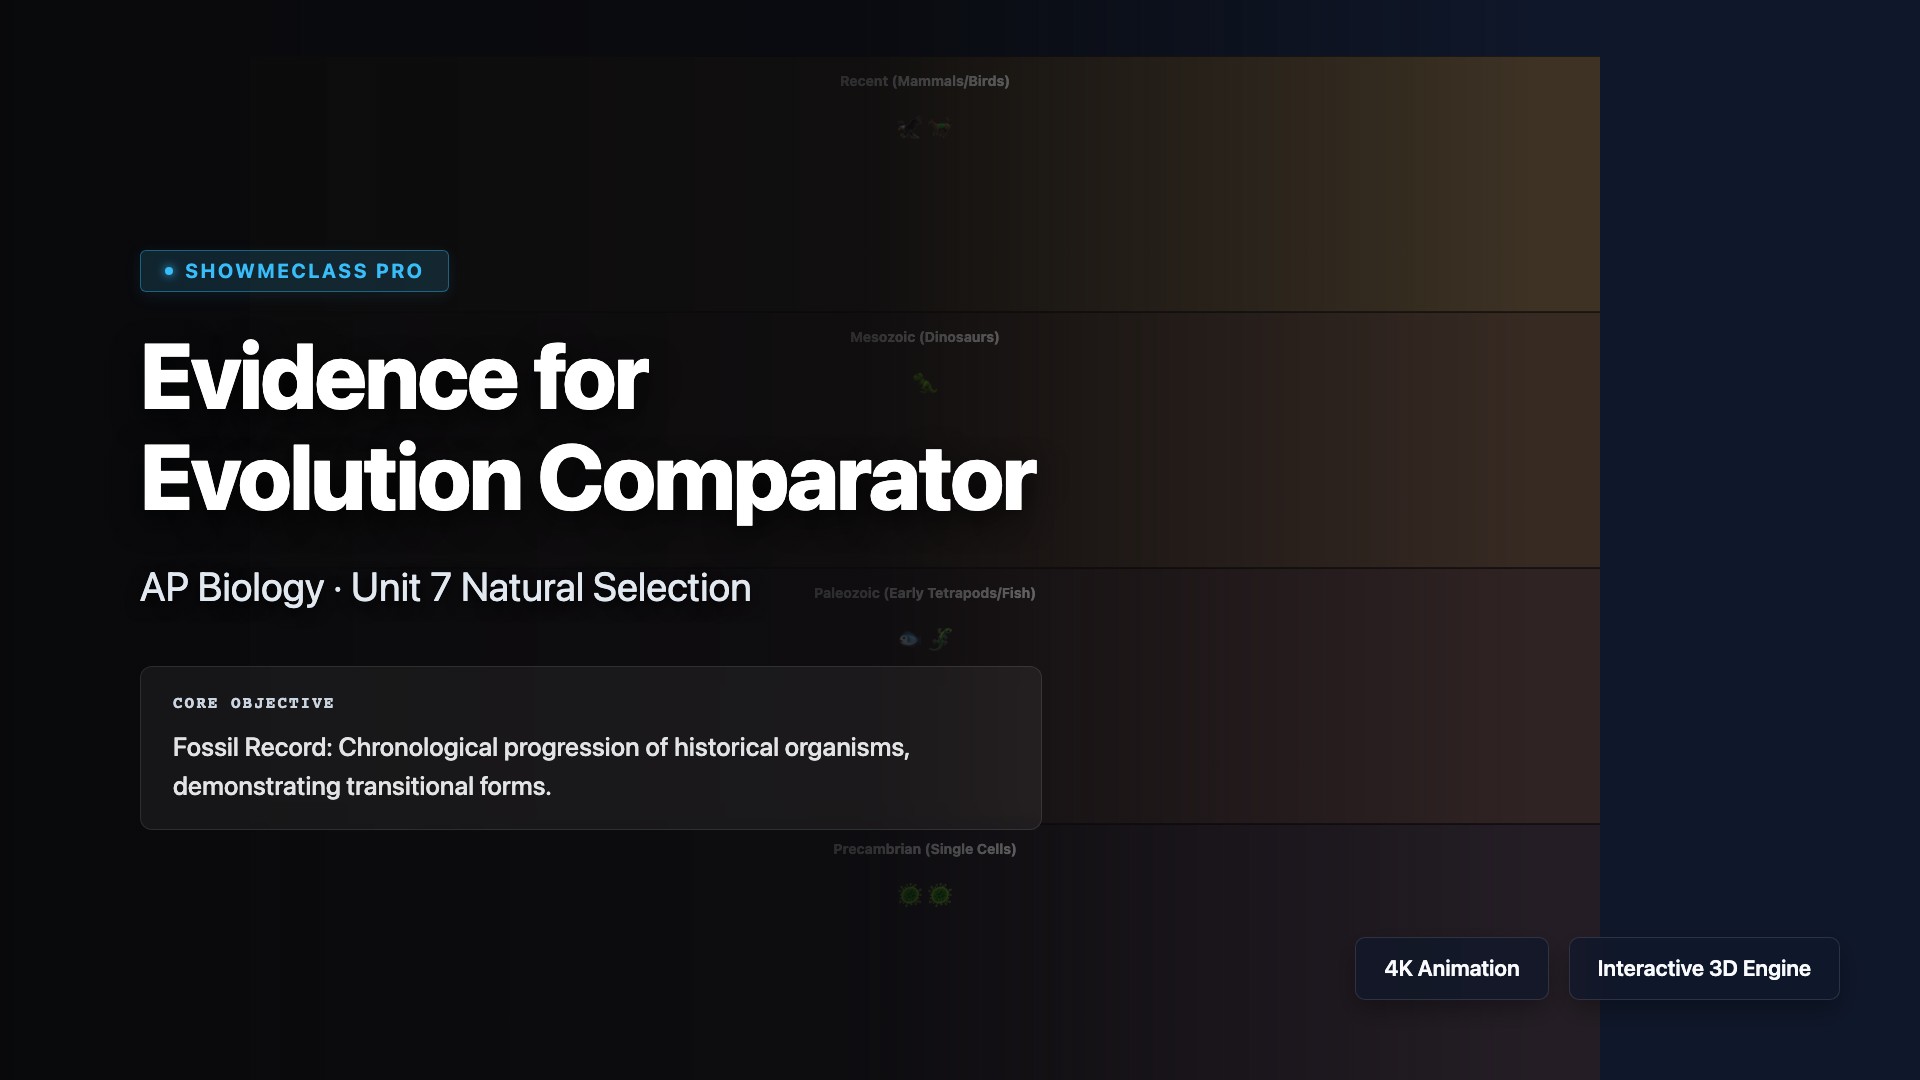
Evidence for Evolution Comparator
Compare the 3 main pillars of evolutionary evidence: Stratigraphic Fossil Progression, Bone Mapping of Homologous Structures, and Cytochrome c Amino Acid divergence.
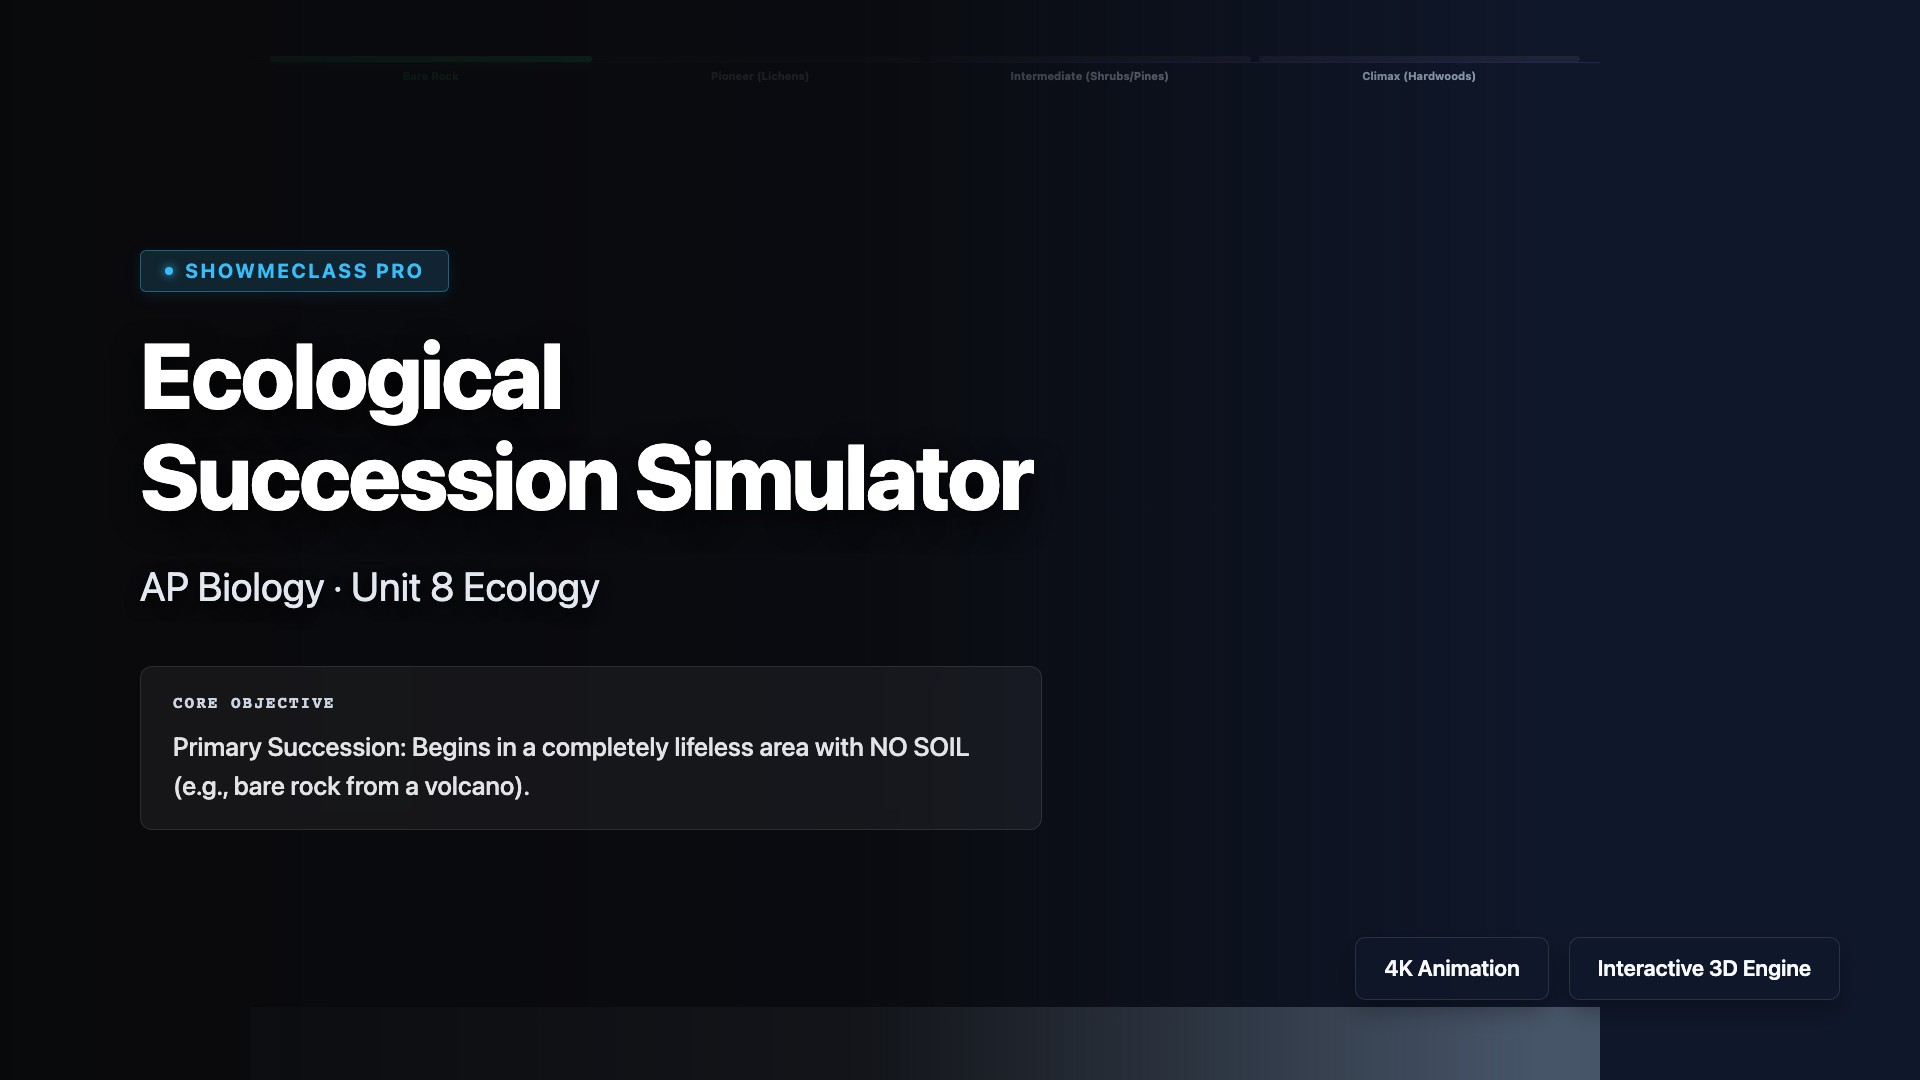
Ecological Succession Simulator
Advance a lifeless rocky landscape through Primary Succession using lichen pioneers. Trigger a catastrophic fire to demonstrate the much faster, soil-rich process of Secondary Succession.
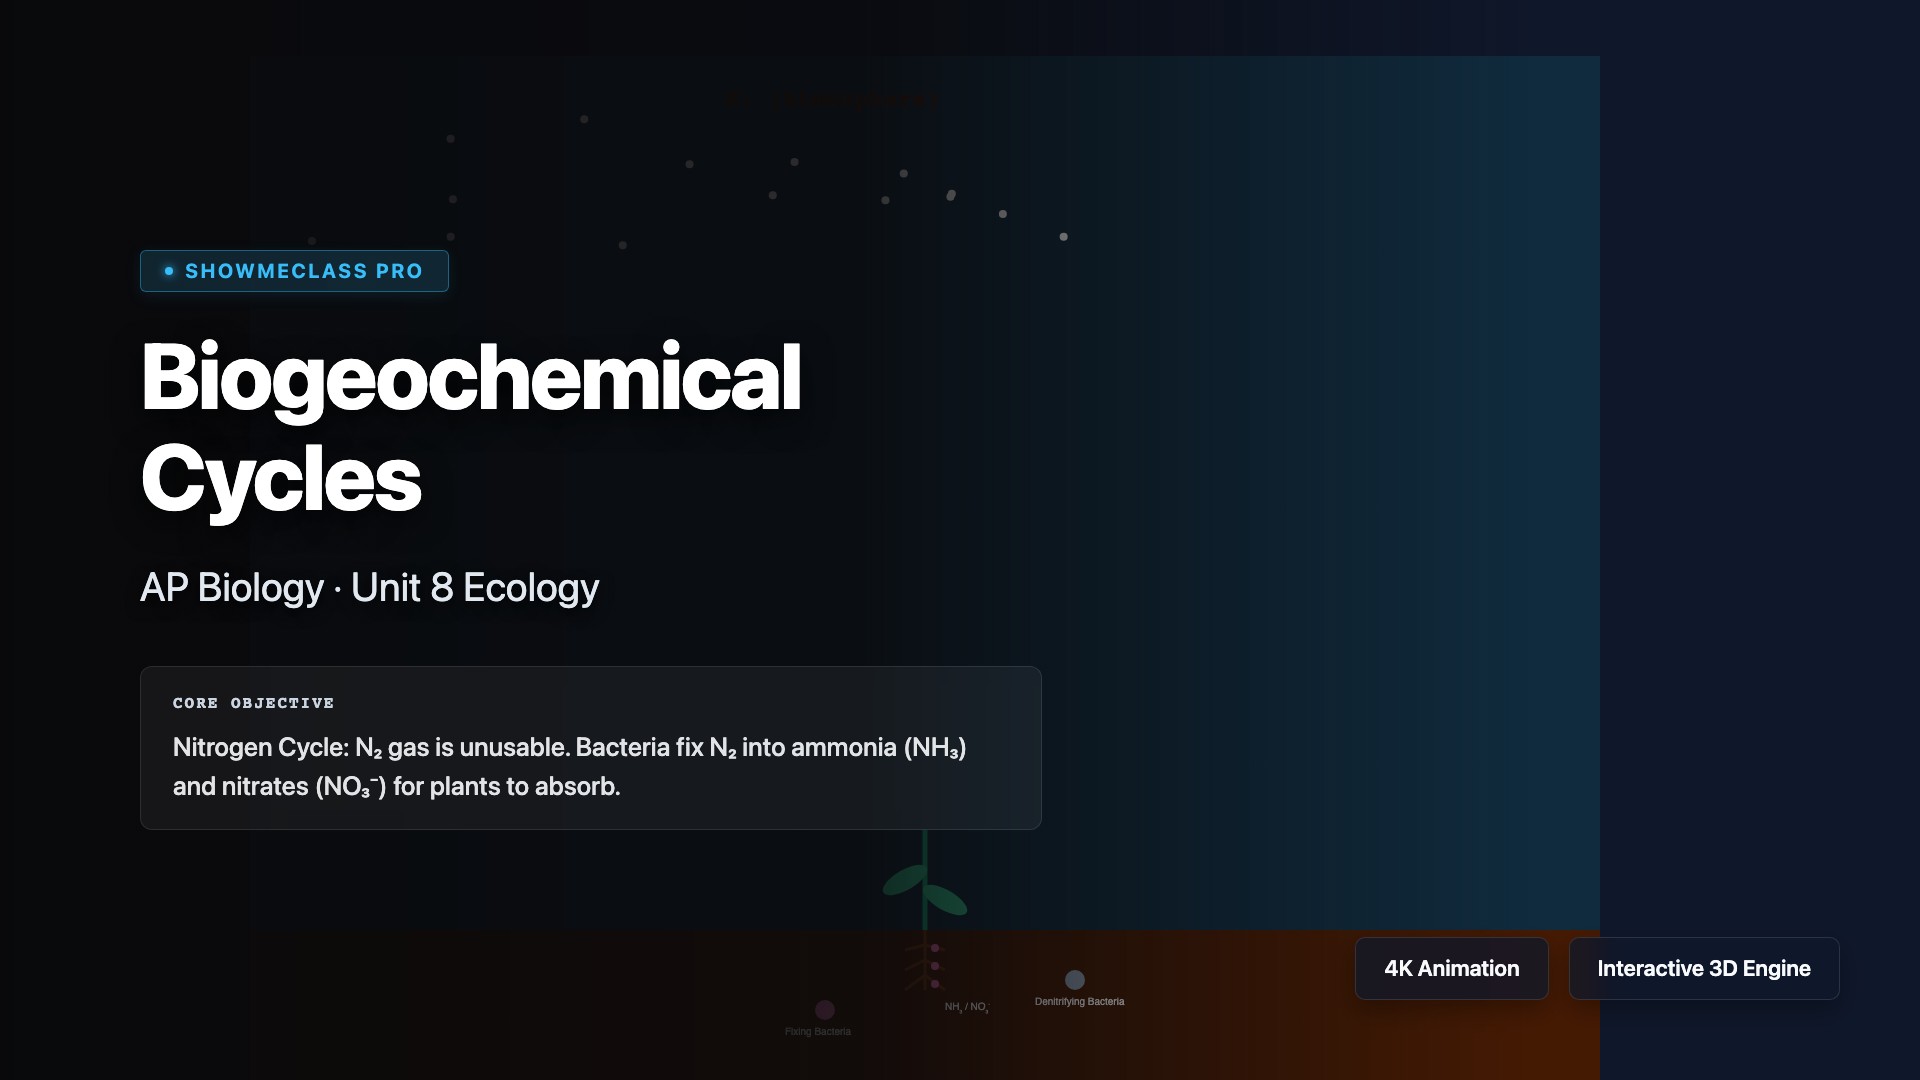
Biogeochemical Cycles (N & P)
Contrast the Nitrogen Cycle (relying entirely on root/soil bacteria to fix atmospheric N₂) against the Phosphorus Cycle (which lacks a gas phase and relies entirely on rock weathering).
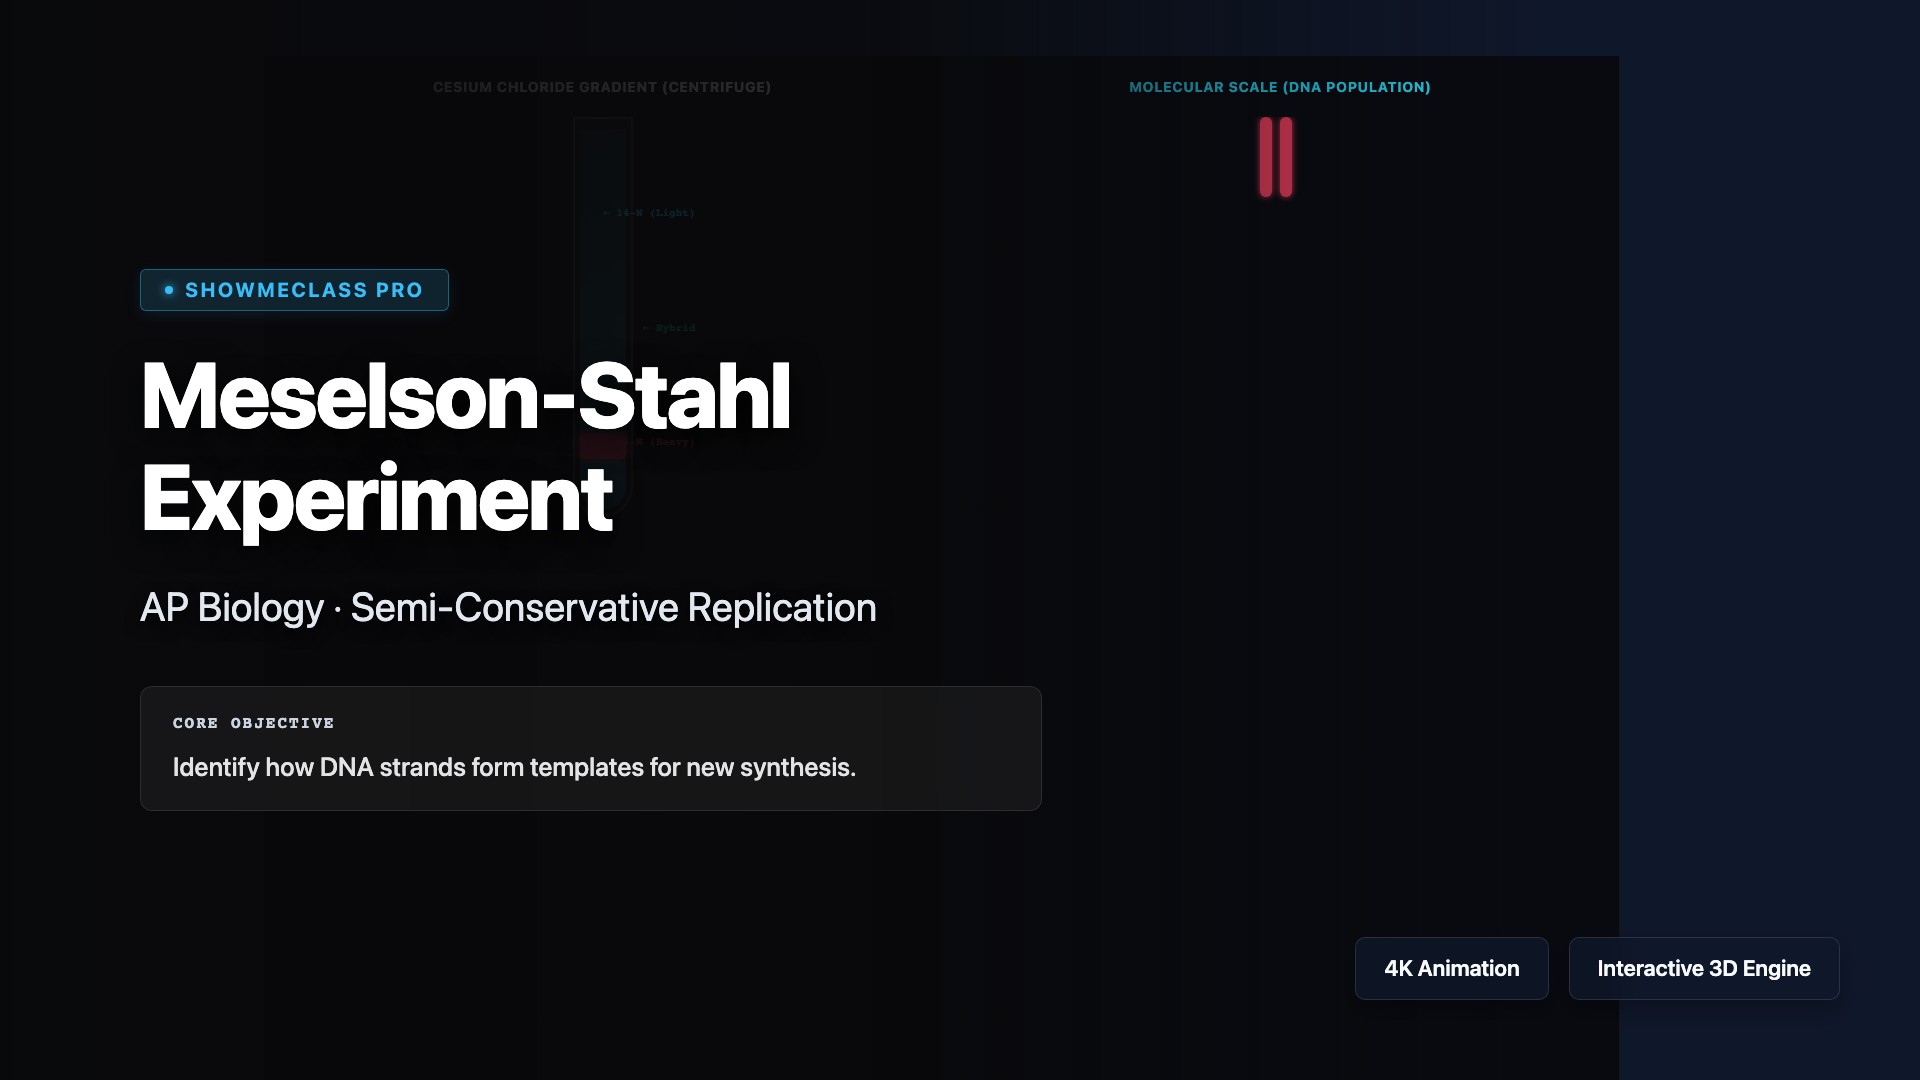
Meselson-Stahl DNA Replication
Replicate the most beautiful experiment in biology. Centrifuge radioactive nitrogen isotopes (15N vs 14N) across bacterial generations to generate heavy, hybrid, and light DNA bands proving semi-conservative replication.
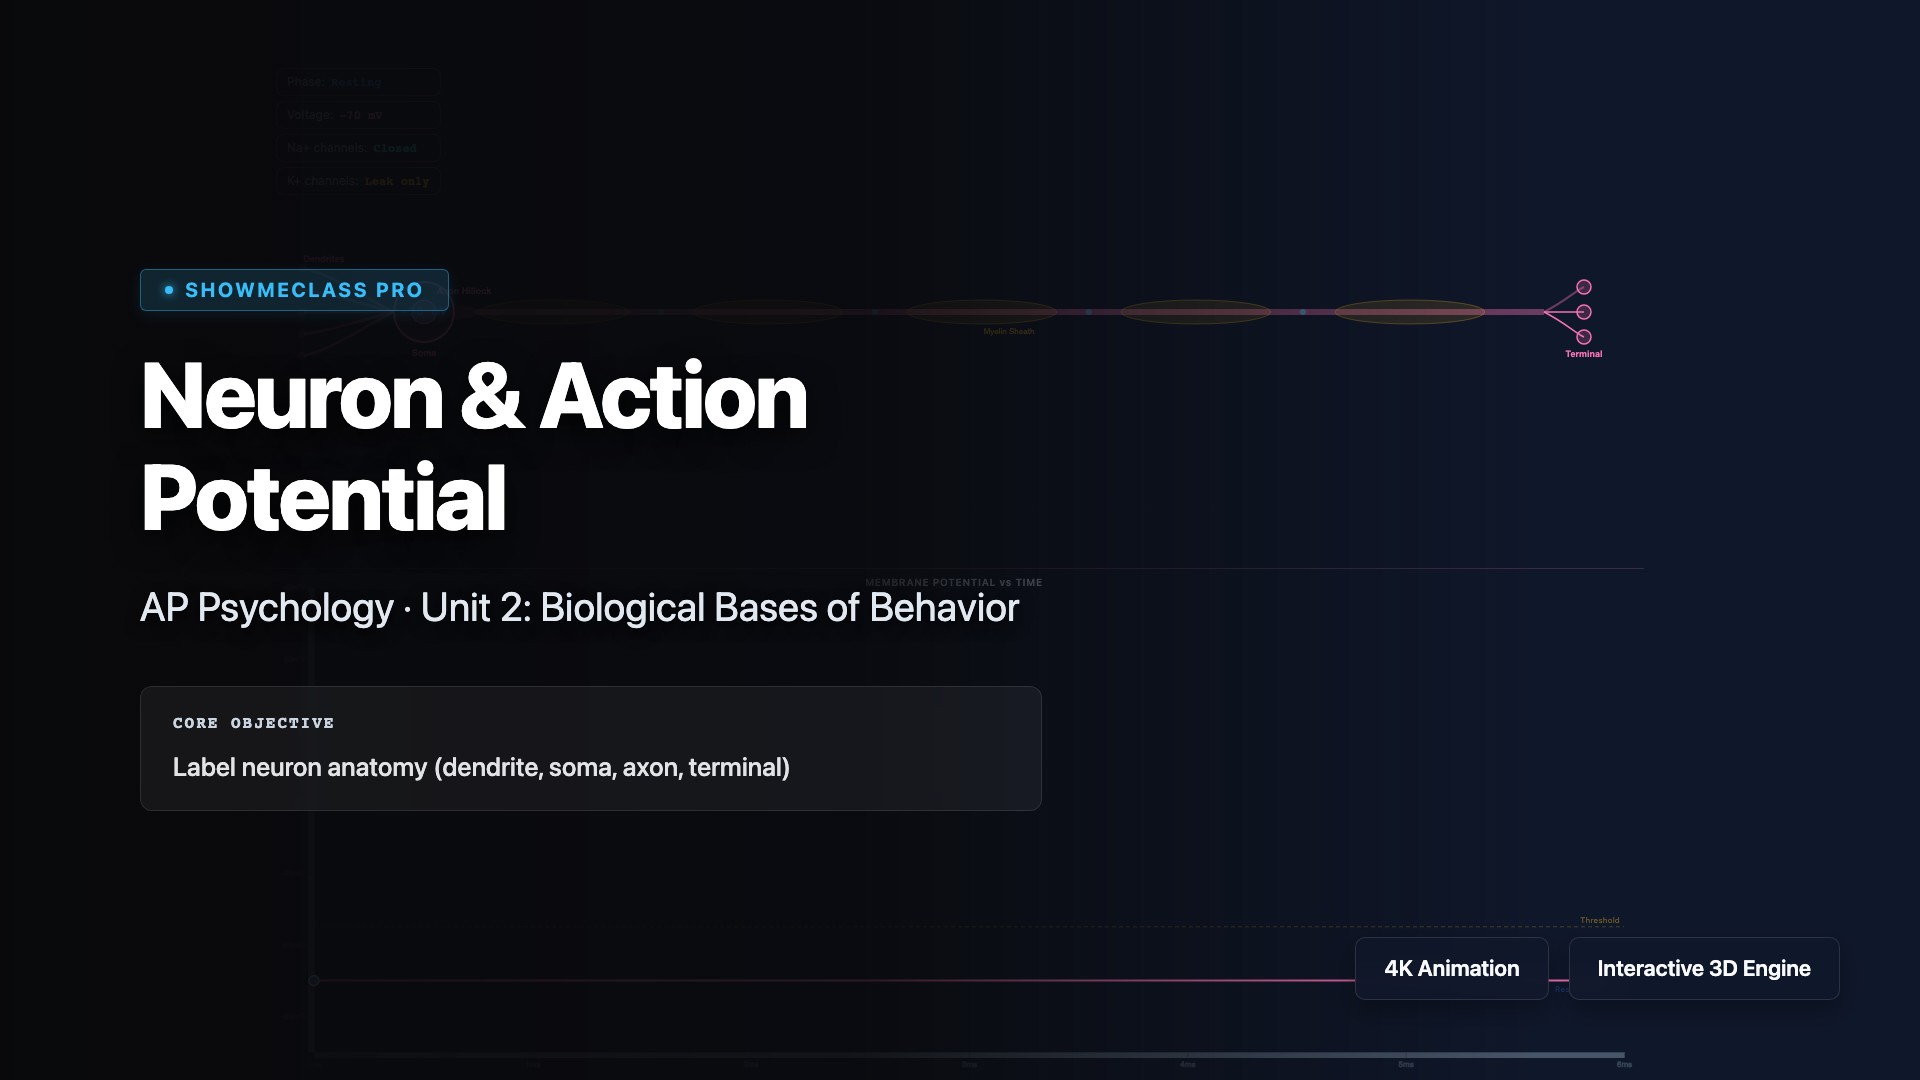
Neuron Action Potential Simulator
Trigger an electrical stimulus on a neuron and watch the membrane potential graph trace typical Depolarization, Repolarization, and Hyperpolarization phases. Track the live states of Na+ and K+ ion channels.
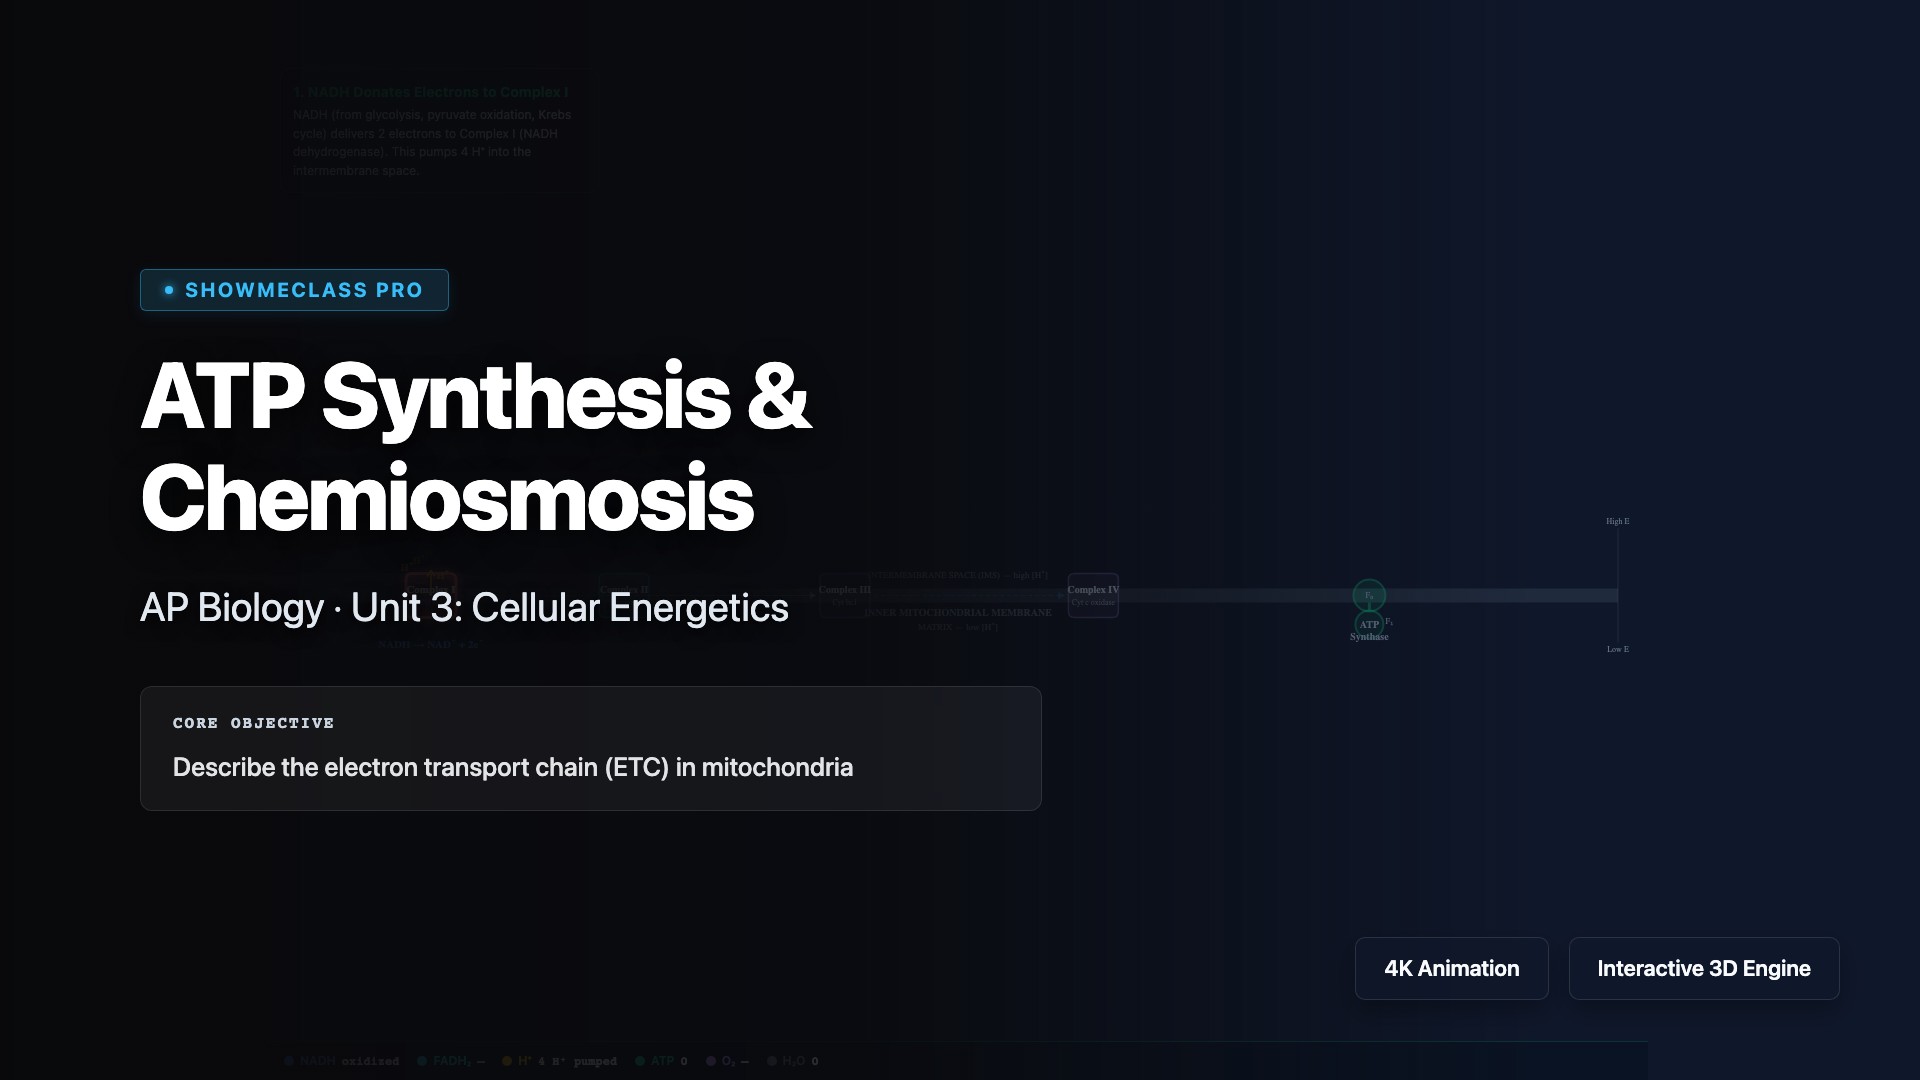
ATP Synthesis & Chemiosmosis
Explore how ATP synthase harnesses the proton gradient across the inner mitochondrial membrane to produce ATP through chemiosmosis. Visualize the electron transport chain, proton pumping, and the rotation of ATP synthase as it catalyzes the phosphorylation of ADP to ATP—the universal energy currency of cells.
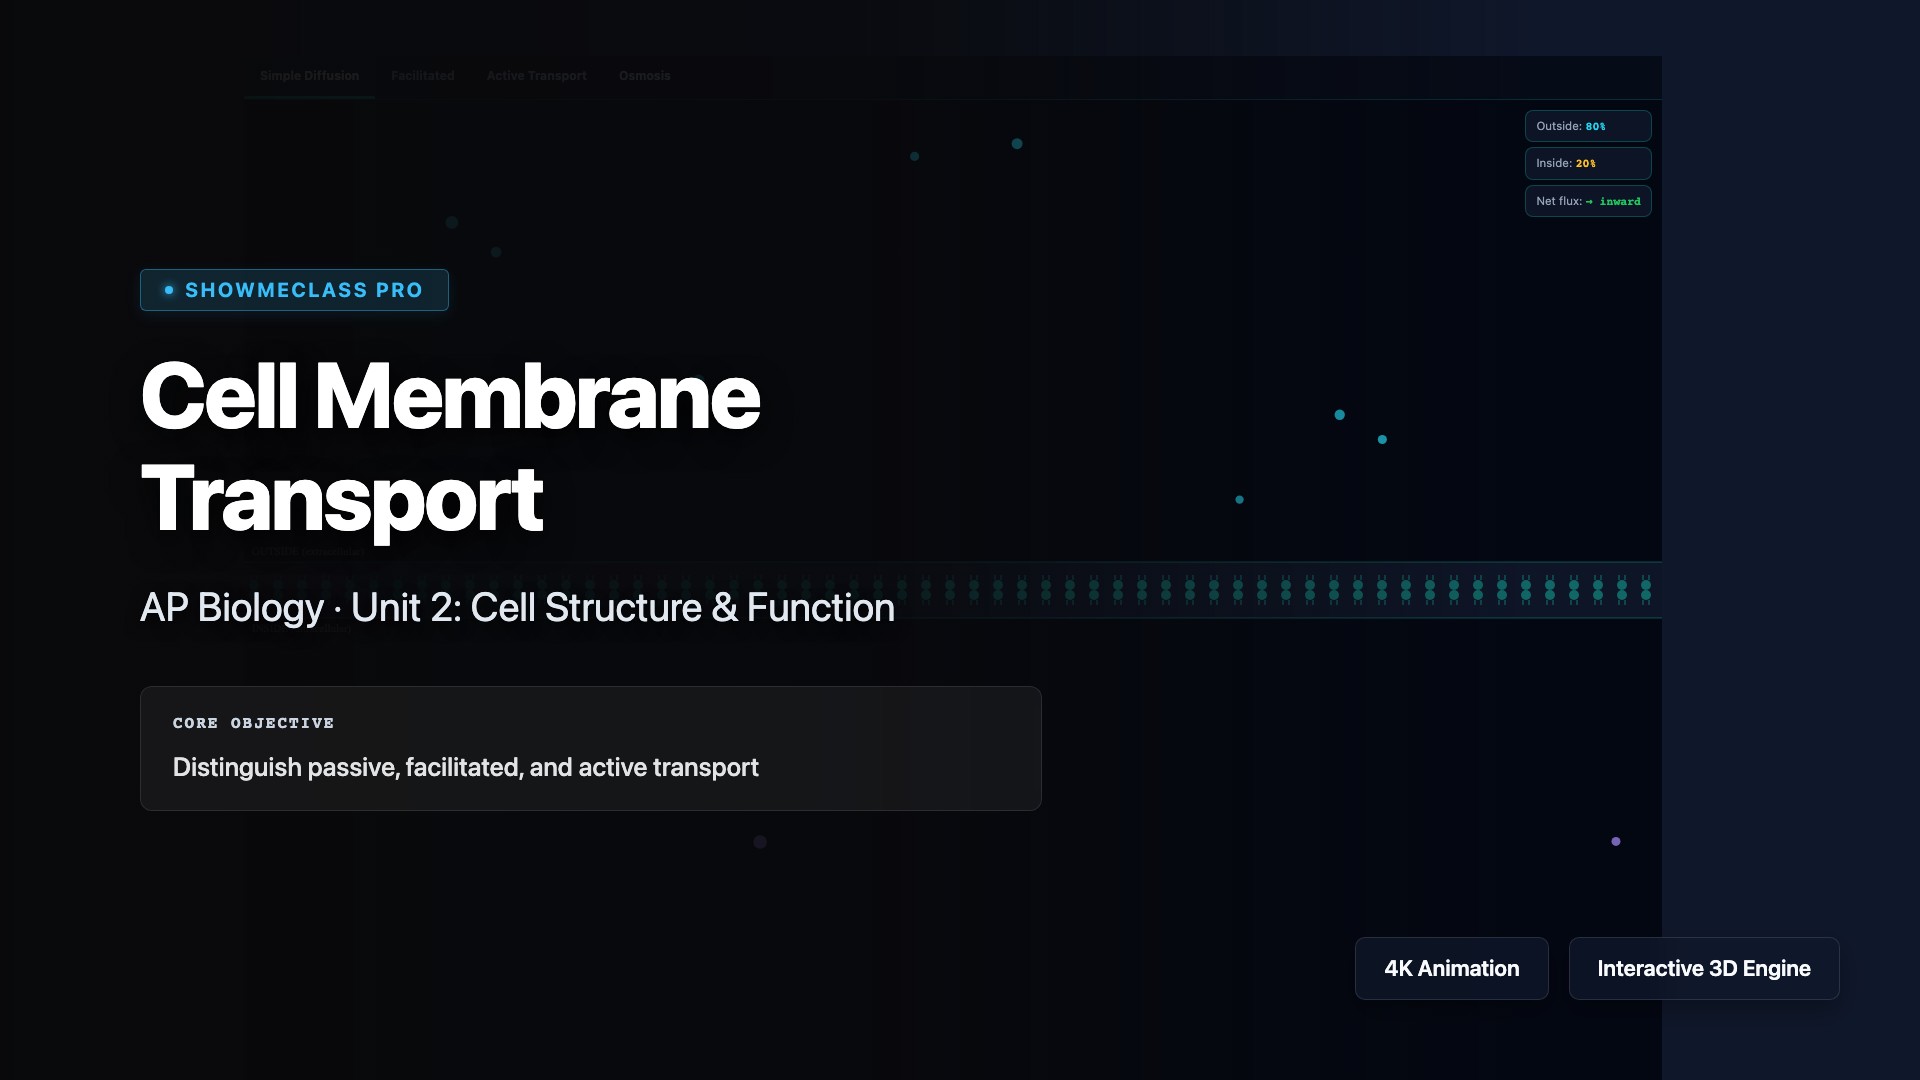
Cell Membrane Transport
Compare passive and active transport mechanisms across the selectively permeable cell membrane. Observe simple diffusion, facilitated diffusion, osmosis, and active transport (including sodium-potassium pumps and endocytosis). Adjust concentration gradients and ATP availability to see how cells maintain homeostasis.