Showing 12 results
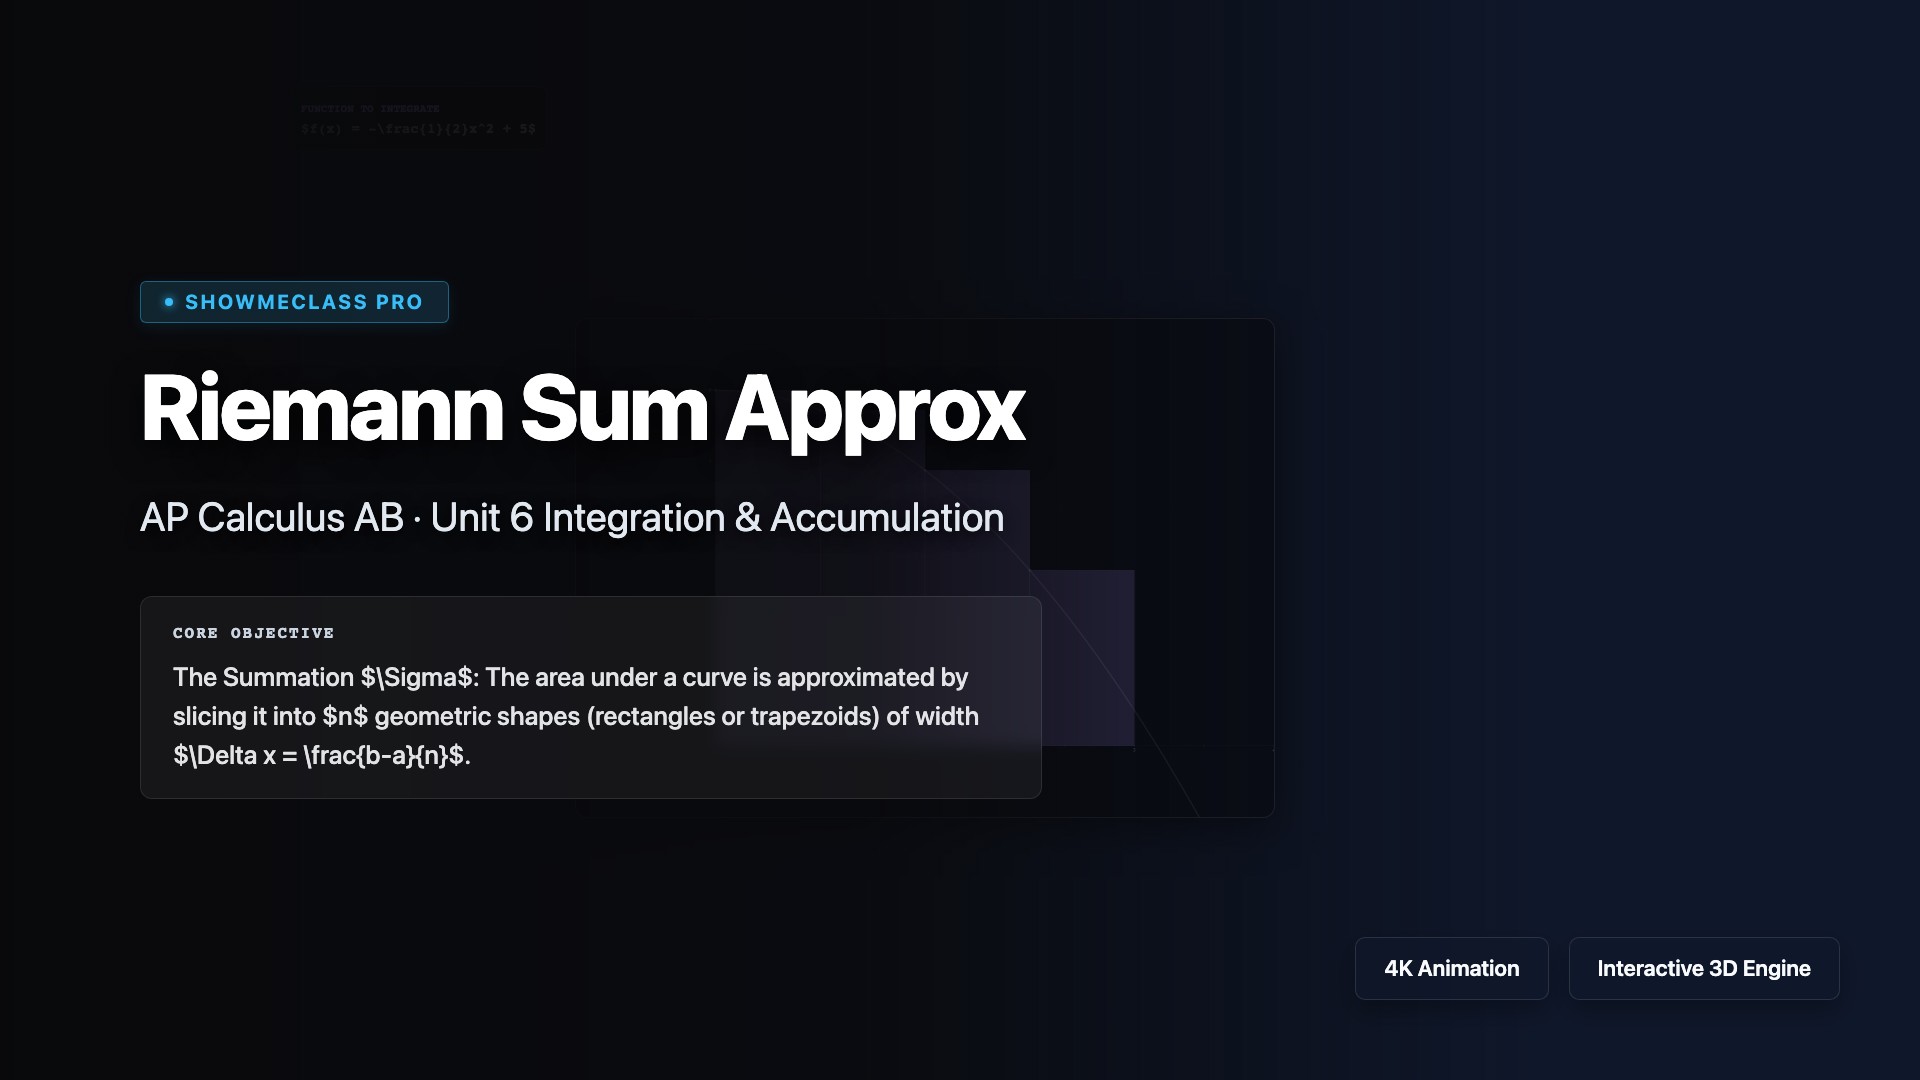
Riemann Sum Approx
Interactive summation explorer comparing Left, Right, Midpoint Riemann sums and Trapezoidal logic. N-slider rapidly expands bounding box series $\Sigma$ into exact integral space via $N \rightarrow \infty$, dynamically revealing errors algebraically and geometrically.
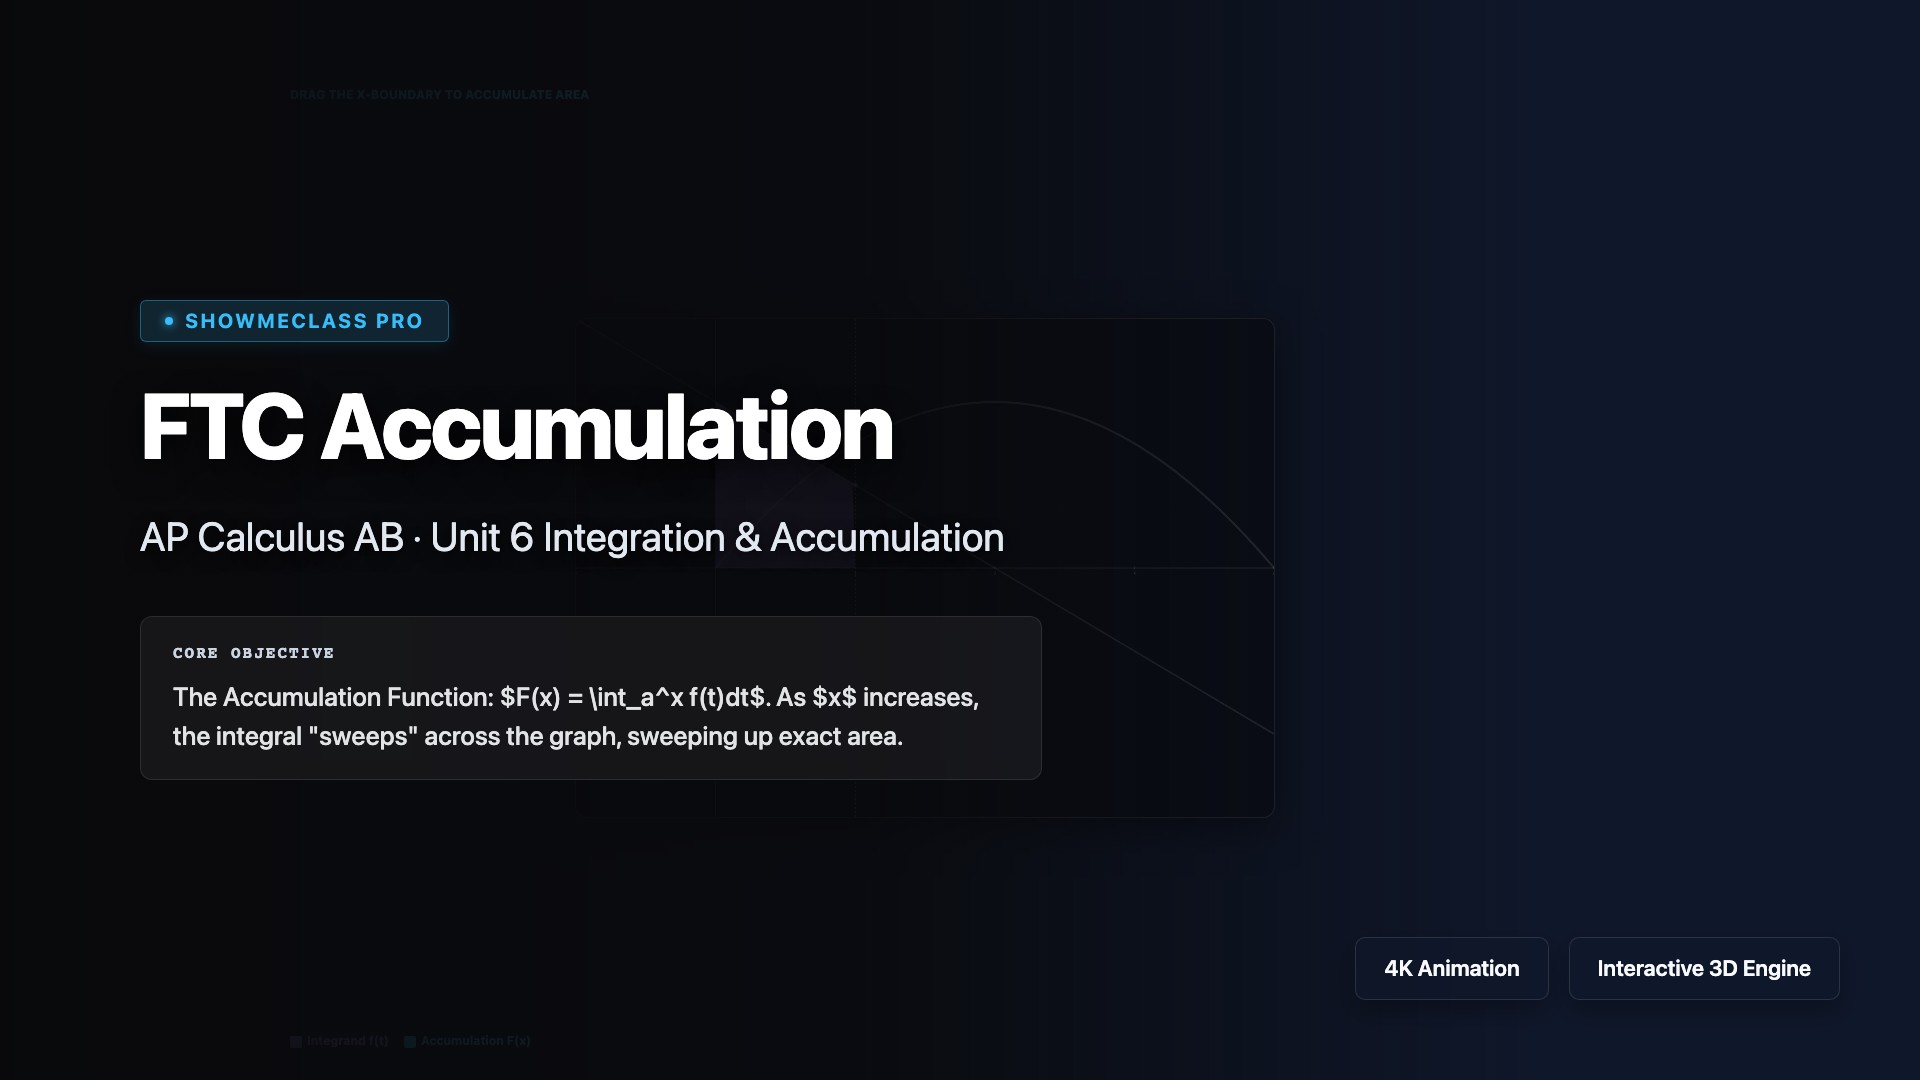
FTC Accumulation
Fundamental Theorem of Calculus visually represented. Sweeps across $f(t)$ bounds bridging dynamic differential area accumulation natively into the $F(x)$ graphing engine.
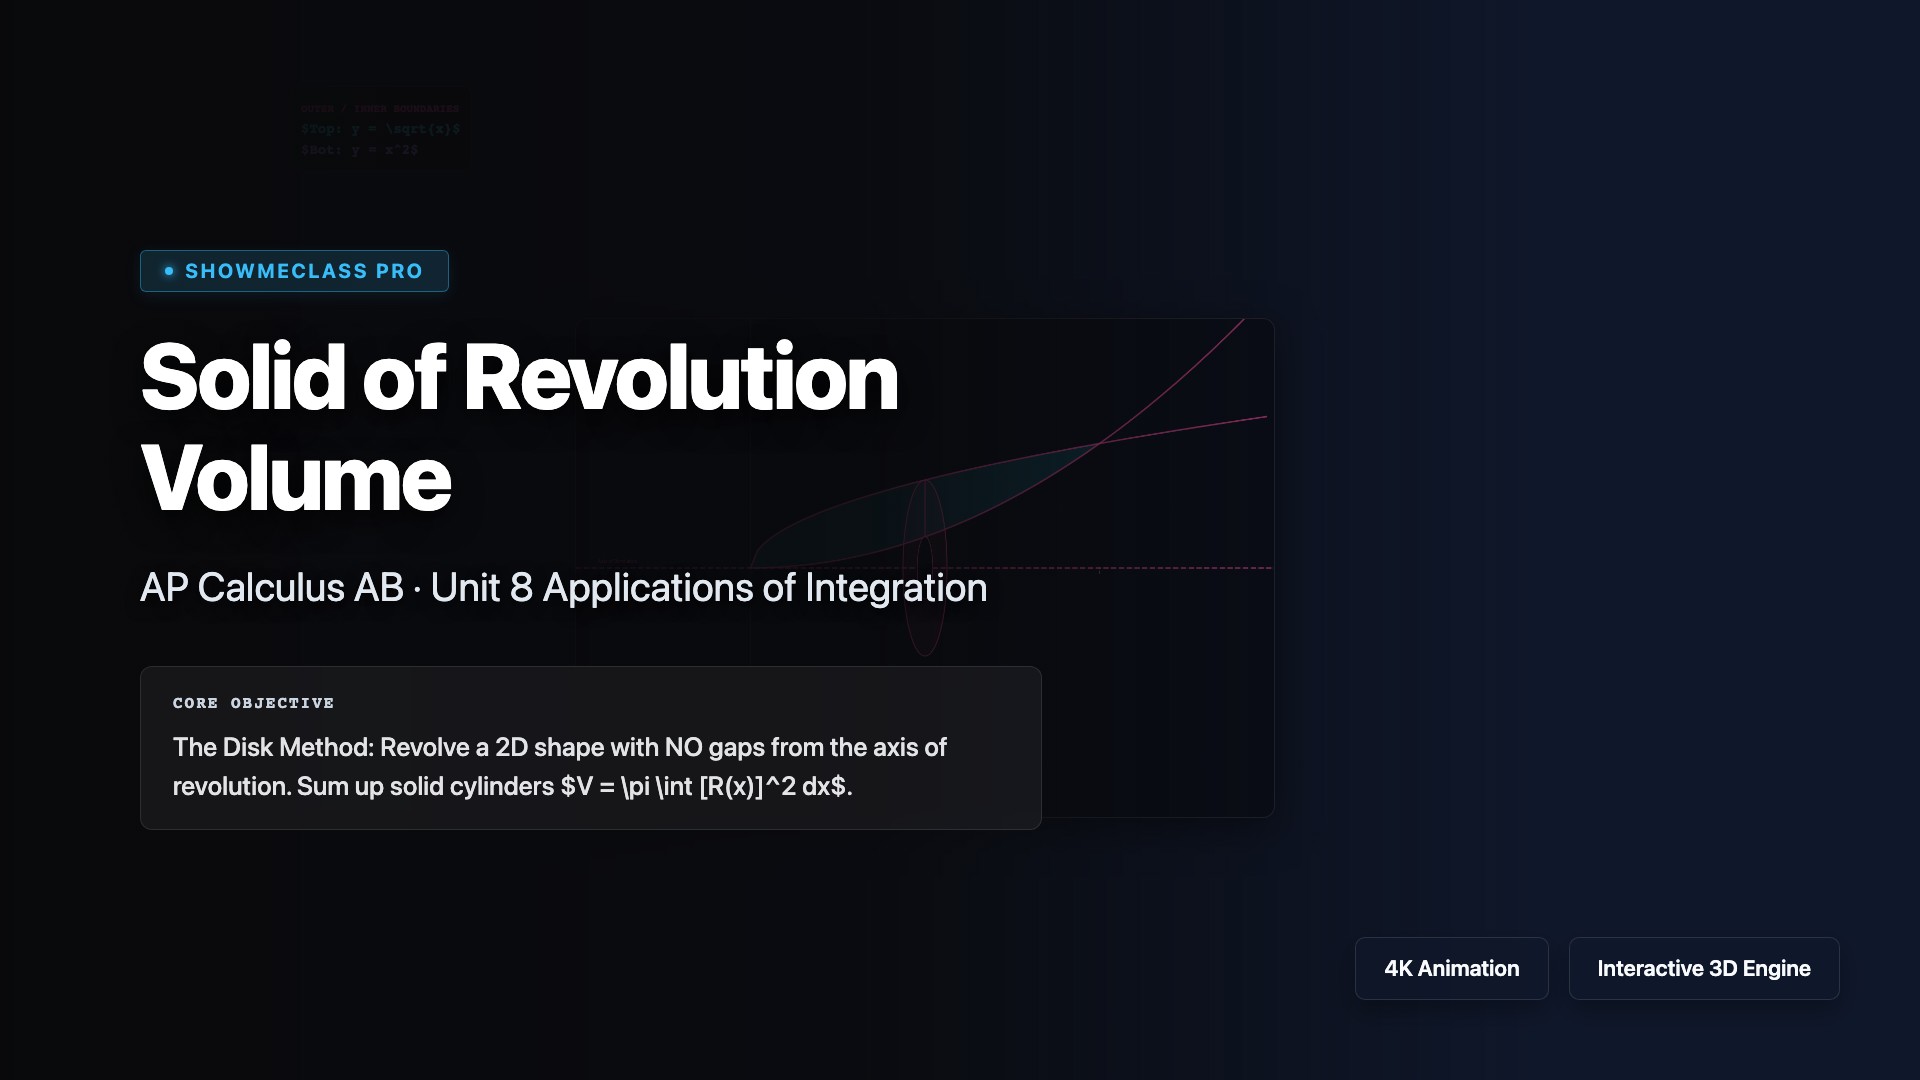
Solid of Revolution Volume
Volumetric solids of revolution visualizer computing the Washer Method natively via integral bounds. Calculates both standard axis limits and offset axis shifts dynamically.

Slope Field Explorer
Slope field generator plotting directional isoclines. Includes an interactive differential Euler-trace mechanism resolving specific math solutions when a distinct Initial Condition point is dropped onto the coordinate grid.
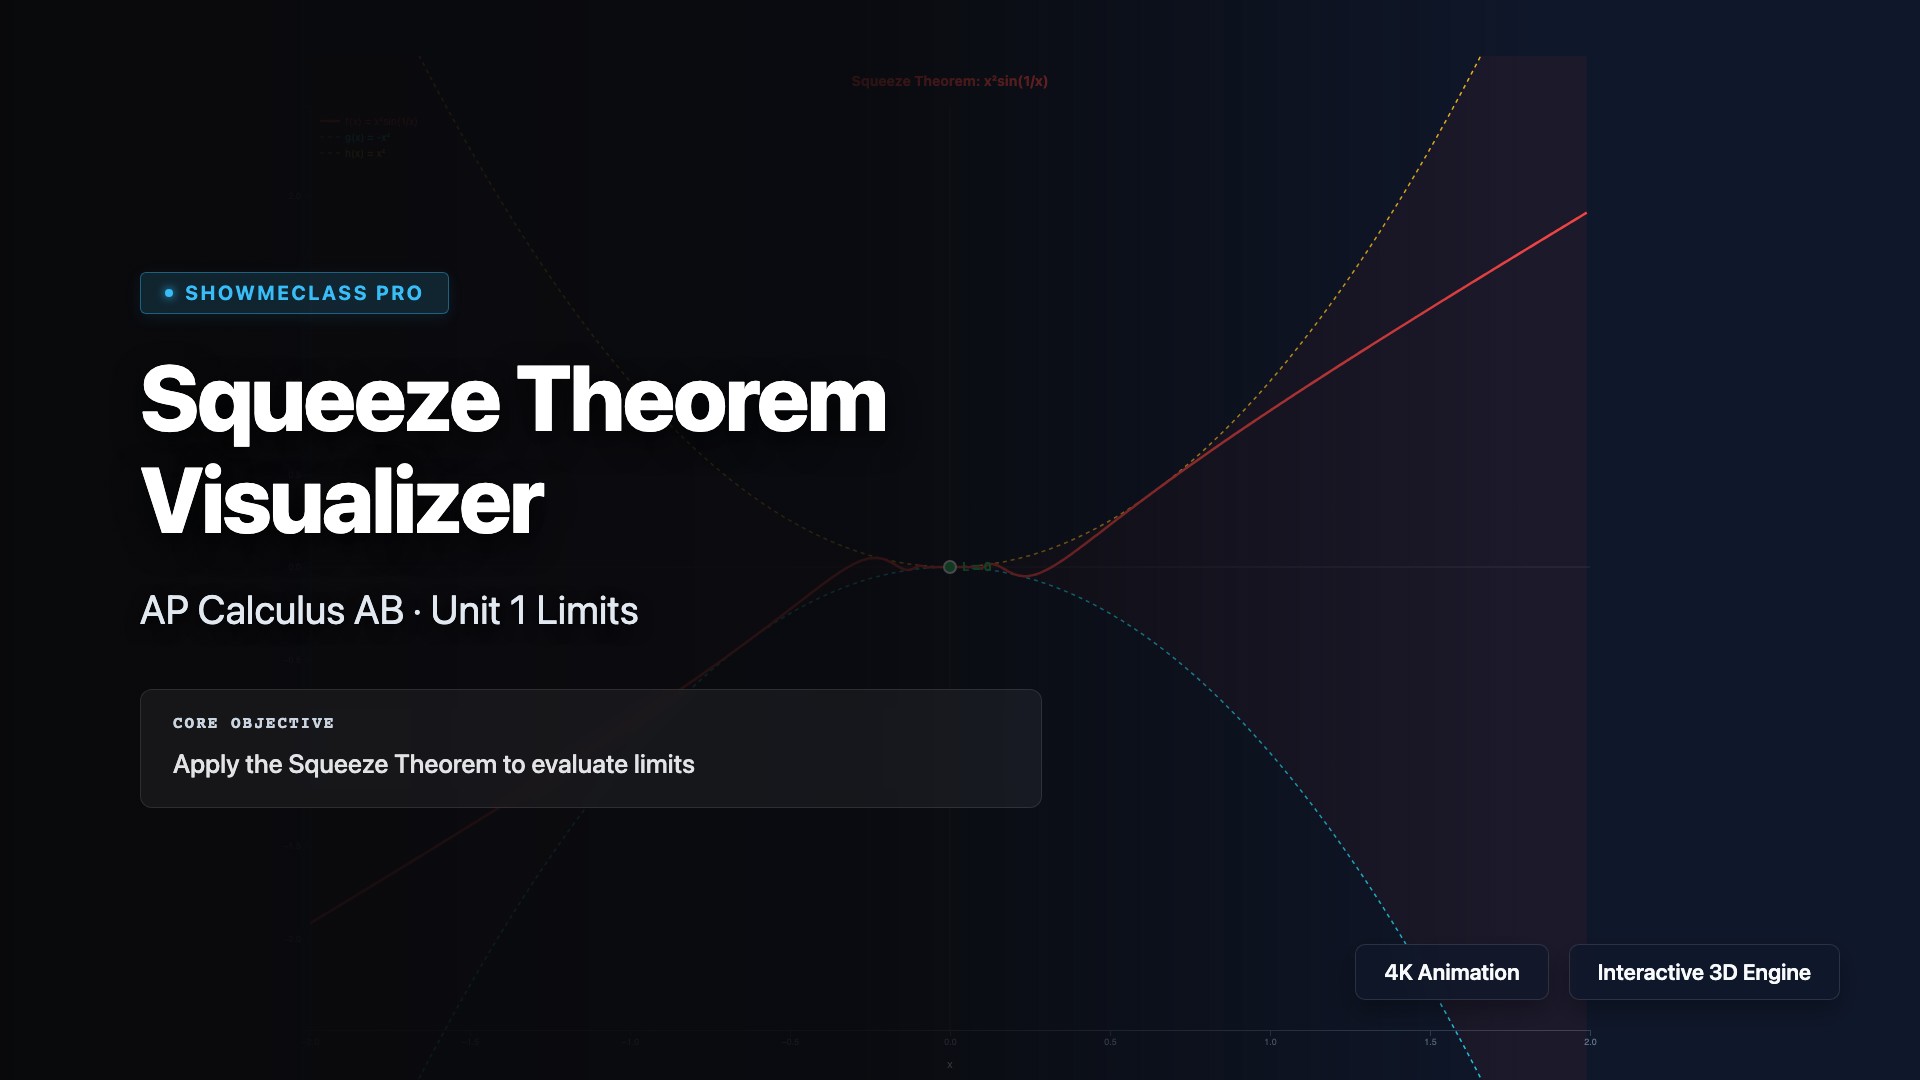
Squeeze Theorem Visualizer
Interactive visualization of the Squeeze Theorem with 4 classic examples (x²sin(1/x), sin(x)/x, x·cos(1/x), (1−cos x)/x²). Shows bounding functions g(x) ≤ f(x) ≤ h(x) with shaded squeeze region. Adjustable zoom and convergence to limit point.
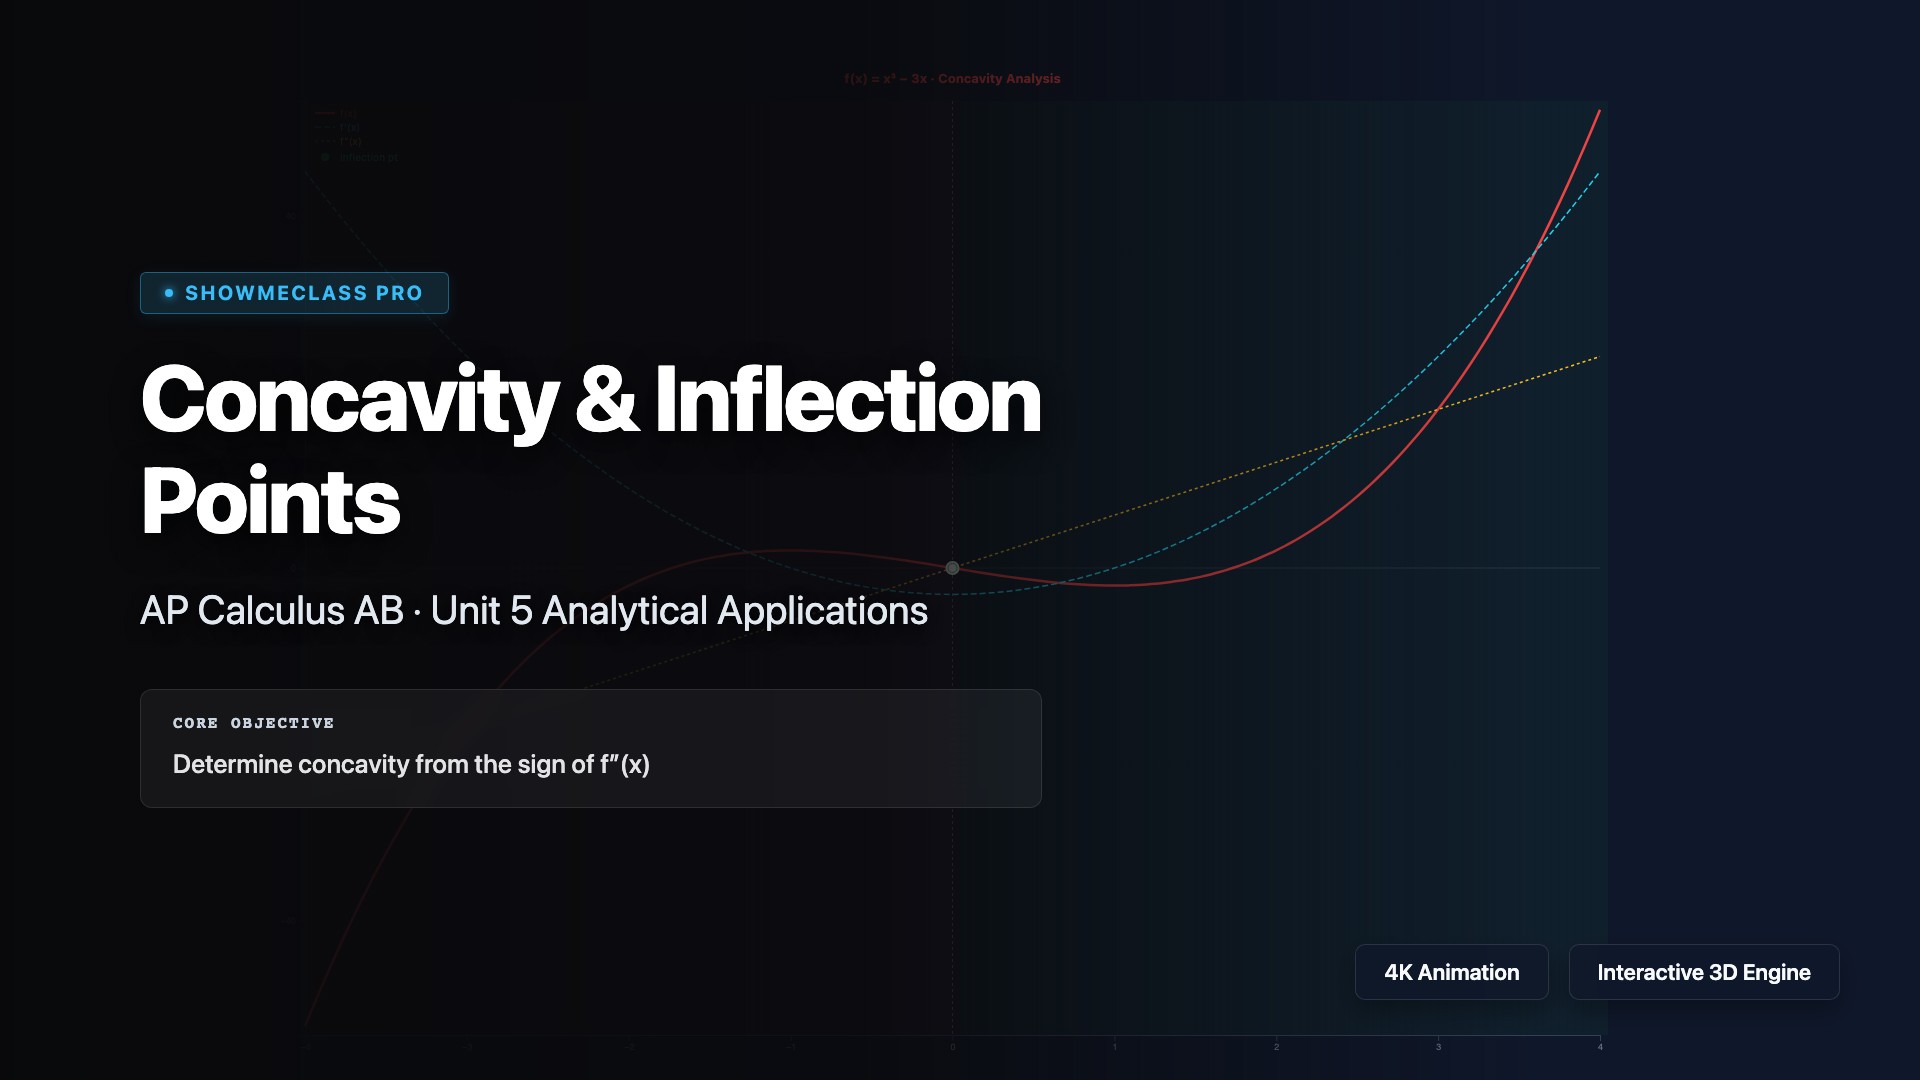
Concavity & Inflection Points
Interactive concavity analysis showing f(x), f′(x), and f″(x) simultaneously for 4 functions. Concavity shading (green=up, red=down), inflection point markers, and movable cursor with real-time derivative values and concavity classification.
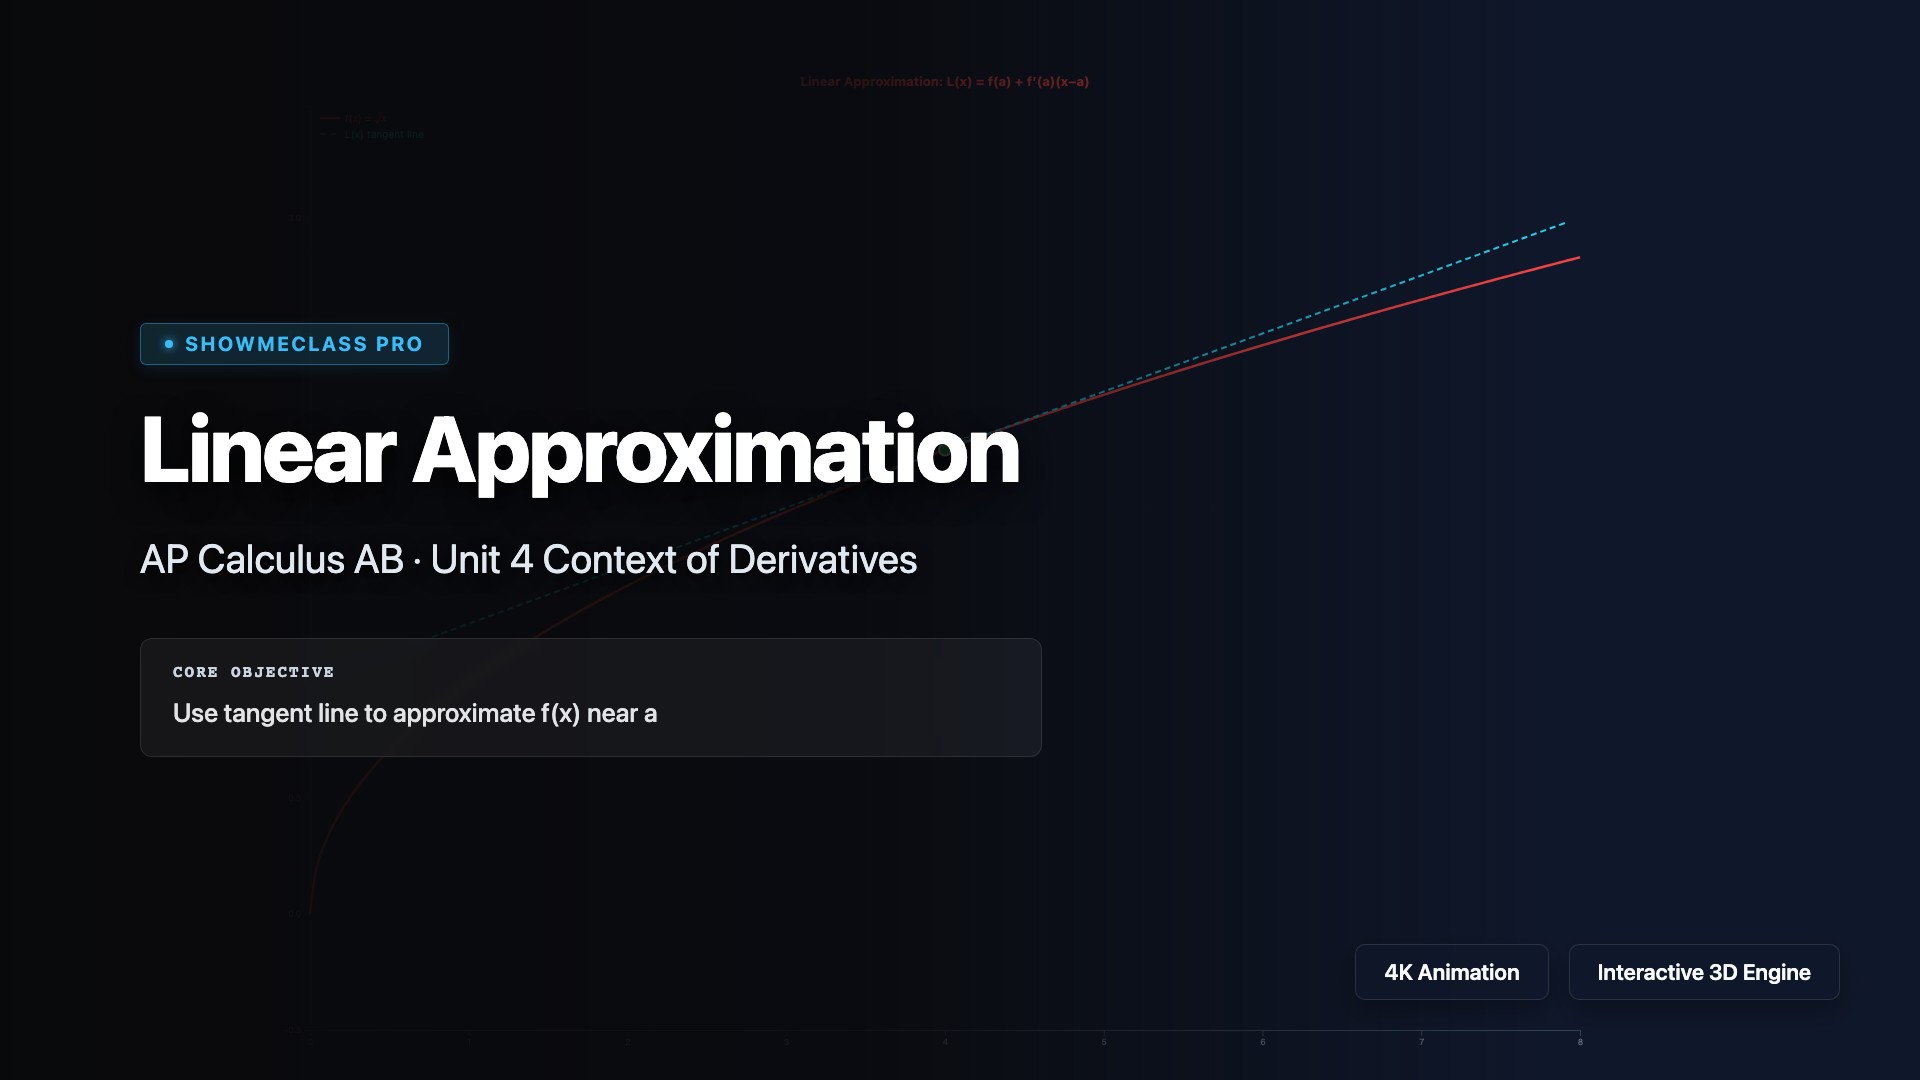
Linear Approximation & Differentials
Interactive linearization visualizer for 5 functions (√x, sin(x), eˣ, ln(x), 1/(1+x)). Shows tangent line L(x) = f(a) + f′(a)(x−a) overlaid on actual curve. Movable x-cursor with real-time exact vs approximate values, absolute and percentage error calculation.

u-Substitution Step-by-Step
Step-by-step walkthrough of u-substitution for 6 integral examples. Color-coded steps: identify u, find du, match dx, substitute, integrate, back-substitute. Covers standard patterns including definite integrals with bound conversion.
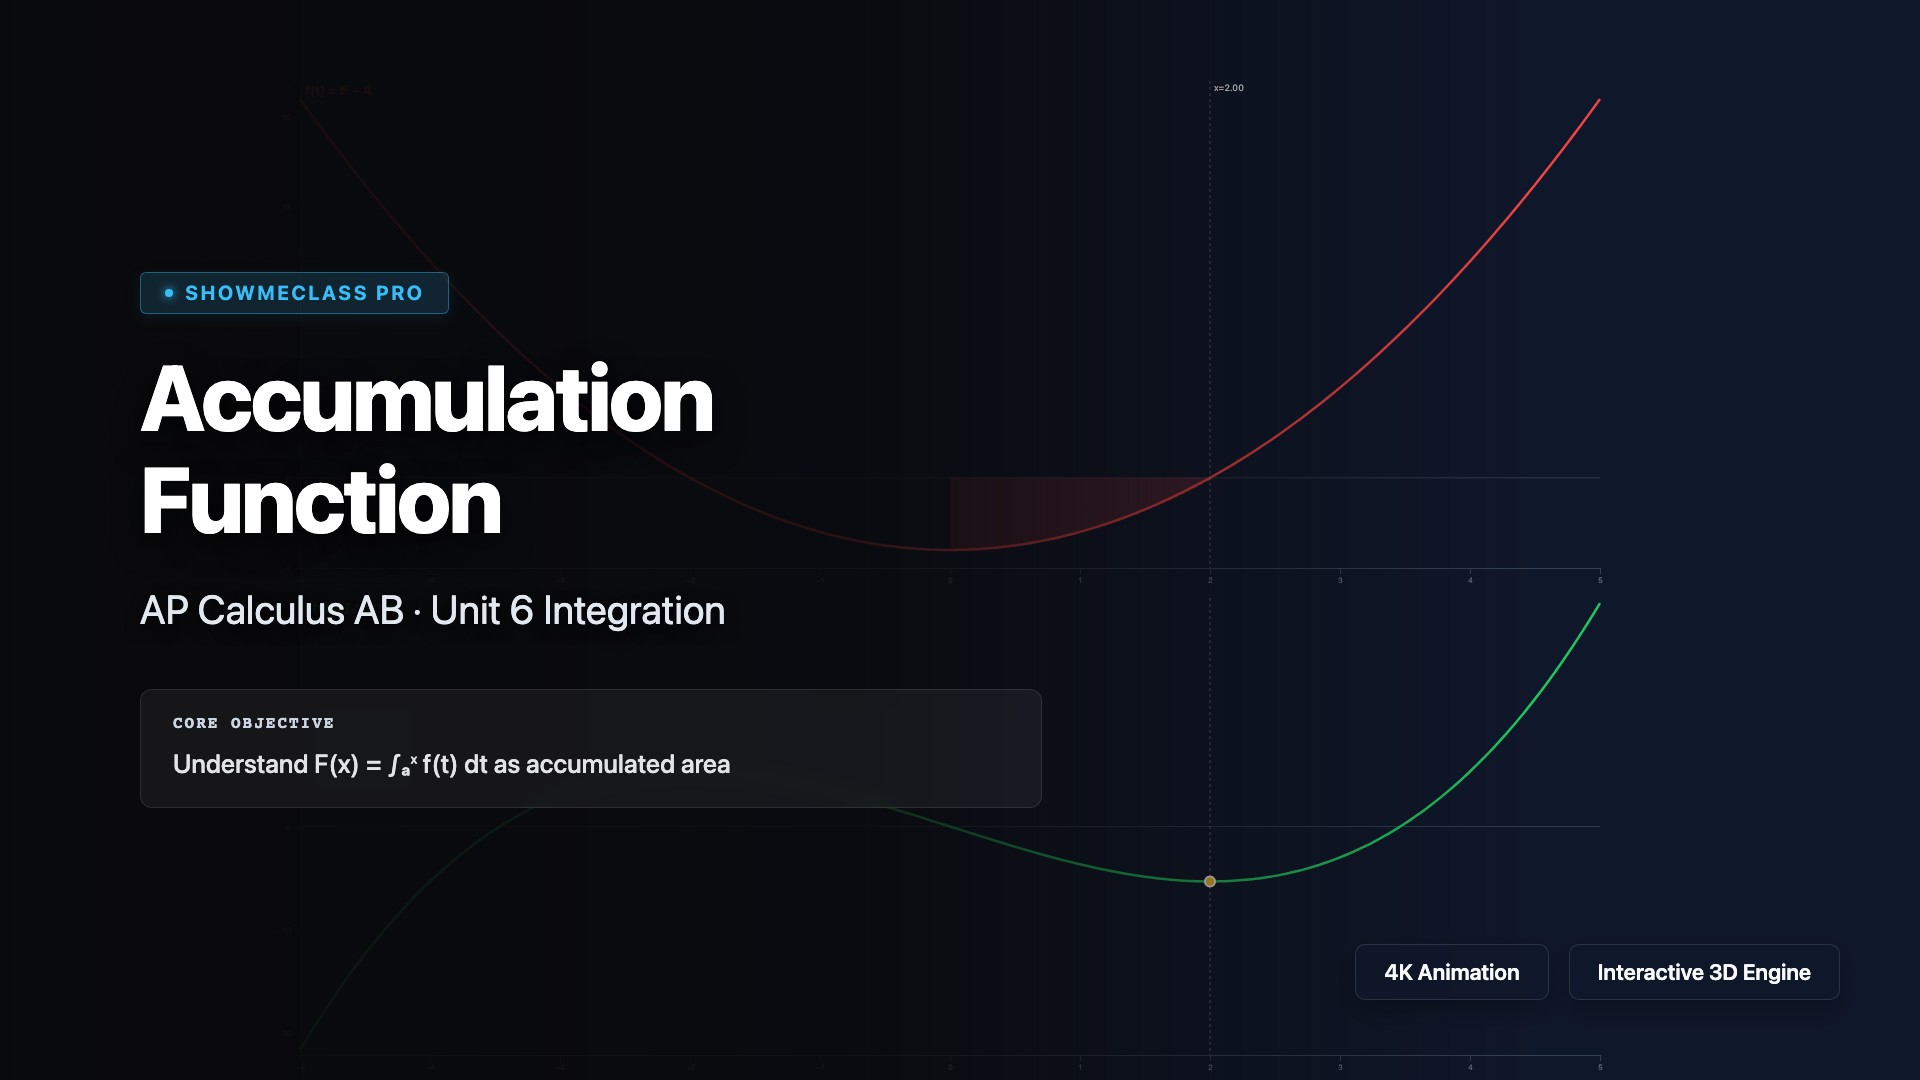
Accumulation Function Visualizer
Dual-panel visualization of f(t) and F(x) = ∫ₐˣ f(t) dt. Shows signed area shading (green positive, red negative) on the integrand graph alongside the accumulation function. Demonstrates FTC Part 1: F′(x) = f(x). Adjustable upper limit x with 4 function examples.

Separable Differential Equations
Slope field visualization with Euler method solution curves for 4 classic separable ODEs (dy/dx=xy, −y/x, y(1−y) logistic, x/y). Adjustable initial condition y₀ with multiple solution curves. Step-by-step separation and integration displayed.
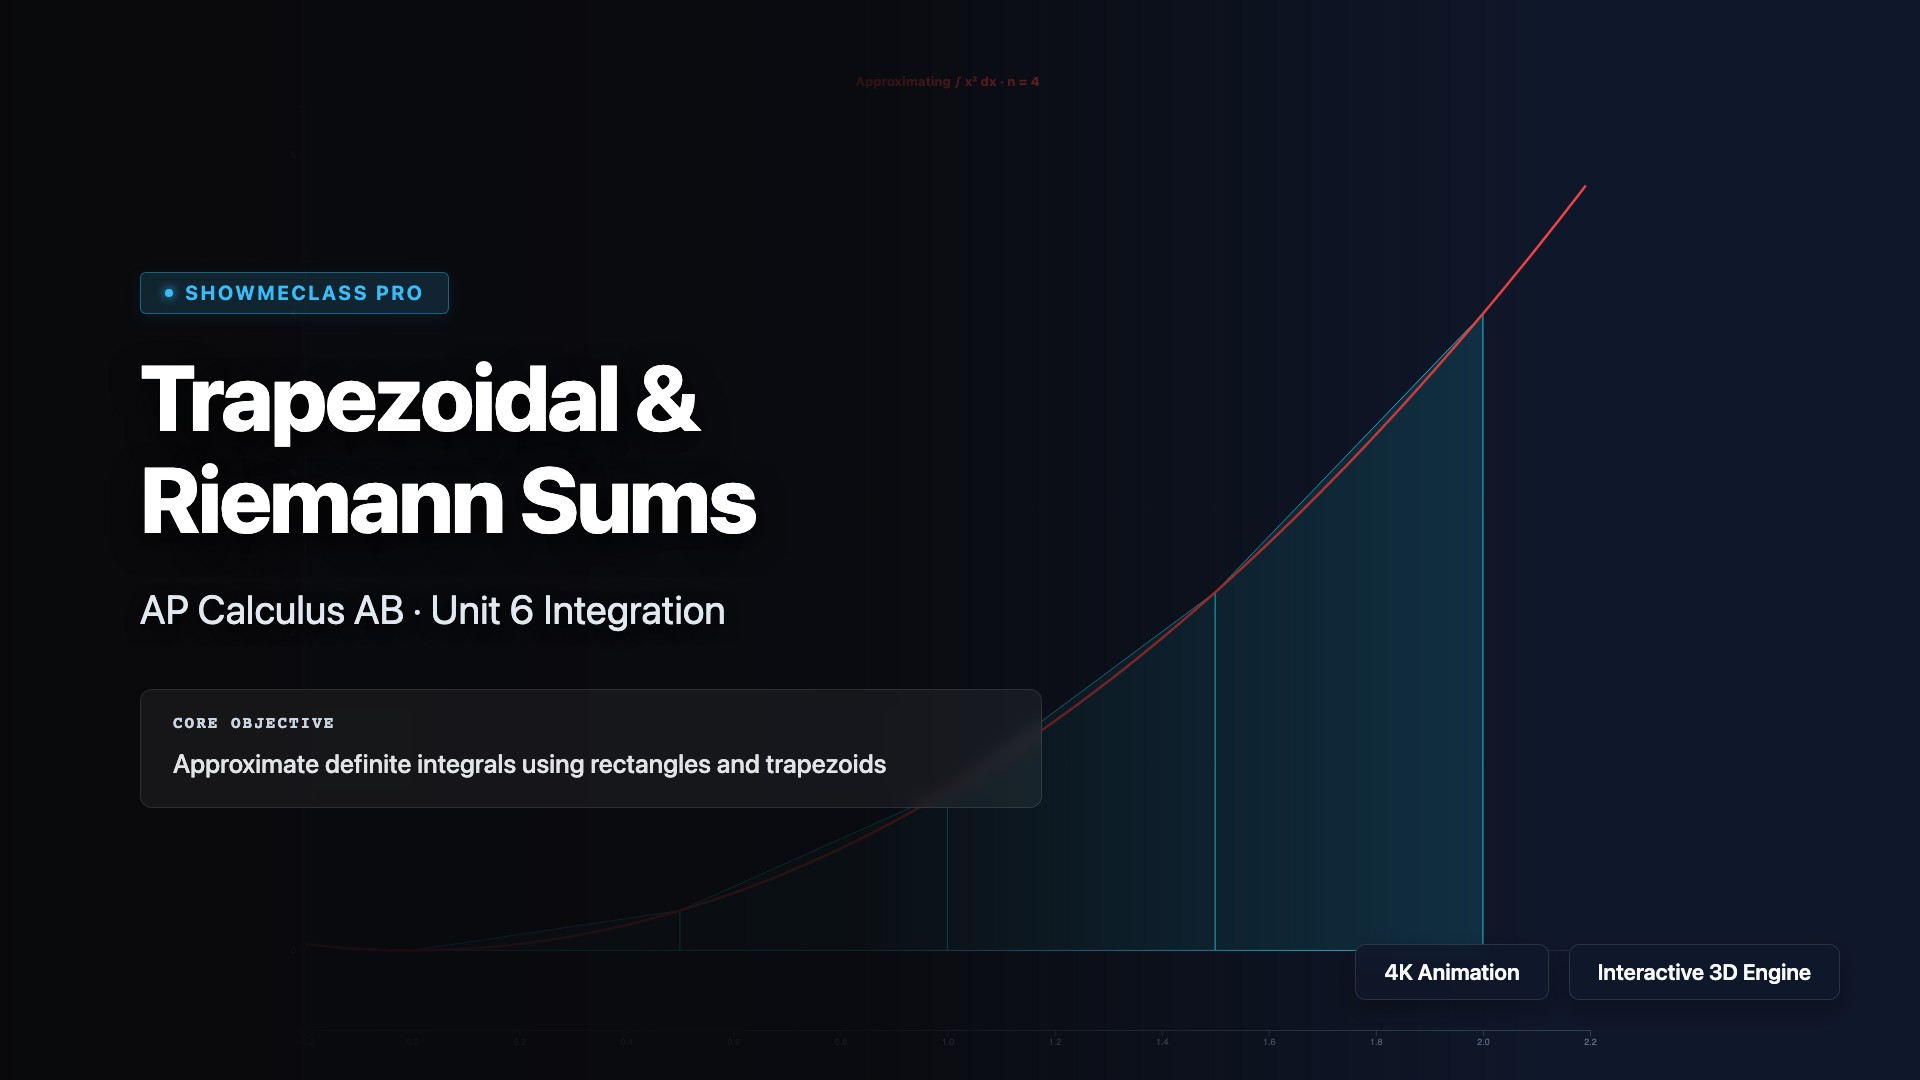
Trapezoidal & Riemann Sum Approximation
Interactive numerical integration comparing Left, Right, Midpoint, and Trapezoidal rules. 4 functions with adjustable number of subintervals (n=1 to 50). Shows exact value, approximation, absolute and percentage error. Visualizes rectangles/trapezoids overlaid on curve.
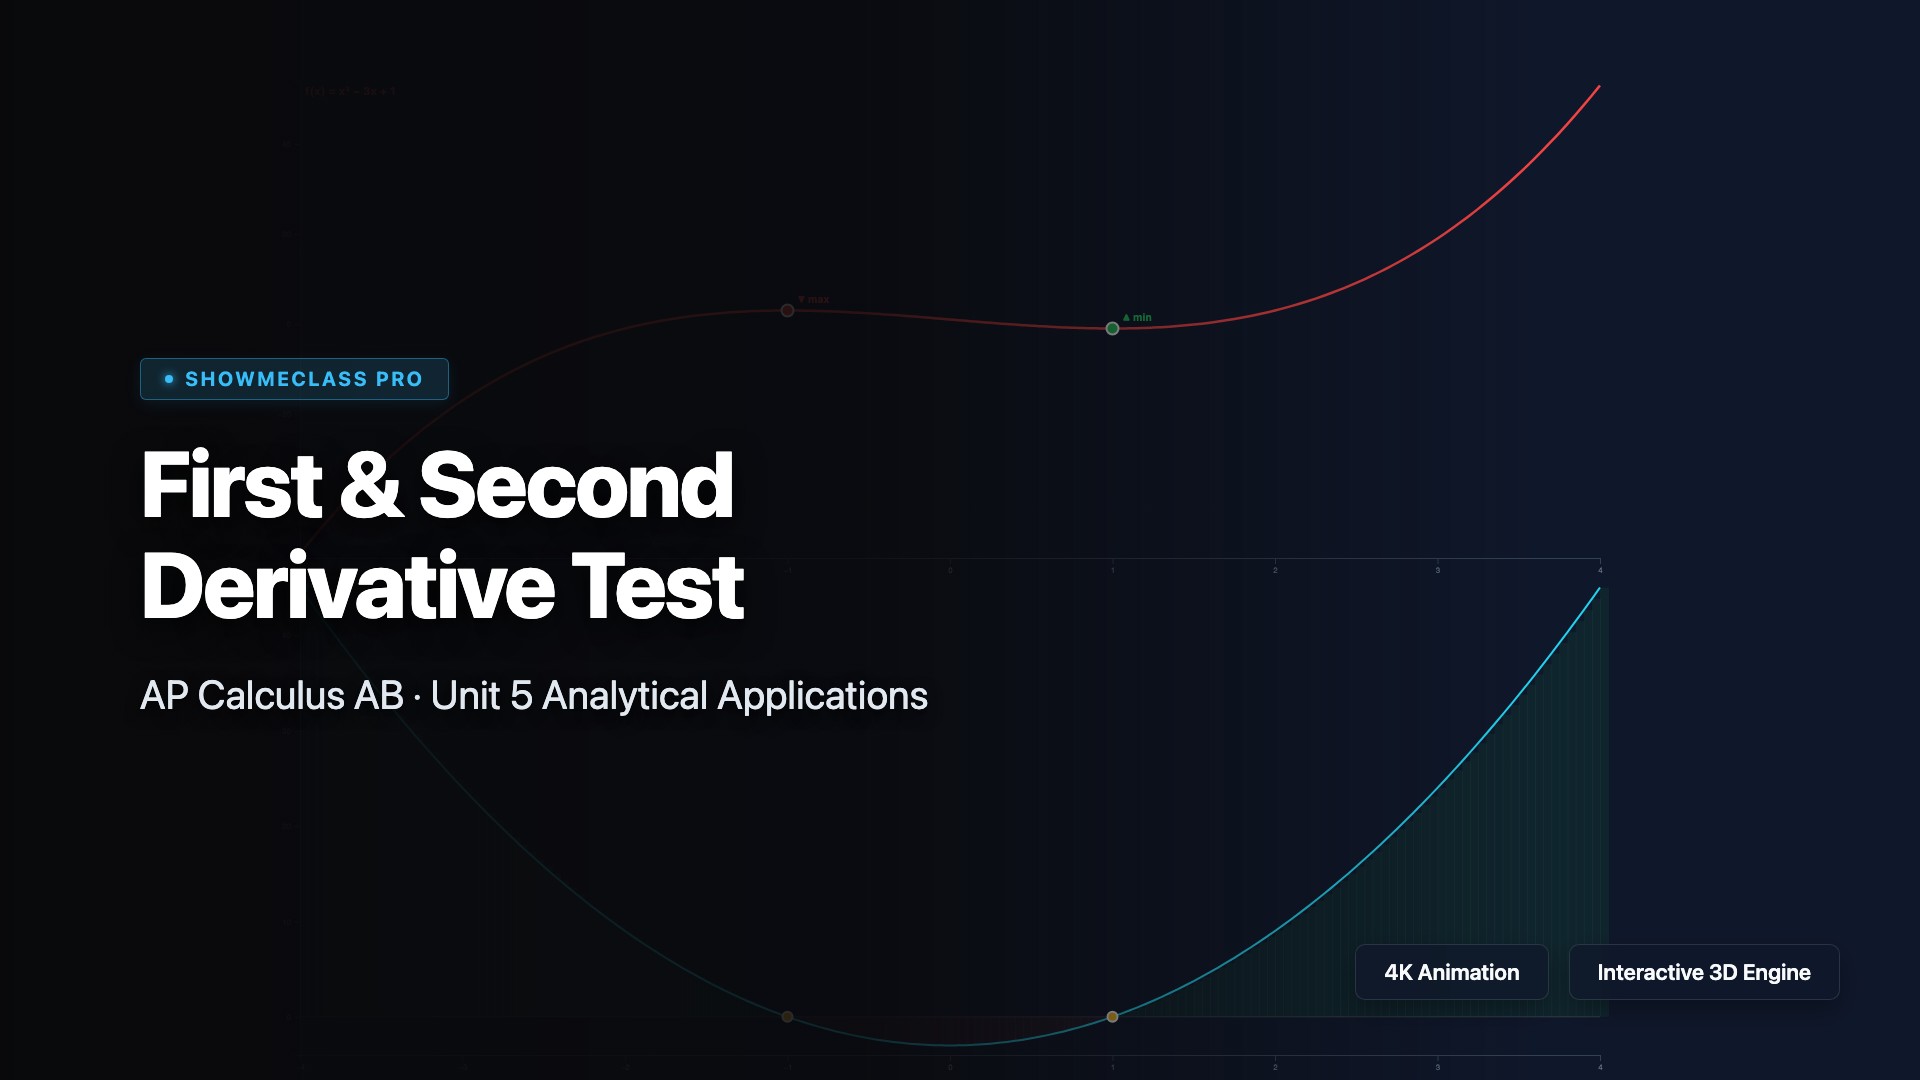
First & Second Derivative Test
Dual-panel display of f(x) and f′(x) for 4 polynomial/exponential functions. Critical points marked with max/min labels, f′ sign shading (green=increasing, red=decreasing). Second derivative test verification at each critical point. Interactive function selection.