Showing 8 results
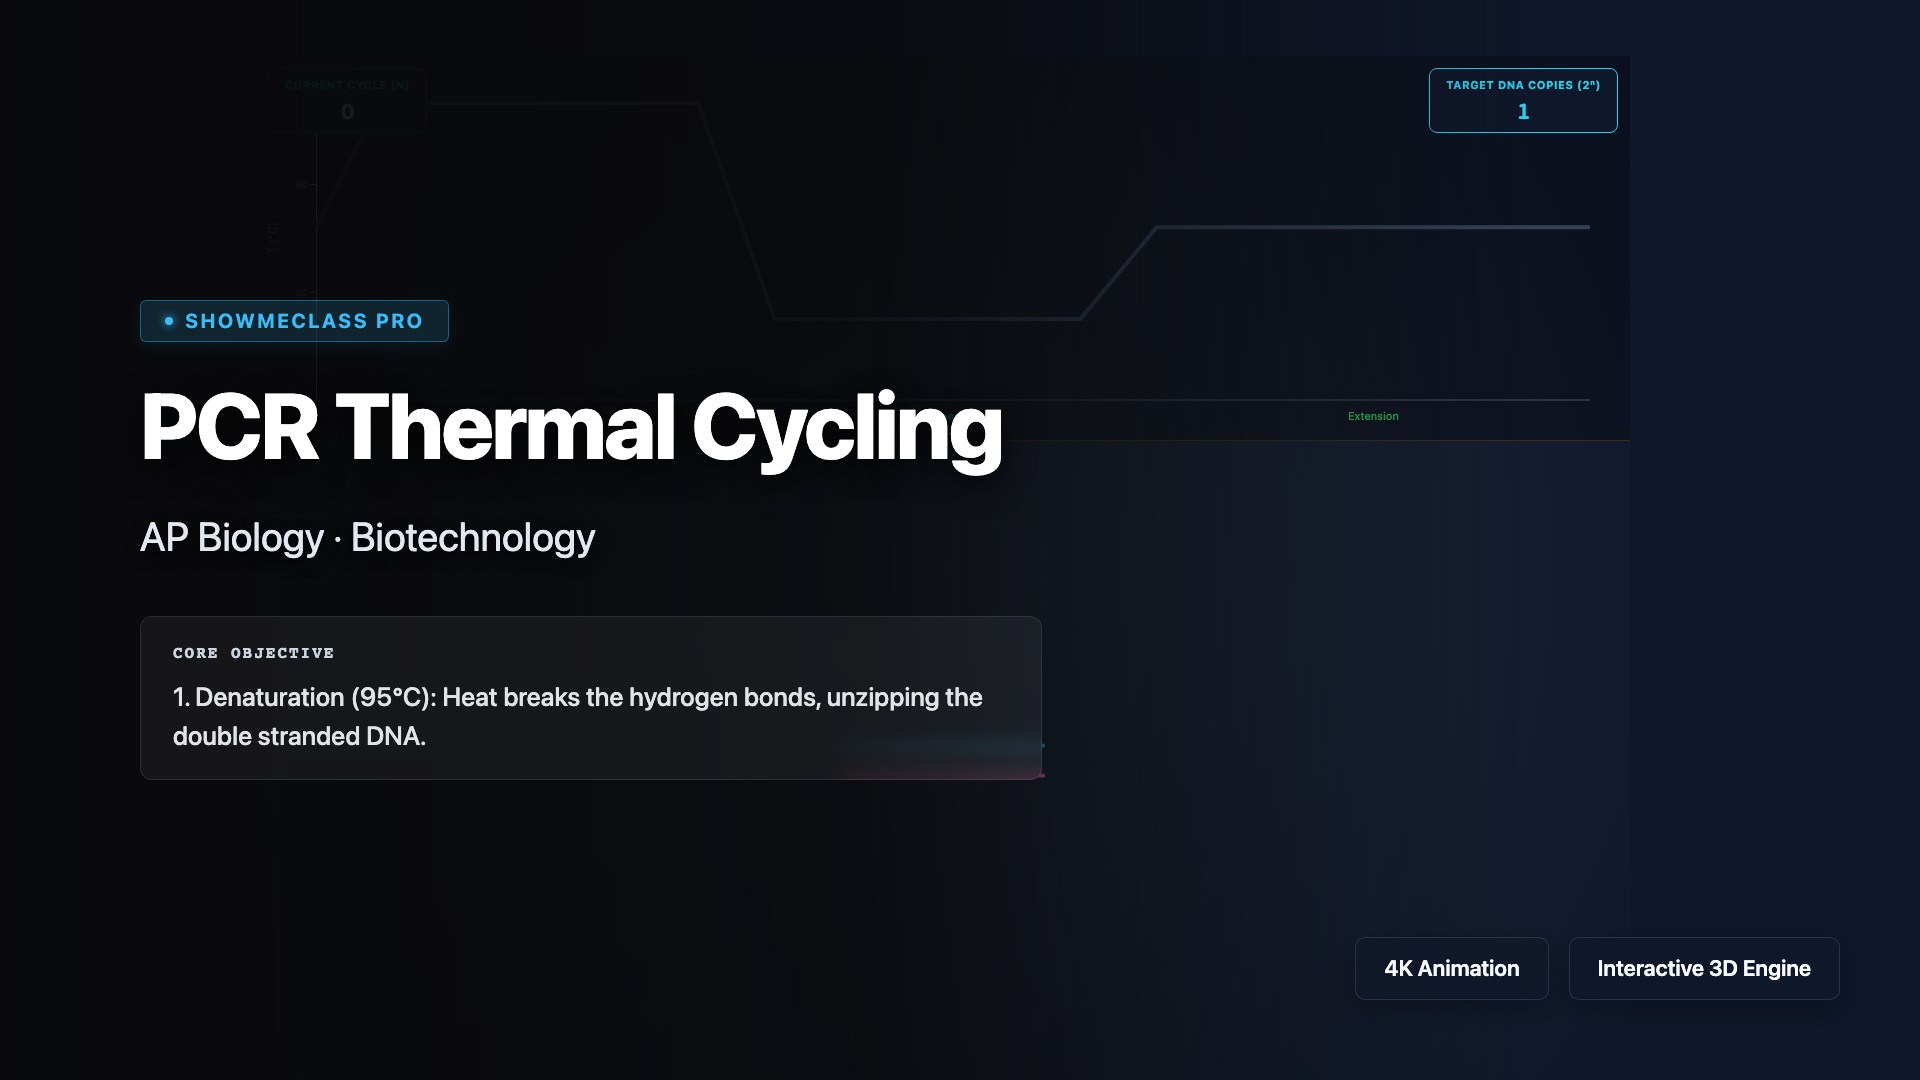
PCR Thermal Cycling
Simulate the polymerase chain reaction (PCR) technique that exponentially amplifies specific DNA sequences through repeated thermal cycling. Visualize the three temperature-dependent steps: denaturation (95°C separates DNA strands), annealing (55°C allows primers to bind), and extension (72°C enables Taq polymerase to synthesize new strands). Understand how PCR enables DNA cloning, forensics, medical diagnostics, and genetic research.

Pedigree Analysis Builder
Build and analyze pedigrees to trace inheritance patterns of genetic traits through family trees. Learn to identify autosomal dominant, autosomal recessive, X-linked recessive, and X-linked dominant inheritance patterns by examining affected individuals across generations. Practice determining genotypes, calculating probabilities, and distinguishing between different modes of inheritance using standard pedigree symbols.
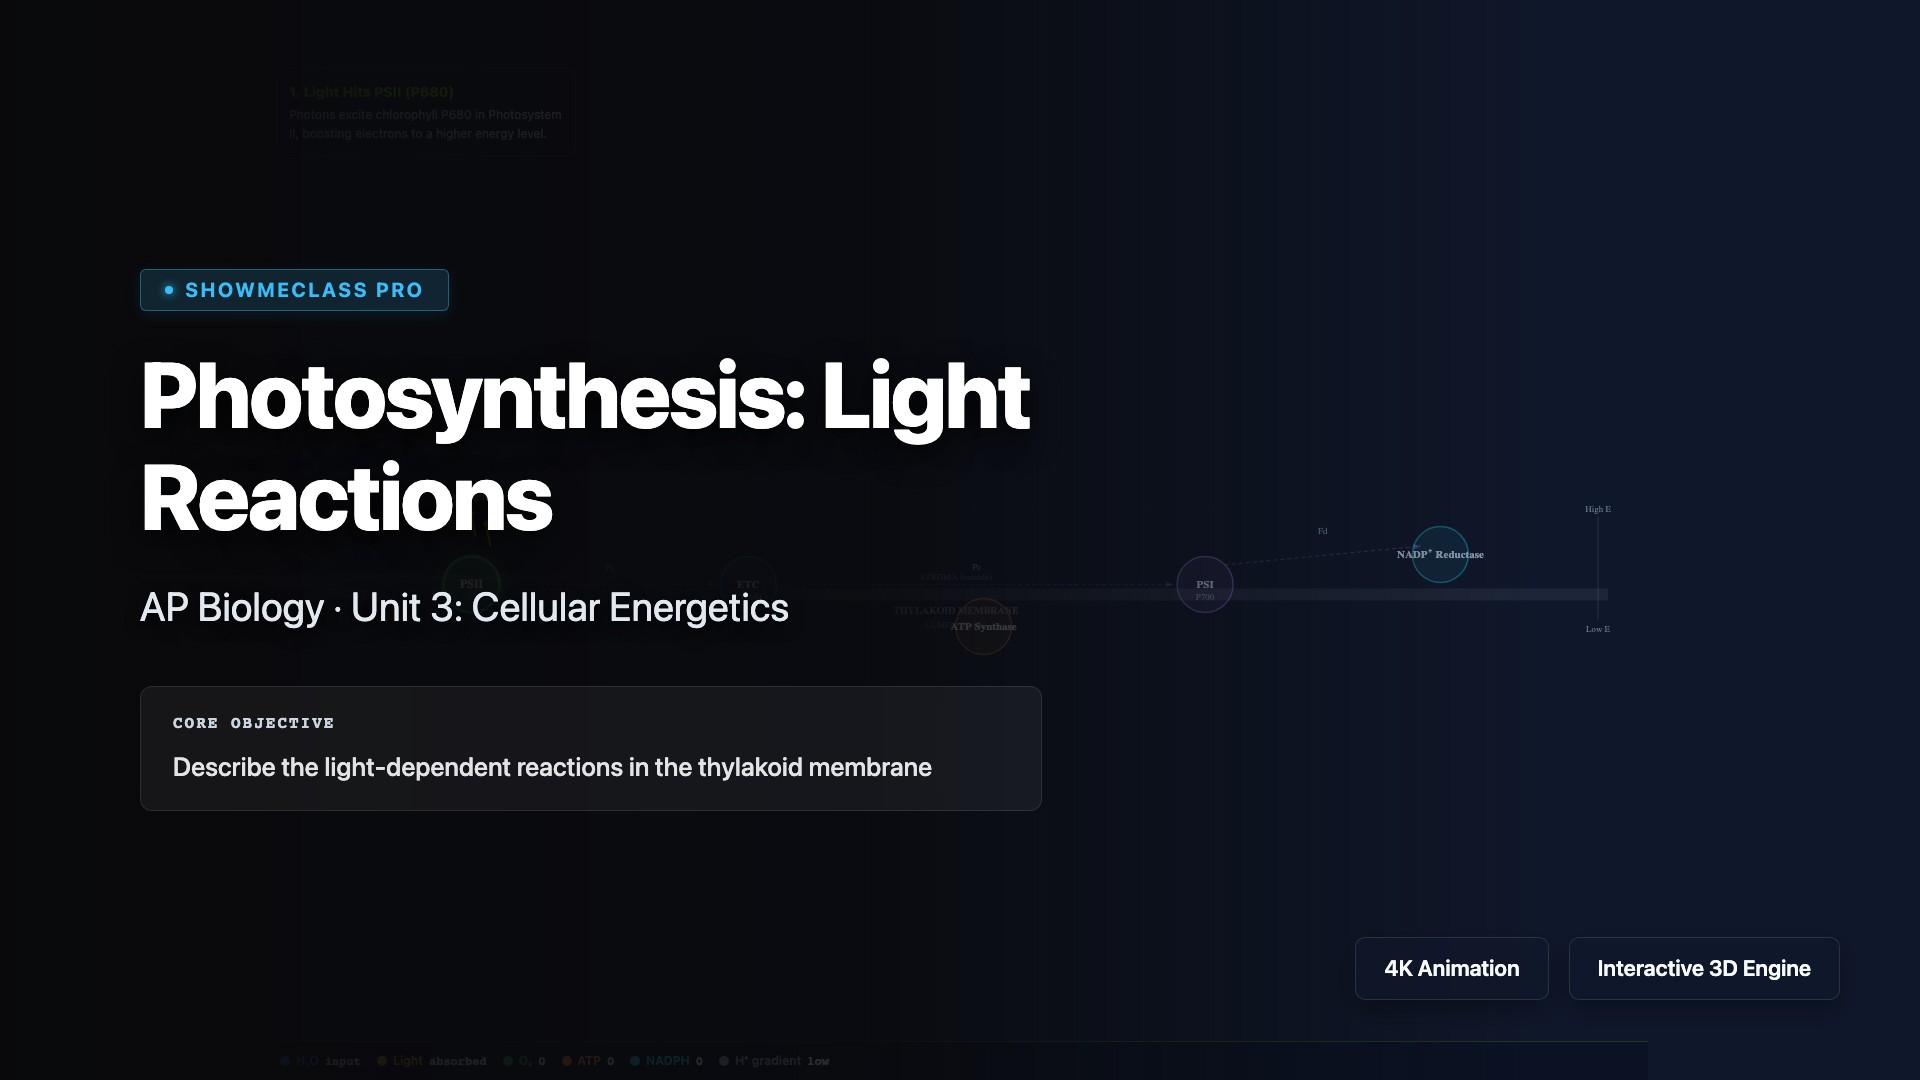
Photosynthesis: Light Reactions
Explore the light-dependent reactions of photosynthesis occurring in the thylakoid membranes of chloroplasts. Visualize how photosystems II and I capture light energy to drive electron transport, generate ATP via chemiosmosis, and produce NADPH. Understand photolysis of water, the Z-scheme electron flow, and how these products power the Calvin cycle to fix carbon dioxide into glucose.
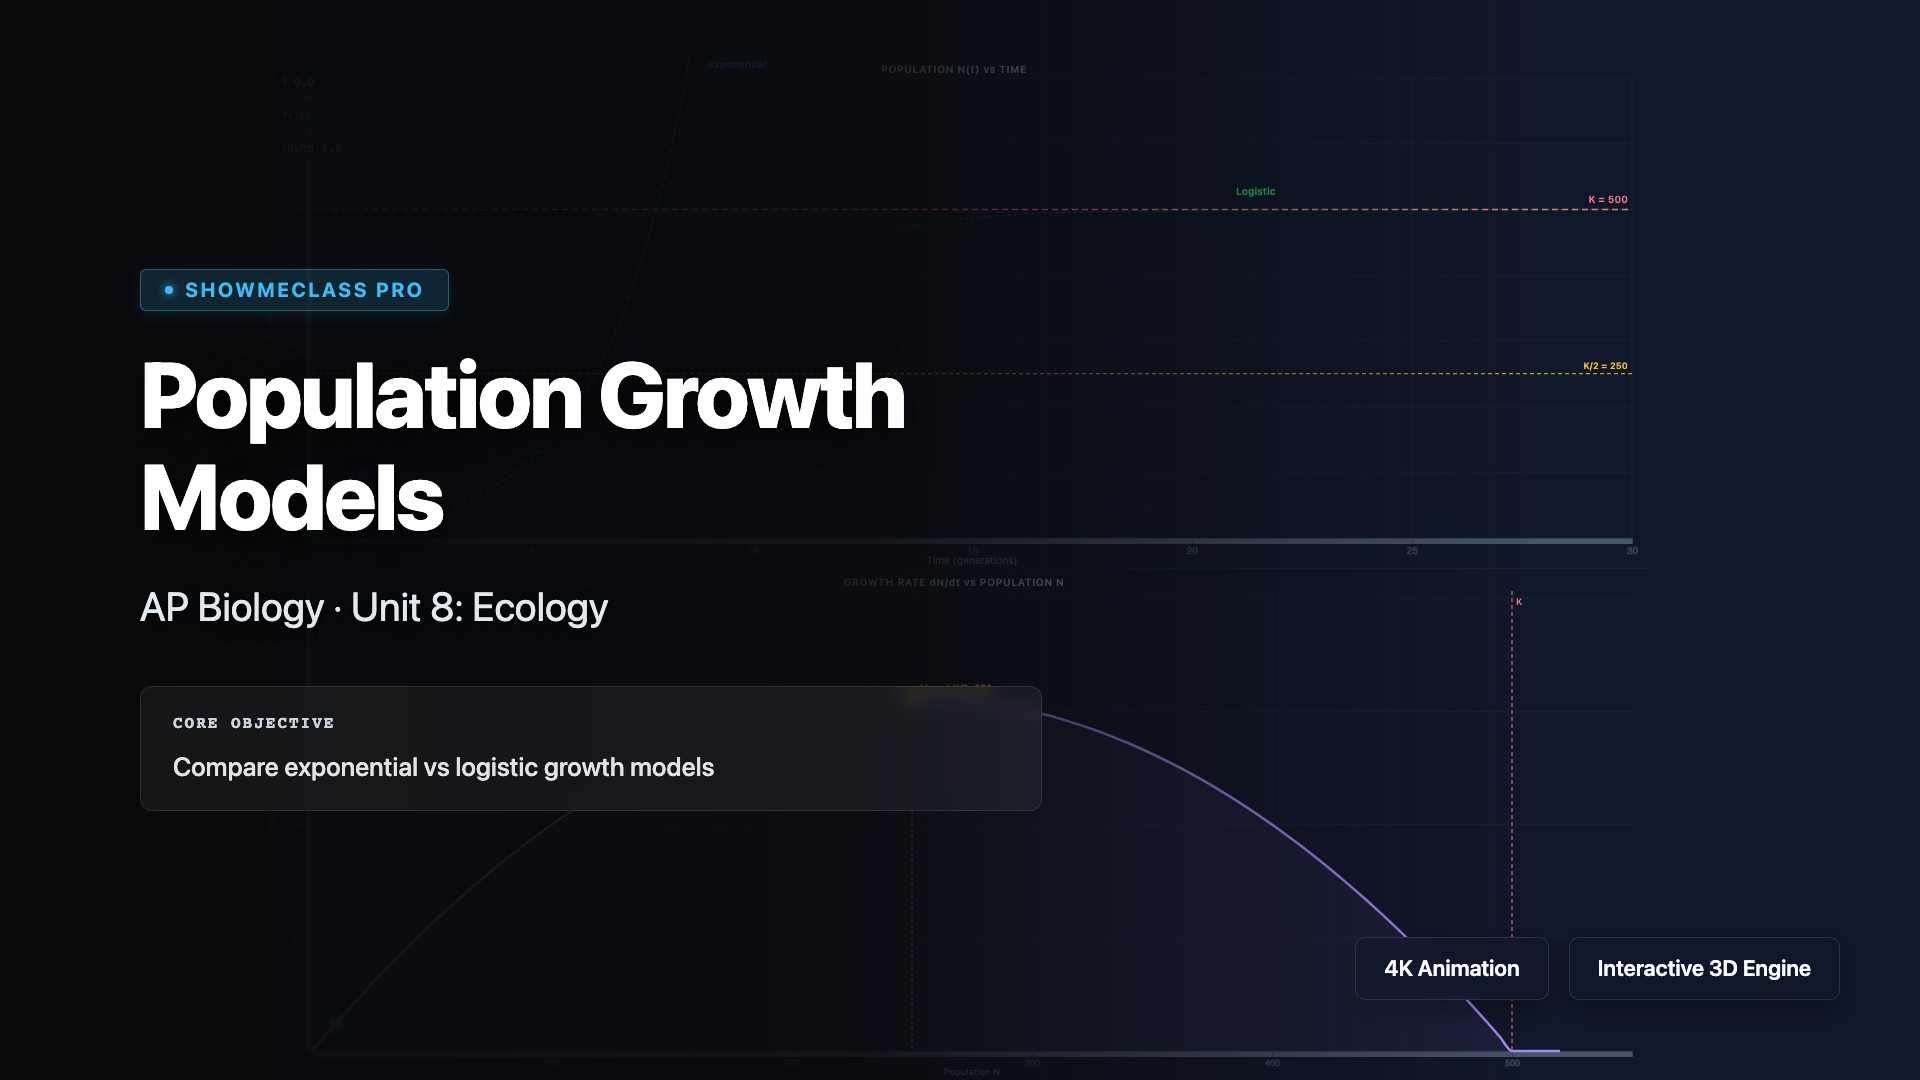
Population Growth Models
Compare exponential and logistic population growth models to understand how populations change over time. Visualize the J-shaped curve of exponential growth (unlimited resources) versus the S-shaped curve of logistic growth (limited by carrying capacity). Explore how density-dependent and density-independent factors regulate population size, and calculate growth rates using the equations dN/dt = rN and dN/dt = rN(K-N)/K.

CRISPR-Cas9 Mechanism 3D Visualizer
Visualizes the complete CRISPR-Cas9 genome editing process, tracking PAM recognition, DNA unwinding, gRNA matching, and the double-strand break in 3D.

Lotka-Volterra Predator-Prey Dynamics
Mathematical ecology simulator charting the cyclic phase space between predators and prey. Manipulate birth/death rates to find stable orbits or extinction events.
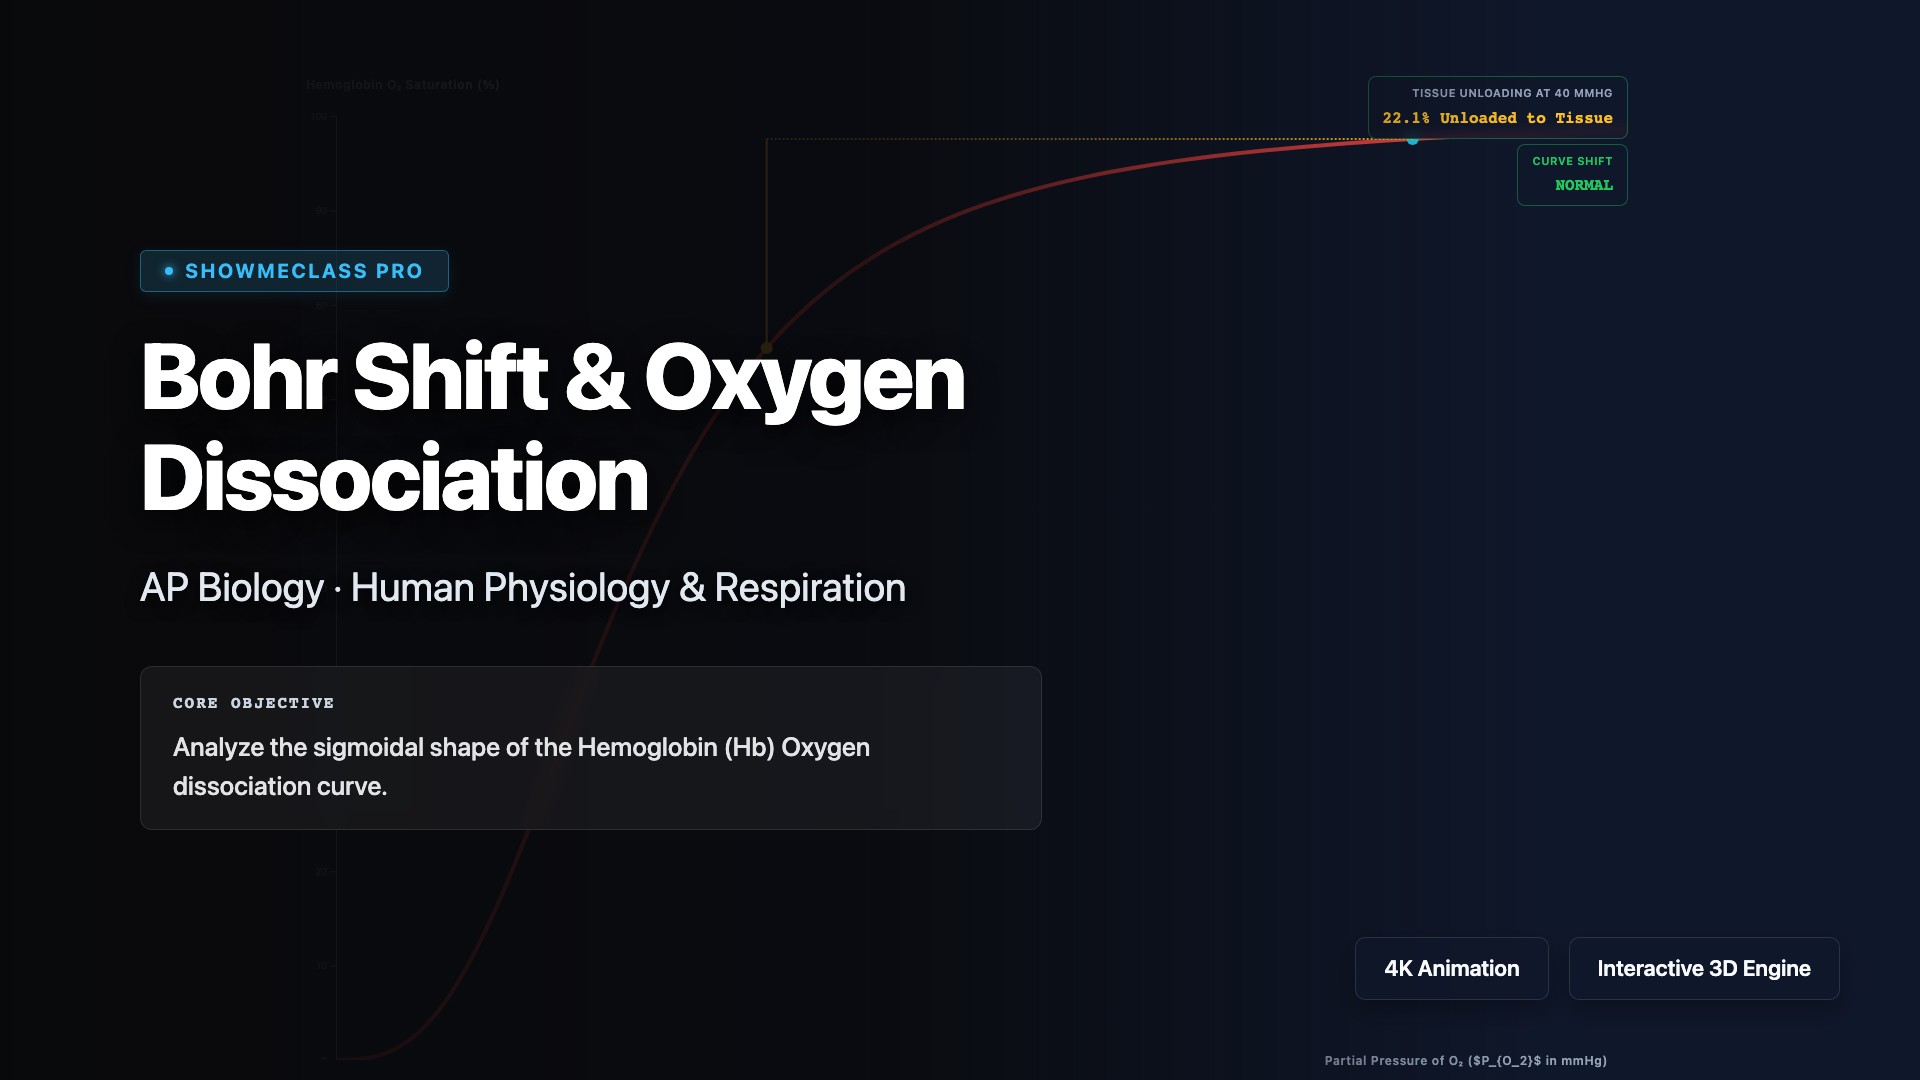
Bohr Shift & Hemoglobin Oxygen Dissociation
Chart the sigmoidal oxygen binding curve of hemoglobin. Discover how lower pH, higher $CO_2$, and elevated temperatures cause a Right Shift in active muscle tissues.
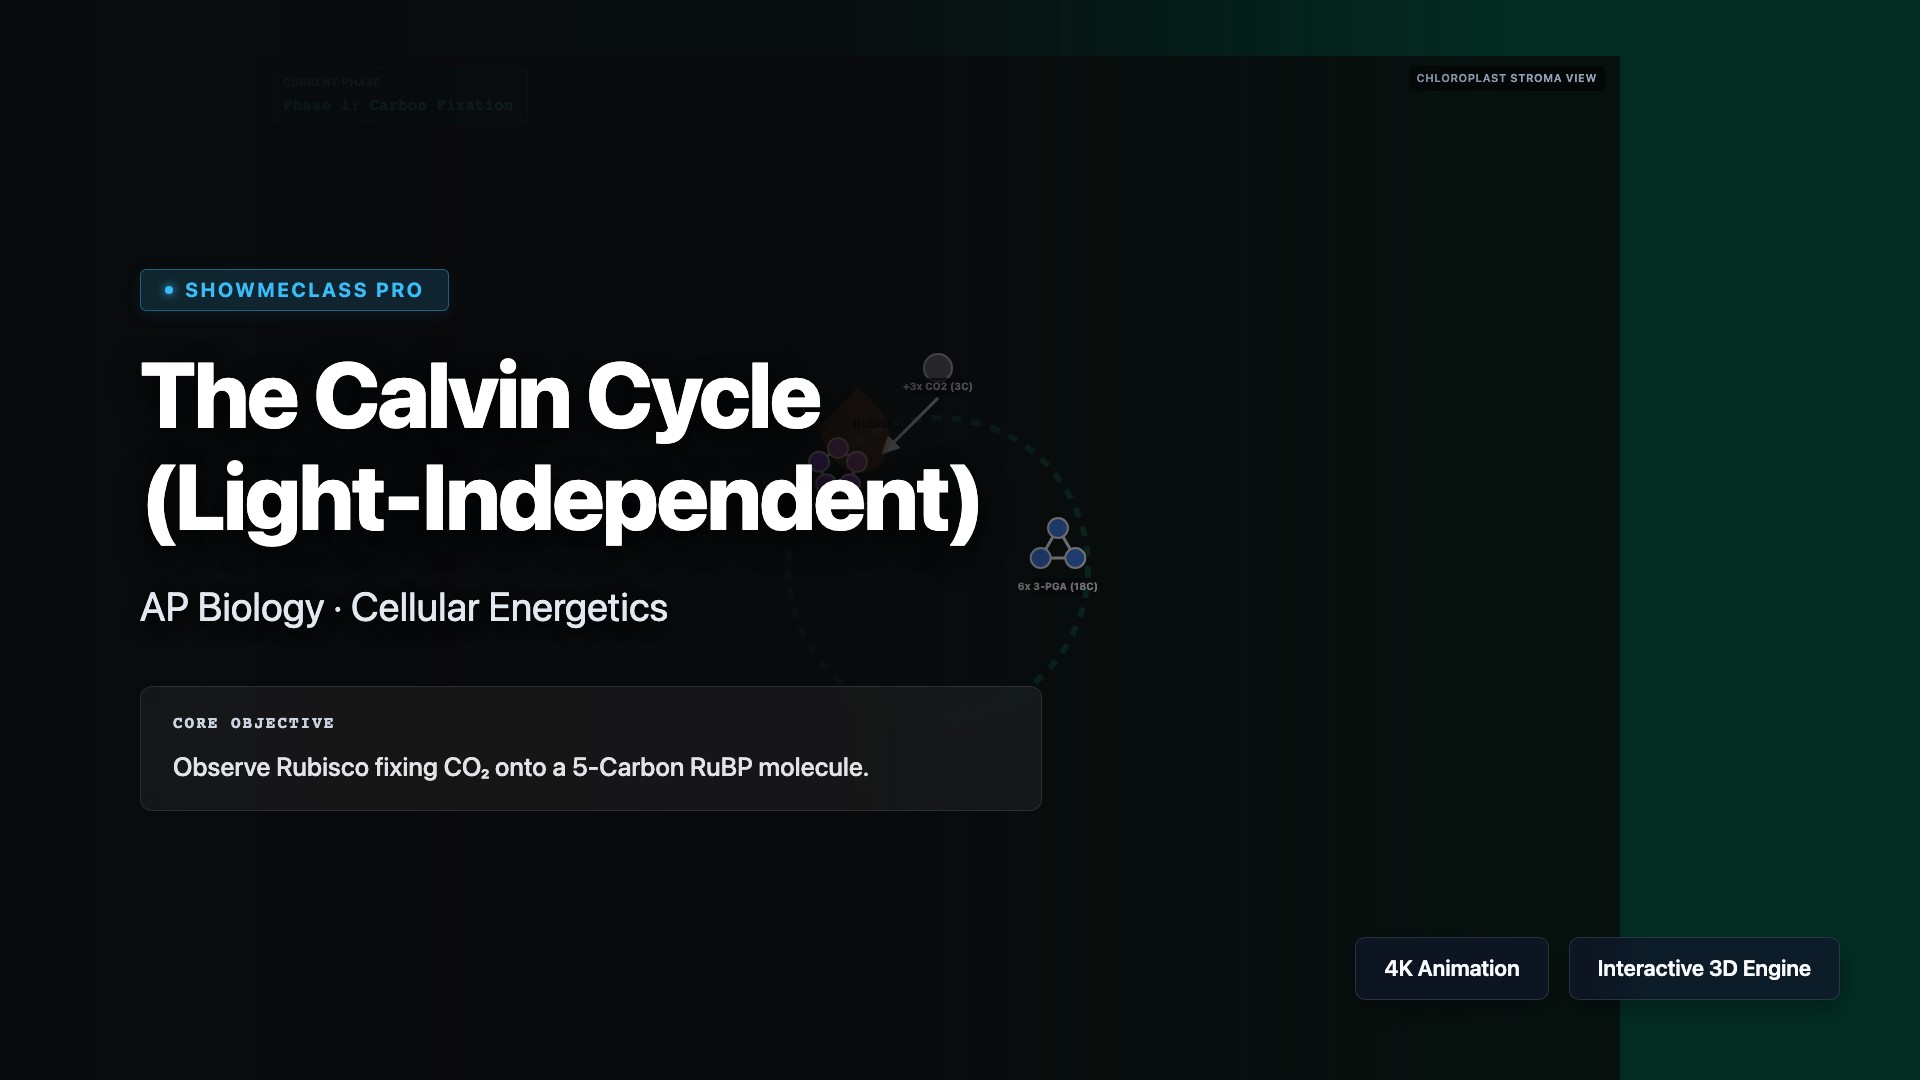
The Calvin Cycle
Track the fixation of Carbon Dioxide by Rubisco and the energy transfer from Light-Dependent ATP/NADPH to synthesize G3P.