Showing 12 results

Price Controls & Surplus Visualizer
Impose brutal government administrative limits on the Free Market. Slide Price Ceilings (Rent Control) and Price Floors (Minimum Wage) across the equilibrium to instantly graphically calculate the resulting Shortage/Surplus and Deadweight Loss.
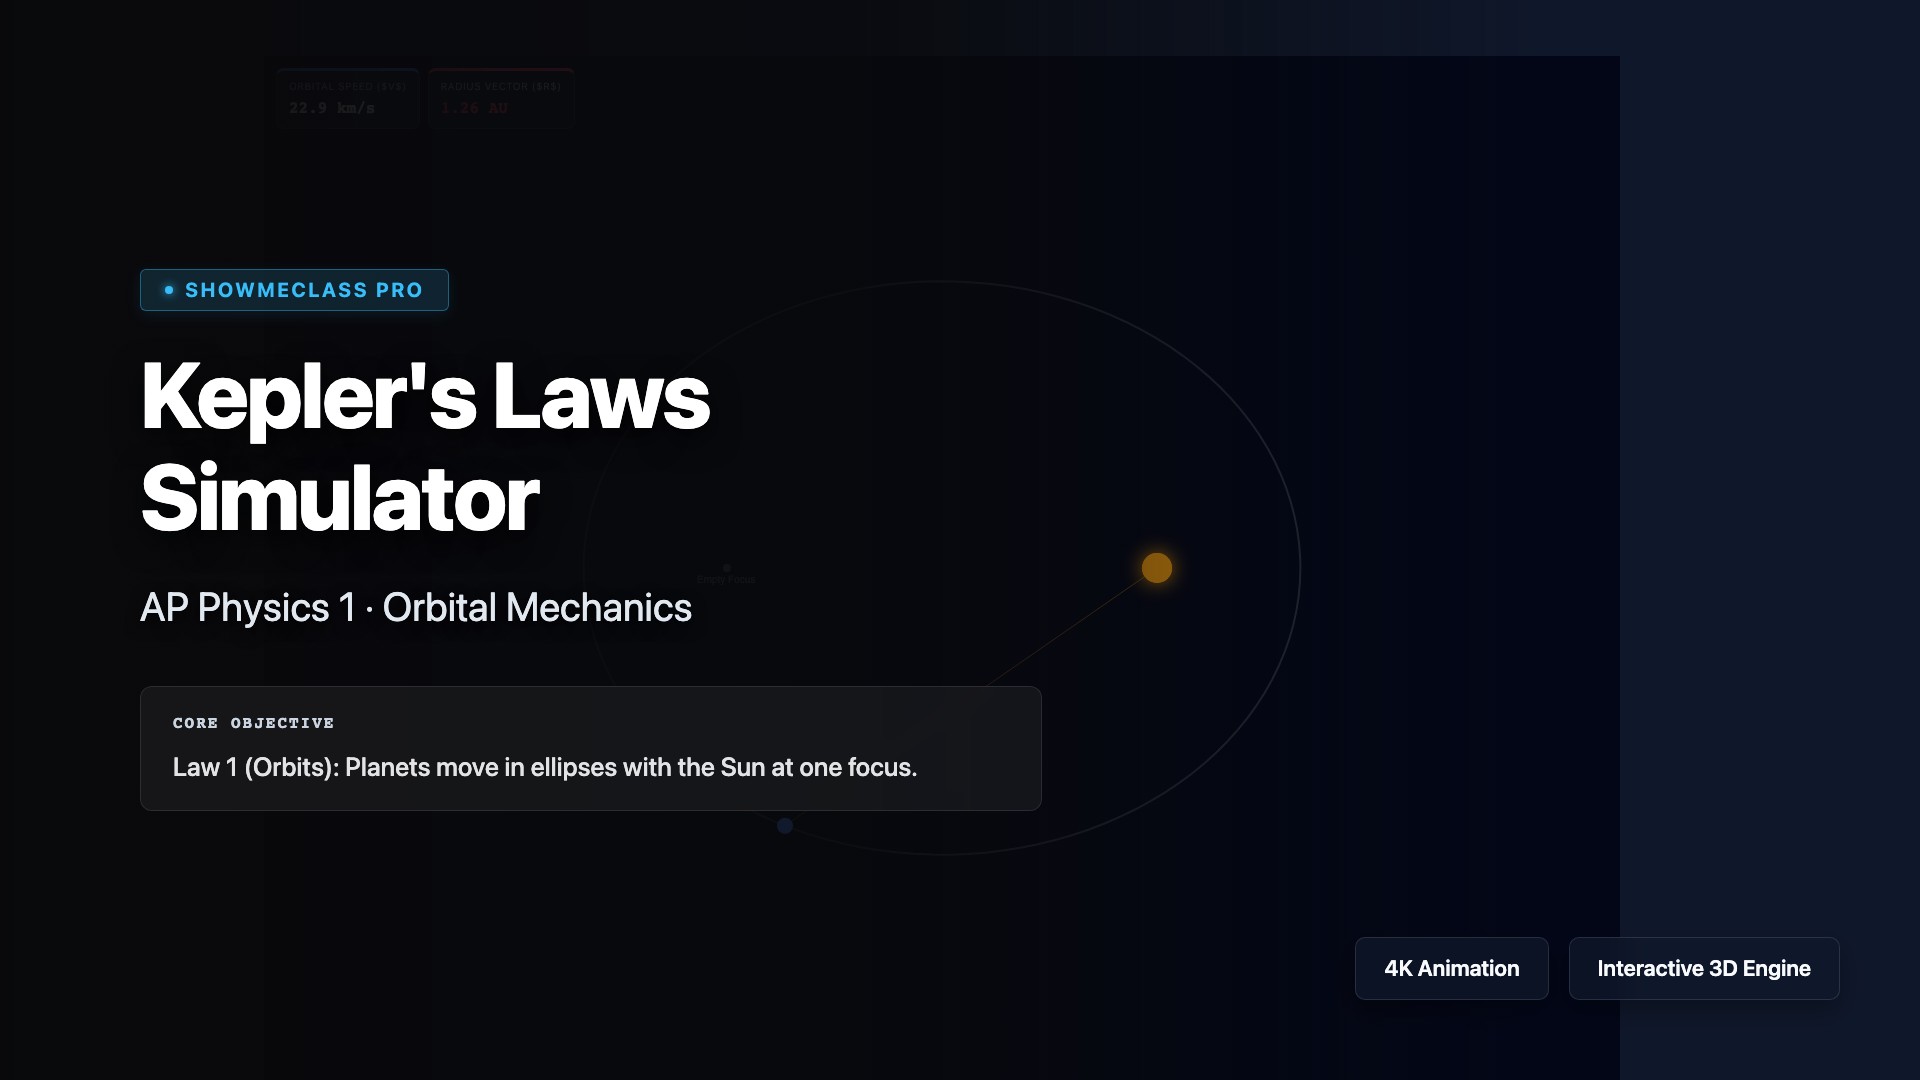
Kepler's Laws of Planetary Motion
Prove Kepler's Laws visually. Alter orbital eccentricity and watch as planets sweep out perfectly equal geometric areas in equal times, regardless of whether they are slingshotting past perihelion or crawling through aphelion.
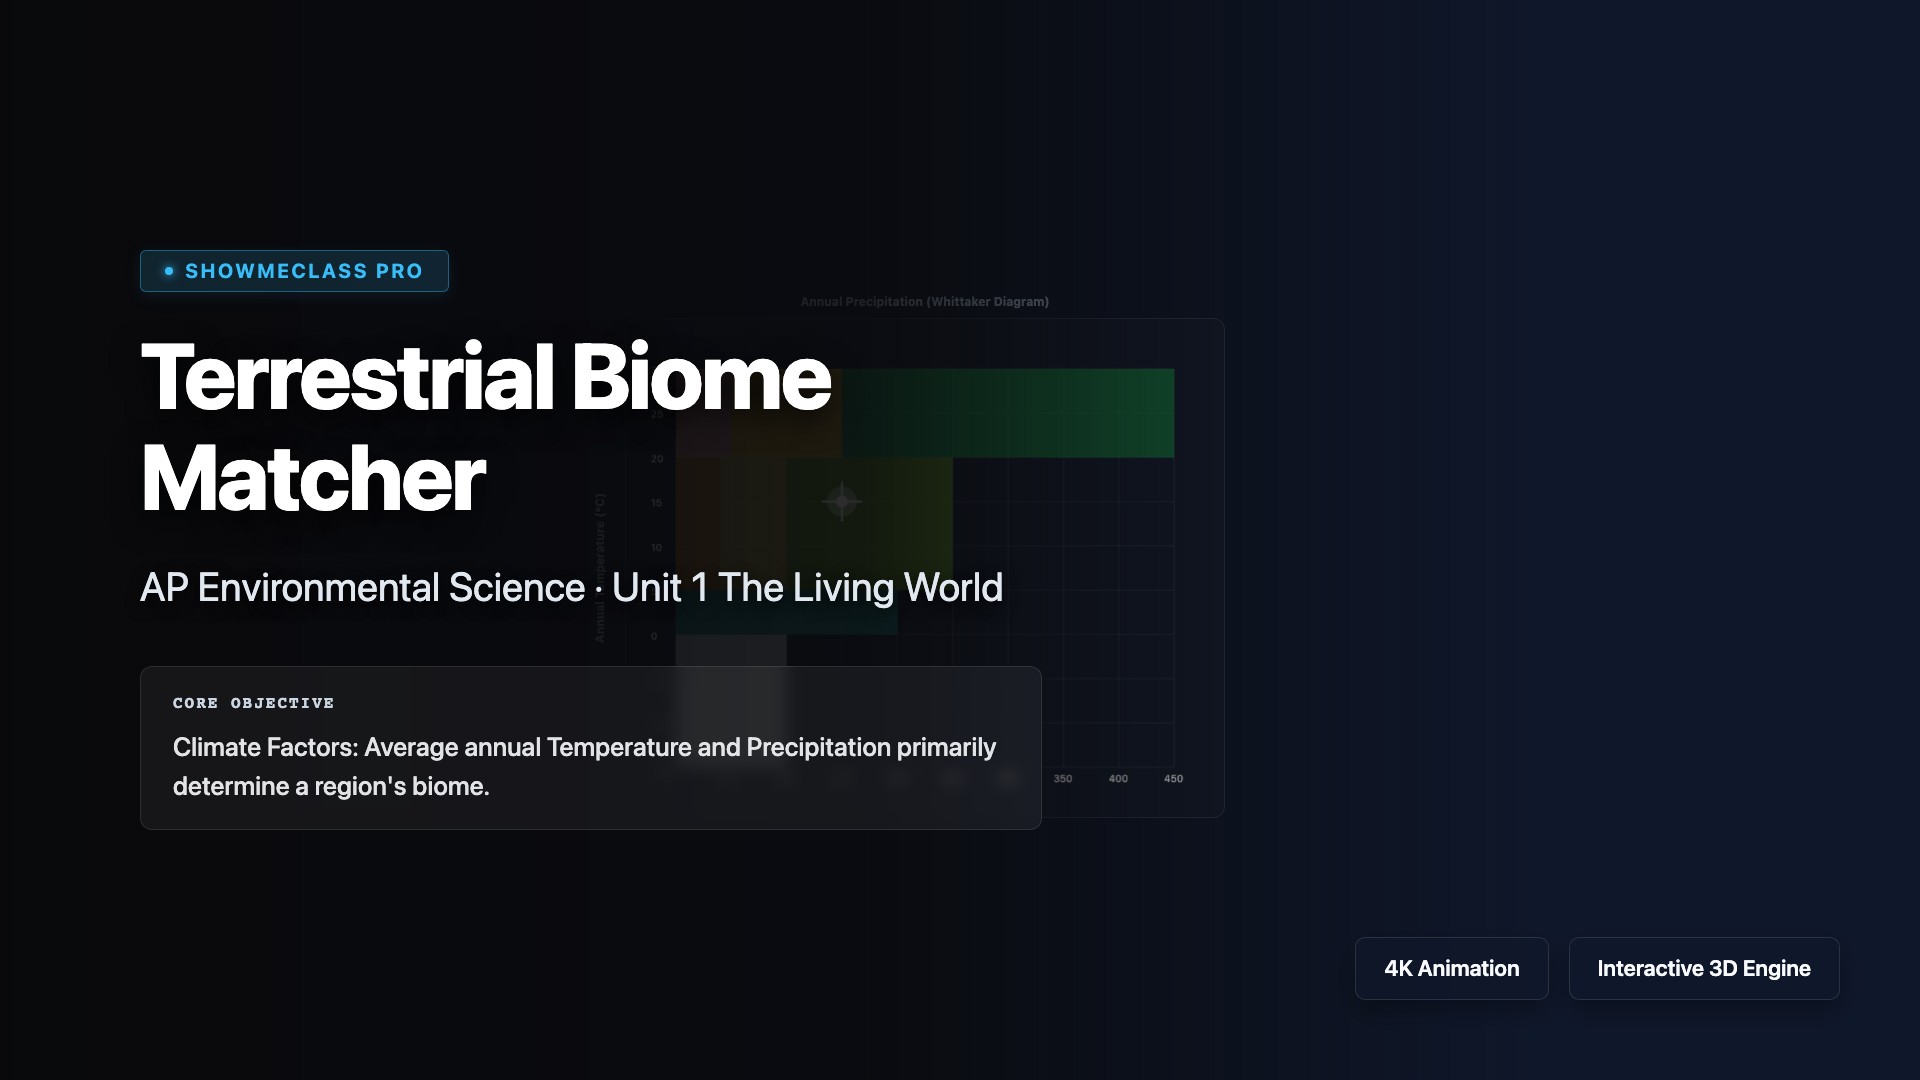
Terrestrial Biome Matcher
Interactive Whittaker Biome Plot mapping average annual temperature and precipitation to global terrestrial biomes, from Tundra to Tropical Rainforest.
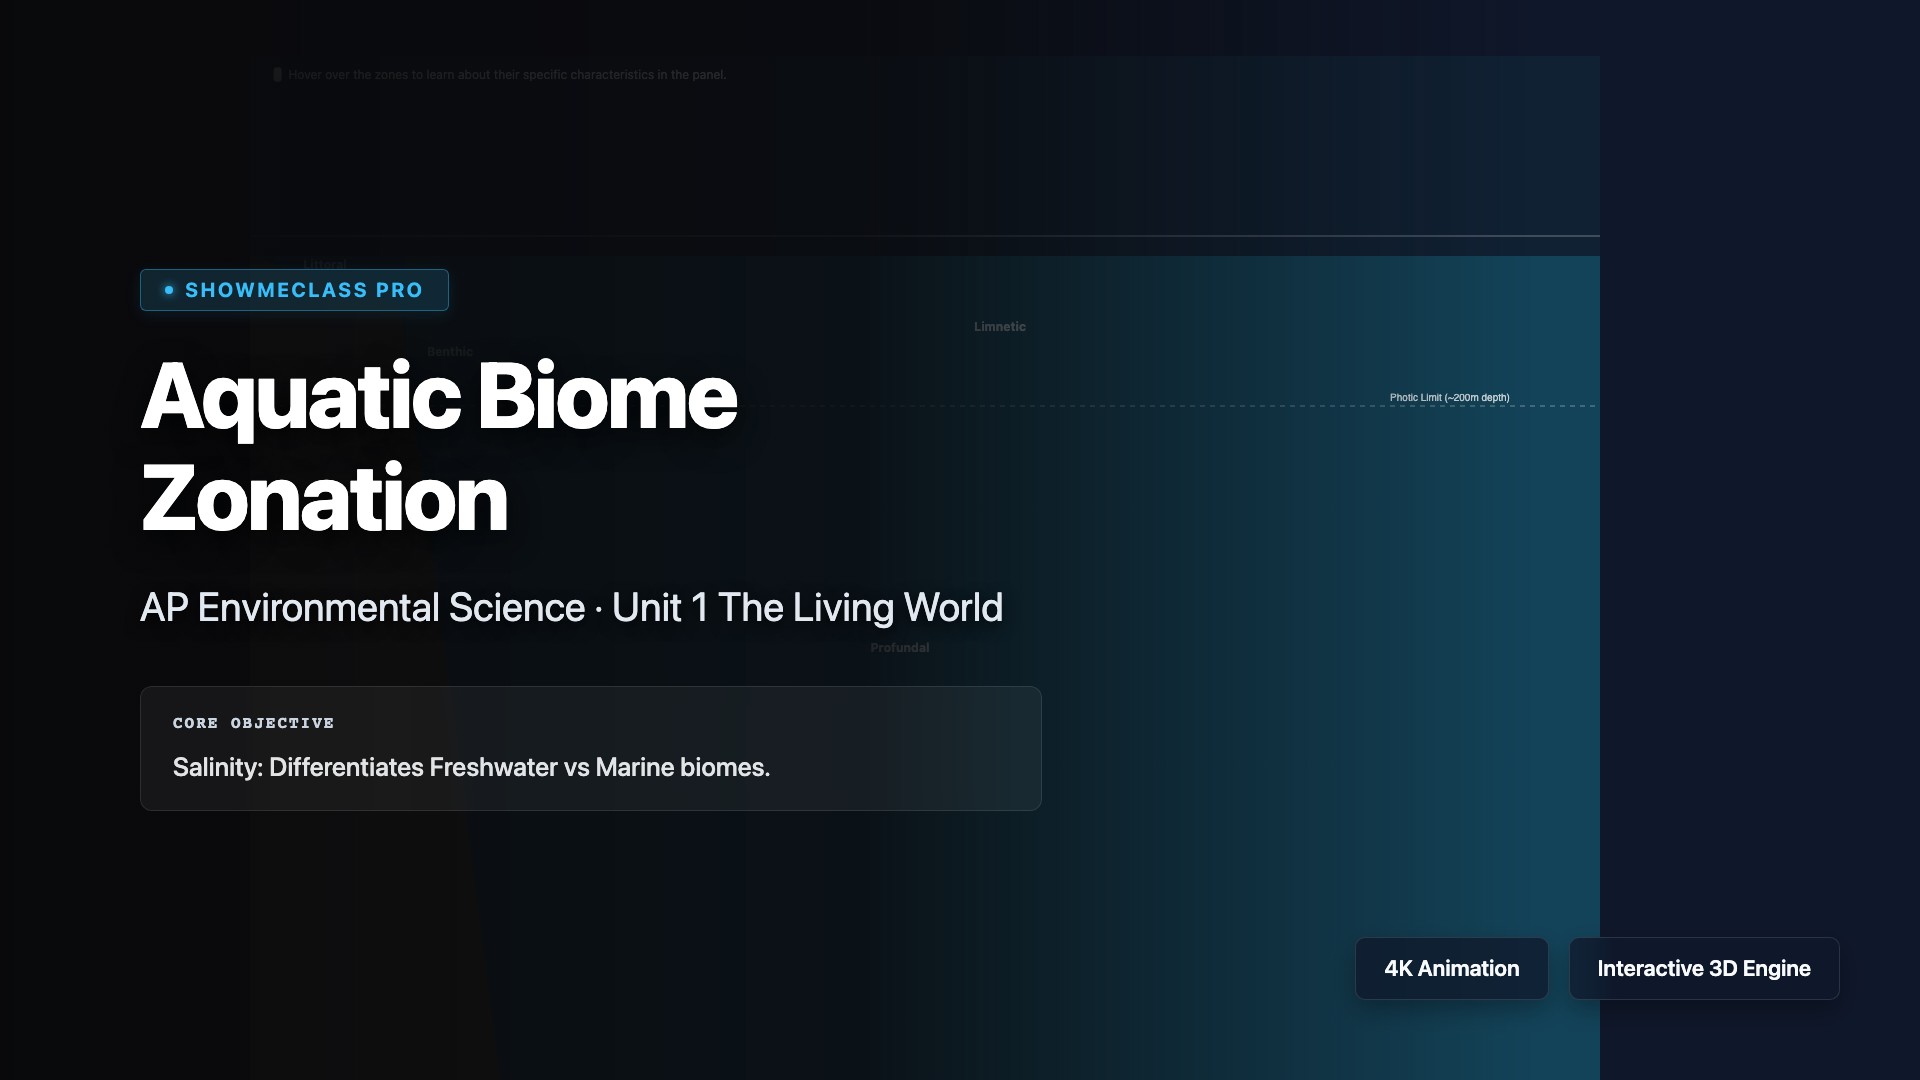
Aquatic Biome Zonation
Interactive diagram dividing Lakes and Oceans into standard ecological zones (Littoral, Limnetic, Benthic, Pelagic, Intertidal). Hover-based learning tool.

Nitrogen Cycle Interactive
Detailed APES Nitrogen Cycle interactive mapping the 5 chemical steps: Fixation, Nitrification, Assimilation, Ammonification, and Denitrification involving specific bacterial functions.
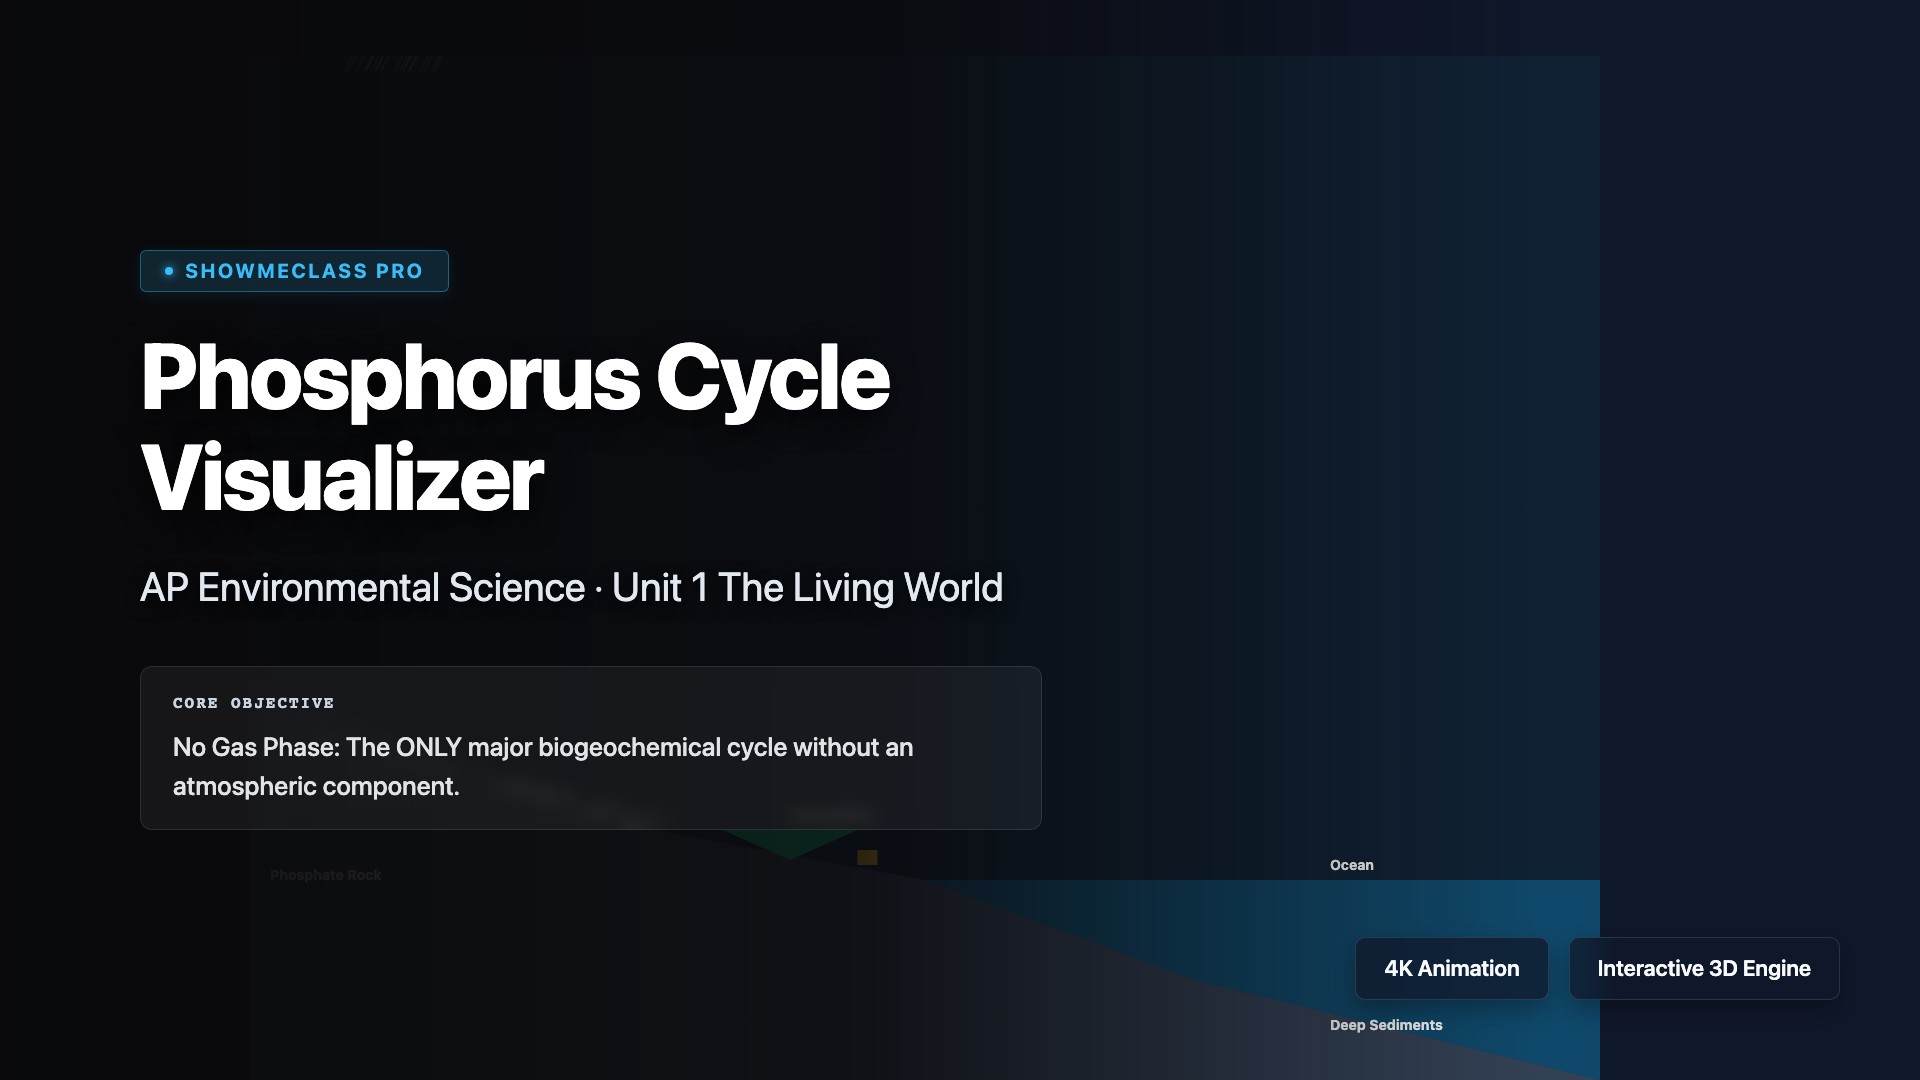
Phosphorus Cycle Visualizer
Phosphorus Cycle showing the absence of an atmospheric phase, slow rock weathering, biological assimilation into DNA/ATP, marine sedimentation, and long-term geologic uplift.
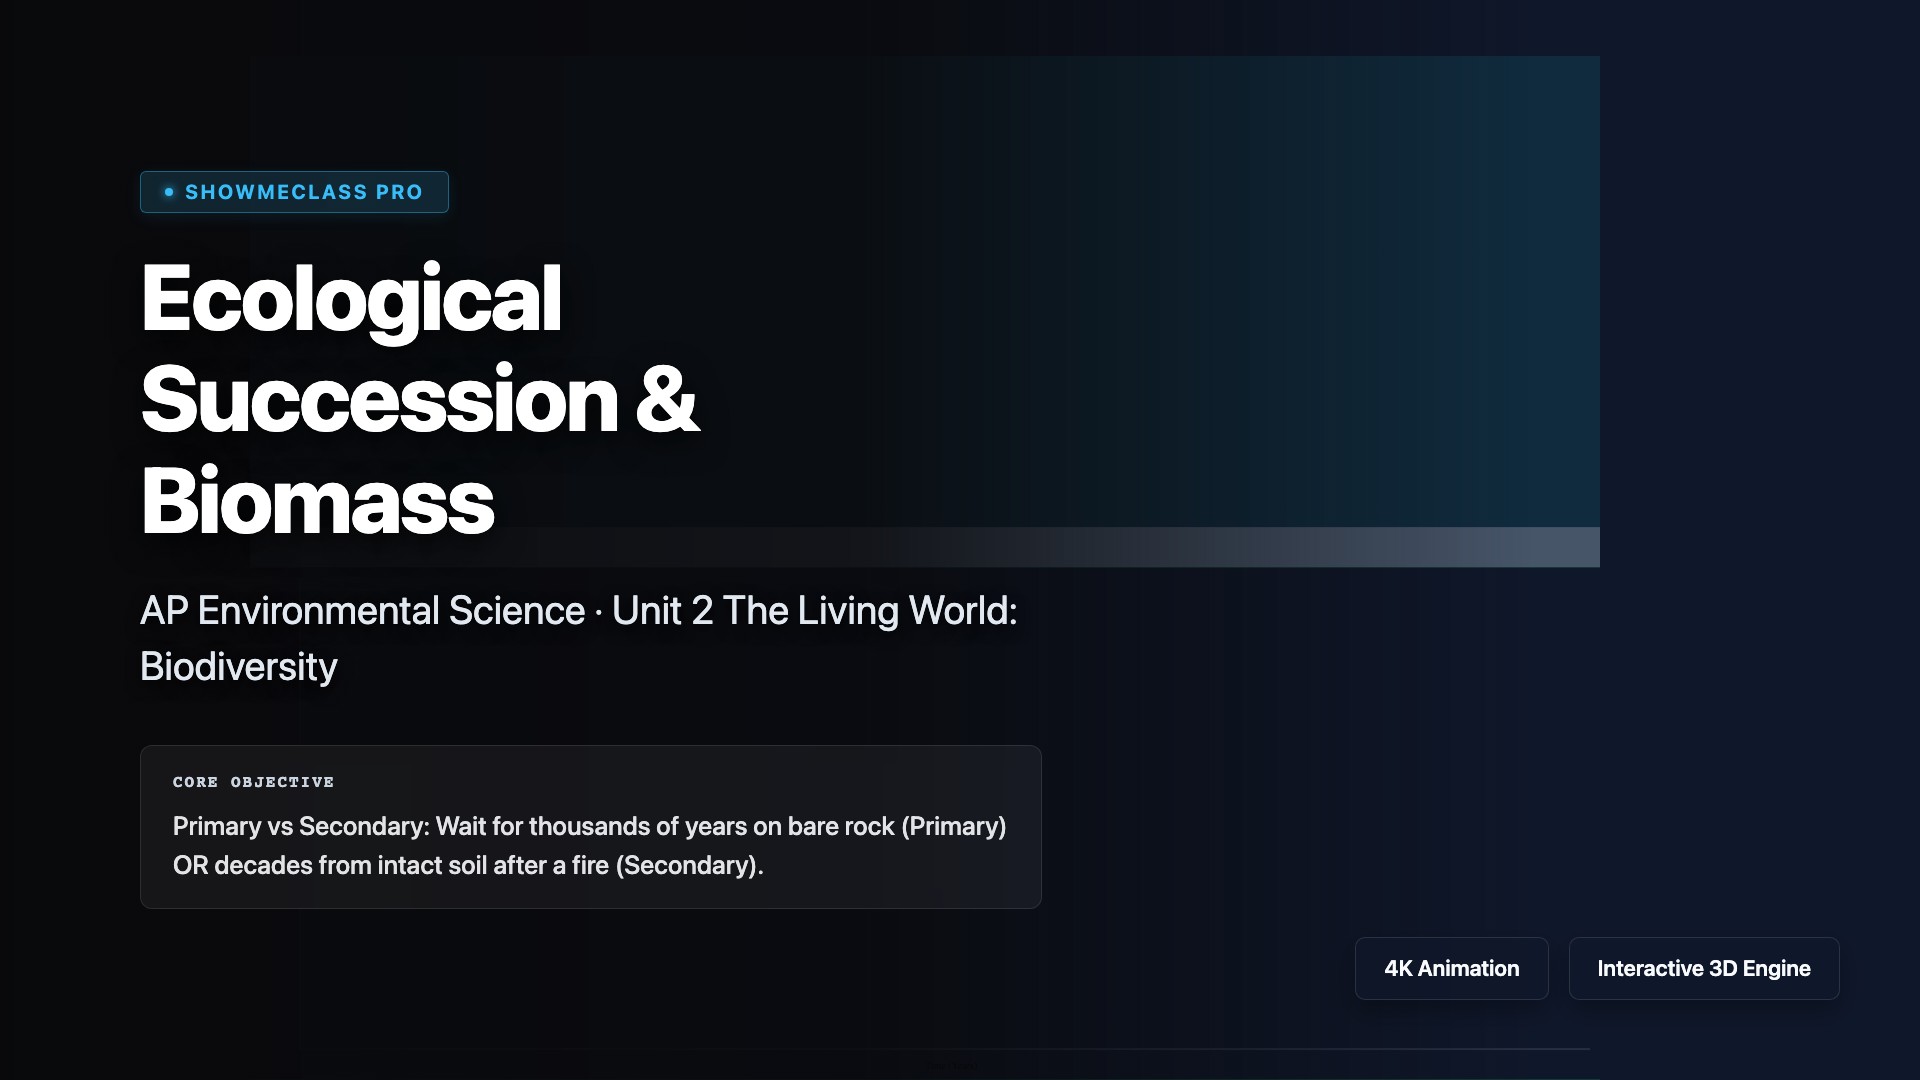
Ecological Succession Simulator
Ecological Succession simulation focused on APES concepts: comparing Biomass accumulation and Species Richness curves for Primary vs Secondary Succession over time.
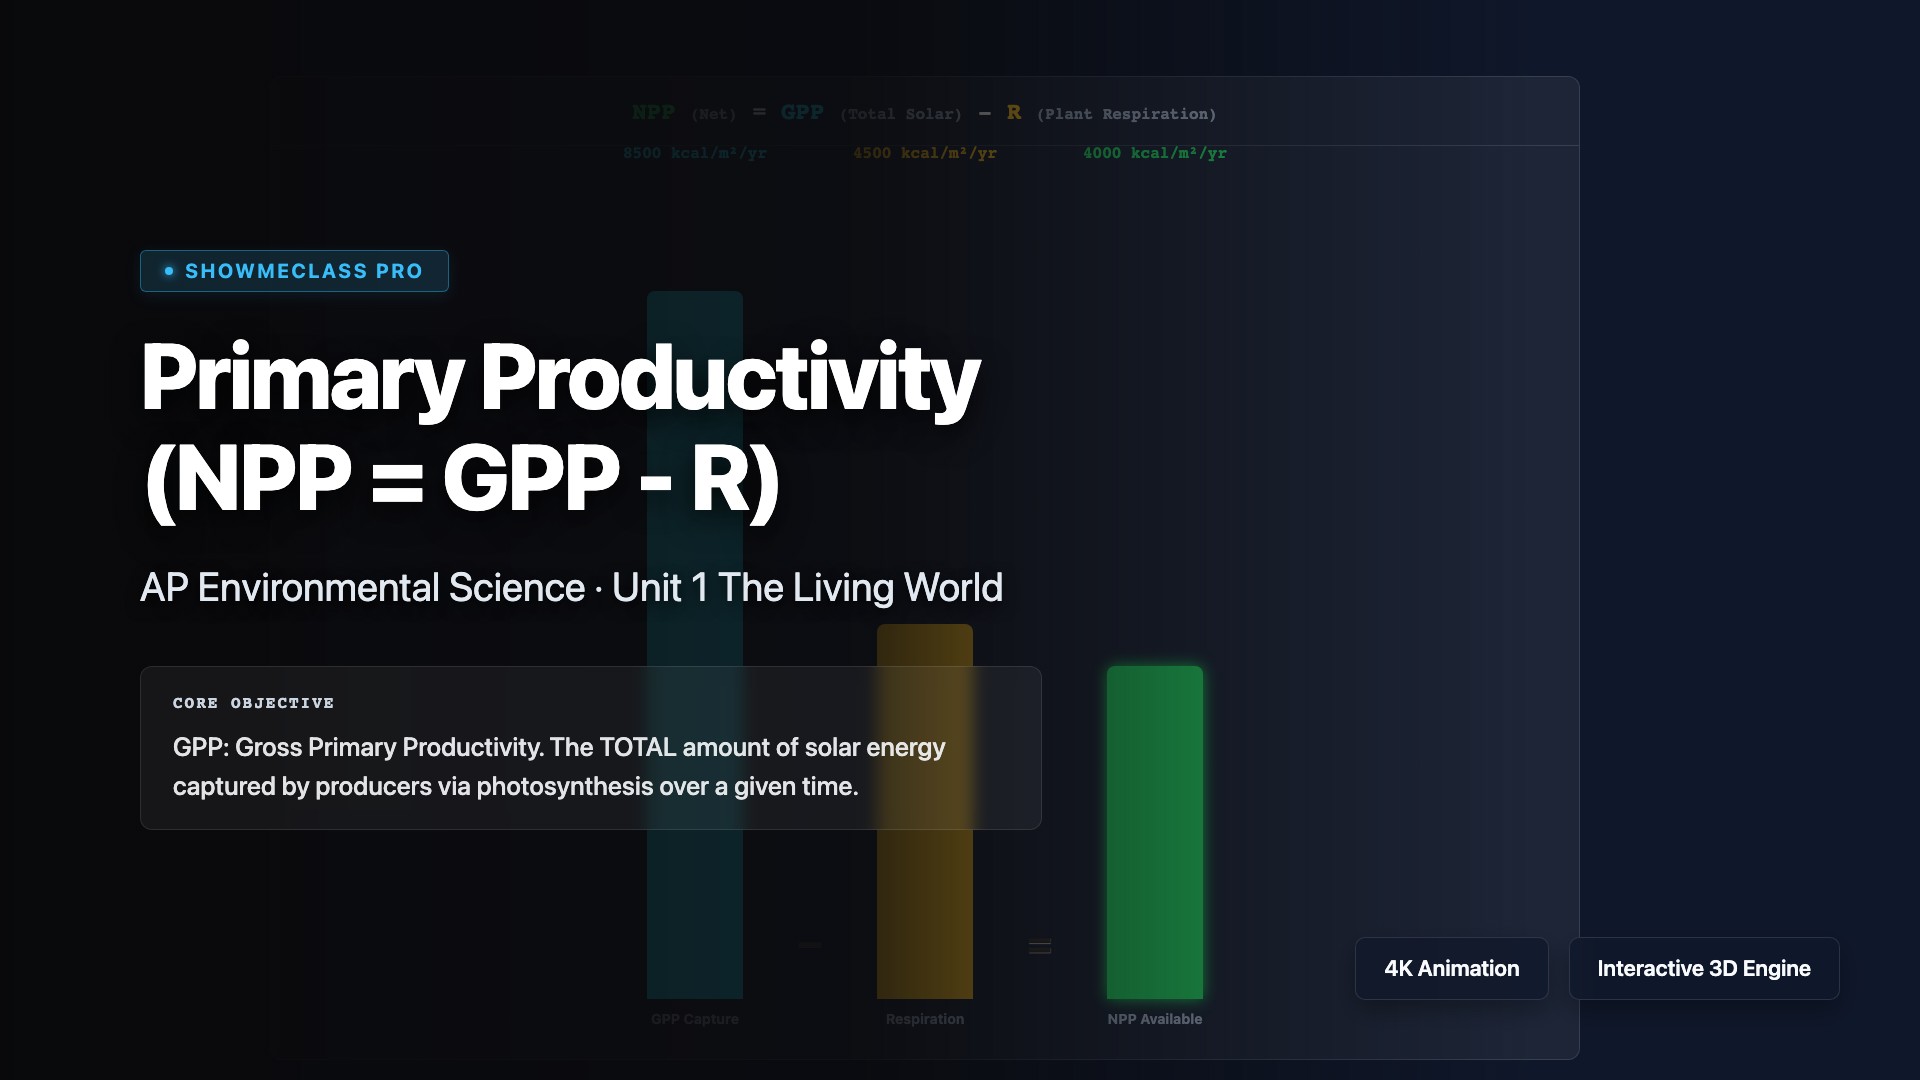
NPP & GPP Calculator
Tool to calculate and visualize Net Primary Productivity (NPP = GPP - Respiration). Explores the distinct productivity rates across various global biomes.
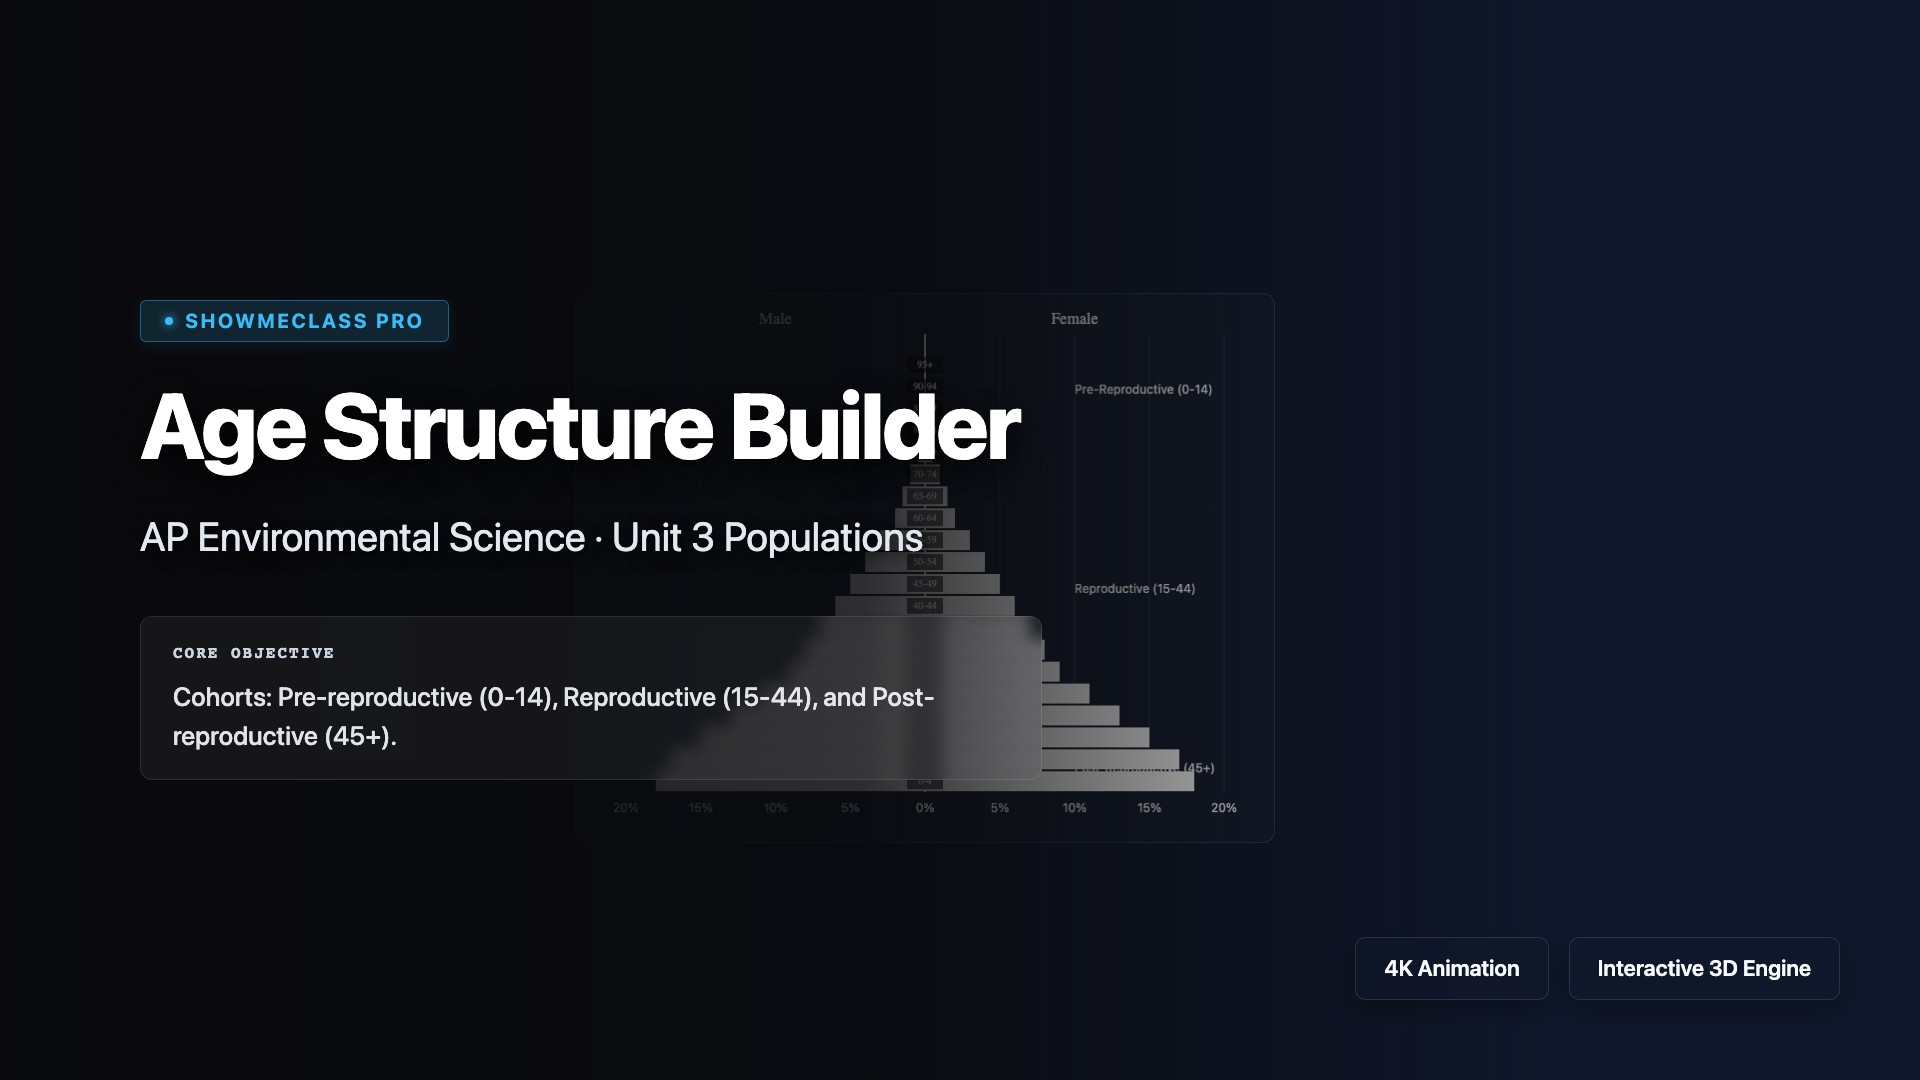
Age Structure Builder
Interactive Age Structure Pyramid Builder. Analyzes demographics, growth models (rapid, slow, stable, declining), and reproductive cohorts.

Carrying Capacity & Overshoot
Logistic population growth simulation modeling reproductive rate (r) lag, environmental carrying capacity limits (K), and severe resource overshoot dieback scenarios.
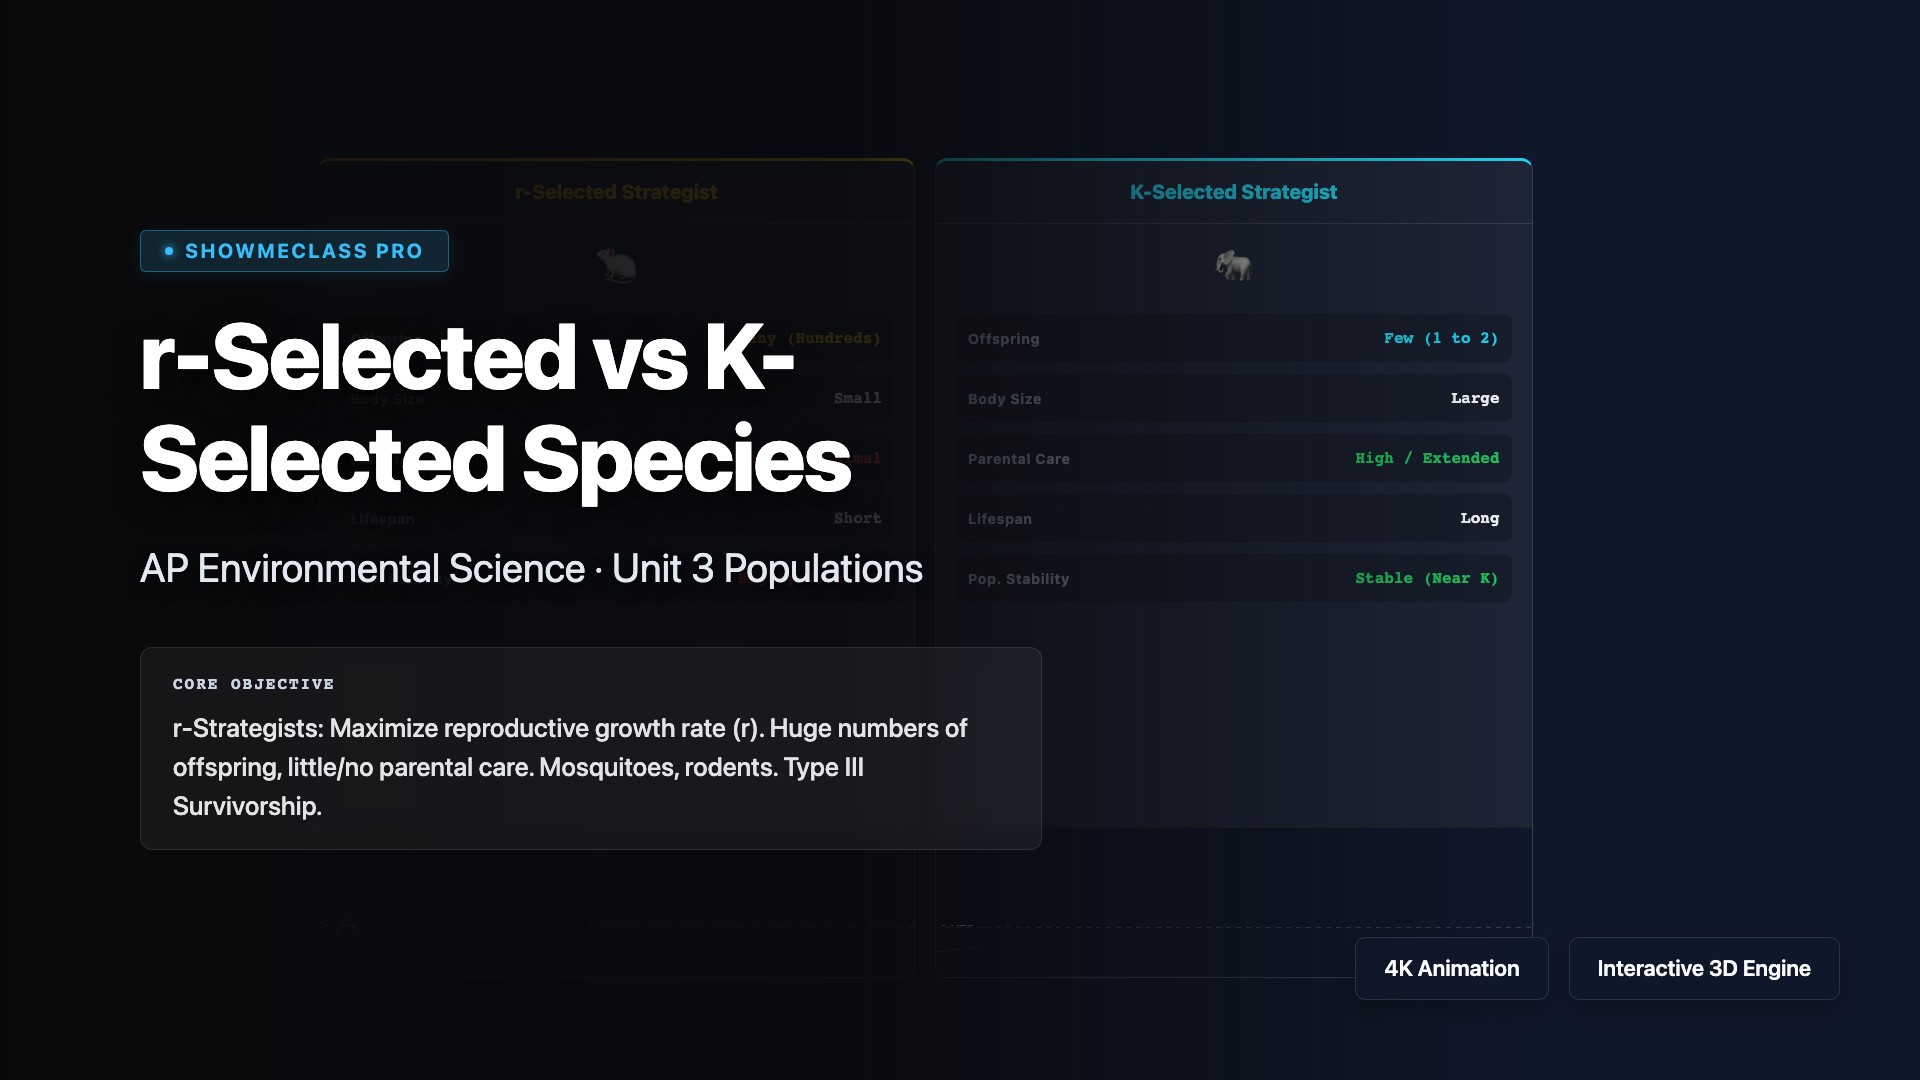
r/K Selection Dynamics
Comparison tool differentiating r-selected strategies (volatile booms, rapid reproductive rates) from K-selected strategies (stable carrying capacity, vulnerability to extinction).
Rock Cycle Explorer
The Rock Cycle (Igneous, Sedimentary, Metamorphic) simplified into an interactive, node-based dynamic loop governed by tectonic and surface processes.